
Abstract
Background
At present, the distinctness, uniformity, and stability (DUS) testing of flue-cured tobacco (Nicotiana tabacum L.) depends on field morphological identification, which is problematic in that it is labor intensive, time-consuming, and susceptible to environmental impacts. In order to improve the efficiency and accuracy of tobacco DUS testing, the development of a molecular marker-based method for genetic diversity identification is urgently needed.
Results
In total, 91 simple sequence repeats (SSR) markers with clear and polymorphic amplification bands were obtained with polymorphism information content, Nei index, and Shannon information index values of 0.3603, 0.4040, and 0.7228, respectively. Clustering analysis showed that the 33 study varieties, which are standard varieties for flue-cured tobacco DUS testing, could all be distinguished from one another. Further analysis showed that a minimum of 25 markers were required to identify the genetic diversity of these varieties. Following the principle of two markers per linkage group, 48 pairs of SSR markers were selected. Correlation analysis showed that the genetic relationships revealed by the 48 SSR markers were consistent with those found using the 91 SSR markers.
Conclusions
The genetic fingerprints of the 33 standard varieties of flue-cured tobacco were constructed using 48 SSR markers, and an SSR marker-based identification technique for new tobacco varieties was developed. This study provides a reliable technological approach for determining the novelty of new tobacco varieties and offers a solid technical basis for the accreditation and protection of new tobacco varieties.
Background
New plant varieties are needed to increase agricultural production and efficiency. The protection of intellectual property rights for new plant varieties is a well-established practice and is also a symbol of progress in human civilizations [1]. The protection of new plant varieties cannot be realized without the support of a series of technical conditions. Distinctness, uniformity, and stability (DUS) are three technical and scientific criteria for the protection of new plant varieties [2, 3]. In 1999, China officially joined the Convention on the Protection of New Plant Varieties and became a member of the International Union for the Protection of New Varieties of Plants (UPOV). Using the UPOV DUS testing guidelines as an example, China developed a series of crop DUS testing guidelines and promoted the use of these guidelines in the protection of new plant varieties [3]. In 2002, the UPOV released the first DUS testing guidelines for tobacco (Nicotiana tabacum L.) [4]. Thereafter, China developed and released the first domestic tobacco DUS testing standard, the Guidelines for the Conduct of Tests for Distinctness, Uniformity, Stability – Flue-Cured Tobacco (Nicotiana tabacum L.; YC/T 369–2010) [5], which was based on the General Directives for the Conduct of Tests of Distinctness, Uniformity, Stability for New Varieties of Plants (GB/T 19557.1–2004) [6] and the tobacco testing guidelines of the UPOV [4].
DUS testing is a complex technical process [2, 7]. Currently, the domestic and foreign DUS testing standards for new plant varieties are mainly based on field measurements of biological, agronomic, quality, and resistance traits. For example, the Chinese DUS testing guidelines for flue-cured tobacco include 35 basic measurement traits, of which 16 traits must be mandatorily measured [5]. Of all the measured characteristics, differences with regard to either one quality character or two quantity characters among the candidate and approximate varieties are used to judge the distinctness. To assess the uniformity of a population, a standard of 1% with an acceptance probability of at least 95% should be applied. To assess the stability of a candidate variety, at least two planting seasons should be evaluated [4, 5].
Given that DUS testing is based on the apparent morphological characteristics of the study plants, the results and comparative analysis of candidate, standard, and approximate varieties will be influenced by environmental factors [8]. In addition, different testers may subjectively perceive traits differently, leading to inconsistencies in the evaluation of certain traits [9]. Moreover, the substantial workload involved further increases the likelihood of human error in DUS testing. The application of molecular marker-based technologies for the identification of plant varieties has several advantages over traditional DUS testing methods, including rapid processing times, an immunity to the influence of environmental factors, and easy automation [10]. Therefore, molecular marker-based methods represent an emerging trend in rapid DUS testing [2, 7, 11,12,13]. Of the numerous molecular marker technologies available, simple sequence repeats (SSR) analysis is considered ideal for the DUS testing of new varieties [8, 14,15,16,17,18] and the fingerprinting of standard crop varieties [10,11,12] due to multiple associated advantages, such as the abundance, high polymorphism, and co-dominance of SSR markers [19, 20] and the stability, repeatability, and simple operational procedures involved in SSR analysis [10, 21, 22].
In the present study, we addressed the lack of molecular marker-based technologies for estimating the distinctness, uniformity, and stability of flue-cured tobacco varieties by carrying out a population genetics study and constructing SSR fingerprints of 33 standard flue-cured tobacco varieties that are commonly used in DUS testing [5]. Thus, we developed an identification method to distinguish tobacco varieties that provides a technological basis for the identification and protection of new flue-cured tobacco varieties.
Results
Genetic diversity analysis
The amplification of 270 SSR marker candidates led to the selection of 91 pairs of polymorphic SSR loci with clear amplified bands (Additional file 1: Table S1). The examination of these 91 SSR loci in the 33 standard varieties revealed 304 alleles (2–6 alleles per locus) and an average of 3.34 alleles per locus. These alleles included 67 rare alleles with allele frequencies ≤0.05. The SSR loci with 4 or 5 alleles also had the highest number of rare alleles, 28 and 22 rare alleles, respectively. These rare alleles accounted for 75% of the total number of rare alleles. No rare alleles were detected in loci with 2 alleles. The polymorphic information content (PIC), Nei index (H), and Shannon information index (I) values of the 91 SSR pairs were 0.3603, 0.4040, and 0.7228, respectively. A boxplot of the PIC values by allele number revealed that the polymorphism of a given locus increased with the number of alleles (Fig. 1). Cluster analysis showed that the average genetic similarity between varieties was 0.5640 ± 0.1744. According to the unweighted pair group method with arithmetic mean (UPGMA) clustering tree, the 33 standard varieties can be fully distinguished from one another using 91 pairs of SSR markers (Fig. 2).

Number and PIC of SSRs with different allele numbers. The primary axis is the number of SSRs, represented by the histogram in the diagram, and the secondary axis shows the PIC values, represented by the boxes
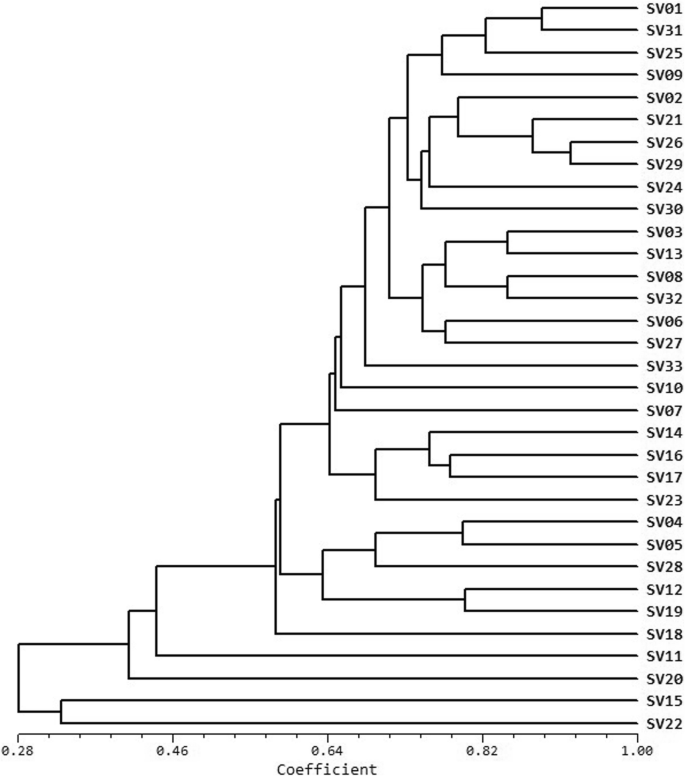
UPGMA clustering tree of the 33 flue-cured tobacco varieties, all of which could be fully distinguished from one another
Evaluation of the minimum number of primers required for genetic diversity analysis
To evaluate the minimum number of primers required for genetic diversity analysis, we analyzed how the measured genetic diversity varied with the number of primers. From 1 marker to 90 markers, the random sampling test of each marker number was repeated 50 times, and the average PIC values of each marker number were calculated. A scatter plot of the results revealed that PIC values gradually tend towards the average PIC value as the number of markers increases (Fig. 3). Thus, using more markers decreases the coefficient of variation (CV) between repeats, as the histogram at the bottom of Fig. 3 shows. By calculating the CV trend line, we found that using more than 25 markers resulted in a CV < 5.0%, indicating that the PIC values were stable. Therefore, a subset of 25 markers (out of the 91 markers tested in this study) is sufficient to reveal the genetic diversity of a population.

The PIC value and the CV of the sampling experiments for different SSR marker numbers. The x-axis shows the number of SSR markers. The primary y-axis (left) shows the CV of the PIC value, which is plotted as a histogram. The secondary y-axis (right) shows the PIC value of each sample, which is plotted as a scatter plot. As the number of markers increases, the points in the scatter plot (representing the PIC values) tended towards the mean PIC value, and the CV between samples became smaller
The use of SSR marker genotyping to construct the genetic fingerprints of the studied varieties
Following the principle of using two markers for each linkage group, we selected 48 pairs of SSR markers from the 91 markers tested to be used for the construction of the genetic fingerprints of the standard flue-cured tobacco varieties commonly used in DUS testing. The PIC, H, and I values of the 48 markers were 0.3736, 0.4223, and 0.7534, respectively. Using the 48 pairs not only met the requirements for the minimum number of primers but were also sufficient to fully distinguish the 33 varieties from one another. Furthermore, we calculated and plotted genetic similarity matrix to compare the differences in the genetic relationships revealed by the 48 and 91 markers selected. The points in the scatter plot are arranged along a diagonal line with significant linearity, all within the 95% confidence interval of the linear fit. Subsequent correlation analysis revealed a significant correlation between the genetic relationships determined by the two sets of markers, with a Pearson correlation coefficient of 0.967 (Fig. 4).
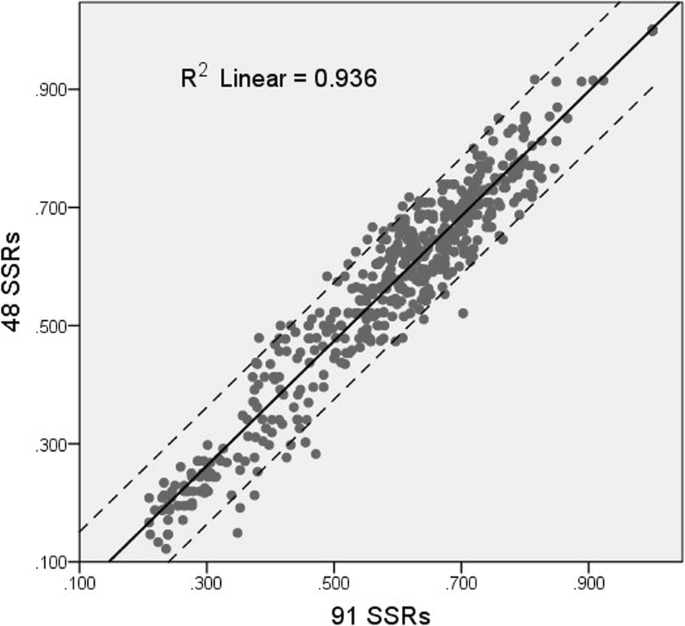
The genetic similarity matrices of the 48 and 91 SSR markers were calculated and their correlation is displayed as a scatter plot. The dotted range shows the 95% confidence intervals. The genetic relationships revealed by the two sets of markers were significantly correlated
Construction of SSR genetic fingerprints of the 33 standard varieties
The genetic fingerprints of the 33 standard varieties were constructed using 48 pairs of SSR markers and produced the banding patterns shown in Fig. 5a-b. The fingerprints contained 162 alleles with allele frequencies that ranged from 0.0303 to 0.9394 and an average allele frequency of 0.2963 ± 0.2897. There were 39 rare alleles with allele frequencies ≤0.05. Eleven of the varieties carried a rare allele, the varieties SV15, SV22, SV11, and SV20 contained 15, 7, 6, and 4 rare alleles, respectively. The number of differentiated loci among the tested varieties ranged from 4 to 40, with an average of 20.15 ± 7.716. Figure 5c shows that SV22, SV15, and SV20 have more differentiated loci than the other varieties, indicating that they are exceptionally different.

a The electrophoretic photo of SSR marker PT50136 (The original electrophoretic image is shown on the right side of Additional file 2: Figure S1). b The fingerprint band pattern of the 33 standard varieties constructed using 48 pairs of SSR markers. The band pattern is arranged alternately in blue and orange to distinguish markers, and each column represents a variety. c The triangular matrix of differentiated locus number among the studied varieties
Core SSR markers for molecular DUS testing of flue-cured tobacco
The 48 SSR pairs revealed that there were at least four differentiated loci among all varieties. Therefore, this set of markers can be used for molecular DUS testing of new varieties of flue-cured tobacco. As such, we screened reference varieties for each allele according to the PCR band pattern. We selected 16 varieties to be used as reference varieties: SV02, SV03, SV04, SV08, SV10, SV11, SV12, SV14, SV15, SV18, SV19, SV20, SV22, SV23, SV30, and SV32. These 16 varieties each had typical and clear amplified bands for a specific allele. In DUS testing that employs the 48 pairs of SSR markers, these varieties can be added as a reference to evaluate the banding patterns of candidate varieties according to the results presented in Table 1.
Discussion
In this study, we used a population of standard flue-cured tobacco varieties that are commonly used in DUS testing and amplified and evaluated marker loci that were selected from a high-density SSR genetic linkage map for tobacco. Analysis of the genetic diversity of these varieties revealed that PIC, H, and I values were 0.3603, 0.4040, and 0.7228, respectively. These values are higher than those presented in studies by Fan et al. (PIC = 0.299) [23], Zheng et al. (I = 0.6567) [24], and Dai et al. (PIC = 0.343) [25], which were based on the same genetic map. However, our results were slightly lower than those of Fricano et al. [26] and Xu et al. [27], which is probably because the populations evaluated by Fricano et al. [26] and Xu et al. [27] not only included flue-cured tobacco but also numerous other varieties. Overall, the DUS testing standard varieties are representative of the phenotypic and genetic variation in flue-cured tobacco. Therefore, these varieties can be used for genetic studies and to construct a technical system for the identification of flue-cured tobacco varieties.
A reasonable evaluation of the genetic diversity of a population requires sufficient genetic markers [28, 29].The studies of minimum number of primers were carried out in different species, such as wheat (Triticum aestivum L.) [30], soybean [Glycine max (L.) Merr.] [31], wild rice (Oryza rufipogon Griff.) [32], and rice (Oryza sativa L.) [33, 34]. Although our aim was to reveal the genetic differences among tobacco varieties, we also tried to reduce the number of markers needed in order to keep costs low and improve the detection efficiency. We found that the varieties evaluated in this study can be fully distinguished from one another using 91 pairs of SSR markers, and the genetic diversity of the varieties was similar to or slightly higher than that of other studies. We then tried to reduce the number of primers through repeated random subsampling and a comparison of genetic diversity coefficients. The simulation showed that a subset of only 25 pairs of SSR markers was necessary to study the genetic diversity of flue-cured tobacco. Tobacco is an allotetraploid that contains 24 pairs of chromosomes [35]. To guarantee an equal number of primers for each chromosome, 48 pairs of SSR markers were selected. In other words, each chromosome contained two pairs of SSR markers. We then analyzed the potential correlations between the intervarietal genetic relationships revealed by the 48 SSR marker pairs in addition to those that were revealed by the original 91 SSR marker pairs. The genetic relationships revealed by the two SSR marker sets were consistent with each other, which further justified the use of only 48 pairs of SSR markers. This is close to the minimum number of SSR markers for rice, which varies from 50 to 70 [33]. Rice and wild rice in particular present significantly higher genetic diversity than tobacco, further indicating that 48 pairs of SSR markers are sufficient to study the genetic diversity of tobacco varieties.
In this study, the genetic fingerprint of standard flue-cured tobacco varieties was constructed by using 48 pairs of SSR markers. As such, the 48 SSRs are core markers that can be applied to molecular-based DUS testing of flue-cured tobacco varieties. From YC/T 369–2010 [5], the 33 varieties evaluated in this study were distinct and presented a minimum difference of 4 SSR markers. Therefore, when using the aforementioned 48 SSR markers to evaluate the distinctness of candidate varieties, the number of distinct markers among the candidate and control varieties must be either 4 or more; otherwise, the candidate and control varieties are similar and field phenotypic identification should be performed according to YC /T 369–2010 [5] or TG/195/1 [4]. Thus, field experiments are only needed for similar varieties, which will greatly improve the efficiency of DUS testing.
Currently, single nucleotide polymorphism (SNP) markers have become an attractive alternative to SSR markers given the progress in genomic research and high-throughput sequencing [36, 37]. Although the diversity level of single locus is lower than that of SSR marker, and more loci are required to equal SSR detection effect, as dimorphic markers, SNPs can provide objective and readily distinguishable results that are well suited for DUS testing. Research on crop variety identification using SNPs has already been conducted [38,39,40,41,42]. Next, we intend to resequence the 33 varieties used in this study to find stable and reliable SNP loci and to explore SNP-based tobacco DUS testing.
Conclusion
We used 48 SSR markers to generate the genetic fingerprints of standard flue-cured tobacco varieties commonly used in DUS testing. The 48 SSRs were considered to be core SSR markers that can be used for future flue-cured tobacco DUS testing. Molecular-based SSR DUS testing will improve the detection efficiency of traditional DUS testing methods while reducing costs. This method is also crucial for guaranteeing objectivity, fairness, and accuracy with regard to the verification of new varieties.
Methods
Plant materials
The 33 standard flue-cured tobacco varieties (Table 2) commonly used in DUS testing were provided by the National Crop Germplasm Resources Infrastructure (NCGRI; Tobacco, Qingdao).
SSR markers
A total of 270 polymorphic SSR markers were selected from a previous study [23, 43].
DNA extraction
DNA extraction of 33 varieties was carried out with the following steps. Firstly, one hundred milligrams of the fresh leaves were ground in liquid nitrogen, and placed in a 2-mL EP tube. Secondly, 800 μL of SLS extracting solution (0.1 mol/L Tris-HCl, 0.2 mol/L EDTA, 0.1 mol/L NaCl, 10 g/L Sodium Lauroyl Sareosine, pH 8.0) was added, and the tube was shaken for 5 min. Thirdly, 800 μL of an isometric phenol: chloroform: isoamyl alcohol (25: 24: 1) mixture was added, followed by shaking for 5 min, and centrifugation at 12000 rpm for 10 min. Fourthly, 600 μL of the supernatant was transferred to a new 1.5-ml centrifuge tube and isometric precooled isopropyl alcohol (− 20 °C) was added for DNA precipitation. Next, the sample was centrifuged at 12000 rpm for 10 min, and the supernatant was removed, followed by a wash with 75% ethyl alcohol and a rinse with pure alcohol. Lastly, the sample was dried on a sterile bench for 30 to 60 min until no alcohol residue remained, and the sample was suspended in 100–200 μL of ddH2O.
Polymerase chain reaction (PCR) amplification and electrophoresis
PCR amplification and polyacrylamide gel electrophoresis were conducted following the methods reported in previous studies [23, 43]. NaOH silver staining [44] was used for dyeing and developing the polyacrylamide gels.
Data analysis
The amplified SSR band patterns were recorded in Excel 2013 (Microsoft Corp., Redmond, USA) using a binary (0–1) data format. The data were then converted by DataFormater [45] into input files for PowerMarker v. 3.25 [46], NtSys v. 2.10e [47], and Popgene v. 1.32 [48]. The average PIC was calculated using PowerMarker v. 3.25. Both H and I were calculated using PopGene v. 1.32. NtSys v. 2.10e was used to calculate genetic distances and to draw the UPGMA clustering tree. The software SPSS v. 22 [49] was used to generate boxplots and scatter plots and to perform correlation analysis. The random sampling of 1–90 markers was repeated 50 times for each marker number and the average PIC values were calculated. A Python (2.7) script was used for the random sampling experiment and for the statistical analysis of PIC values variation between samples. Other data analyses and the illustration of genetic fingerprints were carried out in Excel 2013.
Availability of data and materials
The datasets used and/or analyzed during the current study are available from the corresponding author upon reasonable request (Min Ren, renmin@caas.cn).
Abbreviations
- CV:
-
Coefficient of variation
- DUS:
-
Distinctness, uniformity, and stability
- H:
-
Nei index
- I:
-
Shannon information index
- NCGRI:
-
National Crop Germplasm Resources Infrastructure
- PCR:
-
Polymerase chain reaction
- PIC:
-
Polymorphic information content
- SLS:
-
Sodium lauroyl sarcosinate
- SNP:
-
Single nucleotide polymorphism
- SSR:
-
Simple sequence repeats
- UPGMA:
-
Unweighted pair group method with arithmetic mean
- UPOV:
-
International Union for the Protection of New Varieties of Plants
References
Smith S, Lence S, Hayes D, Alston J, Corona E. Elements of intellectual property protection in plant breeding and biotechnology: interactions and outcomes. Crop Sci. 2016;56:1401–11.
Bernet GP, Bramardi S, Calvache D, Carbonell EA, Asins MJ. Applicability of molecular markers in the context of protection of new varieties of cucumber. Plant Breed. 2003;122:146–52.
Li XH, Li XH, Zhang SH. New plant variety protection and DUS testing technique system. Sci Agric Sin. 2003;36:1419–22.
UPOV. TG/195/1 Guideline for the conduct of tests for distinctness uniformity and stability—tobacco (Nicotiana tabacum L.). Geneva: UPOV; 2002.
State Tobacco Monopoly Administration. YC/T 369–2010 Guidelines for the conduct of tests for distinctness uniformity and stability—flue-cured tobacco (Nicotiana tabacum L.). Beijing: State Tobacco Monopoly Administration; 2010.
General Administration of Quality Supervision I and Q of the PR of C. GB/T 19557.1–2004 General directives for the conduct of tests of distinctness, uniformity and stability for new varieties of plants. Beijing; 2004.
Wang YP, Li HY, Shen Q, Zhang JH, Wang P, Wu Y. Molecular markers associated with rice (Oryza sativa L.) traits in DUS testing. Jiangsu J Agric Sci. 2013;29:231–9.
Singh RK, Sharma RK, Singh AK, Singh VP, Singh NK, Tiwari SP, et al. Suitability of mapped sequence tagged microsatellite site markers for establishing distinctness, uniformity and stability in aromatic rice. Euphytica. 2004;135:135–43.
Deng LM, Han ZZ. Image features and DUS testing traits for peanut pod variety identification and pedigree analysis. J Sci Food Agric. 2019;99:2572–8.
Li XP, Jiang LJ, Liu N. SSR marker and its application in maize DNA fingerprinting database construction. Mod Agric Sci Technol. 2010;26:47–9.
Teng HT, Lv B, Zhang JY, Zhao JR, Xu Y, Wang FG, et al. DNA fingerprint profile involved in plant variety protection practice. Biotechnol Bull. 2009;1:1–6.
Zhang LW, Cai RR, Yuan MH, Tao AF, Xu JT, Lin LH, et al. Genetic diversity and DNA fingerprinting in jute (Corchorus spp.) based on SSR markers. Crop J. 2015;3:416–22.
Jamali SH, Cockram J, Hickey LT. Insights into deployment of DNA markers in plant variety protection and registration. Theor Appl Genet. 2019;132:1911–29.
Cheng BY, Shi YF, Shen WF, Zhuang JY, Yang SH. Establishment and application of DNA fingerprint testing system on rice varieties. Adv Contracept. 2008;23:54–9.
Lu GY, Wu XM, Zhang DX, Liu FL, Chen BY, Gao GZ, et al. SSR-based evaluation of distinctness and uniformity of rapeseed (Brassica napus L.) varieties under Chinese national official field tests. Sci Agric Sin. 2008;41:32–42.
Fan JG, Zhang HY, Gong GY, Xiao J, Guo SG, Ren Y, et al. Construction and application of SSR fingerprint database of the example varieties in watermelon DUS testing. J Plant Genet Resour. 2013;14:892–9.
Wang YP, Shen Q, Zhang JH, Li HY, Wu Y. Genetic diversity analysis and building of DNA fingerprints of barley standard varieties in DUS testing based on SSR markers. J Triticeae Crop. 2013;33:273–8.
Kuang M, Wang YQ, Zhou DY, Fang D, Ma L, Yang WH. Construction of SSR fingerprinting database of standard varieties on cotton in DUS testing. Cott Sci. 2015;27:46–52.
Wang FG, Yang Y, Yi HM, Zhao JR, Ren J, Wang L, et al. Construction of an SSR-based standard fingerprint database for corn variety authorized in China. Sci Agric Sin. 2017;50:1–14.
Tong ZJ, Xiao BG, Jiao FC, Fang DH, Zeng JM, Wu XF, et al. Large-scale development of SSR markers in tobacco and construction of a linkage map in flue-cured tobacco. Breed Sci. 2016;66:381–90.
Becher SA, Steinmetz K, Weising K, Boury S, Peltier D, Renou JP, et al. Microsatellites for cultivar identification in pelargonium. Theor Appl Genet. 2000;101:643–51.
Nunome T, Negoro S, Kono I, Kanamori H, Miyatake K, Yamaguchi H, et al. Development of SSR markers derived from SSR-enriched genomic library of eggplant (Solanum melongena L.). Theor Appl Genet. 2009;119:1143–53.
Fan WQ, Sun X, Yang AG, Cheng LR, Zhang ZF, Ren M. Exploring high-potassium favorable allele mutation of tobacco based on genome-wide association. Acta Tabacaria Sin. 2016;22:100–7.
Zheng JY, Zhang CJ, Yang AG, Feng Y, Feng QF, Ren M. Study on SSR loci associated with some chemical component of tobacco. Chinese Agric Sci Bull. 2014;30:102–6.
Dai SS, Ren M, Jiang CH, Cheng YZ, Geng RM. Identification of resistance to main virus diseases and genetic diversity study of tobacco foundation parents. Sci Agric Sin. 2015;48:1228–39.
Fricano A, Bakaher N, Corvo MD, Piffanelli P, Donini P, Stella A, et al. Molecular diversity, population structure, and linkage disequilibrium in a worldwide collection of tobacco (Nicotiana tabacum L.) germplasm. BMC Genet. 2012;13:18.
Xu J, Liu YH, Ren M, Mu JM, Zhang XW, Chen YC, et al. SSR fingerprint map analysis of tobacco germplasms. Chinese Tob Sci. 2011;32:62–5.
Cai C, Yang Y, Cheng L, Tong C, Feng J. Development and assessment of EST-SSR marker for the genetic diversity among tobaccos (Nicotiana tabacum L.). Russ J Genet. 2015;51:591–600.
Xia YS, Guo PG, Li RH, Lu YH, Qiu MW, Zhao WC, et al. Analysis of genetic diversity and population structure using SSR markers in tobacco. Adv Mater Res. 2013;850–851:1243–6.
Zhang XY, Li CW, Wang LF, Wang HM, You GX, Dong YS. An estimation of the minimum number of SSR alleles needed to reveal genetic relationships in wheat varieties. I. Information from large-scale planted varieties and cornerstone breeding parents in Chinese wheat improvement and production. Theor Appl Genet. 2002;106:112–7.
Wang B, Chang RZ, Tao L, Guan RX, Yan L, Zhang MH, et al. Identification of SSR primer numbers for analyzing genetic diversity of Chinese soybean cultivated soybean. Mol Plant Breed. 2003;1:82–8.
Yang QW, Chen CB, Zhang WX, Shi JX, Ren JF. Minimum number of SSR alleles needed for genetic structure analysis of oryza rufipogon populations. Chinese J Rice Sci. 2005;19:297–302.
Agrama HA, McClung AM, Yan WG. Using minimum DNA marker loci for accurate population classification in rice (Oryza sativa L.). Mol Breed. 2012;29:413–25.
Yuan XP, Wang CH, Deng HZ, Xu Q, Feng Y, Yu HY, et al. Minimum of SSR markers for analyzing genetic variation of Oryza sativa L. Chinese J Rice Sci. 2015;29:578–86.
Lewis RS, Nicholson JS. Aspects of the evolution of Nicotiana tabacum L. and the status of the United States Nicotiana Germplasm collection. Genet Resour Crop Evol. 2007;54:727–40.
Gong DP, Huang L, Xu XH, Wang CY, Ren M, Wang CK, et al. Construction of a high-density SNP genetic map in flue-cured tobacco based on SLAF-seq. Mol Breed. 2016;36:100.
Cheng LR, Chen XC, Jiang CH, Ma B, Ren M, Cheng YZ, et al. High-density SNP genetic linkage map construction and quantitative trait locus mapping for resistance to cucumber mosaic virus in tobacco (Nicotiana tabacum L.). Crop J. 2019;7:539–47.
Jung JK, Park SW, Liu WY, Kang BC. Discovery of single nucleotide polymorphism in Capsicumand SNP markers for cultivar identification. Euphytica. 2010;175:91–107.
Jones H, Mackay I. Implications of using genomic prediction within a high-density SNP dataset to predict DUS traits in barley. Theor Appl Genet. 2015;128:2461–70.
Tian HL, Wang FG, Zhao JR, Yi HM, Wang L, Wang R. Development of maizeSNP3072, a high-throughput compatible SNP array, for DNA fingerprinting identification of Chinese maize varieties. Mol Breed. 2015;35:136.
Fang WP, Meinhardt LW, Tan HW, Zhou L, Mischke S, Wang XH, et al. Identification of the varietal origin of processed loose-leaf tea based on analysis of a single leaf by SNP nanofluidic array. Crop J. 2016;4:304–12.
Liu ZX, Li J, Fan XH, Htwe NMPS, Wang SM, Huang W, et al. Assessing the numbers of SNPs needed to establish molecular IDs and characterize the genetic diversity of soybean cultivars derived from Tokachi nagaha. Crop J. 2017;5:326–36.
Ren M, Zhang CJ, Jiang CH, Cheng LR, Jia XH, Yang AG. Association analysis of tobacco aroma constituents based on high density SSR linkage group. Acta Tabacaria Sin. 2014;20:88–93.
Ren M, Jia XH, Jiang CH, Yang AG, Wang RX. Comparison study of Bassam and Sanguinetti silver staining in the detecting of SRAP and TRAP. Biotechnol Bull. 2008;24:113–6.
Fan WQ, Gai HM, Sun X, Yang AG, Zhang ZF, Ren M. DataFormater, a software for SSR data formatting to develop population genetics analysis. Mol Plant Breed. 2016;14:265–70.
Liu K, Muse SV. PowerMarker: an integrated analysis environment for genetic marker analysis. Bioinformatics. 2005;21:2128–9.
Rohlf FJ. NTSYS-pc, numerical taxonomy and multivariate analysis system, Version 2.1; 2000.
Yeh FC, Yang R, Boyle TBJ, Ye Z, Xiyan JM, Yang R, et al. PopGene32, microsoft windows-based freeware for population genetic analysis, Version 1.32. 2000.
IBM Corp. IBM SPSS statistics for windows, Version 22.0. 2013.
Bindler G, Plieske J, Bakaher N, Gunduz I, Ivanov N, Van Der Hoeven R, et al. A high density genetic map of tobacco (Nicotiana tabacum L.) obtained from large scale microsatellite marker development. Theor Appl Genet. 2011;123:219–30.
Acknowledgments
Not applicable.
Funding
This work was supported by grants from the Species Germplasm Resources Protection Fee (2130135), and Agricultural Science and Technology Innovation Program (ASTIP-TRIC01). The funder has no role in the design of the study and collection, analysis, and interpretation of data and in writing the manuscript.
Author information
Authors and Affiliations
Contributions
MR and HG conceived and designed the research; BH performed the Research and wrote the manuscript; RG performed the materials collection; LC conducted the genetic diversity data analysis; XY provided suggestions on genetic site selection; All authors read and approved the final manuscript.
Corresponding authors
Ethics declarations
Ethics approval and consent to participate
Not applicable.
Consent for publication
Not applicable.
Competing interests
The authors declare that they have no competing interests.
Additional information
Publisher’s Note
Springer Nature remains neutral with regard to jurisdictional claims in published maps and institutional affiliations.
Supplementary information
Additional file 1: Table S1
. The details of the 91 SSR markers studied in this research. The information of linkage group, genetic position, and sequence of primers came from reference [50].
Additional file 2: Figure S1
. The electrophoretic image of SSR marker PT50136 (on the right side of the photo).
Rights and permissions
Open Access This article is licensed under a Creative Commons Attribution 4.0 International License, which permits use, sharing, adaptation, distribution and reproduction in any medium or format, as long as you give appropriate credit to the original author(s) and the source, provide a link to the Creative Commons licence, and indicate if changes were made. The images or other third party material in this article are included in the article's Creative Commons licence, unless indicated otherwise in a credit line to the material. If material is not included in the article's Creative Commons licence and your intended use is not permitted by statutory regulation or exceeds the permitted use, you will need to obtain permission directly from the copyright holder. To view a copy of this licence, visit http://creativecommons.org/licenses/by/4.0/. The Creative Commons Public Domain Dedication waiver (http://creativecommons.org/publicdomain/zero/1.0/) applies to the data made available in this article, unless otherwise stated in a credit line to the data.
About this article

Cite this article
He, B., Geng, R., Cheng, L. et al. Genetic diversity and fingerprinting of 33 standard flue-cured tobacco varieties for use in distinctness, uniformity, and stability testing. BMC Plant Biol 20, 378 (2020). https://doi.org/10.1186/s12870-020-02596-w
Received:
Accepted:
Published:
DOI: https://doi.org/10.1186/s12870-020-02596-w