
Abstract
Background
APETALA2-like genes encode plant-specific transcription factors, some of which possess one microRNA172 (miR172) binding site. The miR172 and its target euAP2 genes are involved in the process of phase transformation and flower organ development in many plants. However, the roles of miR172 and its target AP2 genes remain largely unknown in Brassica napus (B. napus).
Results
In this study, 19 euAP2 and four miR172 genes were identified in the B. napus genome. A sequence analysis suggested that 17 euAP2 genes were targeted by Bna-miR172 in the 3′ coding region. EuAP2s were classified into five major groups in B.napus. This classification was consistent with the exon-intron structure and motif organization. An analysis of the nonsynonymous and synonymous substitution rates revealed that the euAP2 genes had gone through purifying selection. Whole genome duplication (WGD) or segmental duplication events played a major role in the expansion of the euAP2 gene family. A cis-regulatory element (CRE) analysis suggested that the euAP2s were involved in the response to light, hormones, stress, and developmental processes including circadian control, endosperm and meristem expression. Expression analysis of the miR172-targeted euAP2s in nine different tissues showed diverse spatiotemporal expression patterns. Most euAP2 genes were highly expressed in the floral organs, suggesting their specific functions in flower development. BnaAP2–1, BnaAP2–5 and BnaTOE1–2 had higher expression levels in late-flowering material than early-flowering material based on RNA-seq and qRT-PCR, indicating that they may act as floral suppressors.
Conclusions
Overall, analyses of the evolution, structure, tissue specificity and expression of the euAP2 genes were peformed in B.napus. Based on the RNA-seq and experimental data, euAP2 may be involved in flower development. Three euAP2 genes (BnaAP2–1, BnaAP2–5 and BnaTOE1–2) might be regarded as floral suppressors. The results of this study provide insights for further functional characterization of the miR172 /euAP2 module in B.napus.
Background
MicroRNAs are a class of endogenous, small non-coding RNAs (20–24 nucleotides) with critical roles in the post-transcriptional regulation of gene expression [1]. Plant miRNAs have been reported to be involved in many biological processes, such as auxin signalling [2], flowering time regulation [3], leaf development [4] and stress responses [5, 6]. Recent studies have also indicated that miRNAs can regulate developmental timing and floral induction in a variety of plants via their corresponding target genes [7,8,9,10,11,12,13]. In particular, two highly conserved microRNAs, namely, miR156 and miR172, have been identified as master regulators of vegetative phase change [14,15,16,17,18,19].
MiR172 was first obtained by small-RNA sequencing in Arabidopsis and has been found in many plants because of its high conservation [20]. The miR172 family is a major component of the age pathway, and it is encoded by MIR172a-e genes in Arabidopsis. The target genes of this family in Arabidopsis include six APETALA-2 (AP2)-type genes: APETALA2 (AP2), TARGET OF EAT 1 (TOE1, TOE2, and TOE3), SCHLAFMUTZE (SMZ) and SCHNARCHZAPFEN (SNZ). AP2 is involved in floral organ formation, and the other five AP2-like genes are mainly floral suppressors [3, 21, 22]. The AP2 proteins have one or more AP2 domains consisting of 60–70 highly conserved amino acids (aa) and two conserved components, namely, the YRG and RAYDmotifs, at the N- and C-terminus of the AP2 domain respectively [23,24,25].
MiR172 and its target genes play key roles in flowering time and floral organ differentiation. In Arabidopsis, overexpressing all the miR172 target genes except TOE3 led to delayed flowering [18, 22, 24]. In contrast, the toe1toe2 double mutant, toe1toe2smzsnz quadruple mutant and toe1toe2toe3smzsnzap2 sextuple mutant all showed early flowering, and the flowering time advanced as the number of mutant genes increased [26, 27]. On the one hand, this result showed functional redundancy among the AP2 genes; on the other hand, it confirmed that AP2 genes negatively regulate flowering time in Arabidopsis. In the maize mutant glossy15 (gl15), young leaves showed premature adult leaf characteristics because miR172-targeted GL15 played a role in the juvenile to adult transition [28]. Overexpressing miR172 not only accelerated flowering but also resulted in abnormal flower development in Arabidopsis including a loss of petals and homologous transformation of sepals to carpels [3, 22, 26], the phenotype similar to the ap2 mutant. When a 6-base mutation was introduced at the miR172 binding site of AP2 to produce a miR172 resistance gene, a large number of petals were generated and the stamens were degenerated [22]. Overexpression of miR172b in rice delayed the transition from spikelet meristem to floral meristem and resulted in homeotic transformation in floral organs [29]. Overexpression of miR172 in tobacco also resulted in the conversion of sepals to petals, while 35S::AP2m3 plants exhibited floral patterning defects that included the proliferation of numerous petals, stamens and carpels [30]. In barley, Cleistogamy1 (Cly1) replaces the synonymous nucleotides at the miR172 target site and leads to the failure of flowering and a closed-fertilization phenotype [31].
Brassica napus is the second largest oil crop in the world. This species is an allopolyploid (AACC, 2n = 4x = 38) that evolved from a natural interspecies cross between Brassica rapa (genome AA, 2n = 20) and Brassica oleracea (genome CC, 2n = 18) [32]. Flowering represents the transition from the vegetative stage to the reproductive stage. Flowering appropriately is crucial to ensure reproductive success and thus determines the growth period, yield and seed quality in B. napus. Despite the roles of AP2 genes in Arabidopsis has been well described, the roles of miR172 and its target AP2 genes in determining flowering and floral development are still unclear in B. napus. Although the MiRNA172c-APETALA2–1 node has been identified as a key regulator of nitrogen fixation in common bean [33], the interaction between the AP2 and MiR172 in B.napus has not clearly understood. Therefore, it would be intriguing to perform a genome-wide functional analysis of miR172/euAP2 in B.napus. In this study, we systematically analysed the chromosomal location, evolutionary relationships, duplication events, collinearity, gene structure, conserved motifs and upstream cis-elements among miR172 members and their euAP2 target genes. RNA sequencing (RNA-seq) and quantitative real-time PCR (qRT-PCR) were also carried out to analyse the expression pattern of euAP2s in diverse tissues and developmental stages.
Results
Identification of euAP2 and miR172 genes in B. napus
Eight characterized AP2 protein sequences in Arabidopsis were used as the query sequences to identify the euAP2 gene family in the B. napus genome using BLASTP searches with an E-value of ≤10− 10, and 19 putative euAP2 family genes were identified. Then, the SMART, Pfam, CDD and HMMER databases were used to verify the AP2 domains, and all 19 predicted protein had one or two AP2 domains. As shown in Table 1, we numbered the B. napus euAP2 according to their closest Arabidopsis homolog.
The chromosome location, protein sequence length, molecular weight (MW), isoelectric point (pI), and subcellular localization were analysed. The size of the euAP2 proteins ranged from 103 (BnaTOE1–5) to 454 (BnaTOE2–3) amino acids. The predicted Mw of these deduced proteins varied from 11.00 kDa to 49.63 kDa, and the PI values varied from 6.02 to 9.42. The predicted subcellular localization results showed that nine euAP2 proteins were located in the nuclear region, four proteins were located in the cytoplasm region and the other six proteins were located in the nuclear and cytoplasm regions. These results indicate that different euAP2 family proteins may perform different functions.
Four putative miR172 family members (Bna-miR172a, Bna-miR172b, Bna-miR172c, and Bna-miR172d) in B. napus were predicted in miRbase, their precursor and mature sequences were shown in Additional file 1: Table S1. Multiple sequence alignments of the miR172 precursor and mature sequences were shown in Additional file 8: Figure S1a, b. The four mature miR172 sequences were highly conserved except for the first base, whereas divergence was observed in the precursor sequences. The secondary structure of the Bna-MIRl72 gene transcript was predicted by Mfold (Additional file 8: Figure S1c), and the four precursor sequences formed different stem-loop structures, which may lead to functional differences among members.
Target prediction for miRNAs is based on the high degree of homology between miRNAs and their target genes in plants [34]. Two target prediction servers, namely, TAPIR and psRNATarget, were used to identify potential targets of miR172 in B. napus. A total of 17 targets carrying the miRNA response element (MRE) for miR172 were predicted, and the position of miRNA binding sites were displayed in Table 1. A comparison of the Bna-miR172 mature sequences to the euAP2 sequences showed that 17 euAP2s contained sequences complementary to the Bna-miR172 mature sequences, with one to three base mismatches (Fig. 1a). All the identified target sites of Bna-miR172 were located in the coding regions of euAP2 genes.
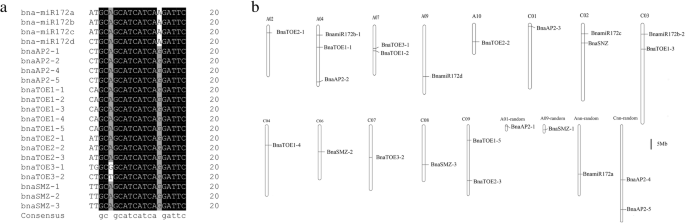
Multiple sequence alignment and chromosomal localization of miR172 and euAP2 in B.napus. a Alignment of the Bna-miR172 mature sequence compared with euAP2 genes; b Chromosomal location of euAP2s and the miR172 precursor sequence in the B. napus genome
The chromosome distribution of the euAP2 genes and Bna-miR172 precursors is shown in Fig. 1b. The 19 euAP2s and four Bna-miR172s were located in 13 known chromosomes, and four were located in the scaffolds. These genes and miRNA precursors were unevenly distributed in the B .napus sub-genomes, with six and nine euAP2 genes located in the A and C genomes, respectively. The other four euAP2 genes mapped onto A01-random, A09-random, Ann-random and Cnn-random. The Bna-miR172 genes were distributed in A03, A09, C02, C03 and Ann_random. However, no euAP2 genes and Bna-miR172 precursors were located on A01, A04, A05, A06, A08, and C01 chromosomes. The absence of genes on the chromosomes and uneven distribution on the sub-genomes of euAP2 genes clarified their translocation during evolution.
Phylogenetic and selection pressure analysis of the euAP2 and Bna-miR172 genes
To evaluate the evolutionary relationships of the AP2 and miR172 gene members, an unrooted neighbour-joining phylogenetic tree was created using the precursor sequence of miR172 and amino acid sequences of AP2 genes from Arabidopsis, B. napus, B. rapa, B. oleracea, rice, maize, moss and Arabidopsis lyrata. However, no miR172 gene was identified in moss. MIR172 genes from other seven plant species could be classified into four groups according to the phylogenetic analysis. Every group had at least one MIR172 gene from Arabidopsis (Fig. 2a). The AP2 genes from the eight species were assigned to four groups according to the phylogenetic topology (Fig. 2b). The BnaAP2 genes were firstly clustered with AP2s from two progenitors of B. napus, followed by Arabidopsis and A. lyrata, which formed a specific Brassicaceae clade. EuAP2 proteins from rice exhibited closer relationships to maize and formed a monocot clade. EuAP2 in dicot and monocot plants formed a larger clade together. The moss clustered into one independent clade. These results suggested that euAP2 protein may be highly conserved in monocot and dicot and diverged after the split between bryophytes and vascular plants.

Phylogenetic tree of miR172 and AP2-type genes in B. napus and other seven species. The different-coloured arcs indicate different subgroups of euAP2 genes. a Phylogenetic relationship of miR172 genes; b. Phylogenetic relationship of AP2 genes. Numbers on the branches are the bootstrap percentage values based on 1000 replicates, and only values of > 50% are shown. Bna: Brassica napus, Ath: Arabidopsis, Bol: Brassica oleracea, Bra: Brassica rapa, Aly: Arabidopsis lyrata, Pp: Physcomitrella patens, Os: Oryza sativa and Zm: Zea mays
We also predicted the paralogous and orthologous relationships of the AP2 proteins among Arabidopsis, B. napus, B. rapa and B. oleracea. Seven pairs of paralogs were identified in B. napus, and 11 pairs of putative orthologous proteins were identified between species. To explore the driving force of gene divergence after gene duplication, the nonsynonymous/synonymous substitution ratio (Ka/Ks) of euAP2 gene pairs was calculated (Table 2). With the exception of one gene pair (BnaTOE1–1/BraTOE1–2) with a Ka/Ks > 1, the majority of euAP2 gene pairs had a Ka/Ks < 1, suggesting that the AP2 gene family experienced strong purifying selective pressure during evolution.
We examined five types of gene duplications, namely, singleton, dispersed, proximal, tandem, and WGD or segmental duplication using the MCScanX program. No tandem repeat events within the euAP2 gene family were found, while five dispersed and 11 segmental duplication events were identified (Table 3). These results indicated that some euAP2 genes were probably generated by gene duplication and that the WGD or segmental duplication events were a major driving force of euAP2 evolution [35].
To further infer the phylogenetic relationships of the BnaAP2 family, we constructed three comparative syntenic maps of B. napus associated with Arabidopsis, B. rapa and B. oleracea (Fig. 3). A total of 13 BnAP2 genes showed a syntenic relationship with those in Arabidopsis, followed by B. rapa (13) and B. oleracea (13). Interestingly, collinear pairs (13 BnAP2 genes) were identified between B. napus and the three other species, indicating that these orthologous pairs may have already existed before divergence (Additional file 2: Table S2).

Synteny analysis of euAP2 genes among B. napus, Arabidopsis and its ancestor parents. Grey lines in the background indicate the collinear blocks within the genomes of B. napus and other plants, and red lines highlight the syntenic euAP2 gene pairs
Structural organization and conserved domain analysis of euAP2 genes
To gain further insights into the structure of the euAP2 genes, we aligned their coding sequences to their genomic sequences (Additional file 9: Figure S2). The euAP2 genes were classified into five subgroups. The difference in the number of exons (4 to 10), the intron length and the presence of an untranslated region (UTR) were assessed among the 19 genes, indicating that the AP2-type genes may perform different functions despite being in the same subfamily. However, the genes located at the end of the same branch always exhibited similar structures. The exon-intron structures were consistent with the phylogenetic relationships and conserved in each group, although some paralogous genes demonstrated some differences.
MEME was used to identify putative conserved motifs among the euAP2 genes (Fig. 4). The 10 most conserved motifs were recognized, and the length of the motifs ranged from 11 to 50 amino acids. The motif annotations are listed in Additional file 3: Table S3. Motifs 1 and 4 were annotated as the AP2-ERF domain, the other motifs had unknown functions. The conserved AP2 domain was created by WebLogo, and all the euAP2 proteins contain one or both of motifs 1 and 4, which further confirmed the identification results presented in Table 1. Most of the euAP2s within the same groups contained a similar motif composition. The similar motif number and arrangements among the AP2-type proteins in the same subgroups indicated that the protein function was conserved within a specific subfamily. However, there were also some exceptions: BnaAP2–1 and BnaAP2–5 had 4 motifs (motifs 2, 4, 5, and 6); BnaAP2–3 had 7 motifs; BnaAP2–2 / BnaAP2–4 contained 8 motifs; BnaSNZ had only one AP2-ERF motif; and BnaTOE1–5 had only 2 motifs, which was far fewer than the number observed in other proteins of the same subfamily (9 motifs). Motifs 6 and 7 were unique in Clades I and V, respectively, and may be important for the functions of BnaAP2 and BnaTOE proteins. These specific motifs and motif compositions may contribute to the functional divergence of euAP2 genes.

Organization of putative motifs in euAP2 genes. a Sequence logo view of the consensus AP2 domain sequences in B. napus. The height of the letter (amino acid) at each position represents the degree of conservation. b Putative motifs in euAP2 protein identified by MEME. Numbered, coloured boxes represent different putative motifs. I to V indicate the phylogenetic subgroups from Additional file 9: Figure S2
In general, the similar gene structures and conserved motif compositions of euAP2 members in the same group as well as the results of the phylogenetic analysis, further confirm the reliability of the evolutionary classification.
Analysis of cis-regulatory elements (CREs) of Bna-miR172 and BnaAP2 genes
Temporal and spatial gene expression is regulated by the presence of different cis-regulatory elements in the promoters [36]. To understand the expression divergence, a 1000 bp region upstream of the transcription start site (TSS) of euAP2 genes and a 1500 bp upstream of the Bna-miR172 precursor sequences were extracted to analyse CREs using the PlantCARE database (Additional file 4: Table S4). The identified CREs were classified into five main categories based on their function: light-responsive elements, hormone-responsive elements, stress-responsive elements, growth and development-responsive elements, and others. All the promoter sequences contained a TATA-box and CAAT-box. Light-responsive elements such as G-Box, GAG-motif, Box 4, AAAC-motif and Box 1 were abundant in most genes. CRE such as ERE, ABRE TGA element, GARE-motif, P-box, and CGTCA and TGACG motifs were responsive to various plant hormones including ethylene, abscisic acid, auxin, gibberellin and MeJA. Stress-responsive elements such as ARE, MBS, TC-rich repeats, LTR, Box-W1 and HSE have been reported in response to various abiotic stresses. In addition, other growth and development-responsive elements, such as the CCAAT-box, 5′ UTR Py-rich stretch and CCGTCC-box were found to be associated with endosperm and meristem expression and circadian control. In general, the expression of Bna-miR172 and its target euAP2 genes could be regulated by diverse environments and internal developmental factors.
Different expression profiles of euAP2 genes
Gene expression patterns in different tissues
To investigate the putative roles of euAP2 genes, the expression patterns of all euAP2s were analysed in diverse tissues based on RNA-seq data (Fig. 5a). The euAP2s were classified into seven groups by using hierarchical clustering. The five AP2 genes in the first group, i.e., BnaTOE2–2, BnaTOE1–1, BnaTOE1–3, BnaTOE1–4 and BnaTOE2–3, were expressed at high levels in the young leaves from the seedling stage. The second group had three genes (BnaTOE1–2, BnaSMZ-1, and BnaSMZ-3) that were highly expressed in the young leaves from the seedling stage and 24 d after flowering. The transcription of euAP2 genes in the third to sixth groups was enriched in the pistils, stamens, sepals and calyxes, which indicated their potentially specialized function in floral organ development. BnaSNZ and BnaTOE1–5 in the seventh group showed almost no expression in these tissues.

Expression profiles of euAP2 genes in different vegetative and reproductive tissues of ZS11. a Hierarchical clustering of expression profiles of the euAP2 genes in 13 samples based on the ZS11 RNA-Seq data. Heatmap showing the log2-transformed FPKM values. Tissues used for expression profiling are indicated at the top of each column. Every tissue has three replications. The genes are on the right of the expression bar. Ro-f, St-f, Cal-f, Pe-f, Pi-f and Sta-f represent root, stem, calyx, petal, pistil and stamen tissue collected from the full-bloom stage, respectively; Le_s_f, LeY-b, LeY-i, LeY-f, LeY-10d, LeY-24d and LeY-30d represent young leaves from the seedling stage, bud stage, early flowering stage, full-flowering stage, and 10 d, 24 d, and 30 d after flowering, respectively. b qRT–qPCR analysis of euAP2 genes in nine tissues. Root as a control. Data were normalized to the actin gene, and error bars indicate the standard error (SE) of the mean. Student’s t-test: *P < 0.05, **P < 0.01
qRT-PCR was used to confirm the expression levels of the miR172 target euAP2 genes in nine tissues (root, stem, leaf, flower, bud, sepal, petal, stamen and pistil) of ZS11 (Fig. 5b). Most of the euAP2s exhibited a distinct tissue-specific expression pattern and achieved significant differences compared with root. BnaTOE1–2-5 and BnaTOE1–4 displayed the highest transcript abundance in the root and stamen; BnaTOE3–1-2 and BnaSMZ-1-3 exhibited the highest expression in the leaf and root, respectively; BnaTOE2–2 and BnaTOE2–3 were specifically highly expressed in the sepal; and the other five euAP2 genes (BnaAP2–1-5, BnaAP2–2-4, BnaTOE1–1-3, BnaTOE2–1, and BnaSMZ-2) exhibited increased expression in the floral organs (flower, bud, sepal, petal, stamen, and pistil), which indicating that these genes may be involved in the regulation of flowering time and floral organ development.
Gene expression patterns in early- and late-flowering lines
To investigate the putative AP2 genes involved in flowering time regulation, the RNA-seq data from both early-flowering bulk material and late-flowering bulk material was extracted. First, the expression levels in the shoot tissues (S) and leaves (L) of early-flowering and late-flowering bulk materials at the vegetative stage were analysed (Additional file 10: Figure S3a). The euAP2 expression patterns were divided into 3 categories between two tissues of the two lines. The first group showed no or low expression in the four samples and included BnaSMZ-1, BnaSMZ-2, BnaSMZ-3, BnaTOE1–5 and BnaTOE2–1; the second group exhibited medium level expression and no obvious difference among the four samples and included BnaTOE1–1, BnaTOE1–4, BnaTOE2–2, BnaTOE2–3, BnaAP2–2 and BnaAP2–3; and the third group exhibited relatively high expression in the four samples, BnaAP2–1, BnaAP2–5, BnaTOE1–2 and BnaTOE1–3 displayed higher expression in the late-flowering material than that in the early-flowering material in both shoot tissues (S) and leaves (L), which indicated their negative roles in flowering regulation, while BnaAP2–4, BnaTOE3–1 and BnaTOE3–2 did not show the above rules. Second, we further studied the RNA-seq data from juvenile leaves of the early-flowering material (18Z134) and late-flowering material (18Z88) at the vegetative and reproductive stages and obtained similar results (Additional file 10: Figure S3b). BnaSMZ-1, BnaSMZ-2, BnaSMZ-3, BnaSNZ, BnaTOE1–1, BnaTOE1–5 and BnaTOE2–1 belonged to the first group and showed no or lower expression; BnaTOE1–3, BnaTOE2–2, BnaTOE2–3, BnaTOE3–1 and BnaTOE3–2 belonged to the second group and maintained a high expression level but exhibited no obvious difference among the four samples; BnaAP2 (AP2–1, AP2–2, AP2–3, AP2–4, and AP2–5), BnaTOE1–2 and BnaTOE1–4 belonged to the third group and exhibited elevated expression in the vegetative-stage leaves and a higher transcript abundance in the late-flowering material than in the early-flowering material, which further confirmed their negative regulatory roles.
qRT-PCR was conducted to confirm the expression level of AP2s in the same materials (18Z88 and 18Z134) used for RNA-seq (Fig. 6). Most euAP2 genes had higher expression levels in the floral organs of 18Z88 than 18Z134 and showed significant differences between them. A tissue-specific expression analysis revealed that BnaTOE1–1-3, BnaTOE1–2-5, BnaTOE2–2 and BnaSMZ-1-3 expressed abundantly in roots of 18Z134. All euAP2 genes except BnaTOE1–4 and BnaTOE2–3 had higher expression levels in the pistil of 18Z134 than in 18Z88. The expression of AP2s in the other tissues presented relatively low expression in both lines.
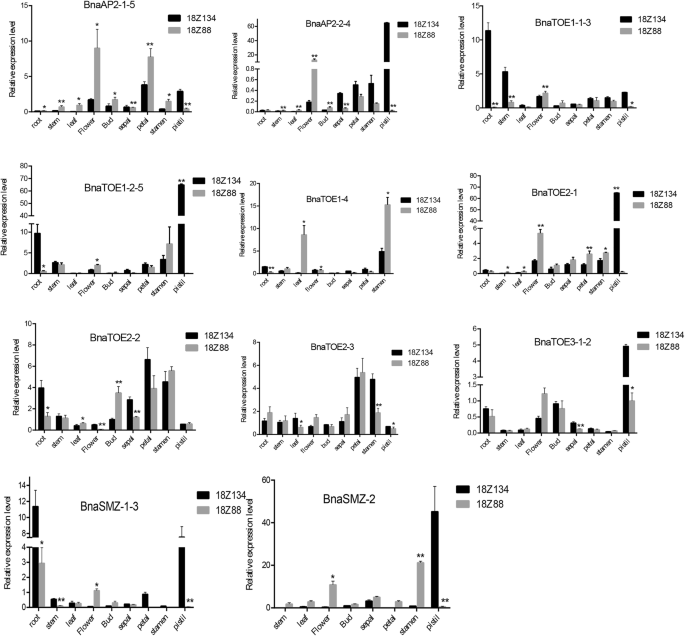
qRT–qPCR analysis of euAP2 genes in different tissues of early- (18Z134) and late-flowering (18Z88) lines. The error bars show standard error (SE) of three independent biological repeats. Student’s t-test: *P < 0.05, **P < 0.01
Discussion
MiR172 and its target AP2 genes in Brassica and their evolution
Transcription factors (TFs) play important roles in plant growth and development. The APETALA2/Ethylene Responsive Factor (AP2/ERF) proteins are a large family of TFs with a key function in response to biotic and abiotic stresses as well as developmental stages that have been identified in various plant species, including Arabidopsis [37], rice [38], B. rapa [39], B. napus [40, 41], barley and wheat [42], poplar [43] and soybean [44]. In this manuscript, we mainly focused on the AP2 genes that belong to the euAP2 group. The euAP2 group in Arabidopsis includes six AP2 genes (AP2, TOE1, TOE2, TOE3, SMZ, and SNZ). Each Arabidopsis euAP2 gene has one to five orthologous genes in B. napus. In the present study, 19 euAP2 genes were identified in B. napus, which is approximately more than twice the number identified in its progenitors B. rapa (8) and B. oleracea (9), indicating that some euAP2 genes in B. napus, B. rapa and B. oleracea were subjected to a copy number increase due to WGD and polyploidization.
Based on the phylogenetic analysis, the euAP2s in B. napus can be classified into five groups (Additional file 9: Figure S2). Most euAP2 genes in the same subgroup had similar exon-intron structures, although the exon number and intron length varied significantly among members of different subfamilies (Additional file 9: Figure S2). The majority of euAP2 proteins belonging to the same group contained similar motif distributions, while euAP2 proteins had distinct motif constitutions and organizations among subgroups (Fig. 4b), a finding that was also reported by Song [40]. The divergence in gene structure and motif composition between euAP2 genes suggests functional differentiation during evolution. The motif recognition and gene structure analysis also highly corroborated our phylogenetic classification. Most miRNA target genes identified in plants are TFs [45]. MiR172 is known to regulate the euAP2 group of AP2-like TFs through transcript cleavage and translational repression in Arabidopsis [3, 21, 22]. In this study, 4 members of the miR172 family in B. napus were identified, and target prediction showed that 17 of the 19 euAP2 genes contained a MRE for miR172 (Fig. 1a; Table 1). Additionally, the miRNA172 binding site in the 3′ coding region were also identified in the AP2 genes of barley and some representative euAP2 proteins [38, 42], suggesting that miR172 complementary sites in euAP2 genes are conserved across plant species.
Duplicated type and synteny analyses of AP2 genes in B. napus and other species
Seven pairs of paralogs in B. napus and 11 pairs of orthologous proteins between species were identified via the phylogenetic analysis (Fig. 2b). Positive selection is the main driving force for functional divergence in euAP2 proteins after gene duplication. A comparison of the number of euAP2 genes in B. napus with that in Arabidopsis and the ancestor parental genomes showed that B. napus has more genes (Fig. 3). Gene replication events that occurred during evolution contributed to the expansion of gene families [35]. Based on the duplication analysis, WGD or segmental duplication events had a major impact during euAP2 evolution. Therefore, WGD or segmental duplication might be a possible reason for the increased number of euAP2 genes.
Analysis of the expression patterns of euAP2s in B. napus
The spatio-temporal expression patterns of euAP2s have been analysed in many species. Jofuku showed that, unlike other floral homeotic genes, AP2 is expressed in both nonfloral (stems and leaves) and floral tissues (sepals, petals, stamens, carpels, developing ovules and inflorescence meristems) in Arabidopsis [46]. Javier studied the expression of AP2-like genes in the roots, stems, young leaves, and spikes at various developmental stages in wheat and barley and showed that AP2-like genes were expressed in all tissues, peaked in the early stages of spike development and gradually decreased with spike maturation [42]. The euAP2 genes in rice were transcribed in the juvenile and mature leaves, root tip, inflorescences and serial stages of the panicles [38]. The expression of AP2/ERFs in B. napus was also previously examined: Zhuang and Zhu surveyed B. napus EST databases and showed that AP2/ERF genes were highly expressed in the stemsfollowed by flowers and leaves [47]; Hajar revealed that most of the BnaAP2 subfamily showed high expression in the flower buds, roots, leaves, and stems via transcriptome sequencing [41]; Song used the RNA-seq data reported by Chahoub [32] and concluded that the AP2 genes had higher gene expression in the roots than leaves [40].
Reports have indicated that the AP2 genes have critical functions in flower ontogeny, including floral meristem establishment [27, 48,49,50], floral organ identity [3, 51, 52], and floral homeotic gene expression [44]. In this study, the BnaAP2s showed different expression patterns among tissues. More than half of the euAP2 genes were expressed predominantly in reproductive organs such as the flowers, buds, sepals, petals, stamens, and pistils, suggesting that these euAP2 genes also play important roles in floral development in B. napus [53].
To further validate whether the euAP2 genes affect flowering time, we analysed their expression in different organs of early- and late-flowering lines. Certain euAP2 genes, such as BnaAP2–1, BnaAP2–5 and BnaTOE1–2, had higher expression levels in the floral organs of the late-flowering material (18Z88) than the early-flowering material (18Z134), indicating that they may be floral suppressor genes. This observation was consistent with the findings of previous studies in Arabidopsis [21, 22, 27].
Conclusion
In this study, 19 euAP2 genes and four miR172 members were identified in B. napus genome and the 19 euAP2s were categorized into five subgroups. The 17 euAP2 genes, which were predicted to be targeted by miR172, have tissue specific expression patterns. Most of the euAP2s were highly expressed in the floral organs (sepals, petals, stamens, and pistils), suggesting that the AP2/miR172 module plays an important role in flower organ development. In addition, three genes, BnaAP2–1, BnaAP2–5 and BnaTOE1–2, had higher expression levels in late-flowering lines than in early-flowering lines, which revealed that they might act as floral suppressors. Taken together, the identification and expression of miR172/euAP2 genes provide insights for further research on the miR172/euAP2 interaction and flower development in B. napus.
Materials and methods
Identification of Bna-miR172 and its target euAP2 genes
The nucleotide and protein sequences of the AP2 family genes from A. thaliana, B. napus, B. rapa, and B. oleracea were downloaded from the Arabidopsis Information Resource (TAIR, http://www.arabidopsis.org) and BRAD (http://brassicadb.org/brad/index.php). Sequences from A. lyrata, rice, maize and moss were obtained from EnsemblePlants (http://plants.ensembl.org/index.html). BLASTP searches were performed against the BRAD and EnsemblePlants database with default parameters using Arabidopsis AP2 protein sequences as queries. Sequences with an E-value ≤10− 10 were regarded as candidate proteins. To further confirm the candidate euAP2 family genes, the presence of the AP2 domain in the proteins was evaluated using the SMART (http://smart.embl-heidelberg.de/) [54] and Pfam (http://pfam.xfam.org/) [55] databases. To further validate the identified gene, the amino acid sequence of the identified genes were also submitted to the NCBI’s conserved domain database (CDD, https://www.ncbi.nlm.nih.gov/Structure/bwrpsb/bwrpsb.cgi) and HMMER (https://www.ebi.ac.uk/Tools/hmmer/search/hmmscan).
Physico-chemical parameters, including the theoretical isoelectric point (pI) and molecular weight (Mw) of the deduced proteins, were analysed using the ExPasy pI/Mw tool (http://web.expasy.org/protparam/) [56]. The subcellular localizations of the AP2 family proteins were predicted using the Cell-PLoc website (http://www.csbio.sjtu.edu.cn/bioinf/Cell-PLoc/).
The precursor and mature sequences of the plant miRNA172 family were obtained from the miRbase22 database (http://www.mirbase.org/) [57]. The miR172 genes were named as assigned in miRbase (Bna-miR172) and with new serial numbers (such as a-e). The secondary structures of the Bna-miR172 precursors were predicted by the Mfold web server (http://mfold.rna.albany.edu/?q=mfold) [58]. The putative target genes of miR172 were searched via the web-based tools TAPIR (http://bioinformatics.psb.ugent.be/webtools/tapir/) [59] and psRNATarget (http://plantgrn.noble.org/psRNATarget/) [60] by simultaneously uploading the miR172 mature sequence and euAP2 gene sequence with default parameters. Finally, the potential targets predicted by both servers with one or two AP2 conserved domains were selected as candidate target genes.
Chromosome positional information for the euAP2 and miR172 genes was investigated by using the B. napus database (http://www.genoscope.cns.fr/brassicanapus/). The MapChart version 2.2 was used to map the euAP2 and Bna-miR172 genes [61].
Phylogenetic and Ka/Ks analysis
Multiple sequence alignments of the protein sequences of the euAP2 family genes and the precursor sequences of miR172 were performed by ClustalW with default parameters [62]. The aligned sequences were then used to construct a neighbour-joining (NJ) tree by MEGA version 6.0 [63] with 1000 bootstrap replicates and pairwise deletion. The iTOL website (https://itol.embl.de/) was used to better visualize the phylogenetic tree [64]. The orthologous and paralogous relationships for AP2 genes were inferred from the phylogenetic tree [65, 66]. The non-synonymous (Ka) and synonymous substitution rates (Ks) were calculated using DnaSp V6 software. Finally, the selection pressure experienced by gene pairs was assessed based on the Ka/Ks ratio [67].
Duplicated type and synteny analyses of euAP2s in B. napus and other species
The Multiple Collinearity Scan toolkit (MCScanX) was adopted to analyse the gene duplication events, with the default parameters [68]. To demonstrate the synteny relationship of AP2 genes obtained from B. napus and the three other species, syntenic analysis maps were constructed using Dual Synteny Plotter software (https://github.com/CJ-Chen/TBtools) [69].
Analysis of exon–intron structure and motifs of euAP2 genes
The exon-intron structures of the Brassica euAP2 family genes were obtained by aligning coding sequences (CDSs) with their corresponding genomic sequences. The diagrams of exon–intron structure were created using the online Gene Structure Display Server (GSDS 2.0: http://gsds.cbi.pku.edu.cn) [70].
The sequence logo of the euAP2 domains was plotted by WebLogo (http://weblogo.berkeley.edu/logo.cgi). A conserved motif analysis within the determined euAP2 family was performed by the MEME program (http://meme-suite.org/) with the following parameters: optimum width, 6–300 amino acids; number of repetitions of a motif, any; and maximum number of motifs, 10 [71]. The motif sequence annotations were analysed by InterPro (https://www.ebi.ac.uk/interpro/beta/) [72].
Analysis of cis-acting elements in the B. napus miR172 and euAP2 gene promoters
The 1.5 kb upstream of the predicted transcription start site of Bna-miR172 precursor sequences and 1 kb upstream sequences of the euAP2 transcription start site were selected as the promoter regions. The intercepted promoter region was analysed for cis-regulatory elements using PlantCare (http://bioinformatics.psb.ugent.be/webtools/plantcare/html/) [73].
Plant materials
The RNA-seq data were generated from 13 different tissues of the sequenced B. napus var. Zhongshuang 11 (ZS11) from the Oil Crop Research Institute, CAAS (root, stem, calyx, petal, pistil and stamen collected during the full-bloom stage, young leaves from the seedling stage, bud stage, early flowering stage, full-flowering stage, and 10 d, 24 d, and 30 d after flowering) (BioProject ID, PRJNA358784). The extremely early- and late-flowering materials were selected from the recombinant inbred line (RIL) constructed by our laboratory [74]. The flowering time of them were listed in Additional file 5: Table S5. The expression data from shoot tissues (S) and leaves (L) of early-flowering bulk materials (18Z43, 18Z71 and 18Z134) and late-flowering bulk materials (18Z44, 18Z88 and 18Z163) at the vegetative stage were collected, and the accession number was SRP108958. In addition, RNA-seq data from the juvenile leaves of early-flowering material (18Z134) and late-flowering material (18Z88) at the vegetative and reproductive stages were also analysed and the accession number was PRJNA540020. Two independent biological replicates were analyzed per sample. The transcript abundance of the euAP2 genes was calculated using fragments per kilobase of exon model per million mapped reads (FPKM). The log2-transformed FPKM values were used to study euAP2 gene expression (Additional file 6: Table S6).
Tissue-specific expression analysis
ZS11, 18Z134 and 18Z88 were used for the expression analysis. Five vegetative tissues (root, stem, leaf, flower, and bud) and four floral organs (sepal, petal, stamen and pistil) were collected at the same developmental stage for the qRT-PCR. All plant materials were planted in the experimental field of Southwest University, Chongqing, China.
Total RNA was extracted from all samples with an RNAeasy extraction kit (Invitrogen, Carlsbad, CA, USA) according to the manufacturer’s instructions. The quality of RNA was assessed using an Agilent 2100 Bioanalyzer (Agilent, Böblingen, Germany) and examined through electrophoresis on a 1.5% agarose gel. For qRT-PCR, 1 μg of RNA was reverse transcribed into first-strand cDNA using a SuperScript™ First-Strand Synthesis System III (Invitrogen). Quantitative real-time PCR was performed with SYBR Green PCR Supermix on a real-time PCR machine (Bio-Rad, Hercules, CA, USA). The relative gene expression levels were calculated using the 2−ΔΔCt method, with BnaACTIN7 used as an internal control [75]. The qPCR primers are listed in Additional file 7: Table S7. At least two biological replicates were used, with three technical replicates performed for each sample.
Availability of data and materials
All supporting data can be found within the manuscript and its additional supporting files.
Abbreviations
- AP2 :
-
APETALA2
- CRE:
-
Cis-regulatory elements
- FPKM:
-
Fragments per kilobase of exon per million fragments mapped
- Ka:
-
The ratio of the number of nonsynonymous substitutions per non-synonymous site
- Ka/Ks:
-
The nonsynonymous/synonymous substitution ratio
- Ks:
-
The ratio of the number of synonymous substitutions per synonymous site
- MRE:
-
MiRNA response element
- qRT-PCR:
-
quantitative real-time polymerase chain reaction
- SMZ :
-
SCHLAFMUTZE
- SNZ :
-
SCHNARCHZAPFEN
- TOE :
-
TARGET OF EAT 1
- WGD:
-
whole genome duplication
References
Bartel D. MicroRNAs: genomics, biogenesis, mechanism, and function. Cell. 2007;116:281–97.
Curaba J, Singh MB, Bhalla PL. miRNAs in the crosstalk between phytohormone signalling pathways. J Exp Bot. 2014;65(6):1425.
Aukerman MJ, Sakai H. Regulation of flowering time and floral organ identity by a microRNA and its APETALA2-like target genes. Plant Cell. 2003;15(11):2730–41.
Palatnik JF, Allen E, Wu X, Schommer C, Schwab R, Carrington JC, Weigel D. Control of leaf morphogenesis by microRNAs. Nature. 2003;425(6955):257.
Fujii H, Chiou TJ, Lin SI, Aung K, Zhu JK. A miRNA involved in phosphate-starvation response in Arabidopsis. Curr Biol. 2005;15(22):2038–43.
Zhao B, Ge L, Liang R, Li W, Ruan K, Lin H, Jin Y. Members of miR-169 family are induced by high salinity and transiently inhibit the NF-YA transcription factor. BMC Mol Biol. 2009;10(1):1–10.
Huijser P, Schmid M. The control of developmental phase transitions in plants. Development. 2011;138(19):4117–29.
Poethig RS. Small RNAs and developmental timing in plants. Curr Opin Genet Dev. 2009;19(4):374–8.
Fornara F, Coupland G. Plant phase transitions make a SPLash. Cell. 2009;138(4):625–7.
Chuck G, Hake S. Regulation of developmental transitions. Curr Opin Plant Biol. 2005;8(1):67–70.
Zhou CM, Wang JW. Regulation of flowering time by microRNAs. J Genet Genomics. 2013;40(5):211–5.
Spanudakis E, Jackson S. The role of microRNAs in the control of flowering time. J Exp Bot. 2014;65(2):365–80.
Srikanth A, Schmid M. Regulation of flowering time: all roads lead to Rome. Cell Mol Life Sci. 2011;68(12):2013–37.
Wang JW, Czech B, Weigel D. MiR156-regulated SPL transcription factors define an endogenous flowering pathway in Arabidopsis thaliana. Cell. 2009;138(4):738–49.
Wu G, Park MY, Conway SR, Wang JW, Weigel D, Poethig RS. The sequential action of miR156 and miR172 regulates developmental timing in Arabidopsis. Cell. 2009;138(4):750–9.
Yamaguchi A, Wu MF, Yang L, Wu G, Poethig RS, Wagner D. The microRNA-regulated SBP-box transcription factor SPL3 is a direct upstream activator of LEAFY, FRUITFULL, and APETALA1. Dev Cell. 2009;17(2):268–78.
Wu G, Poethig RS. Temporal regulation of shoot development in Arabidopsis thaliana by miR156 and its target SPL3. Development. 2006;133(18):3539–47.
Mathieu J, Yant LJ, Mürdter F, Küttner F, Schmid M. Repression of flowering by the miR172 target SMZ. PLoS Biol. 2009;7(7):e1000148.
Zhu QH, Helliwell CA. Regulation of flowering time and floral patterning by miR172. J Exp Bot. 2011;62(2):487–95.
Park W, Li J, Song R, Messing J, Chen X. CARPEL FACTORY, a dicer homolog, and HEN1, a novel protein, act in microRNA metabolism in Arabidopsis thaliana. Curr Biol. 2002;12(17):1484–95.
Schmid M, Uhlenhaut NH, Godard F, Demar M, Bressan R, Weigel D, Lohmann JU. Dissection of floral induction pathways using global expression analysis. Development. 2003;130(24):6001–12.
Chen X. A microRNA as a translational repressor of APETALA2 in Arabidopsis flower development. Science. 2004;303(5666):2022–5.
Okamuro JK, Caster B, Villarroel R, Montagu MV, Jofuku KD. The AP2 domain of APETALA2 defines a large new family of DNA binding proteins in Arabidopsis. Proc Natl Acad Sci U S A. 1997;94(13):7076–81.
Jung JH, Seo YH, Seo PJ, Reyes JL, Ju Y, Chua NH, Park CM. The GIGANTEA-regulated microRNA172 mediates photoperiodic flowering independent of CONSTANS in Arabidopsis. Plant Cell. 2007;19(9):2736–48.
Martin A, Adam H, Díazmendoza M, Żurczak M, Gonzálezschain ND, Suárezlópez P. Graft-transmissible induction of potato tuberization by the miR172. Development. 2009;136(17):2873–81.
Jung JH, Seo PJ, Kang SK, Park CM. MiR172 signals are incorporated into the miR156 signaling pathway at the SPL3/4/5 genes in Arabidopsis developmental transitions. Plant Mol Biol. 2011;76(1–2):35.
Yant L, Mathieu J, Dinh TT, Ott F, Lanz C, Wollmann H, Chen X, Schmid M. Orchestration of the floral transition and floral development in Arabidopsis by the bifunctional transcription factor APETALA2. Plant Cell. 2010;22(7):2156–70.
Lauter N, Kampani A, Carlson S, Goebel M, Moose SP, Freeling M. MicroRNA172 down-regulates glossy15 to promote vegetative phase change in maize. Proc Natl Acad Sci U S A. 2005;102(26):9412–7.
Zhu QH, Upadhyaya NM, Gubler F, Helliwell CA. Over-expression of miR172 causes loss of spikelet determinacy and floral organ abnormalities in rice ( Oryza sativa ). BMC Plant Biol. 2009;9(1):149.
Mlotshwa S, Yang Z, Kim Y, Chen X. Floral patterning defects induced by Arabidopsis APETALA2 and microRNA172 expression in Nicotiana benthamiana. Plant Mol Biol. 2006;61(4–5):781–93.
Nair SK, Wang N, Turuspekov Y, Pourkheirandish M, Sinsuwongwat S, Chen GX, Sameri M, Tagiri A, Honda I, Watanabe Y. Cleistogamous flowering in barley arises from the suppression of microRNA-guided HvAP2 mRNA cleavage. Proc Natl Acad Sci U S A. 2010;107(1):490–5.
Chalhoub B, Denoeud F, Liu S, Parkin IAP, Tang H, Wang X, Chiquet J, Belcram H, Tong C, Samans B. Early allopolyploid evolution in the post-Neolithic Brassica napus oilseed genome. Science. 2014;345(6199):950–3.
Nova-Franco B, Íñiguez LP, Valdés-López O, Alvarado-Affantranger X, Leija A, Fuentes SI, Ramírez M, Paul S, Reyes JL, Girard L. The micro-RNA172c-APETALA2-1 node as a key regulator of the common bean-rhizobium etli nitrogen fixation symbiosis. Plant Physiol. 2015;168(1):273–91.
Fahlgren N, Carrington JC. MiRNA target prediction in plants. Methods Mol Biol. 2010;592:51–7.
Cannon SB, Mitra A, Baumgarten A, Young ND, May G. The roles of segmental and tandem gene duplication in the evolution of large gene families in Arabidopsis thaliana. BMC Plant Biol. 2004;4(1):10.
Hernandez-Garcia CM, Finer JJ. Identification and validation of promoters and cis -acting regulatory elements. Plant Sci. 2014;217-218(1):109–19.
Nakano T, Suzuki K, Fujimura T, Shinshi H. Genome-wide analysis of the ERF gene family in Arabidopsis and Rice. Plant Physiol. 2006;140(2):411.
Tang M, Li G, Chen M. The phylogeny and expression pattern of APETALA2 -like genes in Rice. J Genet Genomics. 2007;34(10):930–8.
Song X, Li Y, Hou X. Genome-wide analysis of the AP2/ERF transcription factor superfamily in Chinese cabbage ( Brassica rapa ssp. pekinensis ). BMC Genomics. 2013;14(1):573.
Song X, Wang J, Ma X, Li Y, Lei T, Wang L, Ge W, Guo D, Wang Z, Li C. Origination, expansion, evolutionary trajectory, and expression bias of AP2/ERF superfamily in Brassica napus. Front Plant Sci. 2016;7(307):1186.
Owji H, Hajiebrahimi A, Seradj H, Hemmati S. Identification and functional prediction of stress responsive AP2/ERF transcription factors in Brassica napus by genome-wide analysis. Comput Biol Chem. 2017;71:32.
Gilhumanes J, Pistón F, Martín A, Barro F. Comparative genomic analysis and expression of the APETALA2-like genes from barley, wheat, and barley-wheat amphiploids. BMC Plant Biol. 2009;9(1):66.
Zhuang J, Cai B, Peng RH, Zhu B, Jin XF, Xue Y, Gao F, Fu XY, Tian YS, Zhao W. Genome-wide analysis of the AP2/ERF gene family in Populus trichocarpa. Febs Open Bio. 2015;5(1):132–7.
Zhang G, Chen M, Chen X, Xu Z, Guan S, Li LC, Li A, Guo J, Mao L, Ma Y. Phylogeny, gene structures, and expression patterns of the ERF gene family in soybean (Glycine max L.). J Exp Bot. 2008;59(15):4095–107.
Rhoades MW, Reinhart BJ, Lim LP, Burge CB, Bartel B, Bartel DP. Prediction of plant microRNA targets. Cell. 2002;110(4):513–20.
Jofuku KD, Boer BGD, Montagu MV, Okamuro JK. Control of Arabidopsis flower and seed development by the homeotic gene APETALA2. Plant Cell. 1994;6(9):1211–25.
Zhuang J, Zhu B. Analysis of Brassica napus ESTs: gene discovery and expression patterns of AP2/ERF-family transcription factors. Mol Biol Rep. 2014;41(1):45–56.
Irish VF, Sussex IM. Function of the apetala-1 gene during Arabidopsis floral development. Plant Cell. 1990;2(8):741–53.
Bowman JL, Alvarez J, Weigel D, Meyerowitz EM, Smyth DR. Control of flower development in Arabidopsis thaliana by APETALA1 and interacting genes. Development. 1993;119(3):721–43.
Schultz EA, Haughn GW. Genetic analysis of the floral initiation process (FLIP) in Arabidopsis. Development. 1993;119(3):745–65.
Kunst L, Klenz JE, Martinez-Zapater J, Haughn GW. AP2 gene determines the identity of perianth organs in flowers of Arabidopsis thaliana. Plant Cell. 1989;1(12):1195–208.
Bowman JL, Smyth DR, Meyerowitz EM. Genes directing flower development in Arabidopsis. Plant Cell. 1989;1(1):37–52.
Lohmann JU, Weigel D. Negative regulation of the Arabidopsis homeotic gene AGAMOUS by the APETALA2 product. Cell. 1991;65(6):991–1002.
Letunic I, Doerks T, Bork P. SMART 7: recent updates to the protein domain annotation resource. Nucleic Acids Res. 2012;40(Database issue):302–5.
Finn RD, Bateman A, Clements J, Coggill P, Eberhardt RY, Eddy SR, Heger A, Hetherington K, Holm L, Mistry J. Pfam: the protein families database. Nucleic Acids Res. 2014;42(Database issue):222–30.
Gasteiger E, Hoogland C, Gattiker A, Duvaud SE, Wilkins MR, Appel RD, Bairoch A. Protein identification and analysis tools on the ExPASy server: Humana press; 2005.
Kozomara A, Griffithsjones S. MiRBase: annotating high confidence microRNAs using deep sequencing data. Nucleic Acids Res. 2014;42(Database issue):D68.
Zuker M. Mfold web server for nucleic acid folding and hybridization prediction. Nucleic Acids Res. 2003;31(13):3406–15.
Bonnet E, He Y, Billiau K, Van YDP. TAPIR, a web server for the prediction of plant microRNA targets, including target mimics. Bioinformatics. 2010;26(12):1566–8.
Dai X, Zhao PX. PsRNATarget: a plant small RNA target analysis server. Nucleic Acids Res. 2011;39:W155.
Voorrips RE. MapChart: software for the graphical presentation of linkage maps and QTLs. J Hered. 2002;93(1):77–8.
Larkin MA, Blackshields G, Brown NP, Chenna R, Mcgettigan PA, Mcwilliam H, Valentin F, Wallace IM, Wilm A, Lopez R. Clustal W and Clustal X version 2.0. Bioinformatics. 2007;23(21):2947–8.
Tamura K, Peterson D, Peterson N, Stecher G, Nei M, Kumar S. MEGA5: molecular evolutionary genetics analysis using maximum likelihood, evolutionary distance, and maximum parsimony methods. Mol Biol Evol. 2011;28(10):2731.
Letunic I, Bork P. Interactive tree of life (iTOL) v3: an online tool for the display and annotation of phylogenetic and other trees. Nucleic Acids Res. 2016;44:W242–5.
Song A, Gao T, Li P, Chen S, Guan Z, Wu D, Xin J, Fan Q, Zhao K, Chen F. Transcriptome-wide identification and expression profiling of the DOF transcription factor gene family in Chrysanthemum morifolium. Front Plant Sci. 2016;7(164):199.
Yang Z, Wang X, Gu S, Hu Z, Xu H, Xu C. Comparative study of SBP-box gene family in Arabidopsis and rice. Gene. 2008;407(1):1–11.
Rozas J, Ferrer-Mata A, Sánchez-DelBarrio JC, Guirao-Rico S, Librado P, Ramos-Onsins SE, Sánchez-Gracia A. DnaSP 6: DNA sequence polymorphism analysis of large data sets. Mol Biol Evol. 2017;34(12):3299–302.
Wang Y, Tang H, DeBarry JD, Tan X, Li J, Wang X, Lee T-H, Jin H, Marler B, Guo H, et al. MCScanX: a toolkit for detection and evolutionary analysis of gene synteny and collinearity. Nucleic Acids Res. 2012;40(7):e49.
Tao X, Chen C, Li C, Liu J, Liu C, He Y. Genome-wide investigation of WRKY gene family in pineapple: evolution and expression profiles during development and stress. BMC Genomics. 2018;19(1):490.
Hu B, Jin J, Guo AY, Zhang H, Luo J, Gao G. GSDS 2.0: an upgraded gene feature visualization server. Bioinformatics. 2014;31(8):1296.
Bailey TL, Johnson J, Grant CE, Noble WS. The MEME suite. Nucleic Acids Res. 2015;43:W39–49.
Finn RD, Attwood TK, Babbitt PC, Bateman A, Bork P, Bridge AJ, Chang HY, Dosztányi Z, Elgebali S, Fraser M. InterPro in 2017—beyond protein family and domain annotations. Nucleic Acids Res. 2017;45(Database issue):D190–9.
Lescot M, Déhais P, Thijs G, Marchal K, Moreau Y, Peer YVD, Rouz P, Rombauts S. PlantCARE, a database of plant cis-acting regulatory elements and a portal to tools for in silico analysis of promoter sequences. Nucleic Acids Res. 2002;30(1):325–7.
Liu L, Qu C, Wittkop B, Yi B, Xiao Y, He Y, Snowdon RJ, Li J. A high-density SNP map for accurate mapping of seed fibre QTL in Brassica napus L. PLoS One. 2013;8(12):e83052.
Livak KJ, Schmittgen TD. Analysis of relative gene expression data using real-time quantitative PCR and the 2-ΔΔCt method. Methods. 2001;25(4):402–8.
Acknowledgements
We are grateful to Kun Lu from Southwest University for kindly providing us the expression data.
Funding
This work was supported by the National Natural Science Foundation of China (31771830, 31701335), National Key Research and Development Program of China (2016YFD0100202), the Fundamental Research Funds for Central Universities (XDJK2017A009), the Chongqing Science and Technology Commission (cstc2016shmszx80083) and the “111” Project (B12006). The funding body participated in the design of the study, provided experimental materials and funded the transcriptome analysis.
Author information
Authors and Affiliations
Contributions
WTY and LLZ conceived and designed the experiments; WTY conducted the data analysis and wrote the manuscript; LJN, XXF, and LK participated in drafting partial manuscript and revised the paper; JHJ and WJ performed phylogenetic analyses; PXK, CYR, GYM and TYC performed RNA extraction and qRT-PCR. All authors read and approved the final manuscript.
Corresponding author
Ethics declarations
Ethics approval and consent to participate
Not applicable.
Consent for publication
Not applicable.
Competing interests
The authors declare that they have no competing interests.
Additional information
Publisher’s Note
Springer Nature remains neutral with regard to jurisdictional claims in published maps and institutional affiliations.
Additional files
Additional file 1
: Table S1 The miR172 precursor and mature sequences identified in the B.napus genome. (XLSX 9 kb)
Additional file 2
: Table S2 Collinear euAP2 gene pairs among B. napus, Arabidopsis and its ancestor parents (B.rapa and B. oleracea). (XLSX 12 kb)
Additional file 3
: Table S3 Annotation of putative motifs of euAP2 proteins identified by MEME (XLSX 9 kb)
Additional file 4
: Table S4 Cis-regulatory elements predicted in the promoter region of Bna-miR172 and euAP2 genes (XLSX 11 kb)
Additional file 5
: Table S5 Flowering time of extreme material in 5 years of Chongqing (XLSX 9 kb)
Additional file 6
: Table S6 RNA-seq data of euAP2 genes in various tissues of ZS11 and in leaf and shoot tissues of early- and late-flowering lines (XLSX 15 kb)
Additional file 7
: Table S7 Primers used for qRT-PCR of euAP2 genes in B.napus (XLSX 10 kb)
Additional file 8
: Figure S1 Multiple sequence alignment of the bna-miR172 mature sequence and precursor sequence and its secondary structures. a Multiple sequence alignment of the bna-miR172 mature sequence; b Multiple sequence alignment of the bna-miR172 precursor sequence; c Secondary structures of the pre-miR172 sequence in B. napus. (TIF 4456 kb)
Additional file 9
: Figure S2 Phylogenetic tree and gene structure of euAP2 genes in B. napus. Subtree branch lines are coloured to indicate different clades. Blue boxes indicate untranslated 5′ and 3′ regions; yellow boxes indicate exons; black lines indicate introns. CDS, coding sequence; UTR, untranslated region. (TIF 1769 kb)
Additional file 10
: Figure S3 Expression profiles of euAP2 genes in the early- and late-flowering lines based on RNA-Seq data. Hierarchical clustering results are shown on the left of the heat map and the coloured scale bar on the right side of the map represents log2-transformed FPKM values. Every sample has two replications. a Expression profiles of euAP2 genes in leaf and shoot tissues. EL, leaves of early-flowering material; LL, leaves of late-flowering material; ES, shoot apical regions of early-flowering material; and LS, shoot apical regions of late-flowering material. b Expression profiles of euAP2 genes in leaves at the vegetative and reproductive stages. EV, leaves of early-flowering material at the vegetative stage; LV, leaves of late-flowering material at the vegetative stage; ER, leaves of early-flowering material at the reproductive stage; and LR, leaves of late-flowering material at the reproductive stage. (TIF 2402 kb)
Rights and permissions
Open Access This article is distributed under the terms of the Creative Commons Attribution 4.0 International License (http://creativecommons.org/licenses/by/4.0/), which permits unrestricted use, distribution, and reproduction in any medium, provided you give appropriate credit to the original author(s) and the source, provide a link to the Creative Commons license, and indicate if changes were made. The Creative Commons Public Domain Dedication waiver (http://creativecommons.org/publicdomain/zero/1.0/) applies to the data made available in this article, unless otherwise stated.
About this article

Cite this article
Wang, T., Ping, X., Cao, Y. et al. Genome-wide exploration and characterization of miR172/euAP2 genes in Brassica napus L. for likely role in flower organ development. BMC Plant Biol 19, 336 (2019). https://doi.org/10.1186/s12870-019-1936-2
Received:
Accepted:
Published:
DOI: https://doi.org/10.1186/s12870-019-1936-2