
Abstract
Although the theoretical framework on agglomeration externalities and the channels through which they influence the regional economy appear well established, the empirical evidence on their magnitude and impact has been rather ambiguous and inconclusive. Applying the concepts of related and unrelated variety to an interregional European dataset and using spatial panel analysis, this paper provides critical information on the type and functioning of agglomeration externalities in relation to regional heterogeneity in knowledge intensity and innovation. We demonstrate that modeling this regional heterogeneity in a spatial panel setting is a crucial condition for identifying the positive agglomeration effects of (un)related variety on regional growth. The outcomes have substantial implications for European regional policy: We argue that policies should be both conceptually enriched and more empirically informed.
1 Introduction
Since the work of Marshall (1920), scholars have devoted significant attention to agglomeration economies. While the theoretical framework on agglomeration externalities and the channels through which they influence the overall economy are well established (McCann and Van Oort 2009), the empirical evidence has been ambiguous and inconclusive. As the empirical debate seems to have reached a standstill, the introduction of the concepts of related and unrelated variety has resulted in a promising conceptual and empirical renewal in agglomeration studies (van Oort 2015). The main raison d’être for these two new concepts is that the dichotomy between specialization and diversification, as used predominantly in the literature (Beaudry and Shiffauerova 2009), cannot fully capture the complexity of agglomeration externalities. By giving a closer look at the sectoral composition of the economy and at the functional relatedness of various sectors, related and unrelated variety provide additional and critical information on the type and functioning of agglomeration externalities.
Frenken et al. (2007) first introduced this typology, in which sectoral diversity is split into related variety and unrelated variety in order to discriminate between sectors where proximity allows knowledge to move from one sector to another (related variety) and sectors in where ideas and skills are unlikely to spill over (unrelated variety). Following Frenken et al. (2007), in this paper within-sector related variety and between-sector unrelated variety are measured by sectoral decomposition (using entropy measurement), where employment in detailed four-digit industries is considered to be functionally related to their two-digit aggregates, while two-digit sectors themselves are mutually unrelated. In its basic meaning, related variety is conceptually related to innovative renewal, new market exploration and employment growth, while unrelated variety is linked to a portfolio effect that protects a region against unemployment spillovers across sectors. This breaks down the usual diversity conceptualization in two distinctive elements that have marked different outcomes. Regional specialization and clustering remain traditionally hypothesized to be attached to productivity growth (Kemeny and Storper 2014; Frenken et al. 2014).
Among the aspects that are not properly addressed in this burgeoning discussion are two that we take up in this paper. The first aspect concerns the divergent functioning of (un)related variety agglomeration externalities across European countries. European regional economic policy becomes increasingly place-based in character, fueling the need for comparative information on agglomeration externalities in European regions (Barca et al. 2012; McCann and Ortega-Argilés 2013; McCann 2015). As highlighted by Van Oort and Bosma (2013), contrary to place-neutral strategies (that rely on the agglomerative forces of the largest cities and metropolitan regions to attract talent and growth potential), place-based development strategists claim that the polycentric nature of European city-regions, each with its own peculiar characteristics and specialization in the activities to which it is best suited, creates fruitful urban variety, which optimizes economic development. This perspective implies that medium-sized European city-regions have not declined in importance relative to larger urban ones, a proposition that has indeed been indicated in monitoring publications (Dijkstra et al. 2013). Until now, however, there has been little empirical support for explanations of European city-region growth based on the concepts of related and unrelated variety and sectoral specialization [the exception being the study by Van Oort et al. (2014)]. Arguably, the 260 NUTS2 regions, as applied in this paper, capture the regional–urban economy of Europe (Combes and Overman 2004, pp. 2848–2850). Many quantitative studies on (un)related variety have focused on regions within a fixed number of countries.Footnote 1 Van Oort et al. (2014) conducted a first informative cross-sectional analysis of the impact of related and unrelated variety on economic growth in a selection of European regions. The advantages of a longitudinal analysis using panel data were clearly missed in that analysis, as was a full treatment of spatial dependence in the processes studied.
The second innovative aspect of our paper is therefore that it deals explicitly with important spatial dependence and spatial heterogeneity issues. Spatial heterogeneity of European regions becomes theoretically and policy-wise ever more important when looking at regions through the lenses of innovation policy and smart specialization (Foray 2015). The regionally varying degrees of industrial organization and institutional development are crucially related to different levels of technological progress (Rodríguez-Pose 2013). The effects of specialization and (un)related variety on regional economic growth will therefore be assessed in light of different levels of technological progress of European regions. The paper will resort to spatial panel data models. This relatively new econometric methodology, which at the best of our knowledge has not been used in this field yet, allows us to estimate not only the coefficients for each variable in the model, but also to account for spatial effects in the data.
We conclude that confirmation of the hypotheses concerning related variety, unrelated variety and specialization in relation to regional economic growth, is strongly dependent on the technological progress and (general) degree of innovativeness of regions. Without controlling for this spatial heterogeneity, our models do not provide convincing evidence for the hypotheses, as we find a statistically significant negative coefficient for related variety (regressed on employment growth), and nonsignificant coefficients for specialization (on productivity growth) and unrelated variety (on employment growth and unemployment growth). After introducing the technological regional regimes however, we find that related variety externalities do have a positive effect on the economic performance of a region, but only for areas that are more technologically advanced and are better endowed with knowledge and innovation. On the contrary, the portfolio effects of unrelated variety externalities do have no effect, or have a negative impact on performance of a region. In line with Hartog et al. (2012), this paper indicates that the mechanisms of related and unrelated variety are relevant, but that embedding in innovative regions ranking high in terms of knowledge and technological resources is crucial. This means that less knowledge-endowed regions in Europe have less chances for growth—questioning the strategic vision that those regions can catch-up via diversification of their economies (Foray 2015, p. 66; Dogaru et al. 2011).
The paper is further organized as follows. Section 2 will provide a selective overview of the literature on agglomeration economies, working toward the introduction of the concepts of related variety and unrelated variety on an interregional, European scale. Section 3 describes the hypotheses to be tested, the models and the methods that will be used. This is followed by a presentation of the variables and data in Sect. 4. Section 5 is devoted to the discussion of the estimations we obtained from our models. In our conclusions (Sect. 6), we summarize our main findings and use those insights to highlight policy implications and to suggest important areas to be explored in future research.
2 Agglomeration economies and the concepts of (un)related variety
Agglomeration economies can be defined as externalities, either positive or negative, emerging from the context in which an economic actor is located. Regarded as one of the most relevant factors explaining the differences in the performance of regional economies, agglomeration economies have been subject to extensive debate both in academia (McCann and Van Oort 2009) and in policy (Barca et al. 2012). The potentially beneficial effects of such externalities play an important role in shaping the location choices of economic actors and their interaction opportunities (Desrochers and Leppald 2011). Agglomeration economies represent a complex and multifaceted phenomenon, which is difficult to treat both in theoretical discussions and in empirical research (Rosenthal and Strange 2004).
Traditionally, agglomeration externalities have been conceived as either sector-related or urban-related economies of scale. Both of these conceptions can be further divided into static and dynamic externalities. As in our empirical analysis, we look at dynamic externalities, and we will not theoretically discuss in detail the static interpretation of agglomeration economies.
Sector-related externalities are typically named localization externalities, as opposed to the latter, which are referred to as urbanization externalities. Localization externalities derive from the concentration of a sector in a certain area. Theory suggests that as firms belonging to the same sector locate near one another, they accrue important benefits. Using common suppliers and taking advantage of pooled human capital allows these firms to reduce their production and transaction costs, increase their productivity and become more competitive (Kemeny and Storper 2014). These effects are often named static externalities, as the externalities and their impact on the location choice and productivity are temporarily co-occurrent. There is also a dynamic side of the localization economies: Firms belonging to the same sectors are also part of the same “cognitive” community, and hence, they can profit from exchanging knowledge and mutual learning opportunities. These knowledge and imitation effects develop over time and mostly affect the growth performance of firms. However, on a more aggregate level, these dynamics would prove to be beneficial also for the regional economy, fostering growth and development.
Differently, the effects of urbanization externalities emerge from the variety and diversity of the economic environment (Jacobs 1969). A diverse and densely inhabited setting, such as a metropolitan area, allows knowledge to be recombined substantially more than in specialized areas, thus spurring cross-fertilization of ideas and innovation. Thanks to the geographical proximity of firms from different sectors, cities can innovate more and experience higher growth rates. Beneficial effects associated with urbanization also emerge from cities’ wider variety of goods and consumption preferences (Glaeser and Mare 2001) and from their ability to attract better educated, more industrious and creative individuals (Rosenthal and Strange 2004). From a policy perspective, dynamic urbanization externalities allow a region to benefit and improve its performance by attracting different sectors and fostering diversity within its economy.
The striking contrast between these two lines of argument has fostered a large discussion on the question of whether specialization or diversity is the dominant driving force for regional growth. Despite the numerous empirical studies focused on this issue, the results are indecisive and open to discussion. There are two primary reasons for this plurality of results. First, from a conceptual perspective, while theory sharply distinguishes between localization and urbanization externalities, the reality is much more blurred. As various scholars have observed, specialization and diversity can coexist (Duranton and Puga 2000) and cities can also evolve and develop in both respects (O’Huallachain and Lee 2011). Second, from an empirical perspective, Beaudry and Shiffauerova (2009) suggest that varying methodologies, levels of aggregation and measurement lead to dissimilar results. This point has also been confirmed by the meta-analyses by Melo et al. (2009) and de Groot et al. (2009).
Given the lack of conclusive results in the debate over specialization and diversification, scholars have sought new conceptual frameworks (Van Oort et al. 2014). The ideas and arguments of the evolutionary economic geography (EEG) approach have gained particular attention, especially in light of the importance they attach to knowledge and innovation dynamics as drivers of the evolution of economic systems (Boschma and Martin 2010). Directly referring to a Schumpeterian view of capitalism as a restless system continuously moving and changing itself, scholars of the EEG school consider economies to be subject to constant, endogenous transformation. The evolutionary trajectory of an economy is defined on the basis of its internal features and characteristics. Precisely because of such endogenous change, the intangible assets and characteristics of the economy, such as knowledge and institutions, are crucial in driving its evolution (McCann and Van Oort 2009). Moreover, different forms of proximity are important in shaping the evolutionary process of an economy. In this sense, while geographical proximity is essential for collective learning (Boschma and Lambooy 1999), cognitive and cultural proximity are equally important for defining opportunities for knowledge to flow, be recombined, spur innovation and be used in productive processes (Boschma 2005).
The discussion of proximity has clarified that not all knowledge is equal. More “proximate” knowledge, from a cognitive rather than geographical perspective, is important, as it can move and can be recombined more easily across the economy. In this sense, in a highly specialized economy, knowledge will not naturally be recombined, as firms have access to the same pool of technical expertise. This might even lead to a situation of cognitive lock-in. Alternatively, when the cognitive distance between two sectors in a diversified economy is substantial, it is less likely that knowledge and ideas will be exchanged, as actors in the two sectors will not “speak the same language” (Breschi et al. 2003).
Reconsidering urbanization externalities on the basis of this understanding, Frenken et al. (2007) pointed out that complementarities have to be there in order for knowledge flows and recombination to bring about positive results. In their study, sectoral diversity is split into related variety and unrelated variety in order to discriminate between sectors where proximity allows knowledge to move from one sector to another (related variety) and sectors in where ideas and skills are unlikely to spill over (unrelated variety). Each of the two sides of variety has its advantages. Related variety allows for firms and organizations to access knowledge from complementary sectors and to recombine it into new products or process (Boschma 2005). As the level of knowledge-relatedness influences the opportunities for firms to innovate (Breschi et al. 2003), high levels of related variety are likely to have a positive effect on employment, as new goods and products will come into production. On the other hand, an economy with highly unrelated sectors will benefit from such diversification, in particular by being better protected against sectoral shocks (Frenken et al. 2007). At least in the short-run, a high level of unrelated variety is thus likely to be associated with lower unemployment growth. Besides, unrelated variety can also be linked to higher employment growth. While unemployment growth is not necessarily the inverse of employment growth (the employment rate may change due to people entering or leaving the labor market, and growth may also differ over regions and sectors), we consider the relation between unrelated variety and employment growth an important hypothesis to explore which was not explicitly considered in the theoretical framework setup by Frenken et al. (2007). Nonetheless, their framework proved to be very useful and it was applied in many empirical settings, in particular in regional analyses in European countries. In many cases, the results match the hypotheses, especially in terms of related variety, confirming that employment growth increases with high relatedness across sectors. Also at a wider pan-European level, the positive relation between related variety and employment growth was shown in a cross-sectional research setting (Van Oort et al. 2014).
Certain important issues were not fully addressed in these studies on related and unrelated variety. First, as nearly all of these papers focus on agglomeration economies within specific countries in Europe, the evidence and usefulness for European-wide regional development policies is limited. Typically advanced economies, such as those of the UK, Italy or the Netherlands, are used to test the variety hypotheses. As these are all knowledge-intensive economies, these studies may be biased with respect to where policies may be effective. Moreover, an aspect that is often neglected is the relationship between agglomeration economies and the overall level of economic development (de Groot et al. 2009). This paper assesses the relationship among variety, specialization and regional growth in a sample of European regions to test whether the hypotheses of Frenken et al. (2007) hold in a much more heterogeneous set of economically integrated regions, some of which are more technologically advanced than others.
Second, in their study of Finnish regions, Hartog et al. (2012) note that the impact of related variety on growth depends on the type of sectors considered. While, at an aggregate level, they do not find any effect of related variety on employment growth, focusing on (localized) high-tech sectors results in a positive effect. Building on this, we will investigate whether related variety and unrelated variety are important for growth, depending on the level of innovativeness and technological progress of the regional economy. The intuition is that externalities associated with knowledge spillovers and the introduction of innovative ideas are much more relevant in regions characterized by a knowledge-intensive economy.
Third, from the point of view of innovation and knowledge flows, related and unrelated variety should not be understood as opposed one to the other. In other words, while cognitive proximity clearly facilitates knowledge spillovers and new product development, it has been argued that it is through the recombination of knowledge from unrelated sectors that radical innovation occurs (Cainelli et al. 2014). Building on this, it should be expected that unrelated variety can have a positive effect on employment growth, and not only a negative effect on unemployment growth as suggested by Frenken et al. (2007).
Finally, while most of the research on agglomeration economies explicitly mentions spatial spillovers (Ciccone 2000; Martin et al. 2011; Boschma et al. 2011), few studies resort to spatial econometric models to fully account for spatial dependence in the data (Van Oort et al. 2014; Bishop and Gripaios 2010). In our analysis, we will use full spatial panel modeling, assessing whether spatial dynamics are present and controlling for spatial dependence that would otherwise make our estimates biased and inconsistent (LeSage 2008).
3 Hypotheses and econometric models
To address these three issues, we will apply and extend the framework of hypotheses advanced by Frenken et al. (2007) on a European level and employ a spatial panel approach. Specifically, the hypotheses we test are the following:
-
Hypothesis 1: related variety and employment growth are positively related due to knowledge spillovers across sectors and innovation dynamics induced by knowledge recombination;
-
Hypothesis 2a: unrelated variety and unemployment growth are negatively related, owing to portfolio effects associated with a diversified economy and dampened effects of sector-specific shocks;
-
Hypothesis 2b: unrelated variety and employment growth are positively related because of the technological breakthrough following the recombination of unrelated knowledge;
-
Hypothesis 3: specialization and productivity growth are positively related due to the cost reduction and efficiency gains achieved through localization externalities in specialized regions.
Further, following Hartog et al. (2012), we investigate another hypothesis:
-
Hypothesis 4: the effects of related and unrelated variety are more pronounced in economies more intensely exploiting knowledge and high technology, due to the greater availability of skills, know-how and human capital in these areas.
These five hypotheses will be tested applying spatial panel data models using NUTS-2 regions in Europe as observations. The first model tests hypotheses 1 and 2b, and hence, it uses employment growth as the dependent variable. The second model tests Hypothesis 2 and uses unemployment growth as the dependent variable. The third model tests Hypothesis 3 and uses productivity growth as the dependent variable. The formal structure of the models is the following:
where \(\Delta y_{it} \) is the growth of the employment rate, unemployment rate or productivity between time t and \(t+1\) and \(y_{it} \) is the same variable expressed in levels at time t.Footnote 2 Each of these models contains both individual fixed effects (\(\alpha _i )\) and time dummies (\(\tau _t )\). Additionally, all models include the three explanatory variables (related variety (\(\hbox {RVar}_{it} )\), unrelated variety (\(\hbox {UVar}_{it} )\) and specialization (\(\hbox {Spec}_{it} ))\) and control variables (\(\hbox {Control}_{it} )\).
The specification proposed in Eq. (1) does not include any spatial term. In order to directly account for geographical proximity, a spatial structure has to be imposed. We achieved this by specifying the spatial weight matrix W. Among the different methods that can be used to construct such a matrix (LeSage and Pace 2009), we opt for an inverse distance matrix with a critical cutoff. With d being the chosen cutoff, two regions are considered neighbors if the distance between them (\(d_{ij} )\) is lower than d; in this case, the inverse of \(d_{ij} \) is used as the entry in the spatial matrix. If two regions are not neighbors, the value in the weight matrix will be zero. In mathematical notation:
As is customary in spatial econometrics (Elhorst 2014), the spatial matrix is row standardized. The choice of weight matrix was made following the suggestions by LeSage (2014), namely to use a sparse connectivity structure and avoid complex decaying functions. With respect to the former suggestion, we introduce a cutoff at 500 kilometers to ensure a distance range sufficiently wide to reflect the dynamics of highly integrated regional economies. Ertur and Le Gallo (2003) construct European weight matrices with similar ranges using k-nearest definitions of 10, 15, 20 and 25. Concerning the decay function, we take the inverse of the distance between two regions, such that a close neighbor (\(d_{ix} \) close to 0) has a greater weight than one located farther away (\(d_{iz} \) close to d).
As the spatial dimension of the data can be included in the model in different ways, we choose the appropriate spatial specification performing the likelihood ratio tests devised by Debarsy and Ertur (2010). The aim of these tests is to select the most suitable spatial specification given the data and the spatial weight matrix. Excluding the spatial Durbin specification,Footnote 3 the most general specification we consider contains two spatial terms: one accounting for the spatial autoregressive process (i.e., spatial correlation in the dependent variable) and the other to control for spatial autocorrelation (i.e., spatial correlation in the residuals). In formal terms, a generic representation of this model is:
where \(\lambda Wy\) represents the spatial autoregressive term, while \(\rho Wu\) captures the autoregressive disturbances. In the spatial econometrics literature, this model is referred to as a SARAR model. When one of the spatial terms is not significant, the model can accordingly be reduced to a spatial error (SEM), which only includes the autoregressive error term, or a spatial lag (SAR) specification, which contains only the spatially lagged dependent variable (LeSage and Pace 2009).
With the same notation as in Eq. (3), we perform likelihood ratio (LR) tests on the following null hypotheses:Footnote 4
-
Joint test: LR1 tests whether both \(\lambda =\rho =0\);
-
Marginal tests: LR2 (and LR3) tests whether, assuming \(\lambda =0\) (\(\rho =0\)), \(\rho =0\) (\(\lambda =0\));
-
Conditional tests: LR4 (and LR5) considers whether, given \(\rho \ne 0\) (\(\lambda \ne 0\)), \(\lambda =0\) (\(\rho =0\)).
The results from the tests, reported in Table 1, indicate that for the three models the SEM specification is the most appropriate. The conditional test on \(\lambda \ne 0\) is never significant, so that be the existence of a spatial lag effect can be rejected.Footnote 5
The model represented in equation (1) has thus to be extended as follows:
With respect to Hypothesis 4, the same three models used for the first four hypotheses are re-estimated, but here, the sample is divided into different groups according to the level of technological progress in each region. To create these different regimes, we exploit the categorization of European regions made by Wintjes and Hollanders (2010), as discussed in the following section. The technological regimes are interacted with the variables in the models to assess how the variables of interest behave in regions belonging to different regimes. The regressions for each of the technological regimes are estimated simultaneously, and the spatial coefficients are common and jointly estimated (Bivand and Brunstad 2006). In contrast to the first three models, the cross-sectional fixed effects are replaced by the technological regime constants because both individual fixed effects and the regime variable are time invariant. Including both of them would then create collinearity problems.
4 Variables and data
In calculating related and unrelated variety, we applied the same approach as Frenken et al. (2007), using two entropy measures calculated on employment shares in 260 regions for 9 years in a panel setting (\(N=2340\)). Detailed sectoral information on the regions is needed to calculate these measures (obtained and aggregated from the firm-level ORBIS database collected by Bureau Van Dijk and discussed below). Using the progressive structure of the NACE classification of these employment data, from broader to finer groupings, we consider unrelated those sectors that belong to each of the 21 different sections of the classification (variation between sections). Simultaneously, detailed sectors within each of these sections are considered related to one another, precisely because they belong to the same section (and presumably share consumer and producer markets and production technologies).Footnote 6 The choice of using sections as cutoff for between and within level variation is made to capture the greatest amount of relatedness among sub-sectors as possible. For instance, firms manufacturing textile products and firms producing apparel belong to the same section (“C”) but to different NACE sub-sectors (divisions 13 and 14, respectively). An approach using divisions to compute related and unrelated variety would have considered these two sub-sectors to be unrelated, while they are actually rather similar.
The method introduced by Frenken et al. (2007) accounts for the entropy in the distribution of employment shares within each level of the industrial classification. Unrelated variety (\(\hbox {UVar}_{it} )\) is therefore the measure of entropy among the 21 NACE sections and can be calculated as:
where \(P_s \) represents the share of employment in section S over total employment in region i at time t. In a similar fashion, related variety (\(\hbox {RVar}_{it}\)) is measured as the weighted sum of entropy within each of the S sections in the classification. Specifically:
with
where \(p_d \) represents the employment share of division d over the total. Figure 1 depicts the spatial distribution of related and unrelated variety across the sample in 2004. As the maps clearly indicate, variety at high levels of aggregation exhibits no strong resemblance to variety at low levels, which strongly suggests that the choice of sector aggregation is not trivial. Unrelated variety appears to be a more urban regional feature than related variety with higher scores in London, Madrid, Paris and Eastern European urban regions.

Related and unrelated variety in European NUTS-2 regions (2004)
To measure specialization (\(\hbox {Spec}_{it}\)), we followed Cutrini (2010) and computed the Theil index. This measure is an entropy index for measuring dissimilarity, which we can interpret as an overall indication of regional relative specialization. In formal terms:
where \(x_{kit} \) represents the number of employees in sector k, in region i, at time t, while \(x_{kEUt}\) stands for the number of employees in sector k, across all the regions in the sample, at time t.
Ranging between 0, when location quotients are equally distributed across all sectors, and 1, denoting total concentration of employment in one sector, the \(Spec_{it} \) variable accounts for the deviations from the European average in the sectoral distribution of employment. The main drawback of using this specialization indicator is that, being a relative measure, it cannot account for the absolute size, which is arguably important in locaization externalities (Kemeny and Storper 2014). In this regard, while there are many ways to measure specialization (Nakamura and Morrison Paul 2009; Cutrini 2010), this global measure was proved to be a robust estimator in Van Oort et al. (2014)Footnote 7 and Thissen et al. (2013). Figure 2 depicts the spatial distribution of the specialization variable across European NUTS-2 regions in 2004. As mentioned above, we followed Wintjes and Hollanders (2010) to define the technological regimes in our sample (Table 2). In their analysis, different indicators of employment, human resources, technology, activity rates and the overall economic situation are used to divide EU regions into seven types of knowledge economiesFootnote 8. High-technology regional profiles are present in Southern Germany, London and the surrounding area, Paris, Toulouse, Scandinavian urban regions and Eastern European capital regions.
Following this approach, regions are ranked according to their capacities in terms of knowledge accessibility, knowledge absorption and knowledge diffusion. Building on this, we assign the regions in our sample into three technological regimes (“High technological regime”, “Medium technological regime” and “Low technological regime”), as shown in Table 1. The right-hand panel in Figure 2 depicts the spatial distribution of the regime variable in our sample. As the study by Wintjes and Hollanders (2010) did not include Norway, we also excluded the Norwegian regions from our econometric analysis. Missing data for Switzerland, Norway, Scotland and parts of Finland also forced us to exclude these regions.
In addition to the explanatory agglomeration (variety and specialization) variables and the regime variable, we also include the level (\(y_{it} )\) of the growth variable as regressor. For the model of related variety, this concerns the employment rate of region i at time t, while for the models of specialization and unrelated variety, gross value added (GVA) per hour and the unemployment rate will be used, respectively. While the use of the employment rate and unemployment rate is rather straightforward, we decided to use GVA per hour, as it represents a more precise measure of productivity that is not influenced by part-time jobs.
The model equation also contains \(\hbox {Control}_{it} \), a term that gathers the five control variables we include in our regressions. As for the other regressors, the control variables have values for every year from 2004 to 2012. Wage per employee variable (wage p.e.) is included in the regression to account for the level of individual income in the region. Following the literature on agglomeration externalities (e.g., Puga 2002), we introduce a variable for population density (Pop. dens.) to control for the economic size of a region, which might affect regional growth. In a similar fashion, the market potential (Mrkt pot.) variable is intended to capture the effects of demand from outside the region. The measure is calculated as the sum of per capita income in all the other regions inversely weighted by the geographical distance. As supply-side controls, we include variables for the level and quality of human capital (HC) among workers, measured as the percentage of the labor force over 25 having completed tertiary education and the share of population having attained upper secondary education (Sec. ed.).
Tables 3 and 4 report descriptive statistics. In Table 4, it is important to notice the high correlation between wage and GVA per hour. For this reason, we decide to only include the latter in the model of specialization to avoid collinearity problems during estimation.Footnote 9 With respect to the data, our sample gathers information on 260 NUTS-2 regions for the period from 2004 to 2012, inclusive. These regions belong to the first 27 member states of the EU and Norway. Some of the regions must be excluded due to either a systematic lack of data (Scottish regions) or changes in the borders of the regions (Finnish regions).
We primarily gather our data from three sources. GVA, the number of hours worked and most of the control variables are taken from Cambridge Econometrics regional databases. Human capital and the share of people with upper secondary education are instead taken from Eurostat. To calculate related variety, unrelated variety and specialization, we used the detailed firm-level information available from the ORBIS database compiled by Bureau Van Dijk. Finally, the employment rate, unemployment rate, human capital and the data on the geographical position of the regions come from Eurostat.
Intensive data cleaning and checking was necessary, especially concerning the (aggregation of) ORBIS data. Although these data have wide coverage, the ORBIS database does not contain information on all firms in Europe, as only firms providing information through yearly reports are included in the database. This implies that smaller firms are often under-reported or omitted. Besides, ORBIS does not allow to properly track entry and exit dynamics of firms. The simple aggregation of ORBIS data at regional level would therefore not provide a clear picture of employment levels in European regions. To partially correct for these shortcomings, we rescaled the values for employment aggregated from the ORBIS data in line with regional employment rates from Eurostat. While this re-addressed the value of the data, it left the proportion of employment across different sectors unchanged, and hence, the measures calculated from the data still mirror the sectoral distribution in the ORBIS database. In addition, we used linear interpolation to fill gaps in the data (in particular, those on human capital) which is necessary to ensure a perfectly balanced panel (Millo and Piras 2012).
5 Estimation and tests
The first part of this section addresses the results concerning the hypotheses on specialization and variety. The estimations concerning the first four hypotheses are reported in Table 5. The second part focuses on Hypothesis 4, stating that agglomeration externalities have different effects across the three technological regimes.
5.1 Fixed effects spatial panel models
Model 1—(Un)Related variety and employment growth The estimates for the first model are reported in the second column of Table 5. We hypothesize that related variety and employment growth are positively related. The results of our model contradict this hypothesis, as the coefficient of related variety is negative and significant. This implies that higher scores on related variety are associated with lower rather than higher employment growth. Also the positive effect of unrelated variety theorized in Hypothesis 2a does not find evidence in our estimates, since the UVar coefficient is not significant. Among the other variables, employment rate has positive and significant coefficient, implying that regions with higher employment and levels of income tend to experience higher employment growth. Surprisingly, both education-related variables and market potential variable have significant but negative coefficients.
Model 2—Unrelated variety and unemployment growth. The second model focuses on the relationship between unrelated variety and unemployment growth. In line with the reasoning of Frenken et al. (2007), we would expect a negative coefficient on unrelated variety, as higher unrelatedness should reduce the effects of sector-specific shocks. As reported in the third column of Table 5, the coefficient on UVar is positive but highly insignificant. The model yields a positive and insignificant coefficient also for RVar. Variables associated with economic conditions, such as unemployment rate and wages, reveal that regions with higher unemployment and higher wages tend to experience higher unemployment growth. It is also worth noting that variables linked to regional knowledge endowment have a negative and significant impact on unemployment growth: Regions with higher level of educated workforce and population tend to suffer less from unemployment growth.
Model 3—Specialization and productivity growth. The third model, in the last column of Table 5, is intended to investigate the relationship between specialization and productivity growth, which is expected to be positive. Our estimations indicate that the main explanatory variable has a negative significant coefficient. Both the coefficients of our measures of variety are instead insignificant. Nonetheless, GVA per hour is positive and significant, which implies that regions with higher levels of productivity tend to experience higher productivity growth. With respect to the control variables, the share of people having attained upper secondary education presents a positive significant coefficient.
5.2 Spatial panel models with technological regimes
The failure to confirm the hypotheses of the first three models may be explained by spatial heterogeneity within the sample. Introducing technological regimes might help to control for such heterogeneity and allows us to test Hypothesis 4. However, this implies certain changes to the sample, specification and tests. As mentioned above, Norwegian regions are excluded from these analyses, and rather than regional fixed effects we now apply regime fixed effects. With respect to the spatial specification, we retain those identified in the previous paragraphs, as the data-generating process did not change. Instead of testing the spatial form of the models, we use a Chow–Wald test to determine whether the coefficients in the models with regimes are different from a simple “pooled” model (Bivand and Brunstad 2006).
Model 4—Related variety and employment growth in a regime setting. Table 6 reports the results of the estimates from the model on related variety and employment growth. The Wald test applied to the model with the three regimes yields a significant result, suggesting that the inclusion of the regimes captures heterogeneity in the sample. With respect to the three variables of interest, the model captures significant differences across the three regimes. We note that the coefficient of related variety is positive and significantly related to employment growth in the regions belonging to the high technological regime, while it is not significant for the medium and low-technology regions. Besides, unrelated variety has a significant negative coefficient in the low regime, contradicting our hypothesis. This model clearly highlights how the effects of related variety differ according to regional level of technological progress: High levels of related variety in regions not well endowed with knowledge and technology may fail to produce effects. In contrast, regional economies with a strong focus on knowledge-intensive and innovative sectors benefit from sectoral relatedness in the form of employment growth.
Model 5—Unrelated variety and unemployment growth in a regime setting. The results from the model of unrelated variety’s effects on unemployment growth are presented in Table 7. The Wald test also supports the statistical significance of the regimes in this case. Regarding the estimated coefficients for the variables of interest, unrelated variety is statistically insignificant in the high- and low-technology regimes, while it is positive and significant for the medium-technology regime. This effect seems to be partially counterbalanced by the negative and significant coefficient for related variety. Besides, also the high-tech regions have a negative and significant coefficient in RVar. Again, these results indicate that differences in the level of technological development are associated with different effects of agglomeration externalities, though their dynamics are less clear-cut in this model.
Model 6—Specialization and productivity growth in a regime setting. In model 6 (Table 8), we study the impact of specialization on productivity growth across the three different regimes. The Wald test again suggests that the model with technological regimes is significantly different from a model with no regime. The main variable of interest, specialization, has a mildly significant relationship with productivity growth for the medium-tech regime. A marginally insignificant relation between specialization and productivity growth is found also in the low-tech group. Besides, the coefficients for related and unrelated variety exhibit remarkable significance. The former has a positive effect on productivity in low-tech regions, while the latter is associated with productivity growth in the high technological regime.
6 Conclusions
This paper investigated the effects of different types of dynamic agglomeration economies in relation to regional economic growth. We devoted particular attention to hypotheses introduced by Frenken et al. (2007) concerning related variety, unrelated variety and specialization. This study is the first to apply such an analysis to European regions using a spatial panel estimation approach. We are interested in the questions of whether empirical evidence previously obtained at the country level holds on a European scale and whether the endowment of technological and knowledge resources in the economy influence the functioning of agglomeration economies, as suggested by prior research (Hartog et al. 2012). To determine this, we introduced variety and specialization hypotheses that are tested using a panel of 260 NUTS-2 regions in Europe, including both highly developed economies (Germany, Sweden, The UK) and less advanced ones (Bulgaria, Romania, Greece, Southern Italy). Second, the impact of variety and specialization is studied in three technological regimes, defined according to the levels of technological progress and knowledge intensity of each region. Finally, the models are estimated using advanced spatial panel data models to capture and control for spatial dynamics in the data. Table 9 provides an overview of the six models presented in this paper.
As the top panel of Table 9 indicates, in the first three models we found no empirical evidence to support the hypotheses concerning related variety, unrelated variety and specialization. Unrelated variety did not produce any significant results, neither in model 1 nor in model 2. Instead, we found that related variety is inversely related to employment growth (Model 1) and, in a similar fashion, specialization is negatively related to productivity growth (Model 3). However, once we introduced technological regimes, the relationships changed drastically. For regions in the top technological regime, higher related variety is associated with higher employment growth (Model 4) and lower unemployment growth (Model 5). For these same regions, unrelated variety is also positively related to productivity growth (Model 6). In the other two regimes, the results are less clear: Low-tech regions only benefit from related variety in terms of productivity growth (Model 6); conversely, for the medium-technology regime, we obtained generally insignificant results, apart from specialization (Model 6) and related variety (Model 5).
These outcomes add important insights into the growing European diversification, specialization and economic growth debates—in both academia and policy. Diversity, and especially related variety, can have a positive effect on growth, but predominantly when the technological and knowledge endowment of the region is high. In other words, agglomeration economies have differential effects across regions in different regimes. The reason may be obvious: externalities associated with knowledge flows only “pay off” in economies that have a high stock of knowledge and technology. Prior research on the impact of related and unrelated variety was unable to longitudinally analyze this on a pan-European scale.
This conclusion bears important policy implications, suggesting that diversification by itself is not enough to reap the benefits of so-called Jacobs externalities. Investments in human capital, technological upgrading and R&D (the variables that define the high-technology regime) are preconditions for related and unrelated variety to have beneficial effects on the economy. Our results support the idea that, in order to be effective, policies have to consider the context and the features, such as the knowledge and technological endowment, in any (targeted) region. As agglomeration economies work differently in different areas, a one-size-fits-all plea for diversification and/or (smart) specialization alone is unlikely to work everywhere. This may be in contrast with beliefs that smart specialization and diversification strategiesFootnote 10 may work out positive for growth in all European regions. As Foray (2015, p. 65–66) formulates: “The smart specialization strategy seeks to avoid hindering relative positions between followers and leaders with the less advanced regions being locked into the development of applications and incremental innovations. (...) At the very least, a smart specialization strategy transforms less advanced regions to good followers (...) or even leaders, not in inventing the generic technology but in co-inventing applications. (...) Smart specialization is definitely not only for the best regions; just the opposite. It is a unique stairway to excellence for less developed and transition regions.” Our outcomes suggest that for less developed regions, the lack of high-tech preconditions may hamper its long-term development. Obviously, functional and economic network relations between transition and leading regions are much more complex than our spatial econometric panel modeling setup can capture (Thissen et al. 2013). “Grand” conclusions concerning the development opportunities of regions in relation to smart specialization and smart diversification may therefore be speculative when this complexity is not addressed.
Therefore, we believe that further investigation is required on several aspects in this field. The hypothesized relationship between unemployment growth and unrelated variety is not confirmed in our analyses. This finding suggests that national regulations and institutions in Europe cause the pan-European model to deviate from national models. Also, the hypothesis on the correlation of unrelated variety with employment growth does not hold in any of our specifications. More research is needed on the issue of resilience, portfolio effects and unrelated variety, which especially important in the current decade of economic crisis and recovery. In addition, future work should pay more attention to causality (i.e., whether variety induces development or whether developing regions create more variety), the testing of other types of spatial heterogeneity (e.g., university regions, capital regions), and the modeling of firm-level data to avoid spatial scale and selection processes. Recall that our analyses (also) do not address many of the critiques formulated in the meta-analyses on measurement and selection issues. Other important questions arise from our research. While we used spatial econometrics to control for spatial effects, we could not include spatially lagged covariates in our models. The values of our variety and specialization measures are aggregated at regional level and do not provide an indication of what sectors are actually driving the scores. These measures can therefore not be used as spatial regressors, as two similar scores in two neighboring regions might be due to highly different sectoral structures. Related to this is the notice that employment shares as a weight in our entropy measures may not estimate productive diversification opportunities adequately. As we conclude from our analyses, high-tech production environments may inhibit more value-added opportunities than employment-rich ones per se. Dealing with these issues might be methodologically challenging, but it could clarify the exact role of spatial proximity in agglomeration externalities. A second line of research is to consider other important sources of heterogeneity, such as differences in the level of institutional quality (Rodríguez-Pose 2013). Thirdly, incorporating functional and economic network structures in the panel estimations can shed light on productive unilateral and crisscross relations between leading and lagging regions.
Notes
Studies using the conceptualization of related and unrelated variety are reported for the Netherlands (Frenken et al. 2007), Great Britain (Bishop and Gripaios 2010, Essletzbichler 2015), Italy (Boschma and Iammarino 2009; Quatraro 2010; Antonietti and Cainelli 2011; Cainelli and Iacobucci 2012; Mameli et al. 2012), Germany (Brachert et al. 2011), Finland (Hartog et al. (2012)), Spain (Boschma et al. 2011, 2013) and the USA (Castaldi et al. 2013).
The equation thus represents a simultaneous model. While this might make the estimation problematic, we also estimate a lagged version of the model. As the results do not change between the two specifications and the time dimension is not long, we decided to use the simultaneous version.
The spatial Durbin model includes terms in which the W matrix interacts with the regressors. As our measures of related and unrelated variety does not provide information on the specific sectors making up each regional score (so that to similar values might be due to totally different sectoral structures), it would be unwise to use a spatial Durbin specification.
These tests are performed sequentially from LR1 to LR5. Using the joint test, we assess whether any significant spatial effect is present, against the hypothesis that both \(\lambda \) and \(\rho \) are 0. Through the marginal tests, we consider whether the spatial effects captured by the joint test are due to only one of the spatial terms, under the assumption that the other is not statistically different from 0. Finally, when the marginal tests indicate that at least one of the spatial terms is different from 0, we assess whether the other also has a nonzero coefficient using the conditional tests.
As a robustness check, we estimated the model on employment growth as SARAR, but the \(\lambda \) was not statistically different from zero.
There are various ways to measure relatedness across regions and sectors. The method employed in this paper uses complementarities of sectors, administered within broader and refined sectors (Frenken et al. 2007). Other methods use co-occurrence and functional linkages between sectors (Hausmann and Hidalgo 2010) or relatedness flows, e.g., labor mobility (Neffke et al. 2011). More detailed data are required for the latter methods than is currently available at a European regional scale.
While we attempted to ensure comparability between our paper and Van Oort et al. (2014), marked differences exist. In particular, while we use employment shares to weight firms in regions and sectors (and controlling for the large-firm bias in the ORBIS data), Van Oort et al. use firm turnover stemming from a related but different database than ORBIS. Further, our sample of regions is considerably larger than that in Van Oort et al. (2014).
See the “Appendix” for additional details on the typology and indicators introduced by Wintjes and Hollanders (2010).
Fig. 2 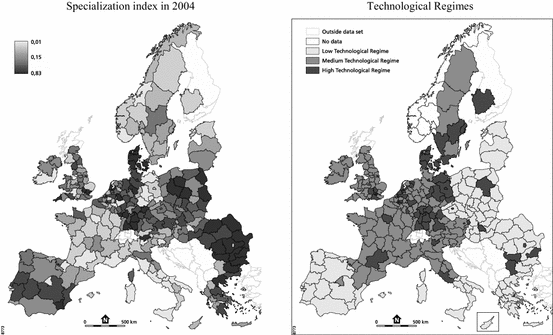
Sectoral specialization and technological regimes in European NUTS-2 regions
Further checks on multicollinearity have been performed using variance inflation factors.
Table 3 Descriptive statistics Table 4 Correlation table Related variety is a key component of smart specialization strategies, see Foray (2014, p. 29).

References
Antonietti R, Cainelli G (2011) The role of spatial agglomeration in a structural model of innovation, productivity and export. Ann Reg Sci 46:577–600
Barca F, McCann P, Rodriguez-Pose A (2012) The case for regional development intervention: place-based versus place-neutral approaches. J Reg Sci 52:134–152
Beaudry C, Shiffauerova A (2009) Who’s right, Marshall or Jacobs? The localization versus urbanization debate. Res Policy 38:318–337
Bishop P, Gripaios P (2010) Spatial externalities, relatedness and sector employment growth in Great Britain. Reg Stud 44(443):454
Bivand R, Brunstad R (2006) Regional growth in Western Europe: detecting spatial misspecification using the R environment. Papers Reg Sci 85:277–297
Boschma R (2005) Proximity and innovation: a critical assessment. Reg Stud 39:61–74
Boschma R, Iammarino S (2009) Related variety, trade linkages, and regional growth in Italy. Econ Geogr 85:289–311
Boschma R, Lambooy J (1999) Evolutionary economics and economic geography. J Evol Econ 9:411–429
Boschma R, Martin R (2010) The handbook of evolutionary economic geography. Edward Elgar, Cheltenham
Boschma R, Minondo A, Navarro M (2011) Related variety and economic growth in Spain. Papers Reg Sci 91:241–256
Boschma R, Minondo A, Navarro M (2013) The emergence of new industries at the regional level in Spain. A proximity approach based on product-relatedness. Econ Geogr 89:29–51
Brachert M, Kubis A, Titze M (2011) Related variety, unrelated variety and regional functions: identifying sources of regional employment growth in Germany from 2003 to 2008. IWH-Diskussionspapiere, No. 2011, 15
Breschi S, Lissoni F, Malerba F (2003) Knowledge-relatedness in firm technological diversification. Res Policy 32:69–87
Cainelli G, Fracasso A, Vitucci Marzetti G (2014) Spatial agglomeration and productivity in Italy: a panel smooth transition regression approach. Papers Reg Sci. doi:10.1111/pirs.12103
Cainelli G, Iacobucci D (2012) Agglomeration, related variety, and vertical integration. Econ Geogr 88:255–277
Castaldi C, Frenken K, Los B (2013) Related variety, unrelated variety and technological breakthroughs: an analysis of U.S. state-level patenting. Papers Evol Econ Geogr 13.02. Utrecht University, Utrecht
Ciccone A (2000) Agglomeration effects in Europe. Eur Econ Rev 46:213–227
Combes PP, Overman HG (2004) The spatial distribution of economic activities in the european union In: Thisse JF, Henderson V (eds) Handbook of Urban and Regional Economics, vol 4. North Holland pp. 2845–2910
Cutrini E (2010) Specialization and concentration from a twofold geographical perspective: evidence from Europe. Reg Stud 44:315–336
De Groot H, Poot J, Smit M (2009) Agglomeration externalities, innovation and regional growth: theoretical perspectives and meta-analysis. In: Capello R, Nijkamp P (eds) Handbook of regional growth and development theories. Edward Elgar, Cheltenham, pp 256–281
Debarsy N, Ertur C (2010) Testing for spatial autocorrelation in a fixed effects panel data model. Reg Sci Urban Econ 40:453–470
Desrochers P, Leppald S (2011) Opening up the ‘Jacobs spillovers’ black box: local diversity, creativity and the processes underlying new combinations. J Econ Geogr 11:843–863
Dijkstra et al (2013) The economic performance of European cities and city regions: myths and realities. Eur plan stud 21:334–354
Dogaru T, van Oort F, Thissen M (2011) Agglomeration economies in European regions: perspectives for objective-1 regions. J Econ Soc Geogr (TESG) 102:486–494
Duranton G, Puga D (2000) Diversity and specialisation in cities: why, where and when does it matter? Urban Stud 37:533–555
Elhorst P (2014) Spatial econometrics. Springer, Berlin
Ertur C, Le Gallo J (2003) An exploratory spatial data analysis of European regional disparities, 1980–1995. In: Fingleton B (ed) European regional growth. Springer, Heidelberg, pp 55–98
Foray D (2015) Smart specialization. Opportunities and challenges for regional innovation policy. Routledge, London
Frenken K, Cefis E, Stam E (2014) Industrial dynamics and clusters: a survey. Reg Stud 49:10–27
Frenken K, van Oort F, Verburg T (2007) Related variety, unrelated variety and regional economic growth. Reg Stud 41:685–697
Glaeser E, Mare D (2001) Cities and skills. J Labor Econ 19:316–342
Hartog M, Boschma R, Sotarauta M (2012) The impact of related variety on regional employment growth in Finland 1993–2006: high-tech versus medium/low-tech. Ind Innov 19:459–476
Hausmann R, Hidalgo C (2010) Country diversification, product ubiquity, and economic divergence. Working Paper Series rwp10-045, Harvard University, John F. Kennedy School of Government
Jacobs J (1969) The economy of cities. Random House, New York
Kemeny T, Storper M (2014) Is specialization good for regional economic development? Reg Stud 49:1003–1018
LeSage J (2008) An introduction to spatial econometrics. Revue d’économie Industrielle 123:19–44
LeSage J (2014) What regional scientists need to know about spatial econometrics. Soc Sci Res Netw. http://ssrn.com/abstract=2420725. Accessed 22 Oct 2014
LeSage J, Pace K (2009) Introduction to spatial econometrics. CRC Press, Boca Raton
Mameli F, Iammarino S, Boschma R (2012) Regional variety and employment growth in Italian labour market areas: services versus manufacturing industries. Papers in Evolutionary Economic Geography 12.03, Utrecht University
Marshall A (1920) Principles of economics: an introductory. Macmillan, London
Martin P, Mayer T, Mayneris F (2011) Spatial concentration and plant-level productivity in France. J Urban Econ 69:182–195
McCann P, Ortega-Argilés R (2013) Redesigning and reforming European regional policy: the reasons, the logic and the outcomes. Int Reg Sci Rev 36:424–445
McCann P, van Oort F (2009) Theories of agglomeration and regional growth: a historical review. In: Capello R, Nijkamp P (eds) Handbook of regional growth and development theories. Edward Elgar, Cheltenham, pp 19–32
McCann P (2015) The regional and urban policy of the european union. Edward Elgar, Cheltenham
Melo P, Graham D, Noland R (2009) A meta-analysis of estimates of agglomeration economies. Reg Sci Urban Econ 39:332–342
Millo G, Piras G (2012) splm: spatial panel data models in R. J Stat Softw 47:1–36
Nakamura R, Morrison Paul C (2009) Measuring agglomeration. In: Capello R, Nijkamp P (eds) Handbook of regional growth and development theories. Edward Elgar, Cheltenham, pp 305–327
Neffke F, Henning M, Boschma R (2011) How do regions diversify over time? Industry relatedness and the development of new growth paths in regions. Econ Geogr 87:237–265
O’Huallachain B, Lee D (2011) Technological specialization and variety in urban invention. Reg Stud 45:67–88
Puga D (2002) European regional policies in light of recent location theories. J Econ Geogr 2:373–406
Quatraro F (2010) Knowledge coherence, variety and economic growth: manufacturing evidence from Italian regions. Res Policy 39:1289–1302
Rodríguez-Pose A (2013) Do institutions matter for regional development? Reg Stud 47:1034–1047
Rosenthal S, Strange W (2004) Evidence on the nature and sources of agglomeration economies. In: Henderson JV, Thisse J (eds) Handbook of regional and urban economics. Elsevier, Amsterdam, pp 2119–2171
Thissen M, van Oort F, Diodato D, Ruijs A (2013) Regional competitiveness and smart specialization in Europe. Place-based development in international economic networks. Edward Elgar, Cheltenham
Van Oort F, Bosma N (2013) Agglomeration economies, inventors and entrepreneurs as engines of European regional productivity. Ann Reg Sci 51:213–244
Van Oort F, de Geus S, Dogaru T (2014) Related variety and economic growth in a cross-section of European urban regions. Eur Plan Stud. doi:10.1080/09654313.2014.905003
van Oort Frank (2015) Unity in variety? Agglomeration economics beyond the specialization-diversity controversy. In: Karlsson C, Andersson M (eds) Handbook of research methods and applications in economic geography. Edward Elgar, Cheltenham
Wintjes R, Hollanders H (2010) The regional impact of technological change in 2020-synthesis report. Brussels: European Commission, DG Regional Policy
Author information
Authors and Affiliations
Corresponding author
Appendices
Appendix 1: The data on technological regimes of regions
The variables used by Wintjes and Hollanders (2010) are grouped into five sets, described below:
-
Employment: including shares in specific NACE classes for high-tech manufacturing, medium–high-tech manufacturing, high-tech services and market services, as well as employment shares in Industry sectors (NACE from C to E), Service sectors (from G to K) and Government sectors (from L to P);
-
Human resources: including the share of employment in science and technology occupations and the share of the workforce with secondary and tertiary education;
-
Activity rates: activity rates for females, activity rates for individuals with tertiary education, and the share of long-term unemployed over total employment;
-
Technology: R&D as percentage of GDP, share of university R&D over total R&D, share of government R&D over total R&D, and EPO applications per million population;
-
Economy: capital formation as a percentage of GDP, labor productivity in Industry sectors and labor productivity in Service sectors.
These indicators are then used in a factor analysis and reduced to eight factors related to knowledge economies. The two authors studied these factors through a cluster analysis, allowing them to identify the seven typologies of knowledge economies into which they classify European regions.
Appendix 2: Regressions without control variables
Appendix 3: Major European cities

Rights and permissions
Open Access This article is distributed under the terms of the Creative Commons Attribution 4.0 International License (http://creativecommons.org/licenses/by/4.0/), which permits unrestricted use, distribution, and reproduction in any medium, provided you give appropriate credit to the original author(s) and the source, provide a link to the Creative Commons license, and indicate if changes were made.
About this article

Cite this article
Cortinovis, N., van Oort, F. Variety, economic growth and knowledge intensity of European regions: a spatial panel analysis. Ann Reg Sci 55, 7–32 (2015). https://doi.org/10.1007/s00168-015-0680-2
Received:
Accepted:
Published:
Issue Date:
DOI: https://doi.org/10.1007/s00168-015-0680-2