
Abstract
Predicting how changes to the urban environment layout will affect the spatial distribution of pedestrian flows is important for environmental, social and economic sustainability. We present longitudinal evaluation of a model of the effect of urban environmental layout change in a city centre (Cardiff 2007–2010), on pedestrian flows. Our model can be classed as regression based direct demand using Multiple Hybrid Spatial Design Network Analysis (MH-sDNA) assignment, which bridges the gap between direct demand models, facility-based activity estimation and spatial network analysis (which can also be conceived as a pedestrian route assignment based direct demand model). Multiple theoretical flows are computed based on retail floor area: everywhere to shops, shop to shop, railway stations to shops and parking to shops. Route assignment, in contrast to the usual approach of shortest path only, is based on a hybrid of shortest path and least directional change (most direct) with a degree of randomization. The calibration process determines a suitable balance of theoretical flows to best match observed pedestrian flows, using generalized cross-validation to prevent overfit. Validation shows that the model successfully predicts the effect of layout change on flows of up to approx. 8000 pedestrians per hour based on counts spanning a 1 km2 city centre, calibrated on 2007 data and validated to 2010 and 2011. This is the first time, to our knowledge, that a pedestrian flow model with assignment has been evaluated for its ability to forecast the effect of urban layout changes over time.
Introduction
Predicting how changes to the urban environment layout will affect the spatial distribution of pedestrian flows is important for numerous reasons. From a sustainable transport perspective, substitution of motorized trips with walking is not only beneficial for our ecological and carbon footprint (Cervero and Kockelman 1997; Frank and Pivo 1994), but also reduces congestion and air pollution, increases community cohesion (Cooper et al. 2014), and—in the face of an obesity crisis—improves public health (Handy 2005; Handy et al. 2002). Pedestrian footfall is also key to understanding town and city centre vitality and hence economic sustainability. UK policy (Department for Communities and Local Government 2009) stresses the importance of ‘linked trips’. The strengthening of retail planning policy and regulation in the decade that followed the National Planning Policy Framework (2012), resulted in retailer adaptation to ‘town centre first’ approaches. Since then academic research began to suggest a more positive impact for such developments than previously, and to show that such development can play an important positive role in anchoring small centres (Lambiri et al. 2017; Zacharias 1993) through enhancing vitality and viability. Viability relates to economic regeneration, the continuing ability of the town centre to attract new investment (Ravenscroft 2000) that demonstrates sustained profitability, and as such can be monitored via vacancy rate. Vitality on the other hand relates to the intensity of activities at various times of the day, and is usually measured by pedestrian flows (Department for Communities and Local Government 2014 paragraph 5). To this end, town centres have audited pedestrian volumes and their changes over time. Viability and vitality are interrelated and define a complex index of attractiveness of the city centre along other indicators such as land use diversity and demographic profile (Guimarães 2017). All of the above aims in public policy relate to complex phenomena in which spatial distribution of pedestrian flows constitutes only part of the picture, but an essential part nonetheless.
The effect of street space layout changes, such as space re-allocation and pedestrianisation, on pedestrian flows over time has been well documented (Gehl 2004). However, major changes in street layout such as urban block size/shape change and re-alignment are a rare and very costly occurrence in existing urban fabric, and their effects less well understood. The ability to model such major changes and predict their consequences on pedestrian flow is of interest to the many town centre stakeholders involved, and helpful to assist in effective urban planning and design. Pedestrian flow in an urban centre can be visualized as a set of complex paths joining, separating, and intersecting over the available street layout. Individual street links can experience higher or lower flow levels, as well as sedentary activity (Zacharias 2000). Pedestrian paths arise from a set of individual mental maps that unfold in the street layout, the individual traces aggregating to an emerging flow level pattern at pedestrian link level. These emerging aggregated behaviour patterns have an iterative effect on street layout design in the long term, since variable flow levels will contribute to vitality, land use change and vice versa—although in the current study we model only the shorter term effect of layout on flow.
Related work
The influence of generic street network layout properties such as number and type of intersections has received a renewed attention in the past two decades. Vehicular street networks have elicited various quantitative descriptions capturing generic and distinctive topologies and geometries (Boeing 2019; Cardillo et al. 2006; Newman 2006; Xie and Levinson 2007). Such network design characterisations have contributed to a quantitative understanding of urban network design and dependencies between topologies, intersections, urban densities and flow. For motorised vehicle travel time, speed and turn delays and resulting flow depend on network topology, intersection types and densities (Vitins and Axhausen 2016). Street network design analysis focusing on pedestrian flow (Ewing and Cervero 2010) has shown the importance of higher street and intersection density and 3-arm intersection shares (Vitins and Axhausen 2018). Strano et al. (2012) in a 200 year longitudinal study found that street layouts shift towards oblong and square parcel shapes in a dual process including network densification and four-arm intersection density which in turn would impact pedestrian flow level distribution.
The first attempts at town centre pedestrian modelling were proposed by Benham and Patel (1977) and Crask (1979). Town centre pedestrian models have since been developed in a variety of directions such as assuming or not a list to be bought (Borgers and Timmermans 1986, 2012, 2015; Dijkstra et al. 2009; Haklay et al. 2001; Zachariadis 2007; Zhu and Timmermans 2009). There are difficulties in reviewing and categorising the works done on pedestrian modelling and forecasting due to the heterogeneity of the published works, the diversity of motivations and goals for the research and the scales of representation e.g. from regional planning scale to corridor and sub-area scale to facility and development scale. Martinez-Gil et al. (2017), Kuzmyak et al. (2014), Aoun (2015)and Turner (2017) offer summaries of pedestrian demand modelling research approaches which broadly include three general categories: trip generation and flow, network simulation, and direct demand.
Direct demand models have the defining characteristic of substituting all four stages of a traditional transport model (trip generation, trip distribution, mode choice, route choice/assignment) with a single model attempting to explain flows as a function of sociodemographic and built environment variables. There is however, considerable variance within the literature on what this really means. Kuzmyak (2014) and Munira (2017), for example, review a number of models which predict flows on individual network links or intersections from these variables. Conversely, de Ortúzar and Willumsen (2011) applies a direct demand model to predict the inter-zonal flow matrix, including the inter-zonal cost and time matrices as independent variables as well as socio-demographics of each zone in each pair. The latter is therefore fundamentally different in that it includes a route assignment process in order to generate cost and time matrices; for the current paper we term this “direct demand (with) assignment”. Cooper (2017) makes the case that spatial network analysis based on betweenness (Freeman 1977) predicts flows which scale with urban density and can therefore be characterised as a direct demand model under Ortúzar’s definition, albeit extended to predict flows on links rather than inter-zonal matrices. The same can therefore be said of space syntax models based on choice (Hillier and Iida 2005; Raford and Ragland 2004).
Direct demand models without assignment, on the other hand, are now popular (Griswold et al. 2019; Kuzmyak et al. 2014). Their rise parallels studies that have examined the determinants of walking behaviors, and the specific role of the built environment on pedestrian mobility and volume distribution. Principal determinants of walking include population and employment density, land use diversity, design, distance to destinations, and distance to public transits; design measures include average block size, proportion of four-way intersections and intersections density, sidewalk coverage, average building setbacks, average street widths, numbers of pedestrian crossings, street trees or other physical variables that differentiate pedestrian-oriented environments from car-oriented ones (Ewing et al. 2014). These determinants have been successively conceptualized as the 3Ds (Cervero and Kockelman 1997) and the 5Ds (Ewing et al. 2014; Ewing and Cervero 2001, 2010). A review of the dimensions used in pedestrian Direct Demand model studies (Munira and Sener 2017) shows that most of the significant variables used, when reported, fall within the 5Ds categories with additional categories such as shown in Table 1.
Contribution and rationale
Absent of an assignment process, direct demand models do not capture a fundamental property of all network transportation: namely, that trips must necessarily proceed from an origin to a destination via a continuous chain of network links. Assignment models enforce this property by definition. Assignment-free direct demand models, by contrast, use spatial buffers to aggregate built environment characteristics of an area, which may mask the real environment that a pedestrian experiences when making a trip (Shatu et al. 2019). Hence, network characteristics such as improved pavement width, and sociodemographic characteristics such as higher population in a spatial buffer, will always lead to higher flow predictions even on network links which do not form part of any useful route—a result which is intuitively incorrect.
We therefore take a direct demand with assignment approach in which, in contrast to assignment-free direct demand models, the only independent variables used are themselves the output of an assignment process, while other built environment and demographic characteristics are incorporated as inputs to that assignment process. We achieve this using multiple variants of spatial network betweenness in a regression model, as per Cooper (2018) (discussed in detail in Methods, below). Yet, we still capture the strengths of assignment-free direct demand models as a range of the popular ‘5D’ variables, including distance, block size, intersection connectivity and density, sidewalk coverage and pedestrian crossings, are implicit in modelling density and assignment on the detailed pedestrian network used. Our purpose is to eschew use of abstracted design metrics such as urban block, face length and connectivity (Gärling and Gärling 1988), and replace them with reductionist consideration of individual routes through the detailed pedestrian network layout (as Sevtsuk et al. 2016 did with Euclidean accessibility), thus retaining the geometric constituents of pedestrian intelligible navigation in open large scale urban environments (Montello 1998, 2005). Our approach also addresses noted problems (Crane 2000; Frank and Engelke 2001) with the covariance of urban design variables, by using ridge regression.
To capture the design component of the pedestrian network, this study also departs from previous direct demand assignment flow models based on the axial map (described as space syntax (Raford and Ragland 2006, 2004)—these studies also include variables outside of the assignment model, which we avoid as discussed above). Axial map approaches have been criticised for lack of transparency (Kuzmyak et al. 2014; Raford 2010; Ratti 2004; Turner 2017). Instead we use for the first time, to our knowledge, a standard detailed pedestrian path centre line (Chiaradia 2014; Sun et al. 2019, 2017; Zhang and Chiaradia 2019). Pedestrian network mapping principles are given in the “Methods” section.
The principal ways in which our model diverges from existing literature, and hence its contribution, can therefore be viewed from multiple perspectives. From an assignment-free direct demand perspective, the contribution is to enhance such models (1) by forcing all variables to act via an assignment process on a detailed pedestrian network to more accurately capture the nature of transport, and spatial locations of relevant variables, with greater accuracy; (2) by dropping abstracted variables such as block size and instead capturing their effect via an assignment process on the detailed network. From a direct demand with assignment, or spatial network analysis perspective our contribution is to enhance existing pedestrian approaches by capturing a range of built environment variables more commonly associated with assignment-free direct demand modelling, but without violating the assignment paradigm, while also maintaining the computationally efficient calibration of an assignment-free direct demand model. We also use more sophisticated route assignment criteria than the pure angular or Euclidean metrics prevalent in that literature (Hillier and Iida 2005; Raford and Ragland 2004) and for the first time, an inelastic formulation of betweenness. Finally, from an urban planning and design perspective, combining built environment characteristics with route assignment creates a bridge between these disciplines and transport modelling (Ewing and Clemente 2013; Stangl 2019; Stangl and Guinn 2011).
The other major contribution is a longitudinal evaluation of model accuracy. Few published pedestrian models include an empirical test against observed pedestrian flow data, and those which do, invariably test model fit at a single point in time as a cross-sectional study. Longitudinal studies, which track response to changes over time, are considered more reliable (Greenhalgh 1997). A search of literature revealed two cases of models which track response of pedestrian flows to layout change over time (Borgers and Timmermans 2015; Teklenburg et al. 1993) yet neither of these attempt to predict post-layout-change flows based on pre-layout-change data—i.e., what an urban planner modelling flows through a potential new development would in fact be trying to do (Borgers and Timmermans is commendable in use of a hold-out data set for cross validation, but calibration is based on data from all years). The recording of pedestrian flows before and after a major change to the urban environment brings the opportunity to raise the bar to a natural experiment. Natural experiments have various definitions, all based around the general concept of seeking out real-life situations that in some way emulate laboratory conditions (Leatherdale 2019). The pre-post approach involves comparison of outcomes pre- and post-exposure to the intervention: although making the assumption that outcomes change only as a result of exposure to the intervention, the result is that the population partially serve as their own controls (Craig et al. 2017). We therefore seek to answer the question, “given a model calibrated on data prior to the change, can the effects of the change be predicted correctly?”. The study was conducted in simulated ex-ante fashion, in which we calibrated the model with reference only to data collected before the change, to mimic the working environment of live planning/design projects. Ex-post tests were used only for validation, not to revise the model. To our knowledge this is the first time any such model has been tested in this way. As well as testing the ability to predict changes over time, we also, using generalized cross-validation, test ability to extrapolate across space.
From a network analysis perspective, we can characterise our direct-demand-with-assignment model as Multiple Hybrid Spatial Design Network Analysis (MH-sDNA) based on use of betweenness (discussed further in the Methods section) as structural flow analyses. This could also be described as a point-of-interest type model with individual heterogeneity, as it computes paths for the trips of numerous individuals through the network with differing goals (trips to retail from various origins, and between retail) and various route preferences (accounted for by Monte Carlo randomization). A final alternative characterisation is that this is an agent model but without interaction between agents.
Data
The modelled area is Cardiff, the capital and largest city in Wales, UK. Cardiff has a population of around 350 thousand, or around 10% of the Welsh population. The population of Cardiff increased by 18% between 2001 and 2011. In terms of urban morphology and demographic characteristics it is typical of a medium size British city. Cardiff city centre (about 1 km2 in size) is bounded by urban morphology breaks, to the West, the river Taff, to the north the Bute Park, Cardiff Castle and Cardiff University Campus, to the East, Cardiff Bay to the valleys train tracks, to the south the London Swansea train track.
Cardiff’s capital city status and history means that it is a major top 15 retail and tourist destination in the UK. Over the past 10 years the city centre has undergone a major regeneration programme. A new shopping mall, St David’s Centre opened in 2009, streets were re-aligned, urban block size and shape changed and the surrounding shopping streets were pedestrianised (Guy 2010). The city centre also includes pedestrian only Victorian and Edwardian shopping arcades and a civic centre to the north which hosts the University, Law Courts and Government buildings. To the south of the city centre is the main bus station and Central railway station and there are a number of car parks to the north, east and south. Bordering the city centre to the south west is the national stadium for Wales, the Millennium Stadium, which opened in 1999.
Collection of pedestrian flow data was commissioned by Cardiff Council for most years between 1999 and 2011. This effort was commissioned for the purpose of examining retail footfall, meaning that pedestrian counting is limited to medium- to high-flow streets, up to approx. 8000 people per hour. Ideally to calibrate a footfall model, a stratified sample is required which also includes low-flow streets. By necessity we do without such data. We calibrate the pedestrian model to summer 2007, the last snapshot available before work on the St David’s Centre began in winter 2007. We test the model on the years 2010 and 2011, the only years available after completion of the development. Each year comprises data collected on Thursday evening, Friday, Saturday and Sunday daytimes (10 am–4 pm i.e. not including peak commuting times), between April and June, at 26–41 cordon points (the exact number varies each year and was 32, 37 in our calibration and test years respectively). The weather was recorded as warm and sunny for each year. As we focus on shopping counts, we model combined Friday and Saturday flows, excluding Thursday evening and Sunday as not being representative of typical optional city centre visit behaviour. The total number of pedestrians counted averaged approximately 45,000 on Fridays and 60,000 on Saturdays. In each year the trend over time of this data is shown in Fig. 1, and year-on-year correlations in Fig. 2. We take the year-on-year change in the mean to be caused by exogenous factors such as the 2008 financial crash and subsequent recovery, and therefore do not try to model changes in the mean. As overall levels of demand vary with economic conditions, we do not seek to model the overall level of demand but rather its spatial distribution, and thus we report success of model predictions as correlation (r2) which discards scale information, rather than mean square error which would preserve scale but principally be measuring factors external to the model. We can thus rule out an indirect linkage caused by external economic influence on both the overall levels of flow and the redevelopment project itself. As with any observational study, the possibility of other indirect dependencies cannot be entirely ruled out, but in the current context the test of predictive ability is the key to evaluation.

Cardiff city centre pedestrian survey data (only showing cordon points repeated across all years)

Correlations between counts of pedestrian behaviour year on year (for cordon points present in all years only). The pedestrian flow counts are stable over time with an overall average r = .90 despite successive changes to the town centre since 2000. This is the background pattern of correlation through which one year predicts another, which our model aims to improve on
Methods
Pedestrian network encoding
A pedestrian network is a topological map that contains the connectivity, Euclidean and geometric relationship between pedestrian path segments (e.g., sidewalk, crosswalk, and footpath), as well as characteristics such as path width. Pedestrian networks are needed in a variety of applications such as pedestrian navigation systems/services, urban planning (Karimi and Kasemsuppakorn 2013) and urban design. Different approaches to develop pedestrian network maps have been attempted (Elias 2007; Karimi and Kasemsuppakorn 2013). Given the reported effort, cost and complexity of automated generation in non-regular street patterns (Karimi and Kasemsuppakorn 2013), manual pedestrian network generation from digital maps with ground proofing is a popular approach (Chiaradia 2014; Sun et al. 2019). This method has been used in this paper with ArcGIS tools. A pedestrian centre path segment mapped as a link is any pathway between two junctions that allows pedestrians to pass and can be categorized into types such as: sidewalk, crosswalk, footpath, building public path (arcade, shopping mall main path), trail, pedestrian bridge, and tunnel. The vector data model maps complex spatial objects using simple graphical elements (points and lines) (Karimi and Kasemsuppakorn 2013), and is suitable for representing pedestrian networks. It is likely that in the future, crowdsourced pedestrian path centre line network map will become readily available (Bolten and Caspi 2019).
The authors used the GIS ready Historic OS Mastermap (Ordnance Survey 2017) in ArcGIS to re-draw the outdoor and indoor pedestrian network for 2007 and 2011. The network extends into the surrounding area via a 1.2 km buffer to serve as source for trips from the surroundings (classed as ‘everywhere’ under the definition of variables in Table 2). Using the background vector map and available floor plans, links and nodes of the pedestrian network were constructed by manual drawing. The following assumptions guided the pedestrian network mapping:
-
1.
Links were drawn with the assumption that path centreline is representative of pedestrian thoroughfare.
-
2.
Gradients in paths were ignored as Cardiff city centre has very low gradient and can be considered as mainly flat terrain.
-
3.
Given assumption 1, field surveys and publicly indoor displayed floor plans provide a fair indication of the real features of indoor pedestrian paths that function as quasi-public paths, such as traditional and new shopping arcades and malls.
-
4.
In streets which do not have formalised crossings, such as in residential areas, the pedestrian network is mapped as street centre lines between junctions (Fig. 3a). In residential areas, streets without crossings receive low traffic, hence for pedestrians it is easy to cross anywhere from one sidewalk to the opposite sidewalk.
Fig. 3 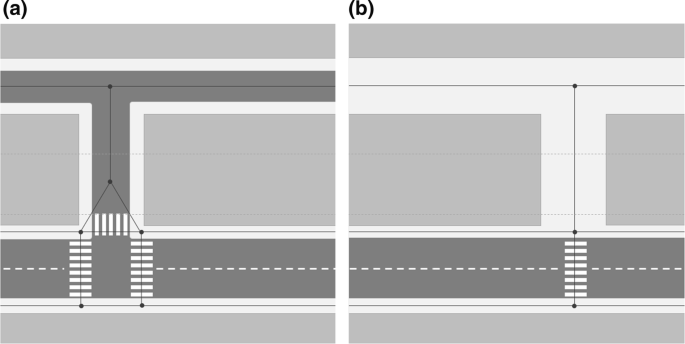
Principle of pedestrian network mapping—3a link and node: residential streets with low traffic and no formalised crossing linked to a street with formalised crossings; 3b link and node: pedestrianised streets linked to a street with formalised crossings
-
5.
In pedestrianised streets, the pedestrian network is mapped as street centre line between junctions as in residential areas (Fig. 3b).
-
6.
Streets with formalized crossings have sidewalks mapped individually. Linkage with streets mapped with road centre lines (from 4. above) is shown in Fig. 3a. The crossing is itself considered as a link because it is an area of interaction with vehicular traffic.
-
7.
All links necessarily have the following attributes: length, angular curvature changes along the link.

In city centres, consistent with the more recent 5Ds literature, Lausto and Murole (1974) showed the importance of retail and public transport service points; hence two nearby railway stations (Cardiff Central and Queen Street) were added to the network along with estimates of retail floor area.
Retail floor area was derived from business rates data. Business rates is the commonly used name in England and Wales of non-domestic rates, a tax on the occupation of non-domestic property. Rates information is held by the Valuation Office Agency (VOA), and data is queryable online via the tax.service.gov.uk website for the period 2010-2016. Information available includes the full address of the property, a free-text description of use of the property, the total taxable area (m2/unit), the price per area (m2/unit) and the current rateable value. Properties were extracted from the website for the Cardiff local authority area. Postcodes of properties were used in the Google Geocoding API address lookup service to retrieve an address point; where this was unavailable, the OS Open data postcode midpoint was used. The properties for Cardiff city centre were then extracted using the point data. The description of the use of the property in the dataset was used to identify retail and leisure outlets. String “fuzzy matching”, utilising the Levenshtein (1965) distance algorithm, was used to discover similar description of strings for grouping into retail types e.g. “pubs, public houses, nightclubs”. The floor area for each address point was summed to compute a floor area attribute for each network link. Carparks exceeding capacity of 500 spaces were also identified from the business rates data and added to the model.
The Business Rates data did not contain information on buildings that had been demolished before 2010, which included the re-developed area. Here building layout and floor area were reconstructed via other data sources including historic OS Mastermap, historic Google Earth, aerial photographs and local knowledge. The majority of retail floor area data is nonetheless derived from business rates records for buildings unchanged over the time period: other sources combined account for 4.4% of the floor area, .8% of the network length and 1.2% of network links (excluding network length and links with no retail). Figure 4 shows the before (baseline) and after (future condition) model of the St David’s 2 development.

Summary of changes to network, retail area, car parks and pedestrian flow measurement cordon points 2007-2010. Brown bars show green and red overlap i.e. links with unchanged retail area over the study period
Choice of distance metric
A wide variety of route assignment algorithms have been developed to represent route choice decision-making processes for pedestrians. Although route selection strategies are largely subconscious (Hill 1984), several researchers have formulated theories on this behaviour. Distance is not only an important factor on which route choice is based, it is also known to moderate the influences of other parameters on route choice (Ciolek 1978; Hill 1982). Khisty (1999) distinguishes between ‘perceived’ distance and ‘cognitive’ distance which include the assessment of the geometric complexity of the routes (directness). This is linked with the concept of visibility in that pedestrians tend to walk straight towards a visible destination, unless they are hindered by obstacles, other pedestrians, or diverted by other attractions. Verlander and Heydecker (1997) showed that 75% of pedestrians were taking the shortest path, but did not check whether the shortest Euclidean paths were also the paths showing least angular change (i.e. the shortest angular distance, or most direct paths) which is often the case (Zhang et al. 2015). More recently Shatu et al. (2019) showed in a route choice model that the least directional change route is a preferred option, and that pedestrians tend to minimise distance and maximise directness if they can. We therefore based our route assignment model on a hybrid of the shortest and most direct path, adding Monte Carlo randomization (de Ortúzar and Willumsen 2011, Sect. 10.4.1) to distribute assignment over paths of similar utility and hence account for variance caused by factors we are unable to measure.
Betweenness
The betweenness of a link, in simple terms, is a structural flow model obtained by summing the number of shortest paths from everywhere to everywhere that pass through that link (Freeman 1977). Originally developed for communication networks, it has been adapted to transport most notably by introducing a maximum distance constraint on the paths considered (Cooper 2015). Note that definitions of ‘shortest’ and ‘everywhere’ may vary according to the application. There is a history of using betweenness as a transport model to fit vehicle, pedestrian and cyclist flow data (Cooper 2018, 2017; Haworth 2014; Hillier and Iida 2005; Jayasinghe 2017; Law et al. 2014; Lowry 2014; Manum and Nordstrom 2013; Omer et al. 2017; Patterson 2016; Raford et al. 2007; Serra and Hillier 2017; Turner 2007). However, from a transport modeller’s perspective, to do so embeds a number of implicit assumptions which are not usually voiced; indeed, to replace the usual models of trip generation, trip distribution and mode choice with a simpler assumption that people travel indiscriminately from everywhere to everywhere, seems somewhat rash. Much of the above literature justifies this approach purely on grounds that it seems to fit the data well, but fit to current data does not guarantee predictive ability; to be useful, a model must extrapolate, either in space or time, to predict data not available during the fitting process. Without understanding why betweenness might work as a transport model there is a significant risk of misprediction.
Cooper (2017) noted that travel demand is correlated with network density (a relationship mediated, moderated and amplified in some cases by land use intensity), hence if we are willing to assume efficient use of the network in both land use and trip generation, then we can replace explicit modelling of land use and travel demand with a betweenness model based on network analysis alone. This is because the “everywhere to everywhere” trips of a betweenness model are in fact “everywhere (on the network) to everywhere (on the network)”, thus, betweenness scales with the square of network density—paralleling the use of network density measures in assignment-free direct demand models. In contrast to both previous applications of betweenness and assignment-free models, however, Cooper (2017) also uses a definition of “shortest” appropriate to the transport mode e.g. in the case of cyclists, taking slope and motorized traffic into account as barriers. The use of multiple factors to define distance rather than a simple angular (most direct) or network-Euclidean metric (shortest) (Hillier and Iida 2005) is termed Hybrid Betweenness. Overall, the betweenness approach has the merit of simplifying models of an environment in which the network is usually the slowest aspect to change. Cooper (2018) notes a number of weaknesses with the standard formulations of betweenness, namely, lack of consideration of distance decay, elasticity of demand, historical land use and heterogeneity of user types; these are addressed by computing multiple betweenness variables to capture effects of the above and using said variables to predict flows using cross-validated multiple regression. This parallels the inclusion of further variables in direct demand models, and is termed Multiple Hybrid Betweenness, or more generally, Multiple Hybrid Spatial Design Network Analysis (MH-sDNA).
The current work takes a similar approach, albeit for a pedestrian shopping model, the set of betweenness variables computed naturally differs to those which are appropriate for an all-trip-purpose cyclist model. Also, in the current case mode choice is excluded, as changes to the total number of pedestrian trips in the city centre are considered exogenous; an effective mode choice model would also require inclusion of the public transport component of journeys in this case. A similar model can, however, be used to capture unimodal trip generation, which approximates mode choice under other circumstances (Cooper 2018).
Multiple hybrid betweenness
The MH-sDNA approach constructs a multiple regression model, in which each variable is itself the output of a betweenness calculation, and fit these to data using linear methods. Our flow prediction is thus the weighted sum of multiple betweenness values. Cross-validation is used in two ways: first, to tune a ridge regression penalty parameter during training, and secondly, to measure the accuracy of our forecasts.
Recalling that the betweenness of a link is “the number of shortest paths from everywhere to everywhere that pass through the link”, we choose a distance metric to define “shortest” and a weighting to define “everywhere”. Our chosen distance metric is neither purely angular nor Euclidean, as with existing spatial network analysis frameworks (Hillier and Iida 2005), and instead is a hybrid of both distance types also including a random component. We also restrict our consideration of “everywhere” to specific sets of origins and destinations, but repeat this process for multiple potential journey stages (shown below in Table 2).
We adopt the formula for Betweenness used by the sDNA software (see Software, below); shown in Eq. 1. Under condition that shortest paths are unique it is equivalent to the original multi-path formulation of Betweenness (Freeman 1977); this condition does not hold for mathematically precise urban grid structures however we also introduce Monte Carlo randomization to the distance metric which has the effect of distributing trips over similar paths, making this point moot.
where x, y and z are links in the network N, O is the set of links defined as origins, D is the set of links defined as destinations, and W(y, z) is the weighting of a trip from y to z. R(y, rmin, rmax, dradius) is the subset of the network closer to link y than a threshold radius rmax but further from y than rmin according to \(d_{radius}\).OD(y, z, x, drouting) is defined in Eq. 2:
where \(d_{routing}\) and \(d_{radius}\) are metrics defining what we mean by ‘distance’. \(d_{radius}\) is consulted when deciding whether a journey of a certain distance takes places at all and for the current study is defined as Network Euclidean distance i.e. the shortest possible distance measured along the network in metres. \(d_{routing}\) is consulted to determine which route the journey will take; the definition is different and is given in the next section. Note that the different definitions of \(d_{routing}\) and \(d_{radius}\) mean that occasionally the routes taken by journeys will be longer than the distance band they are supposed to represent. This seeming inconsistency does not cause problems in practice (Cooper 2015) and is chosen because the simple definition of \(d_{radius}\) makes results easier to interpret.
The usual approach to defining the journey weighting function is to set W(y, z) in Eq. 1 to equal W(y)W(z) where W(y) and W(z) are the weights of the origin and destination respectively (as defined in Table 2). Assuming uniform distribution of origins, destinations and weights across space this implies that total journey activity scales with the square of the average total weight within each radius (Eq. 3):
It is therefore a fully elastic measure of demand, at least with respect to distribution of opportunity across space, in that more opportunities for interaction generate more interaction. Depending on how the analysis is weighted, the unit of opportunity can either be a defined land use type such as a shop, or alternatively represent the network itself: in both cases the implicit assumption is that interaction is increased by intensification of activity from a given land use (e.g. greater attractivity per square metre of retail floor area)—accessibility models which assume a linear relationship between accessibility and travel demand, also embed this assumption. However, in the latter case of weights simply representing network length or quantity of links, this elasticity can also be considered to represent the intensification of land use (e.g. more floor area, possibly on multiple levels) in more accessible locations.
In the current study we also introduce ‘Two Phase Betweenness’. As the name suggests this is computed in two phases; (1) determine total accessible destinations; (2) distribute origin weight across available destinations. It is thus a fully inelastic model of demand (with respect to distribution of opportunity across space) in which trip volume is limited by the weight of the origin. Combining this feature with a limited radius (as we do) can also be interpreted as a form of intervening opportunity model. The formula is given in Eq. 4, and implies that total trip activity scales with the average total weight in R rather than its square.
where R(..) is the R function appearing in Eq. 1. We also make use of Continuous Space Betweenness, which considers partial links where they exceed the radius (Cooper and Chiaradia, 2015) to improve accuracy for the smallest (200 m) trip distances. Where Betweenness flows stem from a single origin, there is no variance of opportunity between origins, so the Betweenness type is not relevant.
Table 2 shows the multiple types of Betweenness combined to form the model. The maximum trip length we use is 1200 m, a realistic size for pedestrian catchments which corresponds to a 10–20 min walk for most people (Western Australian Planning Commission 2000). For the e2s variable which captures trips from everywhere (including homes) to shops, i.e. the further extent of the catchment, we split the 1200 m radius into three distance bands (0–400 m, 400–800 m, 800–1200 m). For endpoints of other transport modes, we assume that transit users will avoid walking so far as those on pure pedestrian trips, hence we split a 1000 m radius into two distance bands (0-600 m, 600-1000 m). For the inter-shop variable s2s we assume trip chaining behaviour based on shorter trips, and thus split a 400 m radius (3–7 min walk) into two bands.
Calibration of distance metric
The distance metric \(d_{routing}\), used to define shortest paths (routes) through the network in Eqs. 1–2, is given in Eq. 5. The distance of any route through the network constitutes the sum of the link and junction distances on that route:
The calibration constant a specifies the relative importance of angular over Euclidean network distance (a = 1 gives pure angular, a = 0 pure Euclidean); ang is cumulative angular change along a link or turn at junction; euc is Euclidean distance measured along the path of the link; rand is a random sample drawn from a normal distribution with mean = 1. The standard deviation of this distribution σ is varied to obtain optimal fit to pedestrian behaviour, the presumption being that typical pedestrian behaviour may not be random, but depends on more factors than we can feasibly include, so we randomize behaviour somewhat to ensure that pedestrian flows are distributed over similar paths rather than all-or-nothing assignment to the shortest. de Ortúzar (2011, Sect. 10.4.1) classifies such approaches as Monte Carlo simulation assignment. Thus, for each origin–destination pair we draw multiple samples from the random distribution, 5 during the calibration of σ and 50 for the final model. To avoid distances of zero and the opposite extreme, values drawn from rand are constrained to the range .1 ≤ x ≤ 10; values exceeding that range are moved to its nearest endpoint.
For calibration of the random factor we test a wide range of values of σ for their effect on e2s Betweenness as a predictor of pedestrian flow (e2s being the variable which carries most predictive power on its own). The metric is also calibrated by varying the value of a. In previous work exploring hybrids of angular and Euclidean analysis on pedestrian flows in London (publication pending) we tested a = 0, .25, .5, .75, 1, and found a = .25 and .5 to give the best fits, so tried both of these values during calibration of the current study.
Calibration and testing of multiple models
Statistical models are fitted to observed flows as per Cooper (2018), though we report R2 rather than mean square error, because our intention is to model the spatial distribution of flows rather than overall levels of activity. Spatial Network Analyses in the literature are typically univariate, that is, they involve only one Betweenness calculation, which is then calibrated against pedestrian flows through bivariate ordinary least squares linear regression. Existing models tend to report fit against data, but without validation against a test data set. Both Betweenness and flow variables are often transformed prior to regression, e.g. by cube root (e.g. Turner 2007) or Box Cox estimation (e.g. Cooper 2015) to serve the dual purpose both of taming outliers in the data and minimizing a trade-off of absolute and relative error.
These techniques are not suitable for a multiple regression analysis for two reasons: (1) variable transformations violate the physical interpretation of a linear additive assignment model in which each variable in isolation represents a count for a subgroup of pedestrians, with subgroups summed to determine the total count. (While nonlinear models may achieve better fit, a model with a physical interpretation has less risk of underperforming when extrapolating beyond the training set). (2) Ordinary least squares will tend to overfit data where the predictor variables are correlated. Such correlations are in general to be expected for minor variations in the definition of betweenness on the same network due to the restricted choice of paths realistically available in a real world setting (Cooper 2018). We therefore replace variable transformations with weighting to achieve a similar effect, at the expense of some loss in model fit, but producing more credible models as they are structurally and behaviourally sound. Each data point y is weighted by \(y^{\lambda } /y\), with 0 ≤ λ ≤ 1 (λ is set to 1 to minimize absolute error, 0 to minimize relative error, or any value in between for a trade-off).
In place of ordinary least squares regression we use Tikhonov regularization in the form of ridge regression (Amemiya 1985; Tikhonov 1943). This technique can be interpreted either as introducing a penalty term to prevent overfit, or as imposing a Bayesian prior on the likely values of the regression coefficients, forcing them towards zero. The optimum strength of the ridge penalty (or standard deviation of the prior) is determined by generalized cross-validation (GCV) with sevenfolds and 50 bootstrap repetitions. GCV repeatedly fits models on a random subset of the training data, then tests them on the remainder. This not only solves the problem of overfit, but also has the result of reporting the model’s ability to predict outside the training set, i.e. to extrapolate from cordon points in the training set to the rest of the network. For the ridge regression it was necessary to manually specify the ridge penalty λ as auto-selection of λ from the glmnet package used for model fitting (see Software section below) did not find the optimal value.
Three models are formed and tested against pedestrian flows in each year 2010 and 2011
-
1.
The direct model predicts using regression in the conventional manner (Eq. 6):
$$predicted flow^{year} = \beta_{1} betweenness_{1}^{year} + \beta_{2} betweenness_{2}^{year} + \ldots$$(6)where betweenness variables are given in the rows of Table 2. For calibration of \(\beta\) s, all variables are taken from 2007 data; for prediction, flow and betweenness variables are taken from years 2010 and 2011 respectively (based on the changed map data for 2010 which added/removed links, altered floor area and car park locations) but retaining \(\beta\) s from 2007. This is the most useful model in practice as it extrapolates data across both space and time. Baseline flow data is only used for calibration and not as an input to the prediction of each flow point. It is therefore tested on 5 additional cordon points added by Cardiff Council for 2011, for which the other models could not have produced predictions.
-
2.
The null model assumes no change in pedestrian flow between years, i.e. predicts that \(flow^{year} = flow^{2007}\), and is thus only applicable to cordon points where pedestrian counts have been recorded all years. Although not a useful model in practice the assumption of no change serves as a benchmark against which the direct and incremental models can be evaluated.
-
3.
The incremental direct model works by adding predicted change between years of the direct model to flows for the baseline year, Eq. 7:
$$incremental flow^{year} = flow^{2007} + predicted flow^{year} - predicted flow^{2007}$$(7)Like the null model, this cannot extrapolate from the cordon points to the rest of the network, where baseline flow data is not available. The incremental model is included to demonstrate that MH-sDNA adds useful extra information to the null model.
Software
All network preparation (checking for errors), betweenness computations, regression and prediction is undertaken with the publicly available sDNA + toolbox for ArcGIS, QGIS, command line and Python (Cooper 2016; Cooper et al. 2011). The sDNA+ Integral Analysis tool is used for the Betweenness models. Based on our work, the distance metric used in the current study has now been added to sDNA+ (without randomization) as the ‘PEDESTRIAN’ preset. Randomization was added using the linerand, juncrand and oversample keywords in sDNA advanced configuration. Calibration via ridge regression is conducted using the open source sDNA Learn and Predict tools which in turn make use of the glmnet R package (Friedman et al. 2009).
Results
Table 3 shows cross-correlation between the independent variables. This is in general high, especially (1) for different trip lengths under the same betweenness type (e.g. different lengths of n2s, p2s, sc2s, sq2s, e2s, s2s); (2) between the e2s and s2s variables (‘everywhere to retail’ and ‘retail to retail’ weighted betweenness), due to the wide prevalence of retail in the area with cordon counts. As noted above, these correlations are not unexpected and for this reason we follow Cooper (2018) in using ridge regression to handle collinear predictors.
During calibration to 2007 data we found setting the angular/Euclidean hybrid coefficient a = .5 to give better model fit than .25. For calibration of the random factor, Fig. 5 shows the results obtained. Based on this we initially settled on σ = .5 as the lowest amount of randomization that reliably increased correlation with pedestrian flows. However, this led to predictions we considered unrealistic (such as all-or-nothing assignment to either side of a particular street when both were suitable), so we changed it to σ = 1.0. This change also increased overall fit for the 2007 model from .47 to .49.

Test of different levels of randomization on e2s variable, radius 800 m, 5 × sampling
For the overall 2007 model, we initially fitted the first 5 variable classes described in Table 2. Inspection of the initial model fit revealed a number of errors in the map (connectivity and poor geocoding of retail floor areas), which were corrected. The final variable (‘n2s’) was added after the first calibration attempt, as we suspected from examination of residuals that the model was not capturing the large volume of on-street parking to the north of the study area, which is captured elsewhere through the ‘e2s’ variable. Additionally, two outliers at a single intersection which appears unusually busy (near to Cardiff Castle, a popular tourist destination), caused problems fitting the data, so the model was fit with the weighting λ = .7 to reduce their effect (from previous work we have found values of λ in this region to improve GEH). The weighted, cross validated R2 for the 2007 model is .49 including outliers; unweighted fit improves to .60 if removing outliers to test the outlier-fitted model. Standardized coefficients for the variables are given in Table 4. Ridge regression drops the p2s variable at 600 m radius. Distance decay is evident in the coefficients (representing reduced tendency for individuals to travel further per opportunity), but not the standardized coefficients within the range of distances tested, as quantity of opportunities increases with distance.
Figure 6 shows pedestrian flow counts fitted to the footfall count data for 2007. This reveals progressively higher pedestrian flows from the edge of the city to the centre with the highest flows occurring in and around the pedestrianised streets, as would be expected. It is also clear how side streets off busy streets can have much lower pedestrian flows despite linking streets with high levels of flows. The carparks and the Central station do not appear to influence larger flows, probably due to the former being quite evenly distributed around the periphery.

Extrapolation across space: predicted flows for the 2007 map calibrated to 2007 counts
Figure 7 shows the predicted change in pedestrian flow counts between 2007 and 2011. The thick red lines show the greatest increase in flows with blue showing a decrease; white reveals no substantial change. What this predicts is the increase in flows to the new St David’s 2 development in the bottom centre of the map and in particular the importance of the direct East–West streets linking the new development to the two railway stations and bus station and also the main pedestrianised thoroughfare from the north of the city centre linking to the main Cardiff train station to the south of the city centre. The smaller side streets show no predicted change in flows except where close enough to the new development (400 m) that they can capture ‘shop-to-shop’ traffic with their own retail area. The area to the north-east of the city centre sees slight predicted decline due to inelastic shop-to-shop flows originating on Queen Street, being redistributed from this area to the new development. Note that as total volume of pedestrian activity is exogenous to the model, this predicted decline is relative to the rest of the city centre and may not represent an absolute decline in pedestrian flows.

Extrapolation across time: predicted changes for the 2010 map based on calibration from 2007. Negative numbers where present show decline relative to other points in city centre (not necessarily an absolute decline in numbers)
Table 5 shows model performance for each year. The null model reveals a substantial consistency for pedestrian flows between years, with the exception of 2011 which was hard to predict for all models including the null model due to a large reduction in footfall on the days sampled on the main road near the castle. This is likely due to 2011 flows having the least correlation with other years (see Fig. 2) although the ultimate reason for this remains unknown, possibly relating to events unique to the city centre on the day of recording. The incremental model outperforms the null model, showing that MH-sDNA adds meaningful information. The performance of the (most widely applicable) direct model is good at .72 in 2010, though reduces to .45 in 2011. Figure 8 shows a scatter plot of 2010 counts against predictions with clear correlation; no pattern is immediately discernible in the residuals when mapped; the apparent increase of error for high flows relates to the outliers discussed above. The intercept is set at 0 as pedestrian count cannot be negative.

Scatter plot of 2011 counts against predictions from the direct model calibrated on 2007. Line shows diagonal (i.e. where predicted and actual flow are equal)
Following the forecasting exercise, we also tested a model based on choosing the best single variable in isolation. This reflects previous practice in using a single betweenness measure (possibly augmented by other variables) calibrated for optimal choice of radius (Cooper 2017; Jayasinghe 2017; Omer et al. 2017; Serra and Hillier 2017; Turner 2007) albeit in this case also making optimal choice of the available origin and destination weightings. During the calibration year, the best individual variable was e2s at 1200 m radius with cross-validated R2 = .32. During the test year this variable has R2 = .69 with measured flows. It is outperformed in the test year by another variable, e2s at 800 m radius which has R2 = .72 (matching the performance of the direct model), however, this information would not have been available to a modeller during the calibration year. The ridge regression direct model has therefore been shown to provide a more robust forecast in the face of uncertainty.
Discussion
This study has tested the forecasting ability of Multiple Hybrid Spatial Design Network Analysis, which in contrast to traditional spatial network analysis attempts to explicitly capture a diverse array of behaviour. We have shown MH-sDNA to be capable of predicting the effect of major changes in city centre street layout, including re-alignment and urban block size changes and re-allocation of street space, on pedestrian flow counts, by extrapolating from measured pedestrian flow data both across space and across time. In an incremental model of changes (model 3), we improve on the information provided by a null model of no change (model 2), however we expect the technique to be of greater use in direct form (model 1) where it is able to extrapolate to other points in space from the cordon counts used for training. Our approach combines a set of original features: hybrid road centre line and footpath centre line mapping of the pedestrian outdoor, indoor, public and quasi-public spaces, extended by 1.2 km buffer beyond the city centre to serve as source for trips from the surroundings, and a hybrid metric blending shortest and most direct path that best fits observed pedestrian route choice in the literature (Shatu et al. 2019) augmented by Monte Carlo random assignment. We also use regularized regression with built-in cross-validation to enable multiple spatial network analysis.
This is the first time, to our knowledge, that such a pedestrian flow model has been evaluated for its ability to forecast the effect of major city centre changes over time. The model captures the street layout supply/demand effect of the replacement of a large urban block with smaller and more intelligible alignment of key north–south and east–west corridor, by reductionist consideration of individual routes through the network following in the footsteps of Sevtsuk et al. (2016) rather than relying on the more abstract metric of block size. Yet to date no study involving empirical pedestrian movement observation and route assignment has been investigated. The natural experiment investigated in Cardiff city centre through pedestrian layout mapping, empirical pedestrian flow observation and pedestrian route assignment enables us to better understand the impacts, first of the major layout change and second of the “town centre first” retail-led urban regeneration policy, from the point of view of town centre vitality and pedestrian users rather than retailers alone (Kim and Jang 2017). The results and methodology are relevant for the preparation and evaluation of plans, not only to planners and designers in the European context but also in US and Chinese cities which are known to suffer from very large urban block size (Sun et al. 2017). The model has since been used in a complex multi-level rail and property project (Zhang and Chiaradia 2019).
This model can be applied (1) in the design and future planning of pedestrian environments as well as the improvement of current ones, (2) to simulate changes to an actual environment, (3) to predict behaviours in an existing or new layout, (4) to determine future need for an improvement in pedestrian layout, or (5) to measure the effect of the addition of new infrastructure or business.
A key limitation of the study is the methodology used for pedestrian counts, which were manual. Modern counting techniques including video analysis, WiFi or Bluetooth sensors can count passing pedestrians 24 h a day, 365 days a year, with the hope of producing more accurate data. There is also no pedestrian flow measurement from inside the new St Davids 2 shopping centre, which would have been beneficial to include if present.
Two obvious options exist for improving the models outlined here. The first is the inclusion of a pedestrian environment audit; this need not be as complex as mainstream audits (Transport for London, 2006); indeed it may suffice to have a simple means of classifying streets e.g. as excellent/good/mediocre/poor—to feed into the route assignment model, likely yielding improvements without excessive cost. The second, as we start to model more congested urban environments, is to account for pedestrian congestion. In the context of MH-sDNA this can be achieved in two ways: either linking to agent microsimulation models at key congested locations, or by iterative modelling using a statistical physics approach (e.g. Osaragi 2004) that predicts deterrence from links based on their width and current level of pedestrian flow.
Finally it would be fruitful to employ MH-sDNA techniques to improve the accuracy of existing mode choice models (covering the decision to walk rather than drive e.g. Ewing et al. 2014), thus expanding the social/economic sustainability concern to incorporate the environmental as well.
References
Amemiya, T.: Advanced Econometrics. Harvard University Press, Cambridge (1985)
Aoun, A.: Bicycle and Pedestrian Forecasting Tools: State of the Practice. Chapel Hill, NC (2015)
Benham, J., Patel, B.G.: A method for estimating pedestrian volume in a central business district. Transp. Res. Record J. Transp. Res. Board 629, 22–26 (1977)
Boeing, G.: The morphology and circuity of walkable and drivable street networks. In: D’Acci, L. (ed.) The Mathematics of Urban Morphology, Modeling and Simulation in Science, Engineering and Technology. Springer International Publishing, Cham (2019). https://doi.org/10.1007/978-3-030-12381-9_12
Bolten, N., Caspi, A.: Open sidewalks [WWW Document]. (2019). https://www.opensidewalks.com/
Borgers, A., Timmermans, H.: Modeling pedestrians’ shopping behavior in downtown areas. In: CUPUM 2015—14th International Conference on Computers in Urban Planning and Urban Management CUPUM 2015, p. 202 (2015)
Borgers, A., Timmermans, H.J.P.: City centre entry points, store location patterns and pedestrian route choice behaviour: a microlevel simulation model. Soc. Econ. Plan. Sci. 20, 25–31 (1986). https://doi.org/10.1016/0038-0121(86)90023-6
Borgers, A.A., Timmermans, H.H.: Shopping behaviour in downtown shopping areas : A detailed pedestrian model. Presented at the 17th International Conference of Hong Kong Society for Transportation Studies: Transportation and Logistics Management (2012)
Cardillo, A., Scellato, S., Latora, V., Porta, S.: Structural properties of planar graphs of urban street patterns. Phys. Rev. E Stat. Nonlinear Soft. Matter. Phys. 73, 066107 (2006). https://doi.org/10.1103/PhysRevE.73.066107
Cervero, R., Kockelman, K.: Travel demand and the 3Ds: density, diversity, and design. Transp. Res. Part D Transp. Environ. 2, 199–219 (1997). https://doi.org/10.1016/S1361-9209(97)00009-6
Chiaradia, A.J.F.: La codification des réseaux piétons et le choix d’itinéraires (Pedestrian network codification and route choice preference). In: La ville sous nos pieds : connaissance et pratiques favorables aux mobilités piétonnes. Institut, Montreal, pp. 335–350 (2014)
Ciolek, M.T.: Spatial behaviour in pedestrian areas. Ekistics 268, 120–121 (1978)
Cooper, C.H.V.: Predictive spatial network analysis for high-resolution transport modeling, applied to cyclist flows, mode choice, and targeting investment. Int. J. Sustain. Transp. 12, 714–724 (2018). https://doi.org/10.1080/15568318.2018.1432730
Cooper, C.H.V.: Using spatial network analysis to model pedal cycle flows, risk and mode choice. J. Transp. Geogr. 58, 157–165 (2017). https://doi.org/10.1016/j.jtrangeo.2016.12.003
Cooper, C.H.V.: Spatial Design Network Analysis (sDNA) version 3.4 Manual [WWW Document]. http://www.cardiff.ac.uk/sdna/software/documentation(2016). Accessed 15 September 2016
Cooper, C.H.V.: Spatial localization of closeness and betweenness measures: a self-contradictory but useful form of network analysis. Int. J. Geogr. Inf. Sci. 29, 1293–1309 (2015). https://doi.org/10.1080/13658816.2015.1018834
Cooper, C.H.V., Chiaradia, A.J.: sDNA: how and why we reinvented Spatial Network Analysis for health, economics and active modes of transport. In: Nick Malleson (Ed.), GISRUK 2015 Proceedings. Leeds (2015). https://doi.org/10.6084/m9.figshare.1491375
Cooper, C.H.V., Chiaradia, A.J., Webster, C.: Spatial Design Network Analysis (sDNA) [WWW Document]. www.cardiff.ac.uk/sdna (2011). Accessed 15 September 2016
Cooper, C.H.V., Fone, D.L., Chiaradia, A.: Measuring the impact of spatial network layout on community social cohesion: a cross-sectional study. Int. J. Health Geogr. 13, 11 (2014). https://doi.org/10.1186/1476-072X-13-11
Craig, P., Katikireddi, S.V., Leyland, A., Popham, F.: Natural experiments: an overview of methods, approaches, and contributions to public health intervention research. Annu. Rev. Public Health 38, 39–56 (2017)
Crane, R.: The influence of urban form on travel: an interpretive review. J. Plan. Lit. 15, 3–23 (2000). https://doi.org/10.1177/08854120022092890
Crask, M.R.: A simulation model of patronage behavior within shopping centers. Decis. Sci. 10, 1–15 (1979). https://doi.org/10.1111/j.1540-5915.1979.tb00002.x
Department for Communities and Local Government.: DCLG Planning practice guidance (No. 2b-005–20140306) (2014)
Department for Communities and Local Government.: Planning Policy Statement 4: Planning for Sustainable Economic Growth. UK (2009)
Desyllas, J.D.D., Duxbury, E., Ward, J., Smith, A.: Pedestrian Demand Modelling of Large Cities: An Applied Example from London. Centre for Advanced Spatial Analysis, London (2003)
Dijkstra, E.W.: A note on two problems in connexion with graphs. Numerische Mathematlk l 269–27 (1959)
Dijkstra, J., Timmermans, H., de Vries, B.: Modeling impulse and non-impulse store choice processes in a multi-agent simulation of pedestrian activity in shopping environments. In: Harry, T. (Ed.), Pedestrian Behavior Emerald Group Publishing Limited, pp. 63–85 (2009). https://doi.org/10.1108/9781848557512-004
Elias, B.: Pedestrian Navigation-Creating a tailored geodatabase for routing. In: 4th Workshop On Positioning, Navigation and Communication, 2007. WPNC’07. IEEE, Hannover, Germany, pp. 41–47 (2007)
Ewing, R., Cervero, R.: Travel and the built environment. J. Am. Plan. Assoc. 76, 265–294 (2010). https://doi.org/10.1080/01944361003766766
Ewing, R., Cervero, R.: Travel and the built environment: a synthesis. Transp. Res. Record J. Transp. Res. Board 1780, 87–114 (2001). https://doi.org/10.3141/1780-10
Ewing, R., Clemente, O.: Measuring Urban Design: Metrics for Livable Places, Metropolitan Planning + Design. Island Press/Center for Resource Economics, Washington, DC (2013)
Ewing, R., Tian, G., Goates, J.P., Zhang, M., Greenwald, M.J., Joyce, A., Kircher, J., Greene, W.: Varying influences of the built environment on household travel in 15 diverse regions of the United States. Urban Stud. 52, 2330–2348 (2014). https://doi.org/10.1177/0042098014560991
Frank, L.D., Engelke, P.O.: The built environment and human activity patterns: exploring the impacts of urban form on public health. J. Plan. Lit. 16, 202–218 (2001). https://doi.org/10.1177/08854120122093339
Frank, L.D., Pivo, G.: Impacts of mixed use and density on utilization of three modes of travel: single-occupant vehicle, Transit, Walking. Transportation Research Record (1994)
Freeman, L.C.: A set of measures of centrality based on betweenness. Sociometry 40, 35–41 (1977)
Friedman, J., Hastie, T., Tibshirani, R.: glmnet: Lasso and elastic-net regularized generalized linear models. R package version 1 (2009)
Gärling, T., Gärling, E.: Distance minimization in downtown pedestrian shopping. Environ. Plan. A 20, 547–554 (1988). https://doi.org/10.1068/a200547
Gehl, J.: Public Spaces, Public Life. The Danish Architectural Press, Copenhagen (2004)
Greenhalgh, T.: How to read a paper. Getting your bearings (deciding what the paper is about). BMJ 315, 243–246 (1997)
Griswold, J.B., Medury, A., Schneider, R.J., Amos, D., Li, A., Grembek, O.: A pedestrian exposure model for the california state highway system. Transp. Res. Record (2019). https://doi.org/10.1177/0361198119837235
Guimarães, P.P.C.: The use of indicators in the evaluation of retail planning: evidences from England. J. Architect. Urban. 41, 1–8 (2017)
Guy, C.: Development pressure and retail planning: a study of 20-year change in Cardiff, UK. Int. Rev. Retail Distrib. Consum. Res. 20, 119–133 (2010). https://doi.org/10.1080/09593960903498250
Haklay, M., O’Sullivan, D., Thurstain-Goodwin, M., Schelhorn, T.: “So go downtown”: simulating pedestrian movement in town centres. Environ. Plann. B Plann. Des. 28, 343–359 (2001). https://doi.org/10.1068/b2758t
Handy, S.L.: Critical assessment of the literature on the relationships among transportation, land use, and physical activity (No. 282), Transportation Research Board and the Institute of Medicine Committee on Physical Activity, Health, Transportation, and Land Use. Resource paper for TRB Special Report (2005)
Handy, S.L., Boarnet, M.G., Ewing, R., Killingsworth, R.E.: How the built environment affects physical activity: views from urban planning. Am. J. Prev. Med. 23, 64–73 (2002)
Hankey, S., Lindsey, G., Wang, X., Borah, J., Hoff, K., Utecht, B., Xu, Z.: Estimating use of non-motorized infrastructure: models of bicycle and pedestrian traffic in minneapolis. MN. Landsc. Urban Plan. 107, 307–316 (2012)
Haworth, J.: Spatio-temporal forecasting of network data. UCL (University College London) (2014)
Hill, M.R.: Stalking the urban pedestrian: a comparison of questionnaire and tracking methodologies for behavioral mapping in large-scale environments. Environ. Behav. 16, 539–550 (1984)
Hill, M.R.: Spatial Structure and Decision-Making of Pedestrian Route Selection through an Urban Environment (PhD). University of Nebraska. Lincoln: ETD collection for University of Nebraska Paper (1982)
Hillier, B., Iida, S.: Network and psychological effects in urban movement. In: Cohn, A.G., Mark, D.M. (eds.) Spatial Information Theory, Lecture Notes in Computer Science, pp. 475–490. Springer, Berlin (2005)
Jayasinghe, A.B.: A network centrality-based simulation approach to model traffic volume (PhD Thesis). Nagaoka University of Technology (2017)
Karimi, H.A., Kasemsuppakorn, P.: Pedestrian network map generation approaches and recommendation. Int. J. Geogr. Inf. Sci. 27, 947–962 (2013)
Khisty, C.J.: Heuristic Wayfinding for Nonmotorized Transport. Transportation Research Record 1695 (1999)
Kim, H.-R., Jang, Y.: Lessons from good and bad practices in retail-led urban regeneration projects in the Republic of Korea. Cities 61, 36–47 (2017). https://doi.org/10.1016/j.cities.2016.11.004
Kuzmyak, J., Walters, J., Bradley, M., Kockelman, K.: Estimating bicycling and walking for planning and project development: A guidebook. National Academies of Sciences, Engineering, and Medicine (2014)
Lambiri, D., Faggian, A., Wrigley, N.: Linked-trip effects of ‘town-centre-first’’ era foodstore development: an assessment using difference-in-differences’. Environ. Plan. B Urban Analyt. City Sci. 44, 160–179 (2017). https://doi.org/10.1177/0265813515624684
Lausto, K., Murole, P.: Study of pedestrian traffic in Helsinki: methods and results. Traffic Eng. Control 15, 446–449 (1974)
Law, S., Sakr, F.L., Martinez, M.: Measuring the changes in aggregate cycling patterns between 2003 and 2012 from a space syntax perspective. Behav. Sci. (Basel) 4, 278–300 (2014). https://doi.org/10.3390/bs4030278
Leatherdale, S.T.: Natural experiment methodology for research: a review of how different methods can support real-world research. Int. J. Soc. Res. Methodol. 22, 19–35 (2019). https://doi.org/10.1080/13645579.2018.1488449
Levenshtein, V.I.: Двoичныe кoды c иcпpaвлeниeм выпaдeний, вcтaвoк и зaмeщeний cимвoлoв [Binary codes capable of correcting deletions, insertions, and reversals]. Дoклaды Aкaдeмий Hayк CCCP 163, 845–848 (1965)
Lindsey, G., Wilson, J.S., Rubchinskaya, E., Yang, J., Han, Y.: Estimating urban trail traffic: Methods for existing and proposed trails. Landsc. Urban Plan. (2007). https://doi.org/10.1016/j.landurbplan.2007.01.004
Lindsey, G.H.: Forecasting Use of Nonmotorized Infrastructure: Models of Bicycle and Pedestrian Traffic in Minneapolis, Minnesota. 90th Annual Meeting Transportation Research Board (2011)
Lindsey, G.H., Hoff, K., Hankey, S., Wang, X.: Understanding the Use of Non-Motorized Transportation Facilities (2012)
Liu, X., Griswold, J.B.: Pedestrian volume modeling: a case study of San Francisco. Yearbook Assoc. Pacific Coast Geogr. 71, 164–181 (2009). https://doi.org/10.1353/pcg.0.0030
Lowry, M.: Spatial interpolation of traffic counts based on origin–destination centrality. J. Transp. Geogr. 36, 98–105 (2014). https://doi.org/10.1016/j.jtrangeo.2014.03.007
Manum, B., Nordstrom, T.: Integrating bicycle network analysis in urban design: improving bikeability in Trondheim by combining space syntax and GIS-methods using the place syntax tool, in: Proceedings of the Ninth International Space Syntax Symposium. Seoul: Sejong University (2013)
Martinez-Gil, F., Lozano, M.-F.I., Fernández, F.: Modeling, evaluation, and scale on artificial pedestrians: a literature review. ACM Comput. Surv. (CSUR) 50, 72 (2017)
Miranda-Moreno, L.F., Fernandes, D.: Modeling of pedestrian activity at signalized intersections: land use, urban form, weather, and spatiotemporal patterns. Transp. Res. Rec. 2264, 74–82 (2011). https://doi.org/10.3141/2264-09
Montello, D.R.: Navigation. The Cambridge Handbook of Visuospatial Thinking, pp. 257–294. Cambridge University Press, Cambridge (2005)
Montello, D.R.: A new framework for understanding the acquisition of spatial knowledge in large-scale environments. In: Egenhofer, M.J., Golledge, R.G. (eds.) Spatial and Temporal Reasoning in Geographic Information Systems, pp. 143–154. Oxford University Press, New York (1998)
Munira, S., Sener, I.N.: Use of the Direct-Demand Modeling in Estimating Nonmotorized Activity: A Meta-Analysis. Technical report prepared for the Safety through Disruption (Safe-D) (Tamu). TX: National University Transportation Center. Texas A&M Transportation Institute (2017)
Newman, M.E.J.: Modularity and community structure in networks. PNAS 103, 8577–8582 (2006). https://doi.org/10.1073/pnas.0601602103
Omer, I., Gitelman, V., Rofè, Y., Lerman, Y., Kaplan, N., Doveh, E.: Evaluating crash risk in urban areas based on vehicle and pedestrian modeling. Geogr. Anal. 49(4), 387–408 (2017)
Ordnance Survey: OS MasterMap® Integrated Transport Network Layer [GML2 geospatial data] Scale 1:1250 (2017)
de Ortúzar, J., Willumsen, D.L.G.: Modelling Transport, 4th edn. Wiley, Chichester (2011)
Osaragi, T.: Modeling of pedestrian behavior and its applications to spatial evaluation. In: Proceedings of the Third International Joint Conference on Autonomous Agents and Multiagent Systems—Volume 2, AAMAS’04. IEEE Computer Society, pp. 836–843. Washington, DC, USA (2004). https://doi.org/10.1109/AAMAS.2004.172
Patterson, J.L.: Traffic modelling in cities–Validation of space syntax at an urban scale. Indoor Built Environ. 25, 1163–1178 (2016)
Raford, N.: Social and technical challenges to the adoption of space syntax methodologies as a planning support system (PSS) in American Urban Design. J. Sp. Syntax 1, 230–245 (2010)
Raford, N., Chiaradia, A., Gil, J.: Space syntax: the role of urban form in cyclist route choice in central London. In: TRB (Transportation Research Record) 86th Annual Meeting Compendium of Papers CD-ROM. Presented at the Transportation Research Board 86th Annual Meeting, Transportation Research Board, pp. 07–2738. Washington, DC (2007)
Raford, N., Ragland, D.: Pedestrian Volume Modeling for Traffic Safety and Exposure Analysis: The Case of Boston, Massachusetts. TRB Annual Meeting (2006)
Raford, N., Ragland, D.: Space syntax: innovative pedestrian volume modeling tool for pedestrian safety. Transp. Res. Rec. 1878, 66–74 (2004). https://doi.org/10.3141/1878-09
Ratti, C.: Space syntax: some inconsistencies. Environ. Plan. 31, 487–499 (2004). https://doi.org/10.1068/b3019
Ravenscroft, N.: The vitality and viability of town centres. Urban studies 37, 2533–2549 (2000)
Schneider, R.J., Henry, T., Mitman, M.F., Stonehill, L., Koehler, J.: Development and application of volume model for pedestrian intersections in San Francisco, California. Transp. Res. Rec. 2299, 65–78 (2012). https://doi.org/10.3141/2299-08
Serra, M., Hillier, B.: Spatial configuration and vehicular movement. In: Proceedings of the 11th Space Syntax Symposium. Lisbon (2017)
Sevtsuk, A., Kalvo, R., Ekmekci, O.: Pedestrian accessibility in grid layouts: the role of block, plot and street dimensions. Urban Morphology 20 (2016)
Shatu, F., Yigitcanlar, T., Bunker, J.: Shortest path distance vs. least directional change: empirical testing of space syntax and geographic theories concerning pedestrian route choice behaviour. J. Transp. Geogr. 74, 37–52 (2019)
Stangl, P.: Overcoming flaws in permeability measures: modified route directness. J. Urban. Int. Res. Placemak. Urban Sustain. 12, 1–14 (2019)
Stangl, P., Guinn, J.M.: Neighborhood design, connectivity assessment and obstruction. Urban Des. Int. 16, 285–296 (2011). https://doi.org/10.1057/udi.2011.14
Strano, E., Nicosia, V., Latora, V., Porta, S., Barthélemy, M.: Elementary processes governing the evolution of road networks. Sci. Rep. 2, 1–8 (2012). https://doi.org/10.1038/srep00296
Sun, G., Webster, C., Chiaradia, A.: Ungating the city: a permeability perspective. Urban Stud. 55, 2586–2602 (2017)
Sun, G., Webster, C., Zhang, X.: Connecting the city: a three-dimensional pedestrian network of Hong Kong. Environ. Plan. B: Urban Anal. City Sci. (2019). https://doi.org/10.1177/2399808319847204
Teklenburg, J.A., Timmermans, H.J., Borgers, A.W.: Changes in urban layout and pedestrian flows. Presented at the PTRC Summer Annual Meeting, 21st, 1993, University of Manchester, United Kingdom (1993)
Tikhonov, A.N.: Oб ycтoйчивocти oбpaтныx зaдaч. Dokl. Akad. Nauk SSSR 39, 195–198 (1943)
Transport for London.: What is PERS? (2006)
Turner, A.: From axial to road-centre lines: a new representation for space syntax and a new model of route choice for transport network analysis. Environ. Plan. 34, 539–555 (2007)
Turner, S.: Synthesis of methods for estimating pedestrian and bicyclist exposure to risk at area wide levels and on specific transportation facilities. Federal Highway Administration. Office of Safety, Washington, DC (2017)
Verlander, N.Q., Heydecker, B.G.: Pedestrian route choice: an empirical study [WWW Document]. Proceedings of the PTRC European Transport Forum (formerly Summer Annual Meetings). http://discovery.ucl.ac.uk/55507/ (1997). Accessed 27 November 17
Vitins, B.J., Axhausen, K.: Shape grammars overview and assessment for transport and urban design: review, terminology, assessment, and application. J. Transp. Land Use (2016). https://doi.org/10.5198/jtlu.2016.620
Vitins, B.J., Axhausen, K.W.: Extraction and evaluation of transportation network grammars for efficient planning applications. Des. Sci. (2018). https://doi.org/10.1017/dsj.2017.29
Xize, Wang, Greg, Lindsey, Steve, Hankey, Kris, Hoff: Estimating mixed-mode urban trail traffic using negative binomial regression models. J. Urban Plan. Dev. 140, 04013006 (2014). https://doi.org/10.1061/(ASCE)UP.1943-5444.0000157
Western Australian Planning Commission.: Liveable Neighbourhoods: Street Layout, Design and Traffic Management Guidelines (2000)
Xie, F., Levinson, D.: Measuring the structure of road networks. Geogr. Anal. 39, 336–356 (2007). https://doi.org/10.1111/j.1538-4632.2007.00707.x
Zachariadis, V.: Modelling pedestrian movement and choices from micro to urban scale: Issues, patterns and emergence. Presented at the 10th International Conference on Computers in Urban Planning and Urban Management, Iguassu Falls, Brasil (2007)
Zacharias, J.: Modeling pedestrian dynamics in Montreal’s underground City. J. Transp. Eng. 126(5), 405–412 (2000)
Zacharias, J.: Reconsidering the impacts of enclosed shopping centres: a study of pedestrian behaviour and within a festival market in Montreal. Landsc. Urban Plan. Sp. Issue Urban Des. Res. 26, 149–160 (1993). https://doi.org/10.1016/0169-2046(93)90013-4
Zhang, L., Chiaradia, A.: Three-dimensional Spatial Network Analysis and Its Application in a High Density City Area, Central Hong Kong. UPI 34, 46–53 (2019). https://doi.org/10.22217/upi.2018.513
Zhang, L., Chiaradia, A., Zhuang, Y.: Configurational accessibility study of road and metro network in Shanghai. In: Pan, Q., Cao, J. (Eds.), Recent Developments in Chinese Urban Planning, pp. 219–245. Springer (2015)
Zhu, W., Timmermans, H.: Modeling and Simulating Pedestrian Shopping Behavior Based on Principles of Bounded Rationality, in: Harry, T. (Ed.), Pedestrian Behavior. Emerald Group Publishing Limited, pp. 137–155 (2009). https://doi.org/10.1108/9781848557512-007
Acknowledgements
We thank Martin Wedderburn for helpful discussions, and Antoine Chanthavisouk for his initial work on the 2011 network. This study was supported by a Cardiff University Data Innovation Research Institute grant. Network based on Ordnance Survey ITN and Mastermap © Crown Copyright and Database Right 2017 Ordnance Survey (Digimap Licence). Basemaps are Ordnance Survey Open Grey © Crown copyright and database right (2017). The study in this paper is described in abstract terms in Cooper, Harvey, Orford (2018) Testing the ability of Multivariate Hybrid Spatial Network Analysis to Predict the Effect of a Major Urban Redevelopment on Pedestrian Flows, GISRUK 2018 conference, University of Leicester https://www122.lamp.le.ac.uk/download/GISRUK2018_Contribution_086.pdf. The current publication adds the following new material: (1) detailed rationale for the choice of modelling process, (2) substantive details on the modelling (equations, coefficients, parameters), (3) exploratory examination of the empirical data, (4) results of longitudinal test of model vs data, (5) more detailed discussion throughout. A full preprint of this paper appears on arxiv.org.
Author information
Authors and Affiliations
Corresponding author
Ethics declarations
Conflict of interest
AC and CC are entitled to a small share of any royalties generated through sale of the enhanced sDNA + software. AC re-invests all royalties in sDNA + software development. IH and SO declare no competing interests.
Additional information
Publisher's Note
Springer Nature remains neutral with regard to jurisdictional claims in published maps and institutional affiliations.
Appendix: Computation details
Appendix: Computation details
The sDNA Integral tool computes betweenness as outlined in Eqs. 1–2 by running Dijkstra’s (1959) algorithm once per origin and summing shortest paths that pass through each link. sDNA configurations for each group of variables shown in Table 2 are given in Table 6.
sDNA takes input data in the form of polylines, which depending on the input data, can each represent either a complete network link, or part of a link formed from several polylines. All analyses therefore use the ‘polyline weighting’ option which applies the provided weights directly to each polyline in the input data. This contrasts the default ‘link weighting’ option which in this case would inappropriately scale down retail floor areas for polylines which represent partial links.
Rights and permissions
Open Access This article is distributed under the terms of the Creative Commons Attribution 4.0 International License (http://creativecommons.org/licenses/by/4.0/), which permits unrestricted use, distribution, and reproduction in any medium, provided you give appropriate credit to the original author(s) and the source, provide a link to the Creative Commons license, and indicate if changes were made.
About this article

Cite this article
Cooper, C.H.V., Harvey, I., Orford, S. et al. Using multiple hybrid spatial design network analysis to predict longitudinal effect of a major city centre redevelopment on pedestrian flows. Transportation 48, 643–672 (2021). https://doi.org/10.1007/s11116-019-10072-0
Published:
Issue Date:
DOI: https://doi.org/10.1007/s11116-019-10072-0