
Abstract
Regulation of gene expression is a key feature for higher eukaryotes and how chromatin topology relates to gene activation is an intense area of research. Enhancer–promoter interactions are believed to mediate activation of target genes. Bidirectional transcription represents one hallmark of active enhancers that can be measured using transcriptome technologies such as Cap analysis of gene expression (CAGE). Recently, we have developed RNA and DNA interacting complexes ligated and sequenced (RADICL-Seq) a novel methodology to map genome-wide RNA–chromatin interactions in intact nuclei. Here, we describe how CAGE and RADICL-Seq data can be used to characterize enhancer elements and identify their target genes.
You have full access to this open access chapter, Download protocol PDF
Keywords
1 Introduction
The life cycle of multicellular organisms requires the coordinated control of transcriptional processes across multiple tissues and developmental stages. Regulation of gene expression generally involves two different types of cis-acting elements: the promoter , a genomic region defining the initiation of transcription, and more distal regulatory elements called enhancers. While promoters provide the essential sites of transcriptional initiation of RNAs, they are frequently not sufficient to direct appropriate developmental and signal-dependent levels of gene expression [1, 2]. This additional information is provided by enhancers, short regions of DNA that, when bound by transcription factors (TFs), enhance RNA expression from target promoters . Enhancers can reside hundreds of thousands of base pairs (bp) away from their target gene, are typically well-conserved across genomes and their function is generally considered to depend on three-dimensional enhancer–promoter interactions [3].
Active enhancers are characterized by bidirectional transcription, which results in the production of enhancer RNAs (eRNAs) believed to facilitate long-range enhancer–promoter looping [4]. Cap analysis of gene expression (CAGE) technology captures the 5′-end of transcripts and, therefore, allows the identification of transcription start sites (TSSs) of active regulatory genomic elements (Fig. 1a, [5] and Chapter 4). Indeed, CAGE has been employed as an orthogonal approach to define active enhancers in multiple datasets and cell types [1].
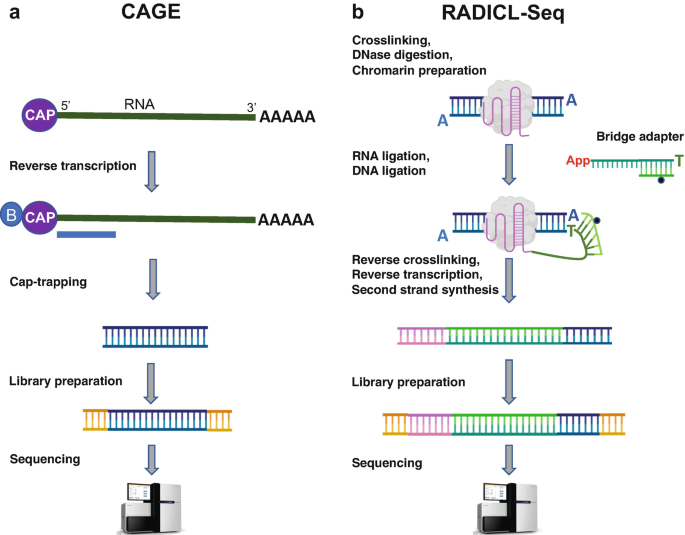
CAGE and RADICL-seq technologies. (a) Schematic overview of CAGE technology that identifies the 5′ end of transcripts (see ref. 5 for further details). (b) Schematic overview of RADICL-Seq technology aimed at capturing proximal RNA–chromatin interactions in a genome-wide manner (see ref. 8 for further details)
In recent years, the development of high-throughput molecular methods has allowed the study of the three-dimensional organization of the genome of eukaryotic cells [6]. Chromatin conformation technologies determine the proximity between loci by measuring their contact frequency and comparing it with other genomic locations in an interaction matrix. These approaches have led to the identification of the regulatory activity of enhancers and their impact on the expression of target genes. However, several active enhancers do not exhibit significantly higher contact frequencies with target promoters than with surrounding chromatin [7]. Also, the functional impact of the physical proximity of two genomic regions on the regulation of gene expression is not completely understood.
Recently, we have developed RNA And DNA Interacting Complexes Ligated and sequenced (RADICL-Seq) , a novel technology to identify genome-wide RNA–chromatin interactions (Fig. 1b and [8]). RADICL-Seq employs mild fixation and a biotinylated bridge adapter to capture RNA and DNA molecules located in close proximity while preserving the nuclear structure [8]. Compared with existing methods, RADICL-Seq improves genomic coverage and unique mapping rate efficiency, thereby increasing the detection power for several transcripts including long non-coding RNAs and intronic RNAs. By employing this technology, we have mapped the genomic occupancy of multiple RNA classes in mouse embryonic stem cells (mESCs) and oligodendrocyte progenitor cells (mOPCs), identifying general and cell type-specific interaction patterns [8].
As the enhancer–promoter looping is believed to drive transcriptional activation, the spatial proximity of the nascent RNA with the enhancer region has the potential to be captured by RADICL-Seq . Detection of such RNA–chromatin interactions has the advantage to include an additional layer of functionality for the observed physical proximity that is not possible with chromatin conformation technologies.
Here we combine publicly available CAGE and RADICL-Seq data to identify the gene targets for thousands of enhancer elements. We provide a detailed computational workflow to first call the enhancers using CAGE data and subsequently assign their target genes by leveraging RADICL-Seq data.
2 Materials
The original manuscript describing the RADICL-Seq technology can be found at https://www.nature.com/articles/s41467-020-14337-6. The RADICL-Seq significant pair data and the CAGE expression data can be downloaded from GEO (https://www.ncbi.nlm.nih.gov/geo/), under the series GSE132190. All analysis was performed on an Intel quad core CPU machine with 32 GB of memory.
3 Methods
-
1.
All the computations are done in R [9]. The following packages will be used: GenomicFeatures [10], InteractionSet [11], CAGEfightR [12], and tidyverse [13]. For genome annotation, mm10 and Gencode vM14 will be used, in order to be consistent with the original manuscript for the datasets used.
-
2.
For the RADICL-Seq significant pair tables, we subset them on the following columns for further analysis:
Column
Data
1
Chromosome of origin for the RNA
2
Midpoint location for the RNA read
6
Sense of transcription (− refers to negative strand. + is positive strand).
7
Ensembl ID of the RNA
8
RNA class
10
RNA feature
11
Chromosome for interacting DNA read
12
Midpoint location for the DNA read
14
DNA identifier (chromosome_bin; genome has been divided in 25-kb bins)
16
Dataset
17
p-Value before correction
18
p-Value after correction
-
3.
We convert the subsetted data tables into GInteractions objects, after extending each DNA and RNA midpoint positions by 1 kb on either side. In effect, we will be comparing 2 kb regions for the rest of the analysis when using RADICL-Seq significant pairs. After the conversion, the first anchor of the resulting GInteractions object would be the RNA hit regions, and the second anchor would be the DNA regions.
For each data table, the conversion can be performed by:
radicl_set <- map (radicl, function(tab) { rna <- GRanges(seqnames=tab$chrom.R, ranges=IRanges(start=tab$pos.R - flank, end=tab$pos.R + flank), strand=tab$strand.R, seqinfo=genomeInfo) %>% trim() dna <- GRanges(seqnames=tab$chrom.D, ranges=IRanges(start=tab$pos.D - flank, end=tab$pos.D+flank), seqinfo=genomeInfo) %>% trim() interaction <- GInteractions(rna, dna) mcols(interaction) <- tab interaction })
where “radicl” is the list object containing the significant pair tables, “flank” is the flanking region to be added (1 kb), and “genomeInfo” is the Seqinfo object [14] containing the mm10 chromosome information.
-
4.
The CAGE data can also be downloaded from GEO, under the series GSE132191. The data is provided as BED files containing CAGE transcription start sites (CTSS). CAGEfightR package is used for de novo promoter and enhancer identification and quantification. For details on how to process CAGE data using CAGEfightR, refer to [12].
-
5.
The CTSS BED files are first converted to BigWig files using rtracklayer package’s import and export functions.
bed <- rtracklayer::import(ctss_file) bed <- GenomicRanges::GRanges(bed, seqinfo=genomeInfo) bed_plus <- bed[ bed@strand=="+", ] bed_minus <- bed[ bed@strand=="-", ] rtracklayer::export(object=bed_plus, filename, format="BigWig" )
-
6.
The converted BigWig files are used to load and quantify CTSS reads into RangeSummarizedExperiment objects and calculate tags per million (TPM ) values.
CTSSs <- quantifyCTSSs(plusStrand=bw_plus, minusStrand=bw_minus, design=sample_info, genome=genomeInfo) %>% trim() %>% subsetBySupport(inputAssay='counts', outputColumn='support', unexpressed=0, minSamples=1) %>% calcTPM(inputAssay='counts', outputAssay='TPM ') %>% calcPooled(inputAssay='TPM ')
where “bw_plus” and “bw_minus” are plus and minus strand BigWig files, respectively.
-
7.
The quantified CTSSs are now used to detect unidirectional and bidirectional CTSS clusters, which will be taken as promoters and enhancers, respectively. Unidirectional clusters within 20 bp of one another are merged together. The clusters are then assigned transcript IDs accordingly. Any bidirectional clusters that overlap existing promoter annotations within 500 bp up- and downstream, as well as those that are annotated as promoter /5’ UTR/exons are filtered out. Once the de novo promoters and enhancers are identified, we quantify them by summing the number of CTSS reads that overlap those regions.
uni_TCs <- clusterUnidirectionally(supported_CTSSs, pooledCutoff=3, mergeDist=20) %>% trim() %>% assignTxID(txModels=txdb, outputColumn='txID') %>% assignTxType(txModels=txdb, outputColumn='txType') %>% assignTxType(txModels=txdb, outputColumn='peakTxType', swap='thick') bi_TCs <- clusterBidirectionally(CTSSs, balanceThreshold=0.9) bi_TCs <- calcBidirectionality(bi_TCs, samples=CTSSs) bi_TCs <- assignTxType(bi_TCs, txModels=txdb, tssUpstream=500, tssDownstream=500, outputColumn='txType') bi_TCs <- subset(bi_TCs, !txType %in% c('promoter ','fiveUTR','exon')) # quantify the de novo promoters TSSs <- quantifyClusters(CTSSs, clusters=uni_TCs, inputAssay='counts') %>% calcTPM() %>% calcPooled() # quantify the de novo enhancers enhancers <- quantifyClusters(CTSSs, clusters=bi_TCs) %>% calcTPM() %>% calcPooled()
where txdb is the TxDb object containing the Gencode vM14 annotations.
-
8.
The identified de novo enhancers are overlapped with the DNA regions in the RADICL-Seq significant pair sets using the findOverlaps function in the GenomicRanges package. For each enhancer overlapping a given RADICL-Seq DNA region, the corresponding RNA hit regions that pair with these regions are taken as its interacting regions. We restrict ourselves to those regions that have CAGE expression support. We also merge the overlapping DNA regions to avoid double counting of DNA-enhancer overlaps.
rad_rna <- trim(anchors(radicl_set[[n]])$first) rad_dna <- trim(anchors(radicl_set[[n]])$second) # only include those where both RNA and DNA regions have CTSS support matching_regs <- mcols(radicl_set[[n]]) %>% as_tibble() # now filter for enhancer overlap overlap <- findOverlaps(rad_dna, enhancers) ind <- unique(queryHits(overlap)) rad_dna <- rad_dna[ind] rad_rna <- rad_rna[ind] merged_rad <- GenomicRanges::reduce(rad_dna) overlap <- findOverlaps(rad_dna, merged_rad) matching_regs$merged_ind <- subjectHits(overlap)
-
9.
We can calculate how many enhancers a given RADICL-Seq DNA region (2 kb) overlaps on average. The results are shown in Fig. 2.
enh_per_dna <- Reduce(bind_rows, map (matching_regs, function(regs) { tab <- mcols(regs) n <- as_tibble(tab) %>% select(enhancer, merged_ind) %>% group_by(merged_ind) %>% summarise(length(unique(enhancer))) res <- table(n[,2]) vals <- c(unique(tab$cell_type), as.numeric(res)) names(vals) <- c('cell', names(res)) vals }))
where “matching_regs” is the list of enhancer-overlapping RADICL-Seq significant pairs for each sample as calculated from the previous step.
-
10.
To tally the RADICL-Seq RNA hit regions that have CAGE expression support, we set a filter of at least 1 out of 3 replicates for each cell type having at least 1 TPM .
exp_enh <- assays(enhancers)$TPM exp_enh <- rownames(exp_enh)[rowSums(exp_enh > 1) > 1] exp_rna <- assays(TSSs)$TPM exp_rna <- rownames(TSSs)[rowSums(exp_rna > 1) > 1]
-
11.
For each overlapping enhancer, we calculate the average number of interacting genes by counting the number of unique gene IDs associated with the paired RNA hit regions. The results are illustrated in Fig. 3.
gene_counts <- mcols(regs) %>% as_tibble() %>% select(c(enhancer, merged_ind, gene_id.R)) %>% group_by(enhancer) %>% summarise_at(vars(merged_ind, gene_id.R), function(x) {length(unique(x))})
where “regs” is the list of enhancer-overlapping RADICL-Seq significant pairs for one sample, i.e., a given element of the “matching_regs” list.
-
12.
With the list of RADICL-Seq DNA regions that overlap enhancers and their interacting RNA hit regions, we calculate the distances between the pairs and produce a distance distribution. We repeat the process for the DNA regions that do not overlap any enhancers, and test whether the two distance distributions are significantly different using Wilcoxon test.

Distribution of number of enhancers overlapping one RADICL-Seq DNA region (2 kb window centered on the midpoint for the DNA region of a given RNA–DNA significant pair). While the number of overlapping enhancers for a given DNA region can vary, the majority overlap less than five enhancers (mESC mouse embryonic stem cells, mOPC mouse oligodendrocyte progenitor cells)

Distribution of number of expressed genes linked to a single enhancer. A given gene is considered to be expressed if a CAGE cluster associated with the gene that has expression value of at least 1 tag per million (TPM) in at least one replicate sample. We establish the link between a given enhancer and a given gene by determining whether they overlap any of the RADICL-Seq DNA–RNA significant pairs (mESC mouse embryonic stem cells, mOPC mouse oligodendrocyte progenitor cells)
enhancer_dist_distrib <- bind_rows( map (matching_regs, function(regs) { tab1 <- mcols(regs) %>% as_tibble() %>% select(cell_type, merged_ind, RNA_pos, merged_pos) %>% distinct() %>% mutate(gene_radicl_dist=abs(RNA_pos - merged_pos)) })) non_enhancer_dist_distrib <- bind_rows( map (nonenh, function(mcoltab) { mcoltab %>% dplyr::select(cell_type, merged_ind, RNA_pos, merged_pos) %>% distinct() %>% mutate(gene_radicl_dist=abs(RNA_pos - merged_pos)) })) a <- dplyr::filter(enhancer_dist_distrib$gene_radicl_dist, cell_type == 'mESC') b <- dplyr::filter(non_enhancer_dist_distrib, cell_type == 'mESC') wilcox.test(a$gene_radicl_dist, b$gene_radicl_dist)
Change history
15 February 2022
Chapter 4 and Chapter 11 in: Tilman Borggrefe and Benedetto Daniele Giaimo (eds.), Enhancers and Promoters: Methods and Protocols, Methods in Molecular Biology, vol. 2351,
References
Andersson R, Gebhard C, Miguel-Escalada I, Hoof I, Bornholdt J, Boyd M, Chen Y, Zhao X, Schmidl C, Suzuki T, Ntini E, Arner E, Valen E, Li K, Schwarzfischer L, Glatz D, Raithel J, Lilje B, Rapin N, Bagger FO, Jørgensen M, Andersen PR, Bertin N, Rackham O, Burroughs AM, Baillie KJ, Ishizu Y, Shimizu Y, Furuhata E, Maeda S, Negishi Y, Mungall CJ, Meehan TF, Lassmann T, Itoh M, Kawaji H, Kondo N, Kawai J, Lennartsson A, Daub CO, Heutink P, Hume DA, Jensen TH, Suzuki H, Hayashizaki Y, Müller F, Forrest ARR, Carninci P, Rehli M, Sandelin A (2014) An Atlas of active enhancers across human cell types and tissues. Nature 507(7493):455–461. https://doi.org/10.1038/nature12787
Gosselin D, Link VM, Romanoski CE, Fonseca GJ, Eichenfield DZ, Spann NJ, Stender JD, Chun HB, Garner H, Geissmann F, Glass CK (2014) Environment drives selection and function of enhancers controlling tissue-specific macrophage identities. Cell 159(6):1327–1340. https://doi.org/10.1016/j.cell.2014.11.023
Mishra A, Hawkins RD (2017) Three-dimensional genome architecture and emerging technologies: looping in disease. Genome Med 9:1–14
Melgar MF, Collins FS, Sethupathy P (2011) Discovery of active enhancers through bidirectional expression of short transcripts. Genome Biol 12(11):R113. https://doi.org/10.1186/gb-2011-12-11-r113
Carninci P, Sandelin A, Lenhard B, Katayama S, Shimokawa K, Ponjavic J, Semple CA, Taylor MS, Engström PG, Frith MC, Forrest AR, Alkema WB, Tan SL, Plessy C, Kodzius R, Ravasi T, Kasukawa T, Fukuda S, Kanamori-Katayama M, Kitazume Y, Kawaji H, Kai C, Nakamura M, Konno H, Nakano K, Mottagui-Tabar S, Arner P, Chesi A, Gustincich S, Persichetti F, Suzuki H, Grimmond SM, Wells CA, Orlando V, Wahlestedt C, Liu ET, Harbers M, Kawai J, Bajic VB, Hume DA, Hayashizaki Y (2006) Genome-wide analysis of mammalian promoter architecture and evolution. Nat Genet 38(6):626–635. https://doi.org/10.1038/ng1789
Kempfer R, Pombo A (2020) Methods for mapping 3D chromosome architecture. Nat Rev Genet 21(4):207–226. https://doi.org/10.1038/s41576-019-0195-2
Andrey G, Schöpflin R, Jerković I, Heinrich V, Ibrahim DM, Paliou C, Hochradel M, Timmermann B, Haas S, Vingron M, Mundlos S (2017) Characterization of hundreds of regulatory landscapes in developing limbs reveals two regimes of chromatin folding. Genome Res 27(2):223–233. https://doi.org/10.1101/gr.213066.116
Bonetti A, Agostini F, Suzuki AM, Hashimoto K, Pascarella G, Gimenez J, Roos L, Nash AJ, Ghilotti M, Cameron CJF, Valentine M, Medvedeva YA, Noguchi S, Agirre E, Kashi K, Samudyata, Luginbühl J, Cazzoli R, Agrawal S, Luscombe NM, Blanchette M, Kasukawa T, de Hoon M, Arner E, Lenhard B, Plessy C, Castelo-Branco G, Orlando V, Carninci P (2020) RADICL-seq identifies general and cell type-specific principles of genome-wide RNA-chromatin interactions. Nat Commun 11(1):1018. https://doi.org/10.1038/s41467-020-14337-6
R Core Team (2014) R: A language and environment for statistical computing. R Foundation for Statistical Computing, Vienna, Austria
Lawrence M, Huber W, Pagès H, Aboyoun P, Carlson M, Gentleman R, Morgan MT, Carey VJ (2013) Software for computing and annotating genomic ranges. PLoS Comput Biol 9:e1003118. https://doi.org/10.1371/journal.pcbi.1003118
Lun ATL, Perry M, Ing-Simmons E (2016) Infrastructure for genomic interactions: bioconductor classes for Hi-C, ChIA-PET and related experiments. F1000Res 5:950. https://doi.org/10.12688/f1000research.8759.2
Thodberg M, Thieffry A, Vitting-Seerup K, Andersson R, Sandelin A (2019) CAGEfightR: analysis of 5′-end data using R/Bioconductor. BMC Bioinformatics 20:487. https://doi.org/10.1186/s12859-019-3029-5
Wickham H, Averick M, Bryan J, Chang W, McGowan LD, François R, Grolemund G, Hayes A, Henry L, Hester J, Kuhn M, Pedersen TL, Miller E, Bache SM, Müller K, Ooms J, Robinson D, Seidel DP, Spinu V, Takahashi K, Vaughan D, Wilke C, Woo K, Yutani H (2019) Welcome to the Tidyverse. J Open Source Softw 4:1686. https://doi.org/10.21105/joss.01686
Arora S, Morgan M, Carlson M, Pagès H (2020) GenomeInfoDb: utilities for manipulating chromosome names, including modifying them to follow a particular naming style. R package version 1.22.1
Acknowledgments
This work was supported by research funding from the Japanese Ministry of Education Culture, Sports, Science, and Technology (MEXT) to the RIKEN Center for Integrative Medical Sciences. Figure 1 was created with Biorender.com.
Author information
Authors and Affiliations
Corresponding authors
Editor information
Editors and Affiliations
Rights and permissions
Open Access This chapter is licensed under the terms of the Creative Commons Attribution 4.0 International License (http://creativecommons.org/licenses/by/4.0/), which permits use, sharing, adaptation, distribution and reproduction in any medium or format, as long as you give appropriate credit to the original author(s) and the source, provide a link to the Creative Commons license and indicate if changes were made.
The images or other third party material in this chapter are included in the chapter's Creative Commons license, unless indicated otherwise in a credit line to the material. If material is not included in the chapter's Creative Commons license and your intended use is not permitted by statutory regulation or exceeds the permitted use, you will need to obtain permission directly from the copyright holder.
Copyright information
© 2021 The Author(s)
About this protocol

Cite this protocol
Bonetti, A., Kwon, A.TJ., Arner, E., Carninci, P. (2021). Analysis of Enhancer–Promoter Interactions using CAGE and RADICL-Seq Technologies. In: Borggrefe, T., Giaimo, B.D. (eds) Enhancers and Promoters. Methods in Molecular Biology, vol 2351. Humana, New York, NY. https://doi.org/10.1007/978-1-0716-1597-3_11
Download citation
DOI: https://doi.org/10.1007/978-1-0716-1597-3_11
Published:
Publisher Name: Humana, New York, NY
Print ISBN: 978-1-0716-1596-6
Online ISBN: 978-1-0716-1597-3
eBook Packages: Springer Protocols