
Abstract
Background
The clinical application of cardiovascular magnetic resonance (CMR) T2 and T2* mapping is currently limited as ranges for healthy and cardiac diseases are poorly defined. In this meta-analysis we aimed to determine the weighted mean of T2 and T2* mapping values in patients with myocardial infarction (MI), heart transplantation, non-ischemic cardiomyopathies (NICM) and hypertension, and the standardized mean difference (SMD) of each population with healthy controls. Additionally, the variation of mapping outcomes between studies was investigated.
Methods
The PRISMA guidelines were followed after literature searches on PubMed and Embase. Studies reporting CMR T2 or T2* values measured in patients were included. The SMD was calculated using a random effects model and a meta-regression analysis was performed for populations with sufficient published data.
Results
One hundred fifty-four studies, including 13,804 patient and 4392 control measurements, were included. T2 values were higher in patients with MI, heart transplantation, sarcoidosis, systemic lupus erythematosus, amyloidosis, hypertrophic cardiomyopathy (HCM), dilated cardiomyopathy (DCM) and myocarditis (SMD of 2.17, 1.05, 0.87, 1.39, 1.62, 1.95, 1.90 and 1.33, respectively, P < 0.01) compared with controls. T2 values in iron overload patients (SMD = − 0.54, P = 0.30) and Anderson-Fabry disease patients (SMD = 0.52, P = 0.17) did both not differ from controls. T2* values were lower in patients with MI and iron overload (SMD of − 1.99 and − 2.39, respectively, P < 0.01) compared with controls. T2* values in HCM patients (SMD = − 0.61, P = 0.22), DCM patients (SMD = − 0.54, P = 0.06) and hypertension patients (SMD = − 1.46, P = 0.10) did not differ from controls. Multiple CMR acquisition and patient demographic factors were assessed as significant covariates, thereby influencing the mapping outcomes and causing variation between studies.
Conclusions
The clinical utility of T2 and T2* mapping to distinguish affected myocardium in patients with cardiomyopathies or heart transplantation from healthy myocardium seemed to be confirmed based on this meta-analysis. Nevertheless, variation of mapping values between studies complicates comparison with external values and therefore require local healthy reference values to clinically interpret quantitative values. Furthermore, disease differentiation seems limited, since changes in T2 and T2* values of most cardiomyopathies are similar.
Background
Ventricular dysfunction in ischemic cardiomyopathies is triggered by impaired coronary blood supply to the myocardium [1]. In non-ischemic cardiomyopathy (NICM) many factors contribute to heart failure (HF) including hypertrophic cardiomyopathy (HCM), dilated cardiomyopathy (DCM) and restrictive cardiomyopathy [2, 3]. The prevalence of HF has been rising since the year 2000 and is shown to be related to the current lifestyle in Western Society [4, 5], with increasing populations with high cardiovascular risk (obesity, hypertension and type 2 diabetes mellitus (T2DM)) [6].
Early diagnosis of cardiomyopathy is important to initiate appropriate treatment [7, 8]. Physical examination and medical history are used to assess the probability of HF, however these assessments are non-specific in early diagnosis and therefore require additional tests [8, 9]. Electrocardiography (ECG) is also used in the first assessment of HF, and although an abnormal ECG increases the probability of HF, it has low specificity and provides little information to distinguish between cardiac diseases [8]. Transthoracic echocardiography was suggested as primary imaging test in the diagnostic pathway of HF because of its wide availability and low costs, and its cardiac function assessment enables fast decision making [8, 10], it however has limitations in distinguishing between underlying diseases [11]. Cardiovascular magnetic resonance (CMR) is the golden standard to detect cardiac remodelling by assessing the global cardiac function, it allows for regional function assessment with strain analysis and furthermore enables the assessment of myocardial fibrosis with late gadolinium enhancement (LGE) [8, 12,13,14], whereas computed tomography is recommended to either exclude or to diagnose coronary artery disease [8]. Nevertheless, early myocardial structural changes are often qualitatively indistinguishable, and difficult to differentiate from overlapping findings in patients with high cardiovascular risk such as obesity, hypertension and T2DM [15,16,17,18]. Consequently, misinterpretation of cardiac remodeling in these high cardiovascular risk groups may result in incorrect diagnosis and mistreatment. The changes occurring in cardiomyopathies, however, may affect myocardial tissue properties, which can be measured quantitatively by T1, T2 and T2* mapping as part of the CMR exam [19]. In line with this, the European Society of Cardiology recently described a shifting standards from the assessment of LGE towards the use of T1 and T2 mapping in their latest position statement [20]. The clinical utility of T1 mapping has already been acknowledged and included in some guidelines [8, 13, 21, 22]. In addition, other guidelines also advocate to include T2 and T2* mapping instead of T2-weighted imaging [20, 22,23,24].
The Society for Cardiovascular Magnetic Resonance (SCMR) released clinical recommendations about parametric imaging in CMR [22]. T2 mapping values vary due to different water concentrations in the myocardium and therefore T2 mapping could be useful in infiltrative cardiomyopathies, such as iron overload and Anderson-Fabry disease, and in myocardial injury diseases featuring edema, necrosis, and hemorrhage formation [22, 25, 26]. Furthermore, T2 could contribute in the diagnosis of heart transplant rejections as edema correlates with acute heart transplant rejection [22, 27]. In addition to T2, T2* mapping values mainly depend on magnetic field inhomogeneities and are therefore clinically useful in iron related diseases, and also enable assessment of hemorrhage formation [22, 28, 29].
Reference values of T2 and T2* mapping in healthy subjects have been investigated in multiple studies [30,31,32,33]. The heterogeneity of the data caused by different field strengths, imaging techniques and settings underlines the need for local reference values [22, 33]. The objective of this study was to perform a meta-analysis to determine the weighted mean of myocardial T2 and T2* mapping values in the HF-related cardiomyopathies and heart transplantations, and standardized mean differences (SMD) with healthy controls. Knowledge of these ranges can help determine the clinically applicability of quantitative techniques. Furthermore, we aim to investigate the presumed heterogeneity of studies leading to variation in mapping outcomes, to emphasize the importance of mapping standardization.
Materials and methods
Search strategy
The study was performed according to the Preferred Reporting Items for Systematic Reviews and Meta-Analyses (PRISMA) statement [34] and the Cochrane Handbook for Systematic Review [35]. Three independent investigators (GS, MvdB and LH) systematically searched for eligible studies published between January 2011 and September 2019 in PubMed/MEDLINE and Embase applying CMR T2 or T2* mapping in humans. The search contained terms related to T2 or T2* mapping and cardiac diseases (full search terms are listed in Supplementary Data 1).
In this meta-analysis we accepted published results from randomized control trials, cohort studies and observational studies in peer-reviewed journals if they included adults aged 18 years and older with NICM or ischemic cardiomyopathy, heart transplant patients or adults with increased cardiovascular risk, and reported CMR derived T2 and/or T2* mapping values acquired at 1.5 T or 3 T. Studies were excluded if the article was not available in English or in full text.
Study selection
Titles and abstracts proposed by the databases were assessed for eligibility by one author and checked by a second author (GS, MvdB and LH). After consensus between these investigators, the full-text reports of these eligible studies were independently assessed by two investigators for final inclusion. The study quality was systematically evaluated with the Newcastle-Ottawa quality assessment scale (NOS) [36]. This scale evaluated the study quality on three domains: selection and definition of included populations (0–4 points); comparability of the controls (0–2 points); and ascertainment of the outcome (0–3 points).
Data collection
Data were extracted from the included studies by one author and checked by a second author (GS, MvdB and LH). Relevant data regarding patient characteristics, such as; study population, age, gender, body mass index, T2 and T2* values, as well as CMR imaging acquisition related information, such as; field strength, vendor, sequence and sequence parameters were extracted. Data were reported as mean ± standard deviation (SD) and data reported as median with interquartile or full range were converted using the methodology of Hozo et al. [37]. Healthy control data were extracted if available.
Data analysis
The included data were divided into two groups of reported T2 and T2* values per disease and combined into a random effects model to determine the SMD and the 95% confidence interval (CI). The heterogeneity of the included studies was defined with I2 being significant if I2 ≥ 50% (P < 0.05) by using a χ2 test. This heterogeneity was further tested by a meta-regression, sensitivity and bias analysis. Available covariates were tested for their association with the myocardial T2 and T2* values using a backwards elimination model and remaining significant covariates (P < 0.05) were included into a mixed effect model of the data. Publication bias was assessed by inspection of the funnel plots with the Egger regression asymmetry test and a sensitivity analysis was performed by omitting each study sequentially and recalculating the model. A meta-analysis was performed in each population with at least 10 published studies, as stated by the PRISMA guideline [34]. Review Manager (RevMan) v. 5.3 (Cochrane Collaboration, Copenhagen, Denmark) was used to determine the random effect models and the package “metaphor” in R v. 3.4.1 (R Foundation for Statistical Computing, Vienna, Austria) was used for the mixed effect models, bias and sensitivity analysis.
Results
Literature search
The search in PubMed and Embase revealed respectively 555 and 545 articles, and one article was manually added [38]. After removal of the duplicates, 704 articles remained for evaluation of title and abstract which resulted in 154 articles included for the final meta-analysis (Table 1). In the final exclusion step based on full text assessment, we excluded studies which presumably included (mostly) the same patient population as other included studies based on authors and method; the study with the least inclusions was excluded. The PRISMA flow diagram with rationale for exclusion is provided in Fig. 1. The number of studies per population was described as total studies (number of studies reporting T2 data & number of studies reporting T2* data): A total of 31 (22 T2 & 13 T2*) studies were included in the myocardial infarction (MI) population [26, 39,40,41,42,43,44,45,46,47,48,49,50,51,52,53,54,55,56,57,58,59,60,61,62,63,64,65,66,67,68], 11 (11 T2 & 0 T2*) in heart transplantation [27, 69,70,71,72,73,74,75,76,77,78], 70 (5 T2 & 70 T2*) in iron overload [79,80,81,82,83,84,85,86,87,88,89,90,91,92,93,94,95,96,97,98,99,100,101,102,103,104,105,106,107,108,109,110,111,112,113,114,115,116,117,118,119,120,121,122,123,124,125,126,127,128,129,130,131,132,133,134,135,136,137,138,139,140,141,142,143,144,145,146,147,148], 2 (2 T2 & 0 T2*) in sarcoidosis [149, 150], 4 (4 T2 & 0 T2*) in systemic lupus erythematosus (SLE) [151,152,153,154], 2 (2 T2 & 0 T2*) in amyloidosis [155, 156], 2 (2 T2 & 0 T2*) in Anderson-Fabry disease [157, 158], 4 (2 T2 & 2 T2*) in HCM [159,160,161,162], 9 (7 T2 & 2 T2*) in DCM [160, 163,164,165,166,167,168,169,170], 19 (19 T2 & 0 T2*) in myocarditis [25, 38, 171,172,173,174,175,176,177,178,179,180,181,182,183,184,185,186,187] and 1 (0 T2 & 1 T2*) in hypertension [188] (Table 1). The absolute T2 and T2* values are dependent on field strength [189, 190], therefore the average mapping values were noted separately for 1.5 T and 3 T, and it was also used as covariate in the meta-regression analysis. T2 and T2* mapping obtained in control subjects were recorded as values from healthy subjects, unless the control population was explicitly defined otherwise in the “population” column of Table 1.

Overview of the study review process according to the PRISMA flow diagram
Study quality
None of the included studies received the maximum NOS quality score (Table 1). All studies without healthy controls automatically received limited scores in the matching and selection section. Only 57 of the 154 included studies reported control values of healthy subjects. The case definition of patients and the ascertainment of mapping values were adequate in all studies.
Myocardial infarction
The weighted mean T2* values at 1.5 T in myocardial infarction (MI) patients was 28.5 ± 6.8 ms and 34.7 ± 3.7 ms in controls [39,40,41,42,43,44,45,46,47,48,49] (Table 1, Fig. 2). At 3 T, these were 22.0 ± 3.7 ms in MI patients and 29.6 ± 2.7 ms in controls [50, 51] (Table 1, Fig. 3). The meta-analysis confirmed significantly lower T2* values in MI patients (SMD = − 1.99, 95% Cl [− 2.70, − 1.27], P < 0.01, I2 = 98%, Fig. 4). Most studies performed CMR in ST-elevation myocardial infarction (STEMI) patients post percutaneous coronary intervention (PCI) in the acute phase [39,40,41,42,43,44, 46,47,48,49,50,51]. Some studies performed follow-up in these patient groups [42,43,44, 47, 49, 50] and Mohammadzadeh et al. [45] was the only study including non-STEMI (NSTEMI) patients. Most studies reported T2* values of multiple regions-of-interest (ROI) in the myocardium (Table 1). Although none of the tested covariates was significant, the difference in T2* values seemed larger in the infarct cores compared to the infarct zone as a whole. Significant funnel asymmetry was found for the random effects model suggesting eight missing studies with negative results (P < 0.01), while the mixed effects model did not show funnel asymmetry (P = 0.60).
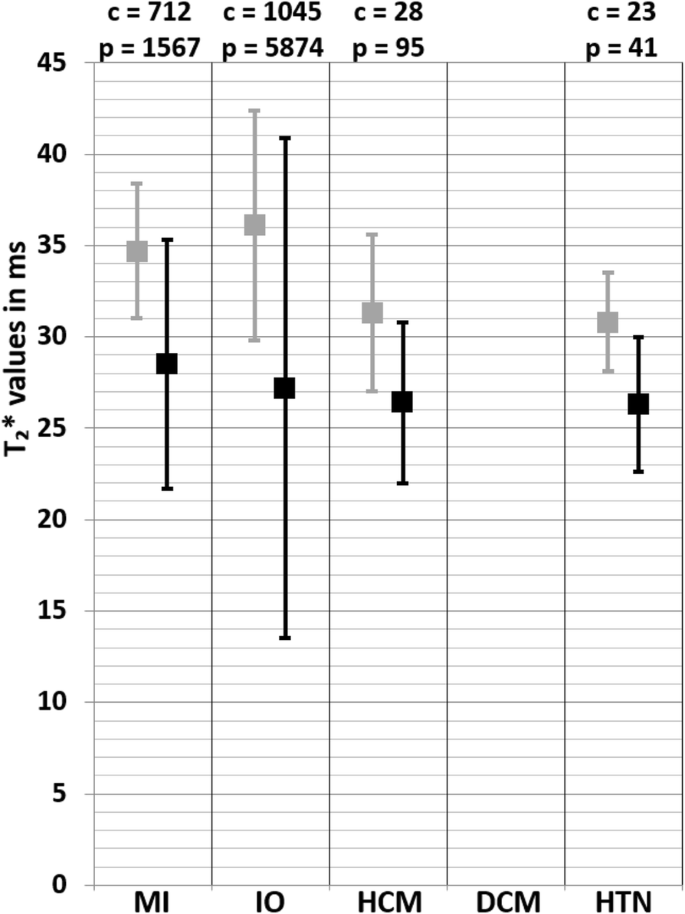
Weighted mean T2* values and weighted standard deviations (SD) of all included papers reporting T2* values of both patients (black squares) and controls (grey squares) measured at 1.5 T. The number of included patient (p) and control (c) measurements for each population is reported above the graph. MI myocardial infarction, IO iron overload, HCM hypertrophic cardiomyopathy, DCM dilated cardiomyopathy, HTN hypertension

Weighted mean T2* values and weighted standard deviations (SD) of all included papers reporting T2* values of both patients (black squares) and controls (grey squares) measured at 3 T. The number of included patient (p) and control (c) measurements for each population is reported above the graph. MI myocardial infarction, IO iron overload, HCM hypertrophic cardiomyopathy, DCM dilated cardiomyopathy, HTN hypertension

Standardized mean differences between T2* of myocardial infarction (MI) patients and healthy controls with associated random effects weight factors. CI confidence interval, IV inverse variance
The heterogeneity was not corrected with the existing covariates and therefore a second analysis was performed where the reported T2* values were divided in infarct zone or infarct core groups. The infarct zone, which is determined by LGE, is the affected myocardium characterized by edema excluding the hypo-intense core, which is the center in the infarct zone with T2* values < 20 ms identifying the presence of hemorrhage [40, 50]. Although during myocardial infarction no haemorrhagic core is present, the patients were referred for CMR after PCI in most studies. The process of reperfusion after PCI frequently leads to simultaneous microvascular obstruction and intramyocardial haemorrhage within the infarct zone [41, 191].
Eight studies [39,40,41, 43,44,45, 48, 50] explicitly reported infarct zone values. The weighted mean T2* value at 1.5 T of the infarct zones was 32.3 ± 5.4 ms and at 3 T this was 22.4 ± 2.8 ms (Fig. 1, Supplementary Data 2). These T2* values also resulted in significantly lower values compared to controls (SMD = − 1.21, 95% Cl [− 1.83, − 0.59], P < 0.01, I2 = 95%), and with a significant heterogeneity. Furthermore, infarct core values were explicitly reported in five studies [40, 41, 43, 46, 51]. The weighted mean T2* value at 1.5 T of infarct cores was 16.1 ± 4.2 ms and at 3 T this was 16.1 ± 7.6 ms (Fig. 1, Supplementary Data 2). These infarct core values showed a larger SMD (SMD = − 4.00, 95% Cl [− 5.67, − 2.32], P < 0.01, I2 = 98%), while the heterogeneity remained significant. Multiple studies reported the remote myocardium as control which had a weighted mean T2* value at 1.5 T of 34.0 ± 4.9 ms and 30.5 ± 1.0 ms at 3 T (Fig. 1, Supplementary Data 2).
The weighted mean T2 values at 1.5 T in MI patients was 58.5 ± 5.8 ms and 49.3 ± 2.6 ms in controls [26, 40, 41, 43, 49, 52,53,54,55,56,57,58,59,60,61,62,63] (Table 1, Fig. 5). At 3 T, these were 60.3 ± 9.7 ms in MI patients and 44.0 ± 3.8 ms in controls [51, 64,65,66,67,68] (Table 1, Fig. 6). Most studies restricted their inclusion to STEMI patients [40, 41, 43, 49, 51, 54,55,56,57,58,59,60, 63,64,65, 68], however some studies included specifically NSTEMI patients [52, 62, 67] and others included both STEMI and NSTEMI patients [26, 53, 61, 66]. Besides two studies [52, 62], patients in all studies underwent CMR post-PCI in the acute phase and a few studies also included follow-up data [40, 42, 43, 49, 53, 64]. T2 values of different ROIs in the myocardium were reported (Table 1), nevertheless all studies showed higher T2 values in all ROIs of MI patients except for studies reporting values of the hemorrhagic core [40, 41]. The meta-analysis confirmed significantly higher T2 values in MI patients (SMD = 2.17, 95% CI [1.79, 2.54], P < 0.01, I2 = 96%, Fig. 7). The age and percentage of men in the control group, the time between intervention and the CMR, the field strength, the type of control (remote myocardium versus healthy controls), the type of CMR acquisition sequence, the ROI location and the left ventricular ejection fraction (LVEF) in patients were significant covariates. There were no other significant residual factors remaining that accounted for the high remaining heterogeneity (I2 = 78%), though there are probably other covariates which were not tested due to insufficient data. Publication bias was detected with five possibly missing studies, however no significant asymmetry was found for either the random effects model (P = 0.10) or the mixed effects model (P = 0.55).

Weighted mean T2 values and weighted standard deviations (SD) of all included papers reporting T2 values of both patients (black squares) and controls (grey squares) measured at 1.5 T. The number of included patient (p) and control (c) measurements for each population is reported above the graph. MI myocardial infarction, Trans heart transplant, IO iron overload, SA sarcoidosis, SLE systemic lupus erythematosus, AM amyloidosis, HCM hypertrophic cardiomyopathy, DCM dilated cardiomyopathy, MC myocarditis

Weighted mean T2 values and weighted standard deviations (SD) of all included papers reporting T2 values of both patients (black squares) and controls (grey squares) measured at 3 T. The number of included patient (p) and control (c) measurements for each population is reported above the graph. MI myocardial infarction, Trans heart transplant, IO iron overload, SA sarcoidosis, SLE systemic lupus erythematosus, AM amyloidosis, HCM hypertrophic cardiomyopathy, DCM dilated cardiomyopathy, MC myocarditis

Standardized mean differences between T2 of myocardial infarction (MI) patients and healthy controls with associated random effects weight factors. CI confidence interval, IV inverse variance
The ROI location was one of the covariates and therefore an additional analysis was performed where the reported T2 values were divided in infarct zone and infarct core groups. Infarct zone T2 values were reported in 18 studies [26, 40, 43, 51, 53, 54, 56,57,58, 60,61,62,63,64,65,66,67,68]. The weighted mean T2 value at 1.5 T of infarct zones was 63.7 ± 6.4 ms and at 3 T this was 63.5 ± 10.5 ms (Fig. 2, Supplementary Data 2). The difference between patients and controls was larger when considering only the infarct zone values (SMD = 2.63, 95% Cl [2.25, 3.01], P < 0.01, I2 = 93%). The meta-analysis showed older patients, a short period between intervention and CMR, lower LVEF in patients and performing CMR on 1.5 T to increase the difference with controls. The used CMR acquisition sequence was also found as significant covariate, nevertheless none of the specified sequences provided clearly larger differences. There were no other significant residual factors remaining that accounted for the heterogeneity (I2 = 80%). Again, publication bias was found with two missing studies, however no significant asymmetry was found for either the random effects model (P = 0.76) or the mixed effects model (P = 0.58). Core T2 values were reported in five studies [40, 41, 43, 56, 60]. The weighted mean T2 value at 1.5 T of infarct cores was 51.9 ± 4.6 ms and at 3 T no values were reported (Fig. 2, Supplementary Data 2). Including only the T2 values of the infarct cores resulted in a smaller difference between patients and controls (SMD = 0.83, 95% Cl [0.37, 2.44], P < 0.01, I2 = 91%). The weighted mean T2 value at 1.5 T of remote myocardium was 49.2 ± 2.5 ms and at 3 T this was 45.0 ± 3.0 ms (Fig. 2, Supplementary Data 2).
Heart transplant
The weighted mean T2 values at 1.5 T in heart transplant patients was 54.6 ± 5.2 ms and 49.2 ± 2.5 ms in controls [27, 69,70,71,72,73,74,75,76,77,78] (Table 1, Fig. 5). All studies showed higher T2 values in patients compared to controls, only for all subgroups including patients with positive rejection biopsy these values were significantly higher. This meta-analysis confirmed significantly higher T2 values in the myocardium of heart transplant patients (SMD = 1.05, 95% CI [0.69, 1.41], P < 0.01, I2 = 65%, Fig. 8). An exploratory meta-regression analysis indicated that the rejection status, the LVEF and patient age caused the heterogeneity without remaining significant residual factors (I2 = 1%). Transplant rejection, lower LVEF and older patients resulted in larger differences between patients and controls.

Standardized mean differences between T2 of heart transplant patients and healthy controls with associated random effects weight factors. CI confidence interval, IV inverse variance
The cardiac transplant rejection was a significant covariate and therefore the population was divided between positive and negative rejection biopsies. The weighted mean T2 values in patients with a positive biopsy [27, 69, 71, 73,74,75] was 56.4 ± 3.3 ms and 52.5 ± 3.9 ms in patients with a negative biopsy [27, 69, 71,72,73,74,75,76] (Fig. 2, Supplementary Data 2). None of the studies to heart transplantation described T2 values acquired at 3 T or reported T2* values.
Iron overload
The weighted mean T2* values at 1.5 T in iron overload patients was 27.2 ± 13.7 ms and 36.1 ± 6.3 ms in controls [79,80,81,82,83,84,85,86,87,88,89,90,91,92,93,94,95,96,97,98,99,100,101,102,103,104,105,106,107,108,109,110,111,112,113,114,115,116,117,118,119,120,121,122,123,124,125,126,127,128,129,130,131,132,133,134,135,136,137,138,139,140,141,142,143,144,145,146,147] (Table 1, Fig. 2). At 3 T, these were 21.8 ± 7.8 ms in iron overload patients and 22.4 ± 3.8 ms in controls [81, 88, 127, 148] (Table 1, Fig. 3). The meta-analysis confirmed significantly lower T2* values in iron overload patients (SMD = − 2.39, 95% CI [− 3.28, − 1.49], P < 0.01, I2 = 98%, Fig. 9). The patient populations contained iron overload patients with both cardiac involvement (T2* < 20 ms) and without cardiac involvement (T2* ≥ 20 ms). Each study that included both iron overload patients and controls showed significantly lower T2* values in patients [85, 93, 95, 96, 104, 107, 113, 114, 118, 124, 128, 132, 133, 136, 139], except for two studies that showed non-significant lower T2* values [81, 88] and one study that showed non-significantly higher T2* values in patients compared to controls [79]. The type of control was found as a covariate which meant using non-cardiac involved iron overload subjects as controls caused larger differences with patients than using healthy controls. The type of patients was also found as covariate; using a population with proven cardiac involvement caused larger differences with controls than using a mix of non-cardiac and cardiac involved iron overload patients. Furthermore, the number of echoes used in the T2* sequence was determined as a covariate. These covariates, however, only partly accounted for the heterogeneity in the mixed effects model (I2 = 80%), while other tested regressors (age of patient and control population, percentage of men in patient and control population, CMR vendor, field strength and the serum ferritin concentration in patients) had no significant influence. Based on the high remaining heterogeneity there should be other covariates which were not tested due to insufficient data. Significant funnel asymmetry (P < 0.01) was only found for the random effects model suggesting five missing studies with populations showing higher T2* values compared to healthy subjects.

Standardized mean differences between T2* of iron overload patients and healthy controls with associated random effects weight factors. CI confidence interval, IV inverse variance
The type of iron overload patient was one of the covariates and therefore an additional analysis was performed on T2* values from cardiac involved iron overload patients (T2* < 20 ms) [93, 95, 96, 104, 113, 114, 123, 124, 128, 132, 136, 139, 143, 145]. The weighted mean T2* value at 1.5 T in cardiac involved iron overload patients was 11.8 ± 3.7 ms and at 3 T no T2* values were reported (Fig. 1, Supplementary Data 2). This analysis also showed significantly lower T2* values for cardiac involved iron overload patients compared to controls (SMD = − 3.59, 95% CI [− 4.69, − 2.48], P < 0.01, I2 = 97%) and this difference was also larger than controls compared to the overall iron overload population.
The weighted mean T2 values at 1.5 T in iron overload patients was 56.0 ± 13.6 ms and 58.3 ± 3.2 ms in controls [81, 82, 101] (Table 1, Fig. 5). At 3 T, these were 53.2 ± 6.2 ms in iron overload patients and 52.0 ± 5.5 ms in controls [81, 93] (Table 1, Fig. 6). Kritsaineeboon et al. [81] reported no significant changes in T2 values for iron overload patients at both 1.5 T and 3 T, while Camargo et al. [93] reported lower T2 values in iron overload patients at 1.5 T. The random effects models of all studies combined resulted in no significantly lower T2 values for iron overload patients compared to controls (SMD = − 0.54, 95% Cl [− 1.56, 0.48], P = 0.30, I2 = 86%, Fig. 10).

Standardized mean differences between T2 of iron overload patients and healthy controls with associated random effects weight factors. CI confidence interval, IV inverse variance
Sarcoidosis
The weighted mean T2 values at 1.5 T in sarcoidosis patients was 52.3 ± 3.8 ms and 49.0 ± 1.6 ms in controls [149] (Table 1, Fig. 5). At 3 T, these were 54.0 ± 12.2 ms in sarcoidosis patients and 45.0 ± 10.8 ms in controls [150] (Table 1, Fig. 6). This suggested higher T2 values in sarcoidosis patients (SMD = 0.87, 95% CI [0.55, 1.20], P < 0.01, I2 = 0%, Fig. 11). Insufficient studies were available for further analysis regarding covariates and publication bias, and there was no data that described T2* values.

Standardized mean differences between T2 of sarcoidosis patients and healthy controls with associated random effects weight factors. CI confidence interval, IV inverse variance
Systemic lupus erythematosus
The weighted mean T2 values at 1.5 T in systemic lupus erythematosus (SLE) patients was 55.7 ± 4.9 ms and 50.6 ± 3.3 ms in controls [151, 152] (Table 1, Fig. 5). At 3 T, these were 57.3 ± 8.6 ms in SLE patients and 44.4 ± 4.0 ms in controls [153, 154] (Table 1, Fig. 6). This suggested higher T2 values in SLE patients (SMD = 1.39, 95% CI [0.34, 2.44], P < 0.01, I2 = 93%, Fig. 12). Insufficient studies were available for further analysis regarding covariates and publication bias, and there were no data that described T2* values.

Standardized mean differences between T2 of systemic lupus erythematosus patients and healthy controls with associated random effects weight factors. CI confidence interval, IV inverse variance
Amyloidosis
The weighted mean T2 values at 1.5 T in amyloidosis patients was 55.3 ± 4.2 ms and 50.2 ± 2.7 ms in controls [155, 156] (Table 1, Fig. 5). All included studies reported higher T2 values in amyloidosis patients (SMD = 1.62, 95% CI [1.19, 2.06], P < 0.01, I2 = 76%, Fig. 13). Although insufficient studies were available for further analysis regarding covariates and publication bias, both included studies reported higher T2 values in amyloid light-chain amyloidosis than in transthyretin amyloidosis. Furthermore, there were no studies performed with T2 values on 3 T and there was no data that described T2* values.

Standardized mean differences between T2 of amyloidosis (AM) patients and healthy controls with associated random effects weight factors. CI confidence interval, IV inverse variance
Anderson-Fabry disease
The weighted mean T2 value at 1.5 T in Anderson-Fabry disease patients was 57.7 ± 3.0 ms [157, 158] (Table 1, Fig. 5). One study reported T2 values in controls of 47.5 ± 2.4 ms [158], suggesting a trend to higher T2 values in Anderson-Fabry disease patients (SMD = 0.52, 95% Cl [− 0.23, 1.28], P = 0.17, I2 = 71%, Fig. 14). The higher T2 values in Anderson-Fabry disease patients were caused by the reported T2 values in Anderson-Fabry disease patients with left ventricular hypertrophy (LVH) (50.4 ± 3.8 ms), while patients without LVH showed similar T2 values (47.8 ± 1.7 ms) to controls. Insufficient studies were available for further analysis regarding covariates and publication bias. Furthermore, there were no studies performed with T2 values on 3 T and there were no data that described T2* values.

Standardized mean differences between T2 of Fabry disease patients and healthy controls with associated random effects weight factors. CI confidence interval, IV inverse variance
Hypertrophic cardiomyopathy
The weighted mean T2* values at 1.5 T in HCM patients from one study was 26.4 ± 4.4 ms and 31.3 ± 4.3 ms in controls [159] (Table 1, Fig. 2). At 3 T, these were 22.3 ± 4.1 ms in HCM patients and 21.0 ± 6.4 ms in controls [160] (Table 1, Fig. 3). The study performed at 1.5 T reported values in subgroups based on the presence of fibrosis (with or without LGE) and in both subgroups the T2* value was lower compared to controls, which was only significant in the group with LGE presence [159]. In the study performed at 3 T there, however, was no significant difference in T2* values between HCM patients with or without LGE presence. As result, the analysis showed a no significant difference between HCM patients and controls (SMD = − 0.61, 95% CI [− 1.58, 0.36], P = 0.22, I2 = 87%, Fig. 15). Insufficient studies were available for further analysis regarding covariates and publication bias.

Standardized mean differences between T2* of hypertrophic cardiomyopathy (HCM) patients and healthy controls with associated random effects weight factors. CI confidence interval, IV inverse variance
The weighted mean T2 value at 1.5 T in HCM patients was 56.3 ± 4.0 ms [161, 162] (Table 1, Fig. 5). One study reported T2 values in controls of 48.1 ± 3.2 ms suggesting significantly higher T2 values in HCM patients [161] (SMD = 1.95, 95% Cl [0.93, 2.97], I2 = N/A, P < 0.01, Fig. 16). In that same study [161] the T2 values were measured in the patient myocardium with visually high T2, which was present in 38% of the patients. For the patients without LGE in that study the myocardial T2 value of 48.8 ± 2.4 ms was not significantly different from controls. Furthermore, there were no studies performed with T2 values acquired at 3 T and insufficient studies were available for further analysis regarding covariates and publication bias.

Standardized mean differences between T2 of hypertrophic cardiomyopathy (HCM) patients and healthy controls with associated random effects weight factors. CI confidence interval, IV inverse variance
Dilated cardiomyopathy
The weighted mean T2* value at 3 T in DCM patients was 22.7 ± 3.6 ms [160, 163] and only one of those studies reported T2* values in controls of 21.0 ± 6.4 ms [160] (Table 1, Fig. 3). The random effects model was therefore only based on that study, and since that study reported T2* values of 18.7 ± 3.1 ms in DCM patients there was no significant change in T2* values (SMD = − 0.54, 95% Cl [− 1.09, 0.01], I2 = N/A, P = 0.06, Fig. 17). In both studies, patients had chronic established DCM and without myocarditis or other cardiomyopathies [160, 163]. Furthermore, there were no studies performed with T2* values acquired at 1.5 T and there were also insufficient studies available for further analysis regarding covariates and publication bias.

Standardized mean differences between T2* of dilated cardiomyopathy (DCM) patients and healthy controls with associated random effects weight factors. CI confidence interval, IV inverse variance
The weighted mean T2 values at 1.5 T in DCM patients was 62.9 ± 5.7 ms and 55.4 ± 3.5 ms in controls [164,165,166,167,168,169] (Table 1, Fig. 5). At 3 T, these were 47.0 ± 5.0 ms in DCM patients and 45.0 ± 3.0 ms in controls [170] (Table 1, Fig. 6). All studies reported significantly higher T2 values in DCM patients compared to controls, except for the single study performed at 3 T [170]. The similar T2 values of patients and controls in this study might be related to their ROI placement, since they explicitly excluded positive LGE segments from the ROI, while all other studies used the entire myocardium without excluding positive LGE segments [164,165,166,167,168,169]. Nevertheless, the T2 values of positive and negative LGE segments were similar in all studies that reported T2 values of both segments [166,167,168]. The overall meta-analysis confirmed the significantly higher T2 values in DCM patients (SMD = 1.90, 95% CI [1.07, 2.72], P < 0.01, I2 = 89%, Fig. 18) and an exploratory meta-regression analysis indicated the MR vendor and the age difference between DCM patients and controls as possible covariates. The use of a Philips Healthcare CMR scanner and a bigger age difference between control and patient groups resulted in a larger SMD between DCM patients and controls.

Standardized mean differences between T2 of dilated cardiomyopathy (DCM) patients and healthy controls with associated random effects weight factors. CI confidence interval, IV inverse variance
Myocarditis
The weighted mean T2 values at 1.5 T in myocarditis patients was 61.9 ± 11.5 ms and 54.4 ± 5.9 ms in controls [25, 38, 171,172,173,174,175,176,177,178,179,180,181,182,183,184,185] (Table 1, Fig. 5). At 3 T, these were 63.8 ± 8.0 ms in myocarditis patients and 53.3 ± 3.3 ms in controls [186, 187] (Table 1, Fig. 6). The meta-analysis confirmed significantly higher T2 values in myocarditis patients (SMD = 1.33, 95% CI [1.00, 1.67], P < 0.01, I2 = 84%, Fig. 19). Multiple significant covariates were identified including; the difference in LVEF between patients and controls, the difference in percentage men between patients and controls, the time between symptoms and CMR, the number of echoes used in the CMR acquisition sequence, the CMR vendor and the slice thickness. These covariates together corrected for the total heterogeneity (I2 = 0%) and resulted in a larger SMD between myocarditis patients and controls when the same percentages of men was used in both groups, a significantly decreased LVEF was seen in patients, six echoes were acquired for the mapping, a Siemens Healthineers CMR vendor was used, a bigger slice thickness was used, and when the patients were scanned in the acute phase of myocarditis. Significant asymmetry was not found for either the random effects model (P = 0.12) or the mixed effects model (P = 0.10).

Standardized mean differences between T2 of myocarditis (MC) patients and healthy controls with associated random effects weight factors. CI confidence interval, IV inverse variance
The time between symptom onset and CMR was found as significant covariate and therefore the population was divided between T2 values from patients in the acute phase and non-acute phase [192]. Acute myocarditis in patients was diagnosed using the European Society of Cardiology guideline [193] and these patients were referred for CMR shortly after symptom onset in the acute phase (< 14 days). Myocarditis patients in the non-acute phase either had chronic symptom duration (> 14 days) or underwent CMR follow-up. The weighted T2 value of myocarditis patients in the acute phase at 1.5 T was 63.5 ± 15.0 ms and at 3 T this was 63.8 ± 8.0 ms [25, 38, 167, 172,173,174,175,176,177,178,179, 181, 183,184,185,186,187] (Fig. 2, Supplementary Data 2). The weighted T2 value of myocarditis patients in the non-acute phase at 1.5 T was 58.3 ± 4.3 ms [173, 174, 179, 185] and at 3 T no T2 values were reported (Fig. 2, Supplementary Data 2). Furthermore, there were no studies that described T2* values for myocarditis.
Hypertension
One study reported T2* values at 1.5 T in hypertension patients of 26.3 ± 3.7 ms and 30.8 ± 2.7 ms in controls [188] (Table 1, Fig. 2). This suggested lower T2* values in hypertension patients, nevertheless this was not significant (SMD = − 1.46, 95% CI [− 3.21, 0.29], P = 0.10, I2 = 92%, Fig. 20). This study classified the included hypertension population in either presence of LVH or no presence of LVH, and showed in both subgroups lower T2* values, however in hypertension patients with LVH the T2* values were lowest. Furthermore, insufficient studies were available for further analysis regarding covariates and publication bias, and there were no studies that described T2* values acquired at 3 T or T2 results. Also, no published data was found on T2 or T2* for the cardiovascular risk populations obesity and diabetes.

Standardized mean differences between T2* of hypertension (HTN) patients and healthy controls with associated random effects weight factors. CI confidence interval, IV inverse variance
Discussion
Quantitative analysis of factors that modulate myocardial T2 and T2*, such as edema, lipids and paramagnetic iron-containing depositions, can potentially provide additional diagnostic information to distinguish between myocardial diseases and healthy myocardium. This meta-analysis confirmed that T2 mapping can help differentiate between healthy subjects and patients affected by MI, DCM, myocarditis or heart transplantation, since T2 values were higher in these populations [22]. Although T2 mapping has been expected to be sensitive to iron as well [22], no significantly lower T2 values were found between iron overload related diseases and healthy myocardium (P = 0.30). On sarcoidosis, SLE, amyloidosis, sarcoidosis, Anderson-Fabry disease and HCM insufficient studies were reported for further analysis, nevertheless the available data suggested T2 values to be higher within these diseases, with an exception for Anderson-Fabry disease patients without LVH. Furthermore, this meta-analysis confirmed that T2* mapping can differentiate between healthy myocardium and myocardium affected in MI and iron overload, since T2* values were lower in both of these populations [22]. For HCM, DCM and hypertension patients, the limited available T2* mapping studies also gave some indication of lower T2* values compared to controls, however this was overall not significant. For all included cardiac diseases in this meta-analysis the T2 values were higher, with iron overload patients as an exception showing lower T2 values, and T2* values were lower. These similarities in T2 and T2* values between cardiac diseases prevent further differentiation in disease type, as opposed to differentiation from the healthy.
Reported T2 and T2* values in healthy subjects showed large variation between studies, which could partly be due to the lack of acquisition standardization. In the standardized CMR imaging guideline and protocol published in 2013 [194], T2* mapping was only described as a clinical applicable technique to assess cardiac iron deposition and T2 mapping was defined as a research-domain technique [194, 195]. T2 mapping sequences were stated as optional since there was no standardization yet [194], which led to different acquisition approaches and therefore potentially acquisition related variation in T2 values. In 2017, clinical recommendations were released regarding parametric imaging of both T2 and T2* mapping and defined standardized data acquisition and analysis [22]. They stated that local healthy T2 and T2* values should be determined in order to clinically use these quantitative techniques, which is now confirmed by this meta-analysis considering the wide variation of healthy T2 and T2* values (Figs. 2, 3, 5 and 6). The use of normal scan results of clinically referred patients could be used to determine reference values, however this is not recommended due to referral bias. Age- and gender-matching of the control group is necessary [22], since both are known to influence T2 and T2* values [30]. Furthermore, the clinical recommendations also stated specific imaging protocols, technical requirements of sequences and image planning for T2 and T2* mapping, which should reduce variability in image acquisition from then onward [22]. This meta-analysis includes multiple studies that were published prior to this guideline and showed the heterogeneity to be significantly influenced by the sequence based covariates, which has previously already been concluded from a direct comparison between sequences [196]. This analysis also showed the variation between CMR vendors with on 1.5 T healthy control T2 values of 54.9 ± 3.3 ms at Philips (n = 13 studies) and 50.0 ± 2.5 ms at Siemens (n = 22) and T2* values of 34.1 ± 6.5 ms at Philips (n = 5), 30.8 ± 4.5 ms at Siemens (n = 3) and 55.0 ± 13.0 ms at General Eletric (GE) (n = 1), and on 3 T healthy control T2 values of 44.7 ± 5.8 ms at Philips (n = 6) and 48.0 ± 3.0 ms at Siemens (n = 5), and T2* values of 23.9 ± 4.7 at Philips (n = 2), 21.0 ± 4.8 ms at Siemens (n = 1) and 21.0 ± 6.4 ms at GE (n = 1). These differences in vendor and field strength should be kept in mind when T2 and T2* values are used within a clinical protocol.
In addition to the clinical guideline on T2 and T2* acquisitions [22], following the recommendations in image analysis could reduce the non-physiological variation of T2 and T2* values. The clinical recommendations on acquisition and ROI placement are described specifically per disease [22], and this meta-analysis confirmed the different approaches in analysis. In general the ROI should be placed outside positive LGE myocardium areas and include non-fibrous myocardium [22]. T2 values measured in positive LGE myocardium should therefore be interpreted cautiously. Analysis of T2 in diffuse diseases, such as HCM and DCM, were mostly performed based on one or three short axis (SAx) slices using global assessment [162, 164,165,166,167,168,169], as recommended [22]. In patchy diseases, such as amyloidosis and Anderson-Fabry disease, the recommendations state that the T2 analysis should also include a single 3 chamber or 4 chamber view acquisition additionally to basal and mid-ventricular SAx slices [22]. Only one study actually followed these recommendations [158], while for the other cardiac patchy disease studies one or more recommended slices were not included [155,156,157]. In focal diseases, such as MI and myocarditis, the ROI differs between patients because the location of the abnormality is different, and therefore the guideline recommends multiple SAx acquisition to cover the whole myocardium and to place the ROI in visually abnormal myocardium [22]. Most included studies in this meta-analysis therefore acquired multiple SAx slices [51, 54,55,56, 61, 63, 65], however some studies acquired only one [60] or three [49] SAx slices at the level of the infarcted area, which is more prone to missing the infarct core. In the studies with myocarditis patients mapping acquisition was generally also performed over multiple SAx covering the whole myocardium [38, 171,172,173, 175,176,177,178,179,180, 182, 183, 185], however in some studies the T2 values were only acquired from a LGE hyperintense based ROI [25, 174, 181, 184, 187]. Also, studies including MI, often distinguish between the infarct region or core and use remote myocardium as the healthy control tissue. In these studies the ROI placement was generally based on LGE hyperintense regions [26, 41, 49, 51, 57, 58, 60,61,62,63, 65, 67, 68], 2SD change of T2 signal intensity [40, 43, 54, 56, 59, 60] or T2* values [41, 43, 56]. This meta-analysis showed that ROI placement significantly influences the T2 and T2* outcome and the separate analysis showed the infarct zone to have a larger T2 difference with controls than the infarct core, while the infarct core showed a larger T2* difference with controls than the infarct zone. Lastly, for studies including iron overload patients most T2* measurements were performed in the intraventricular septum for reproducibility, because the lateral wall often contains dephasing artefacts. Nevertheless, some studies reported an average of the mid-ventricular SAx slice [87, 115, 119, 134] or the entire myocardium [106, 125, 127,128,129,130,131,132], which especially on 3 T [127] could lead to some unrealistic T2* values due to aforementioned artefacts.
In this meta-analysis including MI patients other covariates aside from the ROI placement had a significant effect on T2 and T2* mapping outcomes. These covariates included the use of remote myocardium as control values instead of healthy controls, the timing of CMR acquisition after reperfusion, and the sequence that was used. The first covariate that included the use of remote myocardium as control, showed that remote myocardium is physiologically different from healthy tissue and therefore is not an appropriate control tissue [197, 198]. Followed by the second covariate for timing of the CMR imaging after PCI, for which histologically is verified in swine that edema and haemorrhage formation peaks in the acute phase 2 h and 7 days post-PCI [199]. These peaks were also detected in the acquired T2 values in humans at the same day and at 10 days post-PCI, compared to 3 days post-PCI [43]. These results were contradicted by another study [64] that reported higher T2 values at 3 days post-PCI compared to the same day or at 7 days post-PCI. The third covariate showed that the use of a spin-echo based sequence provides larger differences between MI patients and controls, than the gradient-echo-spin-echo or T2-prepared balanced steady-state free procession sequences, while the latter two are currently recommended in the general guideline [22]. Lastly due to the remaining high heterogeneity of the MI meta-analysis other covariates are expected to influence the T2 and T2* mapping outcomes in addition to the ones identified here.
In this meta-analysis including heart transplant patients the main distinct covariate was the rejection status of the transplanted heart. Acute cellular rejection is characterized by infiltration of inflammatory cells accompanied with edema resulting in higher T2 values [22, 200], which was also reported in most included studies [22, 27, 71,72,73, 75, 76, 200]. Nevertheless, patients with negative biopsies also showed higher T2 values than controls [69, 71, 75], suggesting that the higher T2 values in heart transplant patients may also be related to the inflammatory changes from the transplantation process. The exploratory meta-analysis, however, indicated that positive rejection was a significant covariate to result in larger differences of T2 values between heart transplant patients and healthy controls [27, 72, 73, 77], and therefore further research is needed to investigate the clinical applicability of T2 mapping for early detection of heart transplant rejection.
In this meta-analysis all transfusion-dependent diseases leading to iron overload were evaluated in one group including thalassemia, sickle cell disease and anaemias [201]. The overall average T2* value for iron overload patients was 27.2 ± 13.7 ms, which was above the established iron overload cut-off (T2* < 20 ms) [195]. This could be due to the fact that most studies reported T2* values without distinguishing between cardiac or non-cardiac iron overload involvement. Some studies provided T2* values of cardiac involved patients using < 20 ms as a clinical cut-off [22]. Consequently, the mean T2* value of these cardiac involved patients was only 11.8 ± 3.7 ms, which was significantly lower than the controls. The type of controls should ideally only include healthy volunteers, however in some studies also non-cardiac involved iron overload patients were used as controls. The T2* value from real healthy volunteers of 32.4 ± 5.6 ms [79, 81, 85, 88, 93, 107, 118, 133] was lower than the 35.7 ± 6.4 ms from non-cardiac iron overload patients [95, 96, 104, 113, 114, 124, 127, 132], and therefore the accuracy of the T2* < 20 ms cut-off to establish cardiac involvement could be challenged. The current recommendation advises to perform T2* mapping on 1.5 T, since higher field strengths show more susceptibility artefacts [22]. Nonetheless, two studies [81, 88] were performed at 3 T as well as 1.5 T including patients and controls, in which ROI placement was performed at the mid-ventricular septum to avoid susceptibility artefacts [22]. As expected, these studies showed a larger SMD between healthy controls and iron overload patients at 3 T compared to 1.5 T (SMD of − 0.27 and − 0.16), since the transverse relativity of paramagnetic substrates increases with field strength [202]. These last findings show that iron overload evaluation on 3 T seems to be a trade-off between increased risk on artefacts and a higher iron sensitivity.
Furthermore, T2 mapping was expected to be sensitive for iron overload [22], however this was not unequivocally confirmed by this meta-analysis (SMD = − 0.54, P = 0.30). One study performed on 1.5 T and 3 T showed no statistically significant T2 changes in iron overload patients [81], while others did show clear changes in T2 values [82, 93, 101]. In this first study only 6% of their patients had cardiac involvement, which might explain the lack of change in T2. The other studies showed a high correlation between T2 and T2* changes and significantly lower T2 values in patients with cardiac involved iron overload compared to healthy controls suggesting that T2 to could indeed be sensitive to iron overload [82, 93, 101]. More research is needed to validate this conclusion.
In Anderson-Fabry disease only patients with LVH showed significantly higher T2 values compared to healthy controls [158]. Previous research showed that native T1 mapping is the most sensitive CMR parameter in Anderson-Fabry disease and that Anderson-Fabry disease patients showed lower T1 values than controls regardless of LV function and morphology, and therefore T1 mapping is also sensitive to distinguish between controls and Anderson-Fabry disease patients without LVH [203]. One study, which was not included within this meta-analysis because it was published previous to our search period, also reported higher T2 values in Anderson-Fabry disease patients compared to both HCM patients and healthy controls, suggesting that T2 mapping is also a sensitive CMR marker to early assess cardiac involvement in Anderson-Fabry disease patients without LVH [204].
The higher T2 values in DCM patients found in this meta-analysis confirmed the immunohistologal evidence of chronic myocardial inflammation for this disease [205]. Studies reporting T2 values of DCM subgroups seemed contradicting, since one study [166] showed higher T2 values in severe DCM compared to mild DCM (P < 0.05), while another [167], though not significant, showed lower T2 values in severe DCM compared to mild DCM. Nevertheless, overall higher T2 values in DCM patients was confirmed by this meta-analysis.
This meta-analysis including studies with myocarditis patients confirmed the expected higher T2 values in the acute phase. All studies reported significantly higher T2 values except for one study that showed non-significantly higher T2 values in the acute phase compared to healthy controls, with 65.3 ± 45.4 ms and 53.7 ± 31.0 ms, respectively, which was mainly due to the broad SD of both groups [184]. Aside from the higher T2 values in the acute phase, a follow-up study showed that 3 and 12 months after symptom onset the T2 values returned to normal [174]. Another follow-up study confirmed these normal T2 values at 189 days after symptom onset, and also showed that after 40 days the T2 values were still significantly higher compared to healthy controls, with 52.4 ± 1.0 ms and 50.4 ± 2.3 ms, respectively [185]. These follow-up studies suggest that T2 mapping in myocarditis is most valuable in the acute phase in addition to the Lake Louise criteria that include histology and CMR with T1- and T2-weighted imaging.
The single study that reported T2 values from HCM patients and controls showed significantly higher T2 values in patients [158]. Two studies compared the T2* values from HCM patients with healthy controls, however their results were contradicting. One study at 1.5 T reported significantly lower T2* values in HCM patients compared to controls with 26.2 ± 4.6 ms and 31.3 ± 4.3 ms, respectively [159], whereas the other study at 3 T reported no significant difference with 22.3 ± 4.1 ms and 21.0 ± 6.4 ms, respectively [160]. Since early treatment is key for HCM patients, it is important to be able to distinguish LVH changes due to either HCM or to hypertension. Differentiating between HCM and hypertension related LVH using only parametric imaging is not possible, as this differentiation depends on multiple clinical factors [13]. Nevertheless one study reported on hypertension patients and showed lower T2* values at 3 T for both hypertension patients with LVH (23.8 ± 3.1 ms) and without LVH (28.6 ± 4.2 ms) compared to healthy controls (30.8 ± 2.7 ms) [50]. Based on these limited available studies no conclusion can be drawn on the clinical relevance of T2 and T2* mapping. More research could enable to determine the clinical applicability of these mapping techniques, while T1 mapping has already shown to be promising in distinguishing hypertension related LVH and HCM [21, 206]. Furthermore, as the incidence of cardiomyopathies is related to obesity and T2DM [8] it is important to determine whether these high cardiovascular risk factors cause myocardial tissue adaptation and if these are distinguishable with quantitative techniques. Unfortunately, no T2 and T2* mapping of these risk populations is yet, and therefore we have to rely on the values of cardiac diseases without considering these risk factors.
Conclusion
This meta-analysis showed that T2 and T2* values of both patients and healthy controls demonstrate variation between studies related to differences in population demographics, CMR vendor, acquisition methods and analysis approach. This variation limits comparison between centers and therefore each center requires local T2 and T2* reference values to distinguish affected myocardium in cardiomyopathies from healthy myocardium. To this end reference values should be obtained in, preferably matched, healthy controls using the same CMR acquisition method as in patient care. Although similarities of changes in T2 and T2* values between cardiac diseases limits direct differentiation, this paper provides T2 and T2* mapping data which, together with other CMR parameters such as T1 mapping, ECV and LGE, can help to differentiate between cardiac disease entities.
Availability of data and materials
The data generated to reach the conclusions of this meta-analysis are available from the corresponding author on reasonable request.
Change history
15 June 2020
An amendment to this paper has been published and can be accessed via the original article.
Abbreviations
- CMR:
-
Cardiovascular magnetic resonance
- CI:
-
Confidence interval
- DCM:
-
Dilated cardiomyopathy
- ECG:
-
Electrocardiogram
- GE:
-
General Electric
- HCM:
-
Hypertrophic cardiomyopathy
- HF:
-
Heart failure
- IO:
-
Iron overload
- LGE:
-
Late gadolinium enhancement
- LVEF:
-
Left ventricular ejection fraction
- LVH:
-
Left ventricular hypertrophy
- MI:
-
Myocardial infarction
- NICM:
-
Non-ischemic cardiomyopathy
- NOS:
-
Newcastle-Ottawa quality assessment scale
- NSTEMI:
-
Non-ST elevation myocardial infarction
- PCI:
-
Percutaneous coronary intervention
- PRISMA:
-
Preferred Reporting Items for Systematic Reviews and Meta-Analyses
- ROI:
-
Region-of-interest
- SAx:
-
Short axis
- SCMR:
-
Society for Cardiovascular Magnetic Resonance
- SD:
-
Standard deviation
- SLE:
-
Systemic lupus erythematosus
- SMD:
-
Standardized mean difference
- STEMI:
-
ST-elevation myocardial infarction
- T2DM:
-
Type 2 diabetes mellitus
References
Felker GM, Shaw LK, O’Connor CM. A standardized definition of ischemic cardiomyopathy for use in clinical research. J Am Coll Cardiol. 2002;39(2):210–8.
Seferović PM, Polovina M, Bauersachs J, Arad M, Gal TB, Lund LH, et al. Heart failure in cardiomyopathies: a position paper from the heart failure Association of the European Society of cardiology. Eur J Heart Fail. 2019;21(5):553–76.
Wu AH. Management of patients with non-ischaemic cardiomyopathy. Heart. 2007;93(3):403–8.
Benjamin EJ, Blaha MJ, Chiuve SE, Das SR, Deo R, de Ferranti SD, et al. Heart disease and stroke statistics—2017 update - 21. cardiomyopathy and heart failure. Circulation. 2017;135:420–40.
Lam CSP, Donal E, Kraigher-Krainer E, Vasan RS. Epidemiology and clinical course of heart failure with preserved ejection fraction. Eur J Heart Fail. 2011;13(1):18–28.
Benjamin EJ, Muntner P, Alonso A, Bittencourt MS, Callaway CW, Carson AP, et al. Heart disease and stroke statistics–2019 update: a report from the american heart association - 20. Cardiomyopathy and Heart Failure. Circulation. 2019;139:438–54.
Collins S, Storrow AB, Albert N, Butller J, Ezekowitz JA, Felker GM. Early Management of Patients with acute heart failure: state of the art and future directions. J Card Fail. 2015;21(1):27–43.
Ponikowski P, Voors AA, Anker SD, Bueno H, Cleland JGF, Coats AJS, et al. 2016 ESC guidelines for the diagnosis and treatment of acute and chronic heart failure. Eur Heart J. 2016;37(27):2129–200.
Kelder JC, Cramer MJ, Van Wijngaarden J, Van Tooren R, Mosterd A, Moons KGM, et al. The diagnostic value of physical examination and additional testing in primary care patients with suspected heart failure. Circulation. 2011;124(25):2865–73.
Čelutkienė J, Lainscak M, Anderson L, Gayat E, Grapsa J, Harjola VP, et al. Imaging in patients with suspected acute heart failure: timeline approach position statement on behalf of the heart failure Association of the European Society of cardiology. Eur J Heart Fail. 2019;22:181–95.
Bejar D, Colombo PC, Latif F, Yuzefpolskaya M. Infiltrative cardiomyopathies. Clin Med Insights Cardiol. 2015;9:29–38.
Kuruvilla S, Adenaw N, Katwal AB, Lipinski MJ, Kramer CM, Salerno M. Late gadolinium enhancement on cardiac magnetic resonance predicts adverse cardiovascular outcomes in nonischemic cardiomyopathy: a systematic review and meta-analysis. Circ Cardiovasc Imaging. 2014;7(2):250–8.
Elliot PM, Anastasakis A, Borger MA, Borggrefe M, Cecchi F, Charron P, et al. 2014 ESC guidelines on diagnosis and management of hypertrophic cardiomyopathy: the task force for the diagnosis and management of hypertrophic cardiomyopathy of the European Society of Cardiology (ESC). Eur Heart J. 2014;35(39):2733–79.
Scatteia A, Baritussio A, Bucciarelli-Ducci C. Strain imaging using cardiac magnetic resonance. Heart Fail Rev. 2017;22(4):465–76.
Aurigemma GP, De Simone G, Fitzgibbons TP. Cardiac remodeling in obesity. Circ Cardiovasc Imaging. 2013;6(1):142–52.
Cokkinos DV, Belogianneas C. Left ventricular remodelling: a problem in search of solutions. Eur Cardiol Rev. 2016;11(1):29–35.
González A, Ravassa S, López B, Moreno MU, Beaumont J, San José G, et al. Myocardial remodeling in hypertension toward a new view of hypertensive heart disease. Hypertension. 2018;72(3):549–58.
Yap J, Tay WT, Teng THK, Anand I, Richards AM, Ling LH, et al. Association of Diabetes Mellitus on cardiac remodeling, quality of life, and clinical outcomes in heart failure with reduced and preserved ejection fraction. J Am Heart Assoc. 2019;8(17):e013114.
Hamlin SA, Henry TS, Little BP, Lerakis S, Stillman AE. Mapping the future of cardiac MR imaging: case-based review of T1 and T2 mapping techniques. Radiographics. 2014;34(6):1594–611.
Čelutkienė J, Plymen CM, Flachskampf FA, de Boer RA, Grapsa J, Manka R, et al. Innovative imaging methods in heart failure: a shifting paradigm in cardiac assessment. Position statement on behalf of the heart failure Association of the European Society of cardiology. Eur J Heart Fail. 2018;20(12):1615–33.
van den Boomen M, Slart RHJA, Hulleman EV, Dierckx RAJO, Velthuis BK, van der Harst P, et al. Native T1 reference values for nonischemic cardiomyopathies and populations with increased cardiovascular risk: a systematic review and meta-analysis. J Magn Reson Imaging. 2018;47(4):891–912.
Messroghli DR, Moon JC, Ferreira VM, Grosse-wortmann L, He T, Kellman P, et al. Clinical recommendations for cardiovascular magnetic resonance mapping of T1 , T2 , T2 * and extracellular volume : A consensus statement by the Society for Cardiovascular Magnetic Resonance ( SCMR ) endorsed by the European Association for Cardiovascular. J Cardiovasc Magn Reson. 2017;19:75.
Badano LP, Miglioranza MH, Edvardsen T, Colafranceschi AS, Muraru D, Bacal F, et al. European Association of Cardiovascular Imaging/cardiovascular imaging Department of the Brazilian Society of cardiology recommendations for the use of cardiac imaging to assess and follow patients after heart transplantation. Eur Heart J Cardiovasc Imaging. 2015;16(9):919–48.
Habib G, Bucciarelli-Ducci C, Caforio ALP, Cardim N, Charron P, Cosyns B, et al. Multimodality imaging in restrictive cardiomyopathies: An EACVI expert consensus document in collaboration with the “working group on myocardial and pericardial diseases” of the European Society of Cardiology Endorsed by the Indian academy of Echocardiogr. Eur Heart J Cardiovasc Imaging. 2017;18(10):1090–1.
Thavendiranathan P, Walls M, Giri S, Verhaert D, Rajagopalan S, Moore S, et al. Improved detection of myocardial involvement in acute inflammatory cardiomyopathies using T2 mapping. Circ Cardiovasc Imaging. 2013;5(1):102–10.
Verhaert D, Thavendiranathan P, Giri S, Mihai G, Rajagopalan S, Simonetti OP, et al. Direct T2 quantification of myocardial edema in acute ischemic injury. JACC Cardiovasc Imaging. 2014;4(3):269–78.
Wasielewski M, McGee E, Usman AA, McDonald J, Gordon R, Taimen K, et al. Cardiac magnetic resonance T2 mapping in the monitoring and follow-up of acute cardiac transplant rejection. Circ Cardiovasc Imaging. 2012;5(6):782–90.
Carpenter JP, He T, Kirk P, Roughton M, Anderson LJ, De Noronha SV, et al. On T2* magnetic resonance and cardiac iron. Circulation. 2011;123(14):1519–28.
Lota AS, Gatehouse PD, Mohiaddin RH. T2 mapping and T2* imaging in heart failure. Heart Fail Rev. 2017;22(4):431–40.
Roy C, Slimani A, De Meester C, Amzulescu M, Pasquet A, Vancraeynest D, et al. Age and sex corrected normal reference values of T1, T2 T2∗and ECV in healthy subjects at 3T CMR. J Cardiovasc Magn Reson. 2017;19:72.
Maceira AM, Monmeneu JV, Igual-Muñoz B, Lopez-Lereu PM, Garcia PM, Cosin J. Reference values for regional and global myocardial T2 mapping with cardiovascular magnetic resonance at 1.5T and 3T. Poster presented at: 18th Annual SCMR Scientific Sessions. France: Nice; 2015.
Granitz M, Motloch LJ, Granitz C, Meissnitzer M, Hitzl W, Hergan K, et al. Comparison of native myocardial T1 and T2 mapping at 1.5T and 3T in healthy volunteers: reference values and clinical implications. Wien Klin Wochenschr. 2019;131(7–8):143–55.
Von Knobelsdorff-Brenkenhoff F, Prothmann M, Dieringer MA, Wassmuth R, Greiser A, Schwenke C, et al. Myocardial T1 and T2 mapping at 3 T: reference values, influencing factors and implications. J Cardiovasc Magn Reson. 2013;15:53.
Shamsheer L, Moher D, Clarke M, Ghersi D, Liberati A, Petticrew M, et al. Preferred reporting items for systematic review and meta-analysis protocols (PRISMA-P) 2015: elaboration and explanation. BMJ. 2015;350:g7647.
Higgins JPT, Green S. Cochrane handbook for systematic reviews of interventions version 5.1.0 [updated march 2011]. London: The Cochrane Collaboration; 2011. https://training.cochrane.org/handbook/archive/v5.1/.
Margulis AV, Pladevall M, Riera-guardia N, Varas-lorenzo C, Hazell L, Berkman ND, et al. Quality assessment of observational studies in a drug-safety systematic review, comparison of two tools: the Newcastle-Ottawa scale and the RTI item bank. Clin Epidemiol. 2014;6:359–68.
Hozo SP, Djulbegovic B, Hozo I. Estimating the mean and variance from the median, range, and the size of a sample. BMC Med Res Methodol. 2005;5:13.
Luetkens JA, Faron A, Isaak A, Dabir D, Kuetting D, Feisst A, et al. Comparison of original and 2018 Lake Louise criteria for diagnosis of acute myocarditis: results of a validation cohort. Radiol Cardiothorac Imaging. 2019;1(3):1–8.
Durighel G, Tokarczuk PF, Karsa A, Gordon F, Cook SA. Acute myocardial infarction: Susceptibility-weighted cardiac MRI improves detection of reperfusion hemorrhage. Clin Radiol. 2017;71(3):e150–6.
Bulluck H, Rosmini S, Abdel-Gadir A, White SK, Bhuva AN, Treibel TA, et al. Residual myocardial Iron following Intramyocardial hemorrhage during the convalescent phase of Reperfused ST-segment-elevation myocardial infarction and adverse left ventricular remodeling. Circ Cardiovasc Imaging. 2016;9(10):e004940.
Bulluck H, Rosmini S, Abdel-Gadir A, Bhuva AN, Treibel TA, Fontana M, et al. Diagnostic performance of T1 and T2 mapping to detect intramyocardial hemorrhage in reperfused ST-segment elevation myocardial infarction (STEMI) patients. J Magn Reson Imaging. 2017;46(3):877–86.
Carberry J, Carrick D, Haig C, Ahmed N, Mordi I, McEntegart M, et al. Persistent Iron within the infarct Core after ST-segment elevation myocardial infarction: implications for left ventricular remodeling and health outcomes. JACC Cardiovasc Imaging. 2017;11(9):1248–56.
Carrick D, Haig C, Ahmed N, Rauhalammi S, Clerfond G, Carberry J, et al. Temporal evolution of myocardial hemorrhage and edema in patients after acute st-segment elevation myocardial infarction: pathophysiological insights and clinical implications. J Am Heart Assoc. 2016;5(2):e002834.
Kali A, Tang RLQ, Kumar A, Min JK. Detection of acute reperfusion myocardial hemorrhage with cardiac MR imaging: T2 versus T2*. Radiology. 2013;269(2):387–95.
Mohammadzadeh A, Maleki Z, Nahardani A, Mohammadzadeh M. Correlations of T2* mapping with delayed gadolinium enhancement in magnetic resonance imaging of chronic myocardial infarction. Iran J Radiol. 2018;15(4):e12688.
Robbers LFHJ, Nijveldt R, Beek AM, Teunissen PFA, Hollander MR, Biesbroek PS, et al. The influence of microvascular injury on native T1 and T2* relaxation values after acute myocardial infarction: implications for non-contrast-enhanced infarct assessment. Eur Radiol. 2017;28(2):824–32.
Roghi A, Poggiali E, Duca L, Mafrici A, Pedrotti P, Paccagnini S, et al. Role of non-transferrin-bound Iron in the pathogenesis of cardiotoxicity in patients with ST-elevation myocardial infarction assessed by cardiac magnetic resonance imaging. Int J Cardiol. 2015;199:326–32.
Yilmaz A, Dengler MA, Van Der Kuip H, Yildiz H, Rösch S, Klumpp S, et al. Imaging of myocardial infarction using ultrasmall superparamagnetic iron oxide nanoparticles: a human study using a multi-parametric cardiovascular magnetic resonance imaging approach. Eur Heart J. 2013;34(6):462–75.
Zia MI, Ghugre NR, Connelly KA, Strauss BH, Sparkes JD, Dick AJ, et al. Characterizing myocardial edema and hemorrhage using quantitative T2 and T2* mapping at multiple time intervals post ST-segment elevation myocardial infarction. Circ Cardiovasc Imaging. 2012;5(5):566–72.
Chen BH, Shi RY, An DA, Wu R, Wu CW, Hu J, et al. BOLD cardiac MRI for differentiating reversible and irreversible myocardial damage in ST segment elevation myocardial infarction. Eur Radiol. 2019;29(2):951–62.
Zaman A, Higgins DM, Motwani M, Kidambi A, Kouwenhoven M, Kozerke S, et al. Robust myocardial T 2 and T 2 * mapping at 3T using image-based shimming. J Magn Reson Imaging. 2014;41(4):1013–20.
Nakamori S, Fahmy A, Jang J, El-Rewaidy H, Neisius U, Berg S, et al. Changes in myocardial native T1 and T2 after exercise stress: a noncontrast CMR pilot study. JACC Cardiovasc Imaging. 2019;S1936–878X:1–14.
Tahir E, Sinn M, Bohnen S, Avanesov M, Säring D, Stehning C, et al. Acute versus chronic myocardial infarction: diagnostic accuracy of quantitative native T1 and T2 mapping versus assessment of edema on standard T2-weighted cardiovascular MR images for differentiation. Radiology. 2017;285(1):83–91.
Carberry J, Carrick D, Haig C, Ahmed N, Mordi I, McEntegart M, et al. Persistence of infarct zone T2 Hyperintensity at 6 months after acute ST-segment–elevation myocardial infarction: incidence, pathophysiology, and prognostic implications. Circ Cardiovasc Imaging. 2017;10(12):e006586.
Carrick D, Haig C, Rauhalammi S, Ahmed N, Mordi I, McEntegart M, et al. Prognostic significance of infarct core pathology revealed by quantitative non-contrast in comparison with contrast cardiac magnetic resonance imaging in reperfused ST-elevation myocardial infarction survivors. Eur Heart J. 2016;37(13):1044–59.
Haig C, Carrick D, Carberry J, Mangion K, Maznyczka A, Wetherall K, et al. Current smoking and prognosis after acute ST-segment elevation myocardial infarction: new pathophysiological insights. JACC Cardiovasc Imaging. 2018;12(6):993–1003.
Hausenloy DJ, Lim MX, Chan MHH, Paradies V, Francis R, Kotecha T, et al. Interrogation of the infarcted and salvaged myocardium using multi-parametric mapping cardiovascular magnetic resonance in reperfused ST-segment elevation myocardial infarction patients. Sci Rep. 2019;9:9056.
Krumm P, Martirosian P, Rath D, Zitzelsberger T, Ruff CA, Klumpp BD, et al. Signal decay mapping of myocardial edema using dual-contrast fast spin-echo MRI. J Magn Reson Imaging. 2016;44(1):186–93.
McAlindon EJ, Pufulete M, Harris JM, Lawton CB, Moon JC, Manghat N, et al. Measurement of myocardium at risk with cardiovascular MR: comparison of techniques for edema imaging. Radiology. 2014;275(1):61–70.
Masci PG, Pavon AG, Muller O, Iglesias JF, Vincenti G, Monney P, et al. Relationship between CMR-derived parameters of ischemia/reperfusion injury and the timing of CMR after reperfused ST-segment elevation myocardial infarction. J Cardiovasc Magn Reson. 2018;20:50.
Park CH, Choi EY, Kwon HM, Hong BK, Lee BK, Yoon YW, et al. Quantitative T2 mapping for detecting myocardial edema after reperfusion of myocardial infarction: validation and comparison with T2-weighted images. Int J Cardiovasc Imaging. 2013;29:65–72.
Tessa C, Del Meglio J, Lilli A, Diciotti S, Salvatori L, Giannelli M, et al. T1 and T2 mapping in the identification of acute myocardial injury in patients with NSTEMI. Radiol Med. 2018;123(12):926–34.
White SK, Frohlich GM, Sado DM, Maestrini V, Fontana M, Treibel TA, et al. Remote ischemic conditioning reduces myocardial infarct size and edema in patients with ST-segment elevation myocardial infarction. JACC Cardiovasc Interv. 2014;8(1):178–88.
An DA, Chen BH, Rui-Wu SRY, Bu J, Ge H, et al. Diagnostic performance of intravoxel incoherent motion diffusion-weighted imaging in the assessment of the dynamic status of myocardial perfusion. J Magn Reson Imaging. 2018;48(6):1602–9.
Bulluck H, White SK, Fröhlich GM, Casson SG, Bchir MB, Meara CO, et al. Quantifying the area-at-risk in reperfused stemi patients using hybrid cardiac pet-MR imaging. Circ Cardiovasc Imaging. 2016;9(3):e003900.
Fischer K, Yamaji K, Luescher S, Ueki Y, Jung B, von Tengg-Kobligk H, et al. Feasibility of cardiovascular magnetic resonance to detect oxygenation deficits in patients with multi-vessel coronary artery disease triggered by breathing maneuvers. J Cardiovasc Magn Reson. 2018;20:31.
Layland J, Rauhalammi S, Lee MMY, Ahmed N, Carberry J, Teng Yue May V, et al. Diagnostic accuracy of 3.0-T magnetic resonance T1 and T2 mapping and T2-weighted dark-blood imaging for the infarct-related coronary artery in non–ST-segment elevation myocardial infarction. J Am Heart Assoc. 2017;6(4):e004759.
Van Heeswijk RB, Feliciano H, Bongard C, Bonanno G, Coppo S, Lauriers N, et al. Free-breathing 3 T magnetic resonance T2-mapping of the heart. JACC Cardiovasc Imaging. 2012;5(12):1231–9.
Butler CR, Savu AM, Bakal JA, Toma M, Thompson R, Chow K, et al. Correlation of cardiovascular magnetic resonance imaging findings and endomyocardial biopsy results in patients undergoing screening for heart transplant rejection. J Hear Lung Transplant. 2015;34(5):643–50.
Dolan RS, Rahsepar AA, Blaisdell J, Lin K, Suwa K, Ghafourian K, et al. Cardiac structure–function MRI in patients after heart transplantation. J Magn Reson Imaging. 2018;49(3):678–87.
Dolan RS, Rahsepar AA, Blaisdell J, Suwa K, Ghafourian K, Wilcox JE, et al. Multiparametric cardiac magnetic resonance imaging can detect acute cardiac allograft rejection after heart transplantation. JACC Cardiovasc Imaging. 2019;12(8):1632–41.
Markl M, Rustogi R, Galizia M, Goyal A, Collins J, Usman A, et al. Myocardial T2-mapping and velocity mapping: changes in regional left ventricular structure and function after heart transplantation. Magn Reson Med. 2013;70(2):517–26.
Miller CA, Naish JH, Shaw SM, Yonan N, Williams SG, Clark D, et al. Multiparametric cardiovascular magnetic resonance surveillance of acute cardiac allograft rejection and characterisation of transplantation-associated myocardial injury: a pilot study. J Cardiovasc Magn Reson. 2014;16:52.
Miller RJH, Thomson L, Levine R, Dimbil SJ, Patel J, Kobashigawa JA, et al. Quantitative myocardial tissue characterization by cardiac magnetic resonance in heart transplant patients with suspected cardiac rejection. Clin Transplant. 2019;33:e13704.
Vermes E, Pantaléon C, Auvet A, Cazeneuve N, Machet MC, Delhommais A, et al. Cardiovascular magnetic resonance in heart transplant patients: diagnostic value of quantitative tissue markers: T2 mapping and extracellular volume fraction, for acute rejection diagnosis. J Cardiovasc Magn Reson. 2018;20:59.
Yuan Y, Cai J, Cui Y, Wang J, Alwalid O, Shen X, et al. CMR-derived extracellular volume fraction (ECV) in asymptomatic heart transplant recipients: correlations with clinical features and myocardial edema. Int J Cardiovasc Imaging. 2018;34(12):1959–67.
Bonnemains L, Villemin T, Escanye J-M, Hossu G, Odille F, Vanhuyse F, et al. Diagnostic and prognostic value of MRI T2 quantification in heart transplant patients. Transpl Int. 2013;27(1):69–76.
Odille F, Beaumont M, Escanye J-M, Menini A, Vuissoz P-A, Felblinger J, et al. Joint reconstruction of multiple images and motion in MRI: application to free-breathing myocardial T2 quantification. IEEE Trans Med Imaging. 2015;35(1):197–207.
Desai AA, Patel AR, Ahmad H, Groth JV, Thiruvoipati T, Turner K, et al. Mechanistic insights and characterization of sickle cell disease associated cardiomyopathy. Circ Cardiovasc Imaging. 2015;7(3):430–7.
Fragasso A, Ciancio A, Mannarella C, Gaudiano C, Scarciolla O, Ottonello C, et al. Myocardial iron overload assessed by magnetic resonance imaging (MRI)T2* in multi-transfused patients with thalassemia and acquired anemias. Eur J Intern Med. 2011;22(1):62–5.
Kritsaneepaiboon S, Ina N, Chotsampancharoen T, Roymanee S, Cheewatanakornkul S. The relationship between myocardial and hepatic T2 and T2* at 1.5T and 3T MRI in normal and iron-overloaded patients. Acta Radiol. 2017;59(3):355–62.
Krittayaphong R, Zhang S, Saiviroonporn P, Viprakasit V, Tanapibunpon P, Komoltri C, et al. Detection of cardiac iron overload with native magnetic resonance T1 and T2 mapping in patients with thalassemia. Int J Cardiol. 2017;248:421–6.
Portillo MCB, Uranga Uranga M, Sánchez González J, Alústiza Echeverría JM, Gervás Wells C, Guisasola Íñiguez A. Liver and heart T2* measurement in secondary hemochromatosis. Radiologia. 2013;55(4):331–9.
Saiviroonporn P, Viprakasit V, Boonyasirinant T, Khuhapinant A, Wood JC, Krittayaphong R. Comparison of the region-based and pixel-wise methods for cardiac T2* analysis in 50 transfusion-dependent Thai thalassemia patients. J Comput Assist Tomogr. 2011;35(3):375–81.
Seldrum S, Pierard S, Moniotte S, Vermeylen C, Vancraeynest D, Pasquet A, et al. Iron overload in polytransfused patients without heart failure is associated with subclinical alterations of systolic left ventricular function using cardiovascular magnetic resonance tagging. J Cardiovasc Magn Reson. 2011;13:23.
Soltanpour MS, Davari K. The correlation of cardiac and hepatic hemosiderosis as measured by T2*MRI technique with ferritin levels and hemochromatosis gene mutations in Iranian patients with beta thalassemia major. Oman Med J. 2018;33(1):48–54.
Acar K, Kayrak M, Gul EE, Abdulhalikov T, Özbek O, Ucar R. Cardiac Iron load and novel P-wave measurements in patients with thalassemia major. Eur J Gen Med. 2012;9(1):45–51.
Alam MH, Auger D, McGill L-A, Smith GC, He T, Izgi C, et al. Comparison of 3 T and 1.5 T for T2* magnetic resonance of tissue iron. J Cardiovasc Magn Reson. 2016;18:40.
Alp A, Ozdogan O, Guloglu CC, Turker M, Atabay B. Heart rate variability in β-thalassaemia major with or without cardiac siderosis. Cardiol Young. 2014;24(2):263–7.
Azarkeivan A, Hashemieh M, Akhlaghpoor S, Shirkavand A, Yaseri M, Sheibani K. Relation between serum ferritin and liver and heart MRI T2* in beta thalassaemia major patients. East Mediterr Heal J. 2013;19(8):727–32.
Barzin M, Kowsarian M, Akhlaghpoor S, Jalalian R, Taremi M. Correlation of cardiac MRI T2 * with echocardiography in thalassemia major. Eur Rev Med Pharmacol Sci. 2012;16(2):254–60.
Bayraktaroglu S, Aydinok Y, Yildiz D, Uluer H, Recep S, Hudaver A. The relationship between myocardial T2* and left ventricular volumetric and functional parameters in thalassemia major patients. Diagnostic Interv Radiol. 2011;17(4):346–51.
Camargo GC, Rothstein T, Junqueira FP, Fernandes E, Greiser A, Strecker R, et al. Comparison of myocardial T1 and T2 values in 3 T with T2* in 1.5 T in patients with iron overload and controls. Int J Hematol. 2016;103(5):530–6.
Cassinerio E, Roghi A, Pedrotti P, Brevi F, Zanaboni L, Graziadei G, et al. Cardiac iron removal and functional cardiac improvement by different iron chelation regimens in thalassemia major patients. Ann Hematol. 2012;91(9):1443–9.
Delaporta P, Kattamis A, Apostolakou F, Boiu S, Bartzeliotou A, Tsoukas E, et al. Correlation of NT-proBNP levels and cardiac iron concentration in patients with transfusion-dependent thalassemia major. Blood Cells Mol Dis. 2012;50(1):20–4.
Di Odoardo LAF, Giuditta M, Cassinerio E, Roghi A, Pedrotti P, Vicenzi M, et al. Myocardial deformation in iron overload cardiomyopathy: speckle tracking imaging in a beta-thalassemia major population. Intern Emerg Med. 2017;12(6):799–809.
Djer MM, Anggriawan SL, Gatot D, Amalia P, Sastroasmoro S, Widjaja P. Correlation between T2* cardiovascular magnetic resonance with left ventricular function and mass in adolescent and adult major thalassemia patients with iron overload. Acta Med Indones. 2013;45(4):295–301.
Ebrahimpour L, Akhlaghpoor S, Azarkayvan A, Salehi M, Alinaghi R, Morteza A. Correlation between bone mineral densitometry and liver/heart iron overload evaluated by quantitative T2* MRI. Hematology. 2012;17(5):297–301.
Eghbali A, Kazemi H, Taherahmadi H, Ghandi Y, Rafiei M, Bagheri B. A randomized, controlled study evaluating effects of amlodipine addition to chelators to reduce iron loading in patients with thalassemia major. Eur J Haematol. 2017;99(6):577–81.
Fahmy HS, Khater NH, El Shahat HM, Madani AA, El Hadidy SS. Reassessing the value of MRI T2* in evaluation of hepatic and myocardial iron concentration: An institutional study. Egypt J Radiol Nucl Med. 2015;46(4):1085–90.
Feng Y, He T, Carpenter JP, Jabbour A, Alam MH, Gatehouse PD, et al. In vivo comparison of myocardial T1 with T2 and T2* in thalassaemia major. J Magn Reson Imaging. 2013;38(3):588–93.
Fernandes JL, Sampaio EF, Verissimo M, Pereira FB, Da Silva JA, De Figueiredo GS, et al. Heart and liver T2* assessment for iron overload using different software programs. Eur Radiol. 2011;21(12):2503–10.
Fernandes JL, Fioravante LAB, Verissimo MP, Loggetto SR. A free software for the calculation of T2* values for iron overload assessment. Acta Radiol. 2016;58(6):698–701.
Garceau P, Nguyen ET, Carasso S, Ross H, Pendergrast J, Moravsky G, et al. Quantification of myocardial iron deposition by two-dimensional speckle tracking in patients with β-thalassaemia major and Blackfan-diamond anaemia. Heart. 2011;97(5):388–93.
Git KA, Fioravante LAB, Fernandes JL. An online open-source tool for automated quantification of liver and myocardial iron concentrations by T2∗ magnetic resonance imaging. Br J Radiol. 2015;88(1053):20150269.
Hanneman K, Raju VM, Moshonov H, Ward R, Wintersperger BJ, Crean AM, et al. Heterogeneity of myocardial iron distribution in response to chelation therapy in patients with transfusion-dependent anemias. Int J Cardiovasc Imaging. 2013;29(7):1517–26.
Hanneman K, Nguyen ET, Thavendiranathan P, Ward R, Greiser A, Jolly M-P, et al. Quantification of myocardial extracellular volume fraction with cardiac MR imaging in thalassemia major. Radiology. 2015;279(3):720–30.
Junqueira FP, Fernandes JL, Cunha GM, Kubo TTA, Lima CMAO, Lima DBP, et al. Right and left ventricular function and myocardial scarring in adult patients with sickle cell disease: a comprehensive magnetic resonance assessment of hepatic and myocardial iron overload. J Cardiovasc Magn Reson. 2013;15:83.
Kayrak M, Acar K, Gul EE, Özbek O, Abdulhalikov T, Sonmez O, et al. The association between myocardial iron load and ventricular repolarization parameters in asymptomatic beta-thalassemia patients. Adv Hematol. 2012;2012:1705–10.
Kirk P, Carpenter JP, Tanner MA, Pennell DJ. Low prevalence of fibrosis in thalassemia major assessed by late gadolinium enhancement cardiovascular magnetic resonance. J Cardiovasc Magn Reson. 2011;13:8.
Kucukseymen S, Yuksel IO, Cagirci G, Koklu E, Karakus V, Cay S, et al. Heart rate recovery as a novel test for predicting cardiac involvement in beta-thalassemia major. Acta Cardiol Sin. 2017;33(4):410–9.
Li S, Hwang Y, Ha S, Chan GCF, Mok ASP, Wong SJ, et al. Role of three-dimensional speckle tracking echocardiography in the quantification of myocardial Iron overload in patients with Beta-thalassemia major. Echocardiography. 2016;33(9):1361–7.
Liguori C, Pitocco F, Di Giampietro I, De Vivo AE, Schena E, Giurazza F, et al. Magnetic resonance comparison of left-right heart volumetric and functional parameters in thalassemia major and thalassemia intermedia patients. Biomed Res Int. 2015;2015:857642.
Mehrzad V, Khajouei AS, Fahami E. Correlation of N-terminal pro-B-type natriuretic peptide levels and cardiac magnetic resonance imaging T2* in patients with β-thalassaemia major. Blood Transfus. 2016;14(6):516–20.
Ozbek O, Acar K, Kayrak M, Ozbek S, Gul E, Ucar R, et al. Relationship between color M-mode echocardiography flow propagation and cardiac iron load on MRI in patients with thalassemia major. Diagnostic Interv Radiol. 2011;18(2):208–14.
Quatre A, Jacquier A, Petit P, Giorgi R, Thuret I. MRI monitoring of myocardial iron overload: use of cardiac MRI combined with hepatic MRI in a cohort of multi-transfused patients with thalassaemia. Diagn Interv Imaging. 2014;95(11):1065–9.
Roghi A, Poggiali E, Pedrotti P, Milazzo A, Quattrocchi G, Cassinerio E, et al. Myocardial and hepatic iron overload assessment by region-based and pixel-wise T2* mapping analysis: technical pitfalls and clinical warnings. J Comput Assist Tomogr. 2015;39(1):128–33.
Sado DM, Maestrini V, Piechnik SK, Banypersad SM, White SK, Flett AS, et al. Noncontrast myocardial T1 mapping using cardiovascular magnetic resonance for iron overload. J Magn Reson Imaging. 2015;41(6):1505–11.
Sakuta J, Ito Y, Kimura Y, Park J, Tokuuye K, Ohyashiki K. Estimation of cardiac left ventricular ejection fraction in transfusional cardiac iron overload by R2* magnetic resonance. Int J Hematol. 2010;92(5):708–12.
Torlasco C, Cassinerio E, Roghi A, Faini A, Capecchi M, Abdel-Gadir A, et al. Role of T1 mapping as a complementary tool to T2* for non-invasive cardiac iron overload assessment. PLoS One. 2018;13(2):e0192890.
Chen CA, Lu MY, Peng SF, Lin KH, Chang HH, Yang YL, et al. Spatial repolarization heterogeneity detected by magnetocardiography correlates with cardiac iron overload and adverse cardiac events in beta-thalassemia major. PLoS One. 2014;9(1):e86524.
de Assis RA, Kay FU, Rosemberg LA, Parma AHC, Nomura CH, Loggetto SR, et al. Iron overload in Brazilian thalassemic patients. Einstein. 2011;9(2):165–72.
de Assis RA, Ribeiro AAF, Kay FU, Rosemberg LA, Nomura CH, Loggetto SR, et al. Pancreatic iron stores assessed by magnetic resonance imaging (MRI) in beta thalassemic patients. Eur J Radiol. 2011;81(7):1465–70.
de Sanctis V, Elsedfy H, Soliman AT, Elhakim IZ, Pepe A, Kattamis C, et al. Acquired hypogonadotropic hypogonadism (AHH) in thalassaemia major patients: An underdiagnosed condition? Mediterr J Hematol Infect Dis. 2016;8(1):e2016001.
Marsella M, Borgna-Pignatti C, Meloni A, Caldarelli V, Dell’Amico MC, Spasiano A, et al. Cardiac iron and cardiac disease in males and females with transfusion-dependent thalassemia major: a T2* magnetic resonance imaging study. Haematologica. 2011;96(4):515–20.
Mavrogeni S, Bratis K, Van Wijk K, Kyrou L, Kattamis A, Reiber JHC. The reproducibility of cardiac and liver T2 measurement in thalassemia major using two different software packages. Int J Cardiovasc Imaging. 2013;29(7):1511–6.
Meloni A, Positano V, Keilberg P, De Marchi D, Pepe P, Zuccarelli A, et al. Feasibility, reproducibility, and reliability for the T2* iron evaluation at 3 T in comparison with 1.5 T. Magn Reson Med. 2012;68(2):543–51.
Meloni A, Restaino G, Borsellino Z, Caruso V, Spasiano A, Zuccarelli A, et al. Different patterns of myocardial iron distribution by whole-heart T2* magnetic resonance as risk markers for heart complications in thalassemia major. Int J Cardiol. 2014;177(3):1012–9.
Pepe A, Meloni A, Rossi G, Midiri M, Missere M, Valeri G, et al. Prediction of cardiac complications for thalassemia major in the widespread cardiac magnetic resonance era: a prospective multicentre study by a multi-parametric approach. Eur Heart J Cardiovasc Imaging. 2018;19(3):299–309.
Pistoia L, Meloni A, Salvadori S, Spasiano A, Lisi R, Rosso R, et al. Cardiac involvement by CMR in different genotypic groups of thalassemia major patients. Blood Cells Mol Dis. 2019;77:1–7.
Pizzino F, Meloni A, Terrizzi A, Casini T, Spasiano A, Cosmi C, et al. Detection of myocardial iron overload by two-dimensional speckle tracking in patients with beta-thalassaemia major: a combined echocardiographic and T2* segmental CMR study. Int J Cardiovasc Imaging. 2018;34(2):263–71.
Positano V, Meloni A, Santarelli MF, Gerardi C, Bitti PP, Cirotto C, et al. Fast generation of T2*maps in the entire range of clinical interest: application to thalassemia major patients. Comput Biol Med. 2015;56:200–10.
Russo V, Rago A, Pannone B, Di Meo F, Papa AA, Mayer MC, et al. Early electrocardiographic evaluation of atrial fibrillation risk in beta-thalassemia major patients. Int J Hematol. 2011;93(4):446–51.
Wijarnpreecha K, Siri-Angkul N, Shinlapawittayatorn K, Charoenkwan P, Silvilairat S, Siwasomboon C, et al. Heart rate variability as an alternative indicator for identifying cardiac iron status in non-transfusion dependent thalassemia patients. PLoS One. 2015;10(6):e0130837.
Barbero U, Longo F, Destefanis P, Gaglioti CM, Pozzi R, Piga A. Worsening of myocardial performance index in beta-thalassemia patients despite permanently normal iron load at MRI: a simple and cheap index reflecting cardiovascular involvement? IJC Metab Endocr. 2016;13:41–4.
Bayar N, Kurtoğlu E, Arslan Ş, Erkal Z, Çay S, Çağırcı G, et al. Assessment of the relationship between fragmented QRS and cardiac iron overload in patients with beta-thalassemia major. Anatol J Cardiol. 2015;15(2):132–6.
Du Y, Long Z, Chen M, Han B, Hou B, Feng F. Observational monitoring of patients with aplastic Anemia and low/Intermediate-1 risk of myelodysplastic syndromes complicated with Iron overload. Acta Haematol. 2017;138(2):119–28.
Ferro E, Di Pietro A, Visalli G, Piraino B, Salpietro C, La Rosa MA. Soluble hemojuvelin in transfused and untransfused thalassaemic subjects. Eur J Haematol. 2017;98(1):67–74.
Karakus V, Kurtoğlu A, Soysal DE, Dere Y, Bozkurt S, Kurtoğlu E. Evaluation of Iron overload in the heart and liver tissue by magnetic resonance imaging and its relation to serum ferritin and Hepcidin concentrations in patients with thalassemia syndromes. Indian J Hematol Blood Transfus. 2017;33(3):389–95.
Karami H, Kosaryan M, Hadian Amree A, Darvishi-Khezri H, Mousavi M. Combination iron chelation therapy with deferiprone and deferasirox in iron-overloaded patients with transfusiondependent β-thalassemia major. Clin Pract. 2017;7(1):912.
Monte I, Buccheri S, Bottari V, Blundo A, Licciardi S, Romeo MA. Left ventricular rotational dynamics in beta thalassemia major: a speckle-tracking echocardiographic study. J Am Soc Echocardiogr. 2012;25(10):1083–90.
Parsaee M, Saedi S, Joghataei P, Azarkeivan A, Alizadeh Sani Z. Value of speckle tracking echocardiography for detection of clinically silent left ventricular dysfunction in patients with β-thalassemia. Hematology. 2017;22(9):554–8.
Pennell DJ, Porter JB, Piga A, Lai Y-R, El-Beshlawy A, Elalfy M, et al. Sustained improvements in myocardial T2* over 2 years in severely iron-overloaded patients with beta thalassemia major treated with deferasirox or deferoxamine. Am J Hematol. 2014;90(2):91–6.
Piga A, Longo F, Musallam KM, Cappellini MD, Forni GL, Quarta G, et al. Assessment and management of iron overload in β-thalassaemia major patients during the 21st century: a real-life experience from the Italian Webthal project. Br J Haematol. 2013;161(6):872–83.
Porter JB, Wood J, Olivieri N, Vichinsky EP, Taher A, Neufeld E, et al. Treatment of heart failure in adults with thalassemia major: response in patients randomised to deferoxamine with or without deferiprone. J Cardiovasc Magn Reson. 2013;15:38.
Vlachaki E, Agapidou A, Spanos G, Klonizakis P, Vetsiou E, Mavroudi M, et al. Five years of Deferasirox therapy for cardiac Iron in β -thalassemia major. Hemoglobin. 2015;39(5):299–304.
Yuksel IO, Koklu E, Kurtoglu E, Arslan S, Cagirci G, Karakus V, et al. The association between serum ferritin level, tissue Doppler echocardiography, cardiac T2* MRI, and heart rate recovery in patients with beta thalassemia major. Acta Cardiol Sin. 2016;32(2):231–8.
Gu S, Song X, Zhao Y, Guo J, Fei C, Xu F, et al. The evaluation of iron overload through hepcidin level and its related factors in myelodysplastic syndromes. Hematology. 2013;18(5):286–94.
Greulich S, Kitterer D, Latus J, Aguor E, Steubing H, Kaesemann P, et al. Comprehensive cardiovascular magnetic resonance assessment in patients with sarcoidosis and preserved left ventricular ejection fraction. Circ Cardiovasc Imaging. 2016;9(11):e005022.
Puntmann VO, Isted A, Hinojar R, Foote L, Carr-White G, Nagel E. T1 and T2 mapping in recognition of early cardiac involvement in systemic sarcoidosis. Radiology. 2017;285(1):63–72.
Mayr A, Kitterer D, Latus J, Steubing H, Henes J, Vecchio F, et al. Evaluation of myocardial involvement in patients with connective tissue disorders: a multi-parametric cardiovascular magnetic resonance study. J Cardiovasc Magn Reson. 2016;18:67.
Zhang Y, Corona-Villalobos P, Kiani AN, Eng J, Kamel IR, Zimmerman SL, et al. Myocardial T2 mapping by cardiovascular magnetic resonance reveals subclinical myocardial inflammation in patients with systemic lupus. Int J Cardiovasc Imaging. 2015;31(2):389–97.
Hinojar R, Foote L, Sangle S, Marber M, Mayr M, Carr-White G, et al. Native T1 and T2 mapping by CMR in lupus myocarditis: disease recognition and response to treatment. Int J Cardiol. 2016;222:717–26.
Winau L, Hinojar Baydes R, Braner A, Drott U, Burkhardt H, Sangle S, et al. High-sensitive troponin is associated with subclinical imaging biosignature of inflammatory cardiovascular involvement in systemic lupus erythematosus. Ann Rheum Dis. 2018;77(11):1590–8.
Kotecha T, Martinez-Naharro A, Treibel TA, Francis R, Nordin S, Abdel-Gadir A, et al. Myocardial edema and prognosis in amyloidosis. J Am Coll Cardiol. 2018;71(25):2919–31.
Ridouani F, Damy T, Tacher V, Derbel H, Legou F, Sifaoui I, et al. Myocardial native T2 measurement to differentiate light-chain and transthyretin cardiac amyloidosis and assess prognosis. J Cardiovasc Magn Reson. 2018;20(1):58.
Messalli G, Imbriaco M, Avitabile G, Russo R, Iodice D, Spinelli L, et al. Role of cardiac MRI in evaluating patients with Anderson-Fabry disease: assessing cardiac effects of long-term enzyme replacement therapy. Radiol Med. 2012;117(1):19–28.
Knott KD, Augusto JB, Nordin S, Kozor R, Camaioni C, Xue H, et al. Quantitative myocardial perfusion in Fabry disease. Circ Cardiovasc Imaging. 2019;12(7):e008872.
Gastl M, Gotschy A, von Spiczak J, Polacin M, Bönner F, Gruner C, et al. Cardiovascular magnetic resonance T2* mapping for structural alterations in hypertrophic cardiomyopathy. Eur J Radiol Open. 2019;6:78–84.
Kanzaki Y, Yuki M, Yamamura KI, Narumi Y, Ishizaka N. Is cardiac and hepatic iron status assessed by MRI T2* associated with left ventricular function in patients with idiopathic cardiomyopathy? Heart Vessel. 2016;31(12):1950–9.
Amano Y, Yanagisawa F, Tachi M, Hashimoto H, Imai S, Kumita S. Myocardial T2 mapping in patients with hypertrophic cardiomyopathy. J Comput Assist Tomogr. 2016;41(3):344–8.
Park CH, Chung H, Kim Y, Kim JY, Min PK, Lee KA, et al. Electrocardiography based prediction of hypertrophy pattern and fibrosis amount in hypertrophic cardiomyopathy: comparative study with cardiac magnetic resonance imaging. Int J Cardiovasc Imaging. 2018;34(10):1619–28.
Nagao M, Baba S, Yonezawa M, Yamasaki Y, Kamitani T, Isoda T, et al. Prediction of adverse cardiac events in dilated cardiomyopathy using cardiac T2* MRI and MIBG scintigraphy. Int J Cardiovasc Imaging. 2015;31(2):399–407.
Ito T, Kono AK, Takamine S, Shigeru M, Mori S, Takaya T, et al. A comparison of quantitative T2 mapping on cardiovascular magnetic resonance imaging with Metaiodobenzylguanidine scintigraphy and left ventricular functional recovery in dilated cardiomyopathy: a retrospective pilot study. Intern Med. 2015;54(17):2121–8.
Kono AK, Croisille P, Nishii T, Nishiyama K, Kyotani K, Shigeru M, et al. Cardiovascular magnetic resonance tagging imaging correlates with myocardial dysfunction and T2 mapping in idiopathic dilated cardiomyopathy. Int J Cardiovasc Imaging. 2014;30(Suppl 2):145–52.
Nishii T, Kono AK, Shigeru M, Takamine S, Fujiwara S, Kyotani K, et al. Cardiovascular magnetic resonance T2 mapping can detect myocardial edema in idiopathic dilated cardiomyopathy. Int J Cardiovasc Imaging. 2014;30(Suppl 1):65–72.
Spieker M, Katsianos E, Gastl M, Behm P, Horn P, Jacoby C, et al. T2 mapping cardiovascular magnetic resonance identifies the presence of myocardial inflammation in patients with dilated cardiomyopathy as compared to endomyocardial biopsy. Eur Hear J Cardiovasc Imaging. 2017;19(5):574–82.
Cui Y, Cao Y, Song J, Dong N, Kong X, Wang J, et al. Association between myocardial extracellular volume and strain analysis through cardiovascular magnetic resonance with histological myocardial fibrosis in patients awaiting heart transplantation. J Cardiovasc Magn Reson. 2018;20:25.
Mordi I, Carrick D, Bezerra H, Tzemos N. T1 and T2 mapping for early diagnosis of dilated non-ischaemic cardiomyopathy in middle-aged patients and differentiation from normal physiological adaptation. Eur Heart J Cardiovasc Imaging. 2016;17(7):797–803.
Child N, Suna G, Dabir D, Yap ML, Rogers T, Kathirgamanathan M, et al. Comparison of MOLLI, shMOLLLI, and SASHA in discrimination between health and disease and relationship with histologically derived collagen volume fraction. Eur Heart J Cardiovasc Imaging. 2018;19(7):768–76.
Baeßler B, Schaarschmidt F, Treutlein M, Stehning C, Schnackenburg B, Michels G, et al. Re-evaluation of a novel approach for quantitative myocardial oedema detection by analysing tissue inhomogeneity in acute myocarditis using T2-mapping. Eur Radiol. 2017;27(12):5169–78.
Baessler B, Luecke C, Lurz J, Klingel K, von Roeder M, de Waha S, et al. Cardiac MRI texture analysis of T1 and T2 maps in patients with Infarctlike acute myocarditis. Radiology. 2018;289(2):357–65.
Baessler B, Luecke C, Lurz J, Klingel K, Das A, von Roeder M, et al. Cardiac MRI and texture analysis of myocardial T1 and T2 maps in myocarditis with acute versus chronic symptoms of heart failure. Radiology. 2019;292(3):608–17.
Bohnen S, Radunski UK, Lund GK, Ojeda F, Looft Y, Senel M, et al. Tissue characterization by T1 and T2 mapping cardiovascular magnetic resonance imaging to monitormyocardial inflammation in healing myocarditis. Eur Heart J Cardiovasc Imaging. 2017;18(7):744–51.
Bohnen S, Radunski UK, Lund GK, Kandolf R, Stehning C, Schnackenburg B, et al. Performance of T1 and T2 mapping cardiovascular magnetic resonance to detect active myocarditis in patients with recent-onset heart failure. Circ Cardiovasc Imaging. 2015;8(6):e003073.
Dabir D, Vollbrecht TM, Luetkens JA, Kuetting DLR, Isaak A, Feisst A, et al. Multiparametric cardiovascular magnetic resonance imaging in acute myocarditis: a comparison of different measurement approaches. J Cardiovasc Magn Reson. 2019;21:54.
Gatti M, Palmisano A, Faletti R, Benedetti G, Bergamasco L, Bioletto F, et al. Two-dimensional and three-dimensional cardiac magnetic resonance feature-tracking myocardial strain analysis in acute myocarditis patients with preserved ejection fraction. Int J Cardiovasc Imaging. 2019;35(6):1101–9.
Luetkens JA, Schlesinger-Irsch U, Kuetting DL, Dabir D, Homsi R, Doerner J, et al. Feature-tracking myocardial strain analysis in acute myocarditis: diagnostic value and association with myocardial oedema. Eur Radiol. 2017;27(11):4661–71.
Lurz P, Luecke C, Eitel I, Föhrenbach F, Frank C, Grothoff M, et al. Comprehensive cardiac magnetic resonance imaging in patients with suspected myocarditis. J Am Coll Cardiol. 2016;67(15):1800–11.
Radunski UK, Lund GK, Stehning C, Schnackenburg B, Bohnen S, Adam G, et al. CMR in patients with severe myocarditis: diagnostic value of quantitative tissue markers including extracellular volume imaging. JACC Cardiovasc Imaging. 2014;7(7):667–75.
Radunski UK, Lund GK, Säring D, Bohnen S, Stehning C, Schnackenburg B, et al. T1 and T2 mapping cardiovascular magnetic resonance imaging techniques reveal unapparent myocardial injury in patients with myocarditis. Clin Res Cardiol. 2017;106(1):10–7.
Spieker M, Haberkorn S, Gastl M, Behm P, Katsianos S, Horn P, et al. Abnormal T2 mapping cardiovascular magnetic resonance correlates with adverse clinical outcome in patients with suspected acute myocarditis. J Cardiovasc Magn Reson. 2017;19:38.
Huber AT, Bravetti M, Lamy J, Bacoyannis T, Roux C, de Cesare A, et al. Non-invasive differentiation of idiopathic inflammatory myopathy with cardiac involvement from acute viral myocarditis using cardiovascular magnetic resonance imaging T1 and T2 mapping. J Cardiovasc Magn Reson. 2018;20:11.
Mayr A, Klug G, Feistritzer HJ, Reinstadler SJ, Reindl M, Esterhammer R, et al. Myocardial edema in acute myocarditis: relationship of T2 relaxometry and late enhancement burden by using dual-contrast turbo spin-echo MRI. Int J Cardiovasc Imaging. 2017;33(11):1789–94.
Von Knobelsdorff-Brenkenhoff F, Schüler J, Dogangüzel S, Dieringer MA, Rudolph A, Greiser A, et al. Detection and monitoring of acute myocarditis applying quantitative cardiovascular magnetic resonance. Circ Cardiovasc Imaging. 2017;10(2):e005242.
Gang L, Mu Z, Zenglin M, Jiayi L, Zhanming F, Dongting L, et al. Cardiac magnetic resonance quantitative tissue markers in the clinical application value for the diagnosis of acute myocarditis. J Med Imaging Heal Informatics. 2019;8(9):1751–6.
Stirrat CG, Alam SR, MacGillivray TJ, Gray CD, Dweck MR, Dibb K, et al. Ferumoxytol-enhanced magnetic resonance imaging in acute myocarditis. Heart. 2018;104(4):300–5.
Chen BH, Wu R, An DA, Shi RY, Yao QY, Lu Q, et al. Oxygenation-sensitive cardiovascular magnetic resonance in hypertensive heart disease with left ventricular myocardial hypertrophy and non-left ventricular myocardial hypertrophy: insight from altered mechanics and cardiac BOLD imaging. J Magn Reson Imaging. 2018;48(5):1297–306.
Kim PK, Hong YJ, Im DJ, Suh YJ, Park CH, Kim JY, et al. Myocardial T1 and T2 mapping: techniques and clinical applications. Korean J Radiol. 2017;18(1):113–31.
Mars M, Tbini Z, Gharbi S, Bouaziz MC, Ladeb F. T2 versus T2* MRI mapping in the knee articular cartilage at 1.5 tesla and 3 tesla. Open Med J. 2019;5(1):119–29.
Kandler D, Lücke C, Grothoff M, Andres C, Lehmkuhl L, Nitzsche S, et al. The relation between hypointense core, microvascular obstruction and intramyocardial haemorrhage in acute reperfused myocardial infarction assessed by cardiac magnetic resonance imaging. Eur Radiol. 2014;24(12):3277–88.
Kindermann I, Barth C, Mahfoud F, Ukena C, Lenski M, Yilmaz A, et al. Update on myocarditis. J Am Coll Cardiol. 2012;59(9):779–92.
Caforio ALP, Pankuweit S, Arbustini E, Basso C, Gimeno-Blanes J, Felix SB, et al. Current state of knowledge on aetiology, diagnosis, management, and therapy of myocarditis: a position statement of the European Society of Cardiology Working Group on myocardial and pericardial diseases. Eur Heart J. 2013;34:2636–48.
Kramer CM, Barkhausen J, Flamm SD, Kim RJ, Nagel E. Standardized cardiovascular magnetic resonance (CMR) protocols 2013 update. J Cardiovasc Magn Reson. 2013;15:91.
Schulz-Menger J, Bluemke DA, Bremerich J, Flamm SD, Fogel MA, Friedrich MG, et al. Standardized image interpretation and post processing in cardiovascular magnetic resonance: Society for Cardiovascular Magnetic Resonance (SCMR) Board of Trustees Task Force on standardized post processing. J Cardiovasc Magn Reson. 2013;15:35.
Schwitter J. Comparison of three different cardiac T2-mapping techniques at 1.5 tesla. Biomed J Sci Tech Res. 2018;3(2):3143–50.
Biesbroek PS, Amier RP, Teunissen PFA, Hofman MBM, Robbers LFHJ, van de Ven PM, et al. Changes in remote myocardial tissue after acute myocardial infarction and its relation to cardiac remodeling: a CMR T1 mapping study. PLoS One. 2017;12(6):e0180115.
Manrique A, Gerbaud E, Derumeaux G, Cribier A, Bertrand D, Lebon A, et al. Cardiac magnetic resonance demonstrates myocardial oedema in remote tissue early after reperfused myocardial infarction. Arch Cardiovasc Dis. 2009;102:633–9.
Fernández-Jiménez R, Sánchez-González J, Agüero J, García-Prieto J, López-Martín GJ, García-Ruiz JM, et al. Myocardial edema after ischemia/reperfusion is not stable and follows a bimodal pattern: imaging and histological tissue characterization. J Am Coll Cardiol. 2015;65(4):315–23.
Butler CR, Thompson R, Haykowsky M, Toma M, Paterson I. Cardiovascular magnetic resonance in the diagnosis of acute heart transplant rejection: a review. J Cardiovasc Magn Reson. 2009;11:7.
De Montalembert M, Ribeil JA, Brousse V, Guerci-Bresler A, Stamatoullas A, Vannier JP, et al. Cardiac iron overload in chronically transfused patients with thalassemia, sickle cell anemia, or myelodysplastic syndrome. PLoS One. 2017;12(3):1–12.
Chavhan GB, Babyn PS, Thomas B, Shroff MM, Haacke EM. Principles, techniques, and applications of T2*- based MR imaging and its special applications. Radiographics. 2009;29(5):1433–49.
Thompson RB, Chow K, Khan A, Chan A, Shanks M, Paterson I, et al. T1 mapping with cardiovascular MRI is highly sensitive for fabry disease independent of hypertrophy and sex. Circ Cardiovasc Imaging. 2013;6(5):637–45.
Imbriaco M, Spinelli L, Cuocolo A, Maurea S, Sica G, Quarantelli M, et al. MRI characterization of myocardial tissue in patients with Fabry’s disease. Am J Roentgenol. 2007;188(3):850–3.
Kühl U, Noutsias M, Seeberg B, Schultheiss HP. Immunohistological evidence for a chronic intramyocardial inflammatory process in dilated cardiomyopathy. Heart. 1996;75(3):301–6.
Hinojar R, Varma N, Child N, Goodman B, Jabbour A, Yu CY, et al. T1 mapping in discrimination of hypertrophic phenotypes: hypertensive heart disease and hypertrophic cardiomyopathy: findings from the international T1 multicenter cardiovascular magnetic resonance study. Circ Cardiovasc Imaging. 2015;8(12):1–9.
Acknowledgements
Not applicable.
Funding
This work was supported by the Dutch Heart Association (2016 T042).
Author information
Authors and Affiliations
Contributions
GS, MvdB and LH were responsible for database searches and data acquisition. GS and NP were responsible for manuscript writing and MvdB for editing. MvdB was responsible for the statistical analysis. CN, DS, BV, RS and RB revised the manuscript critically. All authors read and approved the final manuscript.
Corresponding author
Ethics declarations
Ethics approval and consent to participate
Not applicable.
Consent for publication
Not applicable.
Competing interests
The authors declare that they have no competing interests.
Additional information
Publisher’s Note
Springer Nature remains neutral with regard to jurisdictional claims in published maps and institutional affiliations.
Supplementary information
Additional file 2: Figure 1.
Weighted mean T2* values and weighted standard deviations (SD) of the sub-analysis in patients with myocardial infarction and iron overload measured at 1.5 T (A) and 3 T (B). In myocardial infarction, T2* values of remote myocardium (r) (grey square), infarct core (c) (black square) and infarct zone (z) (black triangle) are presented. In iron overload, the T2* value of iron overload patients (p) with cardiac involvement is presented. The number of included measurements for each population is reported above the graph. MI myocardial infarction, IO iron overload. Figure 2. Weighted mean T2 values and weighted standard deviations (SD) of the sub-analysis in patients with myocardial infarction, heart transplantation and myocarditis measured at 1.5 T (A) and 3 T (B). In myocardial infarction, T2 values of remote myocardium (r) (grey square), infarct core (c) (black square) and infarct zone (z) (black triangle) are presented. In heart transplantation, T2 values of heart transplant recipients with negative rejection (n) (grey square) and positive rejection (p) (black square) are presented. In myocarditis, T2 values of populations scanned in the non-acute phase (n) (grey square) and in the acute phase (a) (black square) are presented. The number of included subjects for each population is reported above the graph. MI myocardial infarction, Trans heart transplantation, MC myocarditis.
Rights and permissions
Open Access This article is licensed under a Creative Commons Attribution 4.0 International License, which permits use, sharing, adaptation, distribution and reproduction in any medium or format, as long as you give appropriate credit to the original author(s) and the source, provide a link to the Creative Commons licence, and indicate if changes were made. The images or other third party material in this article are included in the article's Creative Commons licence, unless indicated otherwise in a credit line to the material. If material is not included in the article's Creative Commons licence and your intended use is not permitted by statutory regulation or exceeds the permitted use, you will need to obtain permission directly from the copyright holder. To view a copy of this licence, visit http://creativecommons.org/licenses/by/4.0/. The Creative Commons Public Domain Dedication waiver (http://creativecommons.org/publicdomain/zero/1.0/) applies to the data made available in this article, unless otherwise stated in a credit line to the data.
About this article

Cite this article
Snel, G.J.H., van den Boomen, M., Hernandez, L.M. et al. Cardiovascular magnetic resonance native T2 and T2* quantitative values for cardiomyopathies and heart transplantations: a systematic review and meta-analysis. J Cardiovasc Magn Reson 22, 34 (2020). https://doi.org/10.1186/s12968-020-00627-x
Received:
Accepted:
Published:
DOI: https://doi.org/10.1186/s12968-020-00627-x