
Abstract
Background
The cultivated peanut is an important oil and cash crop grown worldwide. To meet the growing demand for peanut production each year, genetic studies and enhanced selection efficiency are essential, including linkage mapping, genome-wide association study, bulked-segregant analysis and marker-assisted selection. Specific locus amplified fragment sequencing (SLAF-seq) is a powerful tool for high density genetic map (HDGM) construction and quantitative trait loci (QTLs) mapping. In this study, a HDGM was constructed using SLAF-seq leading to identification of QTL for seed weight and size in peanut.
Results
A recombinant inbred line (RIL) population was advanced from a cross between a cultivar ‘Huayu36’ and a germplasm line ‘6–13’ with contrasting seed weight, size and shape. Based on the cultivated peanut genome, a HDGM was constructed with 3866 loci consisting of SLAF-seq and simple sequence repeat (SSR) markers distributed on 20 linkage groups (LGs) covering a total map distance of 1266.87 cM. Phenotypic data of four seed related traits were obtained in four environments, which mostly displayed normal distribution with varied levels of correlation. A total of 27 QTLs for 100 seed weight (100SW), seed length (SL), seed width (SW) and length to width ratio (L/W) were identified on 8 chromosomes, with LOD values of 3.16–31.55 and explaining phenotypic variance (PVE) from 0.74 to 83.23%. Two stable QTL regions were identified on chromosomes 2 and 16, and gene content within these regions provided valuable information for further functional analysis of yield component traits.
Conclusions
This study represents a new HDGM based on the cultivated peanut genome using SLAF-seq and SSRs. QTL mapping of four seed related traits revealed two stable QTL regions on chromosomes 2 and 16, which not only facilitate fine mapping and cloning these genes, but also provide opportunity for molecular breeding of new peanut cultivars with improved seed weight and size.
Background
Peanut (Arachis hypogaea L.), an important source of edible oil and protein, is widely cultivated in more than 100 countries. The annual global peanut production increases rapidly in recent years resulting in a ten Mt elevation in yield from 2007 (37.51Mt) to 2017 (47.10Mt) (http://faostat.fao.org/) which paralleled to the constant increase in food demand [1]. Improving peanut yield through molecular breeding and optimized field management is amiable to the goals of sustainable agriculture. From the genetics point of view, peanut yield is influenced by a number of agronomic traits, such as height of main stem (HMS), total branch number (TBN), and the pod and seed/kernel traits [2]. Among these, 100 seed weight (100 SW), 100 pod weight and shelling percentage are important components of grain yield [2,3,4]. 100 SW is mainly determined by seed size which can be measured by seed length (SL) and seed width (SW) [2, 4]. Despite their contribution to yield, SL, SW and length to width ratio (L/W) are visual traits subject to selection during domestication and breeding [2]. In particular, shape of the peanut seeds (oblong or round) estimated by L/W is a critical factor determining the application of peanut varieties in the food processing factories. In China, round peanut is preferred for confectionary whereas oblong-shaped peanut is used for fried products. Identification of QTL/genes for seed related traits will advance our knowledge of biological pathways conditioning yield components and seed morphology.
Up to now, various genetic strategies to define QTLs or genes associated with seed traits have been conducted, including linkage mapping [2, 4], genome-wide association studies [5, 6] and bulked-segregant analyses [7]. High density genetic maps (HDGMs) provide essential information of linkage of genetic markers and facilitate QTL discovery [8, 9]. In the past decade, a number of genetic maps have been developed based on SSR markers for peanut. Over time, SSR based maps had increased marker density and map coverage [2, 3, 10,11,12,13,14]. However, genotyping by SSR markers is labor intensive and low throughput. Allelic SNP markers have the advantages of high frequency of occurrence in peanut genome [15, 16]. Combined with the next generation sequencing (NGS), a number of SNP-based genotyping technologies, especially SLAF-seq, have been applied to HDGM construction and QTL analysis in several species, such as sesame [17], soybean [18], cucumber [19, 20], cotton [21] and peanut [8, 22, 23]. In this study, a HDGM for cultivated peanut has been constructed based on SNP and SSR markers.
Compared with comprehensive studies on seed traits in rice [24, 25] and oilseed rape [26, 27], biological pathways controlling seed weight and size are not well understood in peanut. Up to now, QTL mapping for 100 seed weight, seed length, seed width and length to width ratio are still in progress. Using the bulked-segregant analysis (BSA), Gomez Selvaraj et al. [7] reported five SSR markers tightly linked to QTL regions for SL and 100SW. Fonceka et al. [28] identified several QTLs for pod and seed size that differentiated cultivated peanut from its wild relatives by using an advanced backcross population. Pandey et al. [5] performed genome wide association analysis by using 300 peanut genotypes, and identified 9 loci associated with SL, 3 with SW and 5 with 100SW. Using a F2 population, Huang et al. [29] successfully mapped QTLs for SL, SW, and 100SW, explaining phenotypic variance (PVE) from 1.69 to 17.88%. Chen et al. [4] utilized two F2:3 populations and detected 10 QTLs for SL and 7 for SW, with the PVE up to 20.80 and 14.43%, respectively. Chen at al [2]. conducted QTL mapping and meta-analysis with a RIL population, and reported 83 QTLs for pod- and seed-related traits. Wang et al. [8] constructed a SLAF-based HDGM from a RIL population and discovered two stable QTL regions for pod and seed related traits. Seed size QTL on chromosomes A05 and A07 were reported from two RIL populations [30, 31].
Due to the sequence similarity between the peanut diploid progenitors (A. duranensis, AA; A. ipaensis, BB) and cultivated tetraploid peanut (AABB), the genome sequences of the two peanut progenitors were informative in providing physical positions of genetic markers [12, 22, 32, 33]. However, homeologous recombination was identified in the newly released genome assemblies of cultivated peanut [34] suggesting erroneous assignment of QTL positions could occur by using the diploid genomes. Therefore, physical positions of QTL regions discovered in this manuscript were reported based on the cultivated peanut genome [34]. To further elucidate genomic regions conditioning seed related traits in peanut, we developed a recombinant inbred line (RIL) population for QTL mapping. The parental genotypes, a large-seeded cultivar ‘Huayu36’ and a small-seeded germplasm line ‘6–13’, were characterized by contrasting phenotypes in seed weight, seed size and shape. SLAF-seq and SSR analysis were conducted to generate sufficient markers for HDGM construction. QTL mapping of four seed related traits collected from four environments revealed two stable QTL regions on chromosomes 2 and 16, which may facilitate the peanut breeding with improved seed characteristics.
Results
Phenotyping of the parents and RIL individuals.
To identify novel QTL/genes modulating seed traits in peanut, a RIL population consisting of 181 individuals was created from a cross between ‘Huayu36’ and ‘6–13’. The maternal parent ‘Huayu36’ was a large-seeded cultivar (Fig. 1a), with 100SW, SL, SW and L/W up to 119.30 ± 7.17 g, 20.15 ± 3.12 mm, 11.83 ± 1.13 mm and 1.72 ± 0.10, respectively (Fig. 1b). The paternal parent ‘6–13’ was a germplasm line with significantly smaller seed weight and size (Fig. 1a). The corresponding measurements for ‘6–13’ were 61.83 ± 7.28 g, 13.89 ± 0.63 mm, 9.80 ± 0.30 mm and 1.44 ± 0.03 (Fig. 1b). The RIL population and its parents were planted in four environments (Laixi, 2017; Sanya, 2017; Dongying, 2018; Laixi, 2018) and phenotypic data for the four seed related traits (100SW, SL, SW and L/W) demonstrated normal distribution among the population (Fig. 2; Table 1). Transgressive segregation was observed in most environments (Fig. 2), indicating polygenic inheritance of the measured traits. ANOVA (analysis of variance) results indicated that the effects of genotypes (G), environments (E), and interaction of G and E (G × E) were all significant for all measured traits except for G × E for SL (Table 2). All four seed traits exhibited relatively high broad-sense heritability (h2), ranging from 0.77 to 0.89 (Table 2), which suggested genetics plays a major role in controlling seed size and weight, yet the environmental influence should not be ignored. Pairwise correlation analysis indicated significant positive correlation between 100SW and SL (r = 0.793) as well as between 100SW and SW (r = 0.722). A positive correlation was found between SL and SW (r = 0.537). L/W was positively correlated with both 100SW (r = 0.435) and SL (r = 0.809), yet no significant correlation was found between with SW and L/W (Table 3).

Phenotypic characterization of seeds from ‘Huayu36’ and ‘6-13', (a), Seed morphology of two parents ‘Huayu36’ and ‘6-13’. Scale bar: 2 cm. (b), Comparisons of 100 seed weight, seed length, seed width and length to width ratio between ‘Huayu36’ and ‘6–13′. Data shown as mean ± s.e.m. (n = 9). Student’s t-test was used to generate the P values
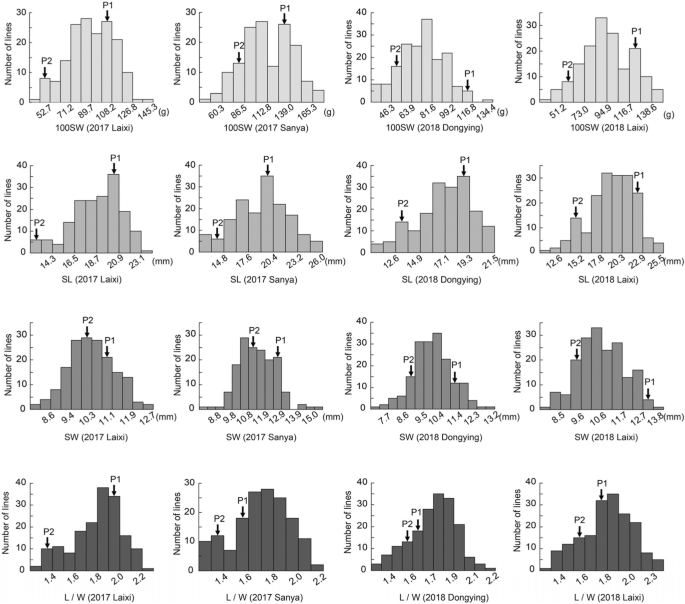
Phenotypic distribution of seed traits for the RIL population, The x-axis shows the range of seed traits, including 100 seed weight(100SW), seed length(SL), seed width (SW) and length-width ratio (L/W) in four environments (2017 Laixi, 2017 Sanya, 2018 Dongying and 2018 Laixi). The y-axis shows the number of individuals of the RIL population. P1 and P2 represent the parents ‘Huayu36’ and ‘6–13’, respectively
SLAF sequencing, SNP and SSR genotyping.
A total of 327.08 Gb raw sequencing data containing 1635.75 M reads was obtained after sequencing both parents and 181 RIL lines, of which 9.70 Gb data with 48.51 M reads was from the maternal line ‘Huayu36’, and 7.56 Gb data with 37.82 M reads was from the paternal line ‘6–13’, respectively (Table 4; Additional file 2: Table S5). The GC (percentage of guanine and cytosine in all four bases) content was 37.66%, and Q30 ratio (bases with a quality score of 30, indicating 99% confidence) was 94.66% on average (Additional file 2: Table S5). After discarding the low quality reads, 1,614,182 SLAF tags containing 510,204 SNPs were mined based on the Tifrunner reference genome, of which 733,610 and 693,570 SLAFs were identified from maternal and paternal parents with the sequencing depth of 50.91- and 52.33-fold, respectively (Table 4; Additional file 2: Table S6). The number of SLAFs in the F6 progenies was 506,417, with an average coverage of 16.13-fold, corresponding to 8,207,746 reads (Additional file 2: Table S6).
A total of 510,204 SNPs were obtained in the SLAF tags, and 12,950 were successfully encoded as polymorphic with a polymorphism rate of 2.54% (Table 4). According to the genotype encoding rule, the polymorphic SNPs were grouped in different segregation patterns (ef × eg, hk × hk, lm × ll, nn × np, aa×bb, ab×cc, cc × ab, ab×cd). Since the RIL population was derived from a cross between two homozygous genotypes, a total of 6124 SNPs belonging to aa×bb pattern were extracted (Additional file 2: Figure S1). After filtering the low-quality SNPs, 3829 were available for linkage analysis (Table 4).
Construction of the high-density genetic map
For the HDGM construction, 3866 markers (3829 SNPs and 37 SSRs) were assigned to 20 linkage groups (LGs) (Fig. 3; Table 5). This map covered a total of 1266.87 cM genetic distance ranging from 9.61–125.63 cM for each linkage group with average marker interval of 0.33 cM (Table 5). LG 7 was the longest group covering a distance of 125.63 cM with 153 loci, while LG 2 was the shortest group spanning 9.61 cM with 39 loci. LG 3 hosted 421 loci which was the highest among all linkage groups, whereas LG 20 had only 22 loci, the least among the linkage groups (Table 5). In addition, the 37 SSRs were distributed across 16 LGs, with no SSRs assigned on LG 6, LG 11, LG 12 and LG 20 (Table 5). Subsequently, the degree of the map uniformity and inter-marker linkage were evaluated by the percentage of ‘Gaps≤5 cM’, which ranged from 85.71 to 100% with an averaged value of 97.04%. The largest gap existed on LG 7, which was 17.05 cM (Table 5).
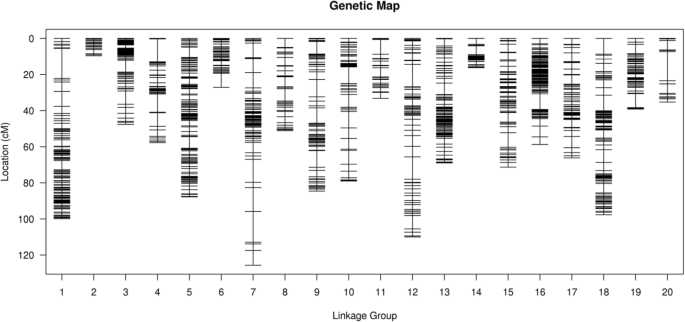
High density genetic map of the RIL population using SNP and SSR markers, The markers were indicated by black bars. The x-axis represents 20 linkage groups and y-axis represents genetic distance
To assess the quality of the HDGM, we conducted colinearity analysis by comparing the genetic positions of markers on each LG to their physical positions. Despite three obvious inverted segments on LG 8 and LG 17, a relative high colinearity between the genetic and genomic positions was displayed (Additional file 2: Figure S2), confirming a well ordered marker assignment.
QTL identification for seed related traits
QTL mapping resulted in identification of 27 QTLs for all 4 seed related traits, with the LOD values of 3.16–31.55 and explaining phenotypic variation (PVE) from 0.74 to 83.23% (Fig. 4; Table 6).

Seed related QTLs detected in four environments
For 100SW, a total of 4 QTLs were detected on two chromosomal regions (Fig. 4), explaining phenotypic variation of 24.69–35.39% (Table 6). One consistent QTL region was detected in more than one environment, and located in the marker interval Marker9375–Marker9395 on LG 16 spanning 2.77 Mb which was detected in Laixi 2017 and Laixi 2018 with the PVE of 29.81 and 30.47%, respectively (Table 6). Although q100SW16b (PVE = 35.39%) was also identified on LG 16, the QTL position was shifted lower than the first consistent QTL region. Q100SW2 was identified in only one environment, with a PVE of 24.69% (Fig. 4; Table 6).
For SL, a total of 10 QTLs were mapped on LGs 2, 5, 7, 9 and 10 (Fig. 4). QSL2 was a major consistent QTL region (Marker938–Marker893) spanning 7.06 Mb on LG 2 with the PVE up to 61.47% (Table 6). This QTL region was identified in all four environments. Two major QTLs (qSL5.1 and qSL5.2) were tightly linked on LG 5 and identified in the same season, with PVE of 40.25 and 36.91%, respectively. Another QTL, qSL9, was identified in the Sanya_2017 and Laixi_2018 datasets with PVE of 4.05 and 9.62%, respectively (Fig. 4; Table 6). Both qSL7 and qSL10 were identified in only one season. Except for qSL9, all the alleles from ‘Huayu36’ increased measurements of seed traits (Table 6).
For SW, 5 QTLs were identified, accounting for 12.12–21.58% PVE (Fig. 4; Table 6). Three major QTLs (qSW16.1a, qSW16.2a, qSW16b) were mapped on LG 16 (Fig. 4), with the ‘Huyu36’ allele contributing to increased SW (Table 6). QSW16.1a (PVE 13.68%) and qSW16.2a (PVE 12.64%) were detected in the same environment, while qSW16b (PVE 21.58%) was identified in a different season (Table 6). The position of qSW16.1a and qSW16b overlapped with the consistent QTL region detected for 100SW. Another two major QTLs for SW (qSW5 and qSW13) were detected on LGs 5 and 13 and accounted for PVE of 15.07 and 12.12%, respectively (Table 6). These QTLs were detected in only one environment.
For the L/W, 8 associated QTLs were mapped on LGs 2, 3, 5 and 9 (Fig. 4; Table 6). Among these, the consistent QTL region on LG 2 was detected in all four environments (PVE = 65.77 to 83.23%), and co-localized with the QTL region identified for SL. Donor alleles for increased trait measurements came from ‘Huayu36’. Another consistent QTL region (qLW5a and qLW5b) was detected on LG 5, accounting for 43.66 and 45.83% PVE, respectively (Table 6). Two minor QTLs, qLW3 (PVE 4.85%) and qLW9 (PVE 4.47%) were identified, with the ‘6–13’ allele contributing to the L/W trait (Table 5). Additionally, qLW9 overlapped with the region detected for qSL9b (Fig. 4).
Functional annotation of two stable and pleiotropic QTL regions.
In order to reveal genes/genetic pathways potentially conditioning seed size, genes within the two consistent QTL regions on chromosomes 2 and 16 were extracted from the Tifrunner reference genome for annotation. The first QTL region (defined as the region I) on chromosome 2, with flanking markers Marker938–Marker893, spanned a genomic distance of 7.06 Mb, and contained 514 candidate genes by Nr database (Additional file 3: Table S7). GO annotation showed that the majority of genes had specific functional assignment: the cell (114), cell part (114) and organelle (88) in the cellular component category; catalytic activity (195), binding (148) and electron carrier activity (23) in the molecular function category; metabolic process (230), cellular process (157) and single-organism process (136) in the biological process category (Fig. 5). The other QTL region (defined as the region II) on chromosome 16, with flanking markers Marker9360–Marker9483 covered a genomic distance of 12.21 Mb. A total of 684 candidate genes were obtained within this region (Additional file 3: Table S8), among which the majority terms were cell (199), cell part (197) and organelle (142) for cellular component category; catalytic activity (195), binding (148) and transporter activity (27) for molecular function category; metabolic process (340), cellular process (267) and single-organism process (218) for the biological process category (Fig. 5).

GO annotation of genes within the region I and II on chromosome 2 and 16 respectively
A total of 66 SNPs were detected in these two QTL regions (16 SNPs in the region I and 50 SNPs in the region II), which were mostly located in intergenic regions or resulted in synonymous mutation (Additional file 3: Table S9). Phytohormones such as brassinosteroid (BR) were known to play crucial roles in seed development [35]. Deficiency in BR synthesis and signal transduction pathway leads to off-type exhibitions in seed size and mass [36,37,38,39]. In the region I, three candidate genes arahy.T43K8I.1, arahy.T43K8I.2 and arahy.T43K8I.3 were all homologous to the BSU1 (BRI1 suppressor 1) (Additional file 2: Figure S3; Additional file 3: Table S7), which was reported to function in brassinosteroid (BR) signaling and affect plant growth [40, 41]. Meanwhile, a candidate gene arahy.BC5R4P.1 encoding the putative auxin response factor 2 (ARF2)–like protein was highlighted in the region II (Additional file 2: Figure S3; Additional file 3: Table S8), of which the homolog acted downstream of BZR1 and BR signal in regulating seed size in Arabidopsis [42].
Discussion
A SLAF based HDGM for cultivated peanut.
In this study, two parental genotypes with contrasting seed characteristic were selected to develop a RIL population. High levels of phenotypic variation among the RIL lines allowed for the detection of QTL using the HDGM. Previously, the narrow genetic basis of cultivated peanut resulted in an extremely low degree of polymorphism in various forms of molecular markers, which restrains the construction of HDGM in peanut [13, 43, 44]. The SLAF-seq strategy, a combination of locus-specific amplification and next generation sequencing has been successfully applied in large-scale SNP mining in various species, revealing its mature pipelines and advantages in HDGM construction and favorable QTL identification [17, 18, 21, 45]. Currently, three HDGMs based on SLAF-seq have been published in cultivated peanut, all of which consisted of more than 2000 high-quality SNP markers, and resulted in yield and oil quality related QTL detection in cultivated peanut [8, 22, 23]. In this study, close to 4000 markers were placed on the linkage map allowing for fine genetic mapping of traits of interest (Table 5). Meanwhile, colinearity analysis validated the high quality of this map. The present SLAF-based HDGM was constructed based on the newly published genome of tetraploid cultivated peanut (A. hypogaea cv. Tifrunner) [34], rather than the reference genomes of two ancestral diploid species (A. duranensis, AA; A. ipaensis, BB) [32, 33]. Although sequence conservation between the diploid and tetraploid species was high, tetrasomic events and chromosome inversions occurred after the polyploidization event forming the cultivated peanut species [34, 46,47,48,49]. Thus, using the cultivated peanut reference genome reduced the risk of incorrect assignment of marker positions and improved the accuracy of QTL/genes identification.
QTL identification for seed weight and size.
The complex genetic basis of seed weight and size has been well characterized in crops, which were controlled by a number of genes involved in different pathways [25, 27, 50, 51]. However, the underlying genetic mechanism for peanut seed related traits is poorly understood and needs further investigation. Currently, several seed related QTLs have been identified with variable PVE and chromosomal positions from different parental genotypes [2, 4, 8, 28, 29]. And the previously identified QTL for 100SW, SL and SW were widely distributed on various LGs, indicating complex polygenic inheritance of such traits. Similarly, in the present study, a total of 27 QTLs for 4 seed related traits were detected on chromosomes 2, 3, 5, 7, 9, 10, 13 and 16, explaining phenotypic variation from 0.74 to 83.23% (Fig. 4; Table 6). Among these, qSL2, qLW2 and q100SW16 with more than 29.81% PVE were consistently detected in at least three environments, indicating stable genetic effects across environments. There were 5 and 3 QTLs covering two genomic regions on chromosomes 5 and 9, which contained three transposable element markers (AhTE0523, AhTE0278 and AhTE0437) previously associated with pod size [6]. Meanwhile, the QTL region covering 29.7 Mb on chromosome 5 agreed with the location of QTL for pod weight detected by Hake et al. [54].
The co-localization of qSL2 and qLW2 on chromosome 2 and q100SW16 and qSW16 on chromosome 16 was in agreement with the high positive correlation within each pair of traits. It was often observed that yield related QTLs exhibited pleiotropic effects on more than one trait [2, 53, 55]. Application of genetic markers within these QTL regions in breeding programs could potentially optimize the selection of multiple seed related traits. Previous studies have reported several yield related QTLs on B06 [2, 8, 28]. Among these, Wang et al. [8] identified one QTL region on B06 with physical coverage of 119.8 Mb–128.8 Mb, which was distant from QTL regions reported here (physical coverage: 7.33 Mb–21.71 Mb and 25.49 Mb–53.24 Mb). Chen et al. [2] reported three QTL regions for both 100SW and SW on B06, among which two (physical coverage: 10.6 Mb–21.6 Mb and 12.2 Mb–74.9 Mb) overlapped with our results, suggesting a possibly similar genetic basis within these regions. Fonceka et al. [28] identified one marker (TC3H07_B) on B06, associated with seed weight only under water-limited condition. Since the physical position of TC3H07_B is unknown, we are unable to determine whether this marker locates in our detected QTL regions. Nevertheless, to our knowledge, the region I on chromosome 2 is novel (Fig. 4), since no related QTL has been reported on this chromosome yet.
Functional annotation in two stable pleiotropic QTL regions.
Functional annotation was provided for 514 and 684 genes within the QTL regions I and II, facilitating the understanding of their putative biological functions. A total of 66 SNPs were detected in the region I and II, none of which led to alteration in protein coding sequences (Additional file 3: Table S9). The insufficient marker density limited the prediction of target genes. However, these SNPs might be used to design KASP (kompetitive allele-specific polymerase chain reaction) markers for fine mapping and facilitating molecular breeding [56].
Previous studies on other species provided useful information to understand the putative mechanisms for peanut seed size regulation [25,26,27, 50,51,52,53]. Hormones have been widely demonstrated to function in seed development, among which BR plays key roles in seed size regulation [36,37,38,39]. In the region I, three genes arahy.T43K8I.1, arahy.T43K8I.2 and arahy.T43K8I.3 encoded proteins homologous to the BSU1 (Additional file 2: Figure S3; Additional file 3: Tables S7, S8), a key factor in fine tuning the BR responses, of which mutants can affect organ size and shape [40, 41]. Arahy. BC5R4P.1, was identified in the region II and is homologous to ARF2, which was reported to act as a target of BZR1 and negatively regulate seed size in Arabidopsis [42]. These four candidate genes together with other possible ones are worthy of further investigation to define their roles in peanut seed development.
Conclusions
A new high density genetic map with 3866 SLAF and SSR loci was constructed based on the released cultivated peanut genome. Our findings demonstrated that this SLAF-based map was of high quality, and applicable for QTL mapping. A total of 27 QTLs regulating seed size and weight were identified in 4 environments, including two stable pleiotropic QTL regions, of which the QTL region on chromosome 2 was novel. These findings will facilitate the fine mapping and cloning of genes conditioning yield components and seed morphology traits. Genetic markers associated with these traits can be designed for molecular breeding of peanut with improved seed characteristics.
Methods
Plant materials and phenotyping
An F2:6–8 population of 181 RIL lines was derived from a cross between ‘Huayu36’ and ‘6–13’. The plant materials (including the parents and the RILs) used in this study were originally created by our laboratory and we have all the relevant rights to the materials. All materials were grown in the field in accordance with the local legislation. The ‘Huayu36’ cultivar is large-seeded with light red testa. The germplasm ‘6–13’ is small-seeded with light brown testa. The RIL population and its parental lines were planted in the experimental fields in Laixi (at N 36.86°, E 120.53°), Shandong Province (planted in May and harvested in September of 2017 and 2018); in Sanya (at N 18.65°, E 109.80°), Hainan Province (planted in November of 2017 and harvested in March of 2018); in Dongying (at N 37.46°, E 118.49°), Shandong Province (planted in May and harvested in September of 2018). The field experiments followed a randomized block design with three replications according to a previous study with a few modifications [57]. For each plot, 10 plants from each RIL line were grown 15-cm apart within a row, and an 85-cm gap was given between RILs. The parental lines were planted after every 20 rows as controls. Standard agricultural practices were applied for field management. Each plant was harvested individually at its maturity to prevent loss from over-ripening. Only eight plants in the middle of each row were used for trait measurement. Mature seeds determined by full size pods with dark inner carp color from each plant were measured for 100 seed weight, seed length, seed width and length to width ratio. The seed length and seed width were measured by using a parallel rule. The seed weight was taken on an electrical scale. The length to width ratio was calculated by dividing seed length by seed width. The mean values of each measured trait were used for phenotypic characterization. The phenotypic datasets of four seed traits in four environments are shown in an additional supporting file (Additional file 1:Table S1).
Statistical analysis of phenotypic data
The mean value and standard deviation of each seed related trait for the parents and each RIL line were analyzed, and the Student’s t-test was conducted by SPSS statistics (IBM® SPSS® statistics 19). The normality of the population data was analyzed by the Kolmogorov-Smirnov test. According to the equation h2 = σg2/(σg2 + σge2/n + σe2/nr), the broad-sense of heritability (h2) for seed related traits was calculated by ANOVA analysis with QTL IciMapping V4.1 (http://www.isbreeding.net/software/?type=detail&id=18). The σg2, σe2, and σge2 represented the variances of genotypes (G), environments (E) and interaction of genotypes and environments (G × E). The Pearson’s correlation coefficient between each two traits was obtained utilizing the SPSS statistics (IBM® SPSS® statistics 19).
DNA extraction and SSR marker analysis
Young healthy leaves from the two parents and 181 RIL lines (F2:6) were collected at the seedling stage, frozen in liquid nitrogen, and stored at − 70 °C. Total genomic DNA was extracted by Plant Genomic DNA Kit (TIANGEN Biotech Beijing Co., Ltd). The concentration and quality of DNA were examined using electrophoresis on a 0.8% agarose gel and an ND–1000 spectrophotometer (NanoDrop, Wilmington, DE, USA). PCR reaction conditions for SSR analysis were: 3 min denaturation at 94 °C; 35 cycles of 1 min at 94 °C, 30 s at 55 °C, and 90 s at 72 °C; and then a final extension of 10 min at 72 °C, and storage at 4 °C. The PCR products were then separated on a 6% PAGE gel. 37 polymorphic SSR primers (Additional file 1: Table S2) were used to genotype the RIL population. SSR genotyping was performed as previously described [22].
High-throughput sequencing and genotyping
After scanning the reference genome of peanut, the RsaI and EcoRV-HF® (NEB, Ipswich, MA) enzymes were selected to digest the genomic DNA. The protocol of the SLAF-library construction has been previously described [19, 58]. The DNA fragments with indices and adaptors (SLAFs) of 314–414 bp were excised and diluted for pair-end sequencing using the Illumina HighSeq 2500 platform according to the Illumina sample preparation guide (Illumina, Inc., San Diego, CA) at the Biomarker Technologies Corporation (Beijing, China).
Low quality reads (quality score < 30, indicating a 0.1% chance of error) were discarded based on sequence similarity, and the SLAF paired-end reads were clustered by BLAT (−tileSize = 10 -stepSize = 5) [58]. Sequences with over 90% identity were grouped in one SLAF locus [59]. The SLAF in this study were classified into three types, non-polymorphic SLAF, polymorphic SLAF, and repetitive SLAF. Using the minor allele frequency (MAF) evaluation, alleles were defined in each SLAF. SNP calling was achieved according to GATK Best Practices (https://www.broadinstitute.org/gatk/guide/best-practices?bpm=DNAseq#variant-discovery-ovw). Polymorphic SNP markers were classified into eight segregation patterns (ab × cd, ef × eg, hk × hk, lm × ll, nn × np, aa × bb, ab × cc and cc × ab). The RIL population is obtained by a cross between two homozygous parents with genotype aa or bb. Thus, SNP markers fitting the aa × bb segregation pattern were used for genetic map construction. To ensure the quality of the genetic map, low quality SNPs were filtered out by the following rules [22]: SNPs with sequencing depth in parents ≤10-fold; complete degree ≤70%; SLAF with highly distorted segregation ratio from the expected 1:1 by Chi square (χ2) test; SLAF with more than 8 SNPs. The aa and bb represents the genotypes of ‘6–13’ and ‘Huayu36’, and related genotyping results of each RIL line by high quality markers are shown in an additional supporting file (Additional file 1: Table S3).
High density genetic map construction
A linkage map was constructed [60] and the physical positions of markers were assigned in reference to the cv. Tifrunner genome sequence [34]. The high quality SLAF markers were grouped based on a pair-wise modified logarithm of odds (MLOD) scores. To ensure efficient construction of the high-density and high-quality map, High Map Strategy was used for ordering the SLAF and SSR markers and correcting genotyping errors within the chromosomes [61]. MSTMap was applied to obtain the marker orders of each group [62]. The SMOOTH algorithm was used for error correction [63], and a k-nearest neighbor algorithm was applied to the missing genotype imputation [64]. The Kosambi mapping function was applied to estimate the map distances [65]. The genetic positions of markers on each LG were displayed in an additional supporting file (Additional file 1: Table S4). In addition, a co-linearity map was generated to evaluate the map quality. Linkage group number corresponds to the chromosome number assigned by the Tifrunner reference genome.
QTL mapping
The R/qtl package [66] was used to detect QTL and confirm the relationship between different markers around each QTL with the composite interval mapping method (CIM). The permutation test was repeated 1000 times with the LOD scores larger than 5% cutoff value. A logarithm of the odds (LOD) threshold value of 3.0 was applied to declare the presence of a QTL at 95% significance level. The positive and negative additive effect represented the favorable alleles were from ‘6–13’ and ‘Huayu36’, respectively.
Functional annotation
Markers flanking the confidence intervals of the co-localized QTLs in 4 environments were selected to identify the candidate genes based on the genome sequences of the cultivated peanut (https://peanutbase.org/data/public/Arachis_hypogaea/Tifrunner.esm.TVDM/). For the functional annotation, gene content within the major QTL regions was compared with the Nr (nonredundent) protein sequences available at the UniProt database using the BLASTX algorithm. The associated hits were then searched for their respective Gene Ontology (GO) terms at www.geneontology.org [67]. Homologous protein sequences of putative candidate genes were obtained by the BLASTP algorithm against the Arabidopsis information resources (https://www.arabidopsis.org/index.jsp).
Availability of data and materials
The data sets supporting the results of this study are included in the manuscript and additional supporting files.
Abbreviations
- 100SW:
-
100 seed weight
- ADD:
-
Additive effect
- BR:
-
Brassinosteroid
- CI:
-
Confidence interval
- CIM:
-
Composite interval mapping
- GO:
-
Gene ontology
- HDGM:
-
High density genetic map
- L/W:
-
Length to width ratio
- LGs:
-
Linkage groups
- LOD:
-
Logarithm of the odds
- NGS:
-
Next generation sequencing
- PVE:
-
Phenotypic variation explained
- QTL:
-
Quantitative trait locus
- RIL:
-
Recombinant inbred line
- SL:
-
Seed length
- SLAF-Seq:
-
Specific-locus amplified fragment sequencing
- SNP:
-
Single nucleotide polymorphism
- SSR:
-
Simple sequence repeat
- SW:
-
Seed width
References
McKenzie FC, Williams J. Sustainable food production: constraints, challenges and choices by 2050. Food Secur. 2015;7:221–33.
Chen Y, Ren X, Zheng Y, Zhou X, Huang L, Yan L, et al. Genetic mapping of yield traits using RIL population derived from Fuchuan Dahuasheng and ICG6375 of peanut (Arachis hypogaea L.). Mol Breed. 2017;37:17.
Shirasawa K, Koilkonda P, Aoki K, Hirakawa H, Tabata S, Watanabe M, et al. In silico polymorphism analysis for the development of simple sequence repeat and transposon markers and construction of linkage map in cultivated peanut. BMC Plant Biol. 2012;12:80.
Chen W, Jiao Y, Cheng L, Huang L, Liao B, Tang M, et al. Quantitative trait locus analysis for pod- and kernel-related traits in the cultivated peanut (Arachis hypogaea L.). BMC Genet. 2016;17:25.
Pandey MK, Upadhyaya HD, Rathore A, Vadez V, Sheshshayee MS, Sriswathi M, et al. Genomewide association studies for 50 agronomic traits in peanut using the 'reference set' comprising 300 genotypes from 48 countries of the semi-arid tropics of the world. PLoS One. 2014;9:e105228.
Hake AA, Shirasawa K, Yadawad A, Nayak SN, Mondal S, Badigannavar AM, et al. Identification of transposable element markers associated with yield and quality traits from a large population of independent mutants in peanut (Arachis hypogaea L.). Euphytica. 2017;213:283.
Gomez Selvaraj M, Narayana M, Schubert AM, Ayers JL, Baring MR, Burow MD. Identification of QTLs for pod and kernel traits in cultivated peanut by bulked segregant analysis. Electron J Biotechnol. 2019;12:1–10.
Wang Z, Huai D, Zhang Z, Cheng K, Kang Y, Wan L, et al. Development of a high-density genetic map based on specific length amplified fragment sequencing and its application in quantitative trait loci analysis for yield-related traits in cultivated peanut. Front Plant Sci. 2018;9:827.
Petroli CD, Sansaloni CP, Carling J, Steane DA, Vaillancourt RE, Myburg AA, et al. Genomic characterization of DArT markers based on high-density linkage analysis and physical mapping to the Eucalyptus genome. PLoS One. 2012;7:e44684.
Gautami B, Pandey MK, Vadez V, Nigam SN, Ratnakumar P, Krishnamurthy L, et al. Quantitative trait locus analysis and construction of consensus genetic map for drought tolerance traits based on three recombinant inbred line populations in cultivated groundnut (Arachis hypogaea L.). Mol Breed. 2012;30:757–72.
Huang L, Ren X, Wu B, Li X, Chen W, Zhou X, et al. Development and deployment of a high-density linkage map identified quantitative trait loci for plant height in peanut (Arachis hypogaea L.). Sci Rep. 2016;6:39478.
Qin H, Feng S, Chen C, Guo Y, Knapp S, Culbreath A, et al. An integrated genetic linkage map of cultivated peanut (Arachis hypogaea L.) constructed from two RIL populations. Theor Appl Genet. 2012;124:653–64.
Varshney RK, Bertioli DJ, Moretzsohn MC, Vadez V, Krishnamurthy L, Aruna R, et al. The first SSR-based genetic linkage map for cultivated groundnut (Arachis hypogaea L.). Theor Appl Genet. 2009;118:729–39.
Wang H, Penmetsa RV, Yuan M, Gong L, Zhao Y, Guo B, et al. Development and characterization of BAC-end sequence derived SSRs, and their incorporation into a new higher density genetic map for cultivated peanut (Arachis hypogaea L.). BMC Plant Biol. 2012;12:10.
Clevenger J, Chavarro C, Pearl SA, Ozias-Akins P, Jackson SA. Single nucleotide polymorphism identification in polyploids: a review, example, and recommendations. Mol Plant. 2015;8:831–46.
Liao PY, Lee KH. From SNPs to functional polymorphism: the insight into biotechnology applications. Biochem Eng J. 2010;49:149–58.
Zhang Y, Wang L, Xin H, Li D, Ma C, Ding X, et al. Construction of a high-density genetic map for sesame based on large scale marker development by specific length amplified fragment (SLAF) sequencing. BMC Plant Biol. 2013;13:141.
Qi Z, Huang L, Zhu R, Xin D, Liu C, Han X, et al. A high-density genetic map for soybean based on specific length amplified fragment sequencing. PLoS One. 2014;9:e104871.
Xu X, Xu R, Zhu B, Yu T, Qu W, Lu L, et al. A high-density genetic map of cucumber derived from specific length amplified fragment sequencing (SLAF-seq). Front Plant Sci. 2014;5:768.
Zhu WY, Huang L, Chen L, Yang JT, Wu JN, Qu ML, et al. A high-density genetic linkage map for cucumber (Cucumis sativus L.): Based on specific length amplified fragment (SLAF) sequencing and QTL analysis of fruit traits in cucumber. Front Plant Sci. 2016;7:437.
Zhang Z, Shang H, Shi Y, Huang L, Li J, Ge Q, et al. Construction of a high-density genetic map by specific locus amplified fragment sequencing (SLAF-seq) and its application to quantitative trait loci (QTL) analysis for boll weight in upland cotton (Gossypium hirsutum ). BMC Plant Biol. 2016;16:79.
Hu XH, Zhang SZ, Miao HR, Cui FG, Shen Y, Yang WQ, et al. High-density genetic map construction and identification of QTLs controlling oleic and linoleic acid in peanut using SLAF-seq and SSRs. Sci Rep. 2018;8:5479.
Li L, Yang X, Cui S, Meng X, Mu G, Hou M, et al. Construction of high-density genetic map and mapping quantitative trait loci for growth habit-related traits of peanut (Arachis hypogaea L.). Front Plant Sci. 2019;10:745.
Li Y, Fan C, Xing Y, Jiang Y, Luo L, Sun L, et al. Natural variation in GS5 plays an important role in regulating grain size and yield in rice. Nat Genet. 2011;43:1266–9.
Liu L, Tong H, Xiao Y, Che R, Xu F, Hu B, et al. Activation of Big Grain1 significantly improves grain size by regulating auxin transport in rice. Proc Natl Acad Sci U S A. 2015;112:11102–7.
Li S, Chen L, Zhang L, Li X, Liu Y, Wu Z, et al. BnaC9.SMG7b functions as a positive regulator of the number of seeds per silique in Brassica napus by regulating the formation of functional female gametophytes. Plant Physiol. 2015;169:2744–60.
Liu J, Hua W, Hu Z, Yang H, Zhang L, Li R, et al. Natural variation in ARF18 gene simultaneously affects seed weight and silique length in polyploid rapeseed. Proc Natl Acad Sci U S A. 2015;112:5123–32.
Fonceka D, Tossim HA, Rivallan R, Vignes H, Faye I, Ndoye O, et al. Fostered and left behind alleles in peanut: interspecific QTL mapping reveals footprints of domestication and useful natural variation for breeding. BMC Plant Biol. 2012;12:26.
Huang L, He H, Chen W, Ren X, Chen Y, Zhou X, et al. Quantitative trait locus analysis of agronomic and quality-related traits in cultivated peanut (Arachis hypogaea L.). Theor Appl Genet. 2015;128:1103–15.
Luo H, Guo J, Ren X, Chen W, Huang L, Zhou X, et al. Chromosomes A07 and A05 associated with stable and major QTLs for pod weight and size in cultivated peanut (Arachis hypogaea L.). Theor Appl Genet. 2018;131:267–82.
Luo HY, Ren XP, Li ZD, Xu ZJ, Li XP, Huang L, et al. Co-localization of major quantitative trait loci for pod size and weight to a 3.7 cM interval on chromosome A05 in cultivated peanut (Arachis hypogaea L.). BMC Genomics. 2017;18:–58.
Bertioli DJ, Cannon SB, Froenicke L, Huang G, Farmer AD, Cannon EK, et al. The genome sequences of Arachis duranensis and Arachis ipaensis, the diploid ancestors of cultivated peanut. Nat Genet. 2016;48:438–46.
Chen X, Li H, Pandey MK, Yang Q, Wang X, Garg V, et al. Draft genome of the peanut A-genome progenitor (Arachis duranensis) provides insights into geocarpy, oil biosynthesis, and allergens. Proc Natl Acad Sci U S A. 2016;113:6785–90.
Bertioli DJ, Jenkins J, Clevenger J, Dudchenko O, Gao D, Seijo G, et al. The genome sequence of segmental allotetraploid peanut Arachis hypogaea. Nat Genet. 2019;51:877–84.
Sun X, Shantharaj D, Kang X, Ni M. Transcriptional and hormonal signaling control of Arabidopsis seed development. Curr Opin Plant Biol. 2010;13:611–20.
Hong Z, Ueguchi-Tanaka M, Fujioka S, Takatsuto S, Yoshida S, Hasegawa Y, et al. The rice brassinosteroid-deficient dwarf2 mutant, defective in the rice homolog of Arabidopsis DIMINUTO/DWARF1, is rescued by the endogenously accumulated alternative bioactive brassinosteroid, dolichosterone. Plant Cell. 2005;17:2243–54.
Jiang WB, Lin WH. Brassinosteroid functions in Arabidopsis seed development. Plant Signal Behav. 8:10.
Morinaka Y, Sakamoto T, Inukai Y, Agetsuma M, Kitano H, Ashikari M, et al. Morphological alteration caused by brassinosteroid insensitivity increases the biomass and grain production of rice. Plant Physiol. 2006;141:924–31.
Takahashi N, Nakazawa M, Shibata K, Yokota T, Ishikawa A, Suzuki K, et al. shk1-D, a dwarf Arabidopsis mutant caused by activation of the CYP72C1 gene, has altered brassinosteroid levels. Plant J. 2005;42:13–22.
Kim TW, Guan S, Burlingame AL, Wang ZY. The CDG1 kinase mediates brassinosteroid signal transduction from BRI1 receptor kinase to BSU1 phosphatase and GSK3-like kinase BIN2. Mol Cell. 2011;43:561–71.
Mora-García S, Vert G, Yin Y, Caño-Delgado A, Cheong H, Chory J. Nuclear protein phosphatases with kelch-repeat domains modulate the response to brassinosteroids in Arabidopsis. Genes Dev. 2004;18:448–60.
Schruff MC, Spielman M, Tiwari S, Adams S, Fenby N, Scott RJ. The AUXIN RESPONSE FACTOR 2 gene of Arabidopsis links auxin signaling, cell division, and the size of seeds and other organs. Development. 2006;133:251–61.
Hilu KW, Stalker HT. Genetic relationships between peanut and wild species of Arachis sect. Arachis (Fabaceae): evidence from RAPDs. Plant Syst Evol. 1995;198:167–78.
Tallury SP, Hilu KW, Milla SR, Friend SA, Alsaghir M, Stalker HT, et al. Genomic affinities in Arachis section Arachis (Fabaceae): molecular and cytogenetic evidence. Theor Appl Genet. 2005;111:1229–37.
Xia C, Chen LL, Rong TZ, Li R, Xiang Y, Wang P, et al. Identification of a new maize inflorescence meristem mutant and association analysis using SLAF-seq method. Euphytica. 2015;202:35–44.
Clevenger J, Chu Y, Chavarro C, Agarwal G, Bertioli DJ, Leal-Bertioli SCM, et al. Genome-wide SNP genotyping resolves signatures of selection and tetrasomic recombination in peanut. Mol Plant. 2017;10:309–22.
Leal-Bertioli S, Shirasawa K, Abernathy B, Moretzsohn M, Chavarro C, Clevenger J, et al. Tetrasomic recombination is surprisingly frequent in allotetraploid Arachis. Genetics. 2015;199:1093–105.
Leal-Bertioli SCM, Godoy IJ, Santos JF, Doyle JJ, Guimarães PM, Abernathy BLJ, et al. Segmental allopolyploidy in action: increasing diversity through polyploid hybridization and homoeologous recombination. Am J Bot. 2018;105:1053–66.
Nguepjop JR, Tossim HA, Bell JM, Rami JF, Sharma S, Courtois B, et al. Evidence of genomic exchanges between homeologous chromosomes in a cross of peanut with newly synthetized allotetraploid hybrids. Front Plant Sci. 2016;7:1635.
Kato S, Sayama T, Fujii K, Yumoto S, Kono Y, Hwang TY, et al. A major and stable QTL associated with seed weight in soybean across multiple environments and genetic backgrounds. Theor Appl Genet. 2014;127:1365–74.
Liu J, Chen J, Zheng X, Wu F, Lin Q, Heng Y, et al. GW5 acts in the brassinosteroid signalling pathway to regulate grain width and weight in rice. Nat Plants. 2017;3:17043.
Wang S, Li S, Liu Q, Zhang J, Wang S, Wang Y, et al. The OsSPL16-GW7 regulatory module determines grain shape and simultaneously improves rice yield and grain quality. Nat Genet. 2015;47:949–54.
Xie FT, Niu Y, Zhang J, Bu SH, Zhang HZ, Geng QC, et al. Fine mapping of quantitative trait loci for seed size traits in soybean. Mol Breed. 2014;34:2165–78.
Hake AA, Shirasawa K, Yadawad A, Sukruth M, Patil M, Nayak SN, et al. Mapping of important taxonomic and productivity traits using genic and non-genic transposable element markers in peanut (Arachis hypogaea L.). PLoS One. 2017;12:e0186113.
Hall MC, Basten CJ, Willis JH. Pleiotropic quantitative trait loci contribute to population divergence in traits associated with life-history variation in Mimulus guttatus. Genetics. 2006;172:1829–44.
Agarwal G, Clevenger J, Pandey MK, Wang H, Shasidhar Y, Chu Y, et al. High-density genetic map using whole-genome resequencing for fine mapping and candidate gene discovery for disease resistance in peanut. Plant Biotechnol J. 2018;16:1954–67.
Huang L, He HY, Chen WG, Ren XP, Chen YN, Zhou XJ, et al. Quantitative trait locus analysis of agronomic and quality-related traits in cultivated peanut (Arachis hypogaea L.). Theor Appl Genet. 2015;128:1103–15.
Kent WJ. BLAT--the BLAST-like alignment tool. Genome Res. 2002;12:656–64.
Sun X, Liu D, Zhang X, Li W, Liu H, Hong W, et al. SLAF-seq: an efficient method of large-scale de novo SNP discovery and genotyping using high-throughput sequencing. PLoS One. 2013;8:e58700.
Zhang J, Zhang Q, Cheng T, Yang W, Pan H, Zhong J, et al. High-density genetic map construction and identification of a locus controlling weeping trait in an ornamental woody plant (Prunus mume Sieb. Et Zucc). DNA Res. 2015;22:183–91.
Liu D, Ma C, Hong W, Huang L, Liu M, Liu H, et al. Construction and analysis of high-density linkage map using high-throughput sequencing data. PLoS One. 2014;9:e98855.
Wu Y, Bhat PR, Close TJ, Lonardi S. Efficient and accurate construction of genetic linkage maps from the minimum spanning tree of a graph. PLoS Genet. 2008;4:e1000212.
Van Os H, Stam P, Visser RG, van Eck HJ. SMOOTH: a statistical method for successful removal of genotyping errors from high-density genetic linkage data. Theor Appl Genet. 2005;112:187–94.
Huang X, Zhao Y, Wei X, Li C, Wang A, Zhao Q, et al. Genome-wide association study of flowering time and grain yield traits in a worldwide collection of rice germplasm. Nat Genet. 2012;44:32–9.
Kosambi DD. The estimation of map distances from recombination values. Ann Eugenics. 1994;12:172–5.
Broman KW, Wu H, Sen S, Churchill GA. R/qtl: QTL mapping in experimental crosses. Bioinformatics. 2003;19:889–90.
Ashburner M, Ball CA, Blake JA, Botstein D, Butler H, Cherry JM, et al. Gene ontology: tool for the unification of biology. Nat Genet. 2000;25:25–9.
Acknowledgements
The authors express heartfelt gratitude to Dr. Peggy Ozias-Akins for technical advice and language improvement and the experimental station stuffs for their help with field management.
Funding
Financial support was provided by the Visiting Scholar Project of Shandong Academy of Agricultural Sciences; the Breeding Project from Department Science & Technology of Shandong Province (2017LNZ033, 2017LZGC003); the Achievements Programs of Shandong Academy of Agricultural Sciences (2015CGPY03); the Agricultural Scientific and the Technological Innovation Project of Shandong Academy of Agricultural Sciences (CXGC2016B02, CXGC2018E21); Qingdao People’s Livelihood Science and the Technology Project(19–6–1-61-nsh). The funding bodies had no role in study design, data collection, analysis and interpretation, decision to public, or writing of the manuscript.
Author information
Authors and Affiliations
Contributions
JC and SZ conceived the study, designed the experiments and finished the final version of the manuscript. SZ, XH and HM established the RIL population, analyzed the data, conducted QTL mapping and drafted the manuscript. YC, CW and YS revised the manuscript and provided advice on experimental implementation. FC, WY, TX and JZ participated in phenotypic data collection and prepared the genomic DNA for SLAF sequencing. LZ conducted the SSR genotyping. All the authors read and approved the final manuscript.
Corresponding author
Ethics declarations
Ethics approval and consent to participate
Not applicable.
Consent for publication
Not applicable.
Competing interests
The authors declare that they have no competing interests.
Additional information
Publisher’s Note
Springer Nature remains neutral with regard to jurisdictional claims in published maps and institutional affiliations.
Supplementary information
Additional file 1: Table S1
Phenotypic datasets of four seed traits in four environments. Table S2 Primer sequences of SSRs used in the present HDGM construction. Table S3 Genotyping of the RIL lines by SLAF and SSR markers. Table S4 Genetic positions of SLAF and SSR markers used for HDGM construction (XLS 10089 kb)
Additional file 2: Table S5
SLAF-seq data of the parents and RIL population, Table S6 Summary of SLAF and SNP markers in parents and RIL population, Figure S1 Number of SNPs for different segregation pattern, Figure S2 Colinearity analysis of each linkage group with the Tifrunner reference genome, Figure S3 Comparison of protein sequences between the candidate genes and homologs in Arabidopsis. (XLS 402 kb)
Additional file 3: Table S7
Gene content within the QTL region I. Table S8 Gene content within the QTL region II. Table S9 SNPs loacted in two stable and pleiotropic QTL regions (XLS 402 kb)
Rights and permissions
Open Access This article is distributed under the terms of the Creative Commons Attribution 4.0 International License (http://creativecommons.org/licenses/by/4.0/), which permits unrestricted use, distribution, and reproduction in any medium, provided you give appropriate credit to the original author(s) and the source, provide a link to the Creative Commons license, and indicate if changes were made. The Creative Commons Public Domain Dedication waiver (http://creativecommons.org/publicdomain/zero/1.0/) applies to the data made available in this article, unless otherwise stated.
About this article

Cite this article
Zhang, S., Hu, X., Miao, H. et al. QTL identification for seed weight and size based on a high-density SLAF-seq genetic map in peanut (Arachis hypogaea L.). BMC Plant Biol 19, 537 (2019). https://doi.org/10.1186/s12870-019-2164-5
Received:
Accepted:
Published:
DOI: https://doi.org/10.1186/s12870-019-2164-5