
Abstract
Background
Trees of the genus Taxus are highly valuable medicinal plants with multiple pharmacological effects on various cancer treatments. Paclitaxel from Taxus trees is an efficient and widely used anticancer drug, however, the accumulation of taxoids and other active ingredients can vary greatly among Taxus species. In our study, the metabolomes of three Taxus species have been investigated.
Results
A total of 2246 metabolites assigned to various primary and secondary metabolic pathways were identified using an untargeted approach. Analysis of differentially accumulated metabolites identified 358 T. media-, 220 T. cuspidata-, and 169 T. mairei-specific accumulated metabolites, respectively. By searching the metabolite pool, 7 MEP pathway precursors, 11 intermediates, side chain products and derivatives of paclitaxel, and paclitaxel itself were detected. Most precursors, initiated intermediates were highly accumulated in T. mairei, and most intermediate products approaching the end point of taxol biosynthesis pathway were primarily accumulated in T. cuspidata and T. media. Our data suggested that there were higher-efficiency pathways to paclitaxel in T. cuspidata and T. media compared with in T. mairei. As an important class of active ingredients in Taxus trees, a majority of flavonoids were predominantly accumulated in T. mairei rather than T. media and T. cuspidata. The variations in several selected taxoids and flavonoids were confirmed using a targeted approach.
Conclusions
Systematic correlativity analysis identifies a number of metabolites associated with paclitaxel biosynthesis, suggesting a potential negative correlation between flavonoid metabolism and taxoid accumulation. Investigation of the variations in taxoids and other active ingredients will provide us with a deeper understanding of the interspecific differential accumulation of taxoids and an opportunity to accelerate the highest-yielding species breeding and resource utilization.
Background
Taxol (generic name paclitaxel) is the major bioactive component of the Taxus species widely used in the treatment of various cancers, such as ovarian cancer, breast cancer and squamous cancers [1]. Since its approval for ovarian cancer treatment in 1992, the demand for paclitaxel and its derivatives has increased [2]. Several barriers, including low content of taxoids, exhausted natural resources and high loss rate of purification, limited the increasing of paclitaxel supply. Therefore, extraction of its analogues and/or derivative is an alternative economic solution for the production of paclitaxel at an industrial level [3].
Production of paclitaxel and other taxoids is improved by increasing knowledge of the paclitaxel biosynthetic pathway, thus the pathway becoming the principal object of many studies [4, 5]. The whole paclitaxel biosynthetic pathway produces a large number of precursors, intermediates and derivatives of paclitaxel [6, 7]. Firstly, the precursor of the diterpenoid taxane core geranylgeranyl diphosphate (GGPP) is synthesized using three units of the C5 isoprenoid precursors isopentenyl diphosphate (IPP) and one unit of dimethylallyl diphosphate (DMAPP), which are supplied by the plastidial 2-C-methyl-D-erythritol phosphate (MEP) pathway [8, 9]. The key enzyme taxadiene synthase (TS) catalyzes GGPP to yield the taxane skeleton taxa-4(5),11(12)-diene [10, 11]. Then, a series of hydroxylation, acetylation and N-benzoylation of taxane skeleton produce a number of intermediates in the pathway towards paclitaxel. For example, acetylation of 10-deacetylbaccatin-III (10-DAB) produces baccatin III, an advanced intermediate for paclitaxel biosynthesis [2, 12]. The assembly of C13-side chain appended to baccatin III (BAC) to form N-debenzoyl-2′-deoxytaxol is considered as the final step of the paclitaxel biosynthesis pathway [13].
In addition to paclitaxel, more than 500 taxoid secondary metabolites are contained in different species of the genus Taxus [14,15,16]. For example, paclitaxel and three related taxoids, 10-DAB III, BAC, and cephalomannine, were extracted from the needles of Taxus cuspidata, Taxus chinensis, and Taxus media [17]. In Taxus mairei, most known taxoids were also determined by high-performance liquid chromatography-tandem mass spectrometry (HPLC-MS/MS) [18]. Additionally, three new taxoids, along with three known taxoids, were isolated from the seeds of T. cuspidata [19]. All Taxus species produce paclitaxel; however, the level of accumulated taxoids can vary significantly [20]. A large-scale analysis of the taxoid concentrations revealed that no single species contained the highest levels of all the metabolites [21].
An untargeted metabolome provides a good opportunity to systematically analyze primary and secondary metabolites, as well as to identify potential unknown compounds in plants [22]. In the Taxus genus, the first metabolomic analysis was published in 2003, profiling the metabolites of T. media cultures induced by a MeJA treatment [23]. A metabolomic approach with LC-IT-TOF-MS was used to investigate the variations in taxoid biosynthesis in cultured seedlings of T. mairei [24]. Recently, an integrated proteomic/metabolomic approach revealed that a short-term high dose of ultraviolet-A radiation could increase paclitaxel production in T. mairei [25].
Recent technical advances in the large-scale identification of metabolites have revealed the complex processes involved in regulating plant metabolism [26, 27]. So far, in the Taxus genus, 14 species and cultivars with varied levels of taxoids have been identified [28, 29]. Investigation of the variations in taxoids and other metabolites will provide us an opportunity to accelerate the highest-yielding species breeding.
Results
Untargeted metabolite profiling the metabolomes of different Taxus species
To explore the comprehensive variations in metabolomes of different Taxus species, an untargeted approach (15 repeats for each group) was applied, identifying 2246 metabolites from 8712 ions with a relative standard deviation < 30% (Additional file 1). Similar to the differences in twig morphology, variations in the metabolomes among different Taxus species were also observed (Fig. 1a). For quality checking, total ion chromatograms were generated, suggesting that the sample preparation met the common standards (Additional file 2). To produce an overview of the metabolic variations, a PCA was performed, and the percentages of explained value in the metabolome analysis of PC1 and PC2 were 25.01 and 31.24%, respectively. The PCA data showed three clearly separated sample groups, indicating separations among the three different species (Fig. 1b). Based on their KEGG annotations, 747 metabolites were predicted to be involved in various primary metabolic pathways, including the amino acid-, carbohydrate-, cofactor and vitamin-, energy-, lipid-, nucleotide-, secondary metabolite-, and terpenoid-related pathways (Fig. 1c and Additional file 3).

Untargeted metabolite profiling identifies the metabolites in the tested Taxus trees. a A picture of T. media, T. mairei and T. cuspidata under greenhouse condition. Fresh twigs were harvested from three cultivated Taxus species. b The PCA data of the samples from three different species. The red spots indicated the samples from T. cuspidata; the green spots indicated the samples from T. media; and the blue spots indicated the samples from T. mairei. c A heatmap of the metabolites grouped by Kyoto Encyclopedia of Genes and Genomes pathway found in the metabolomes of the three Taxus species (n = 15). The heatmap scale ranges from − 4 to + 4 on a log2 scale
Clustering of differential accumulated metabolites
All annotated metabolites were clustered to identify the differential accumulated metabolites (DAMs) among three Taxus species (Fig. 2a). All DAMs were grouped into three Clusters: I, II and III. The T. media predominantly accumulated metabolites were grouped into Cluster I (358 metabolites), the T. cuspidata predominantly accumulated metabolites were grouped into Cluster II (220 metabolites), and the T. mairei predominantly accumulated metabolites were grouped into Cluster III (169 metabolites) (Fig. 2b). Our data showed that the DAMs belonging to the ‘secondary metabolites’, ‘lipids’, ‘cofactors and vitamins’, ‘carbohydrate’ and ‘amino acid’ categories were predominantly accumulated in T. media (Fig. 2c). The Cluster I (T. media predominantly accumulated) consisted of 117 secondary metabolites, 91 amino acids, 51 cofactors and vitamins, 48 carbohydrates, 32 lipids, 17 nucleotides and 2 energy-related metabolites; the Cluster II consisted of 80 secondary metabolites, 53 amino acids, 25 cofactors and vitamins, 23 carbohydrates, 18 lipids, 19 nucleotides and 2 energy-related metabolites; and the Cluster III consisted of 71 secondary metabolites, 32 amino acids, 30 cofactors and vitamins, 13 carbohydrates, 11 lipids, 10 nucleotides and 2 energy-related metabolites (Fig. 2c).

The variations in the metabolites among three Taxus species. a A heatmap of the relative amounts of DAMs from the three different species. b Clustering of the DAMs into three Clusters. Red cycles indicated the species specific accumulated metabolites. c These DAMs were also assigned into various primary metabolic categories
To get a comprehensive overview of variations, all DAMs were classified into different known metabolic pathways. In total, 32, 29, and 38 major pathways were enriched in the T. mairei vs T. cuspidata (Additional file 4), T. media vs T. mairei (Additional file 5), and T. media vs T. cuspidata (Additional file 6) comparisons. Interestingly, the largest number of DAMs in each comparison were enriched in the ‘diterpenoid biosynthesis’ pathway.
Variations in the abundance levels of taxoids among three Taxus species
Paclitaxel biosynthesis is an intricate metabolic pathway that involves a number of precursors, intermediates, and derivatives [5, 30]. By searching the metabolite pool, seven precursors from the MEP pathway, nine intermediates and derivatives, two side chain products, and paclitaxel were detected (Fig. 3a). For the MEP pathway, several precursors, such as D-glyceraldehyde 3-phosphate, 1-deoxy-D-xylulose 5-phosphate, and 2-C-methyl-D-erythritol 4-phosphate, were predominantly accumulated in T. mairei. Two precursors, 4-hydroxy-3-methyl-but-2-enyl diphosphate and 2-C-methyl-D-erythritol 2,4-cyclodiphosphate, were significantly accumulated in T. cuspidata. For the intermediate and derivative products, GGPP, Taxa-4(20),11(12)-dien-5α-ol, and Taxa-4(20),11(12)-dien-5α,13α-diol were predominantly accumulated in T. mairei; Taxa-4(20),11(12)-dien-5α cetoxy-10β ol, 10-Deacetyl-2-debenzoylbaccatin III, 10-Deacetylbaccatin III, and Baccatin III were highest in T. mairei and T. media; and 3′-N-Debenzoyl-2′-deoxytaxol, 3′-N-Debenzoyltaxol, and Paclitaxel were predominantly accumulated in T. cuspidata. For the side chain products, β-Phenylalanine was highly accumulated in T. media and β-Phenylalanoyl baccatin III was greatly accumulated in T. mairei (Fig. 3b). The complete biosynthetic pathway, including the elucidated and putative steps, was summarized in Fig. 4. All the taxane precursors that has been determined in our study were highlighted.

Analysis of the relative amounts of taxoids in the Taxus metabolomes from the three different species. (a) Overview of the taxol biosynthesis pathway. (b) The relative accumulation of taxoids, intermediates and derivatives in the three different species. The heatmap scale ranges from -4 to +4 on a log2 scale

The complete biosynthetic pathway of taxol. The red font indicated the taxane precursors whose structure has been determined in the present study
Variations in the abundance levels of flavonoids among three Taxus species
For flavonoid biosynthesis pathway, five intermediate products synthesized by chalcone synthase (CHS), six intermediate products synthesized by chalcone isomerase (CHI), five intermediate products synthesized by flavanone 3-hydroxylase (F3H), and four intermediate products synthesized by flavonol synthase (FLS) were identified (Fig. 5a). For the CHS-synthesized flavonoids, pinocembrin chalcone was highly accumulated in T. mairei, isoliquiritigenin, butein and homoeriodictyol chalcone were predominantly accumulated in T. media, and naringenin chalcone was greatly accumulated in both T. media and T. cuspidata. For the CHI-synthesized flavonoids, only pinocembrin was highly accumulated in T. mairei, eriodictyol and butin were largely accumulated in both T. media, and naringenin, pinostrobin and dihydrotricetin were predominantly accumulated in both T. media and T. cuspidata. Most of the F3H-synthesized flavonoids were predominantly accumulated in T. media, except for dihydroquercetin. For the FLS-synthesized flavonoids, 5-deoxyleucopelargonidin, deoxyleucocyanidin, and leucopelargonidin were highly accumulated in T. media, and leucocyanidin was greatly accumulated in T. mairei (Fig. 5b).

Analysis of the relative amounts of flavonoid in the Taxus metabolomes from the three different species. (a) Overview of the flavonoid biosynthesis pathway. (b) The accumulation levels of intermediate products synthesized by CHS, CHI, and F3H were showed by heatmaps. The heatmap scale ranges from -4 to +4 on a log2 scale
Confirmation of the variations in paclitaxel and its derivatives using a targeted approach
To determine more precisely the differences in taxoids among the three Taxus species, a targeted approach was used to measure the concentrations of paclitaxel, 10-DAB III, baccatin III, and 10-DAP (Additional file 7). The untargeted metabolomics analysis indicated that T. cuspidata and T. mairei contained the highest and the lowest levels of paclitaxel, respectively. The direct quantification with an authentic paclitaxel standard showed that T. cuspidata, T. media, and T. mairei contained 1.67 mg.g− 1, 1.22 mg.g− 1, and 0.66 mg.g− 1 of paclitaxel, respectively (Fig. 6a). The order of the paclitaxel contents was in good agreement with the untargeted metabolome results. For other taxoids, the highest levels of baccatin III and 10-DAP were accumulated in T. cuspidata (0.65 mg.g− 1 and 0.80 mg.g− 1, respectively), and the highest level of 10-DAB III was detected in T. mairei (0.85 mg.g− 1) (Fig. 6b-d). To assess variability in taxoid level among different species of the genus Taxus, another three Taxus species, including T. chinensis, T. fuana and T. yunnanensis, have been collected. A more exhaustive profile of taxoids in the genus has been showed in Additional file 8.
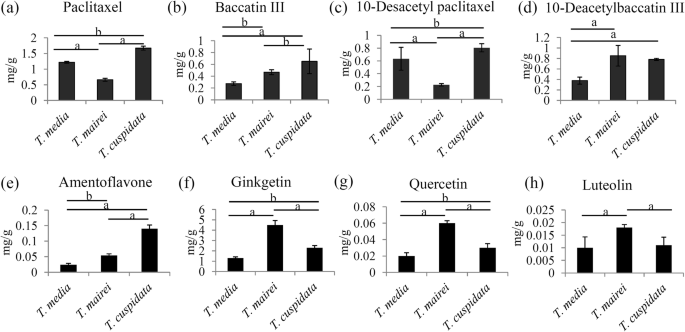
Variation of the contents of several selected taxoids and flavonoids among three different Taxus species. The contents of paclitaxel (a) and three intermediates, including baccatin III (b), 10-DAP (c), and 10-DAB III (d), were quantified by HPLC-MS/MS method. The contents of amentoflavone (e), ginkgetin (f), quercetin (g), and luteolin (h), were quantified by HPLC-MS/MS method. A P value < 0.05 was considered to be statistically significant and indicated by “b” and P < 0.01 was indicated by “a”
Confirmation of the variations in flavonoids using a targeted approach
To determine more precisely the differences in flavonoids among the three Taxus species, a targeted approach was used to measure the concentrations of amentoflavone, ginkgetin, quercetin and luteolin (Additional file 9). Our data showed that amentoflavone highly accumulated in T. cuspidata (0.14 mg.g− 1) and lowly accumulated in T. media (0.024 mg.g− 1) (Fig. 6e). Interestingly, ginkgetin, quercetin and luteolin were greatly accumulated in T. mairei rather than the other two taxus trees (Fig. 6f-h).
Systematic correlativity analysis identifies a number of metabolites associated with key metabolites of paclitaxel biosynthesis
An analysis of metabolite–metabolite interaction networks contributed to the understanding of functional relationships and the identification of new compounds associated with key metabolites of paclitaxel biosynthesis. In our study, an interaction network based on the differentially accumulated metabolites was constructed. Furthermore, the taxoid-related networks were divided into three clusters surrounding paclitaxel, baccatin III, and 10-DAB III (Additional file 10). The interaction networks suggested that nine classes of metabolites, phenylpropanoids, flavonoids, alkaloids, carboxylic acid derivatives, quinones, glycosides, saccharides, steroids and terpenoids, may also contribute to the variations in taxoid accumulation in different species (Fig. 7). However, the mechanisms underlying the interactions of these potential new metabolites need to be investigated.

Analysis of metabolite-metabolite interaction networks. The taxoid-related networks were divided into three clusters surrounding paclitaxel, baccatin III and 10-DAB III, respectively. Nine major classes of metabolites grouped into various dotted circles with different color
Discussion
Because Taxus plants are the major natural resource for paclitaxel, comprehensive phytochemical analyses of Taxus species have been performed [5, 25]. A large number of compounds have been identified in various Taxus species [7, 31]. In addition to taxane diterpenoids, many other compounds, including abietanes, lignans, polyprenols, phenolic compounds, and volatile components, were also identified in the twigs of Taxus plants [32,33,34]. However, the level of metabolite accumulation may vary significantly among species.
In plants, the accumulation of metabolites is a complex and important trait mainly affected by genetic and environmental factors [35, 36]. By identifying specific metabolites, our results suggested that variations, not only in paclitaxel and its derivatives, but also in their precursors, exist in different Taxus species (Fig. 3). The diterpenoid taxane core is derived by three units of IPP and one unit of dimethylallyl diphosphate, which are supplied by the MEP pathway [8]. Interestingly, most precursors for paclitaxel biosynthesis were highly accumulated in T. mairei compared with in T. cuspidata. For examples, three important intermediate products of the MEP pathway, including D-Glyceraldehyde 3P, 1-Deoxy-D-xylulose 5P and 2-C-Methyl-D-erythritol 4P, highly accumulated in T. mairei, ensuring the production of GGPP, which is a key precursor of the diterpenoid taxane core [8]. In our study, GGPP greatly accumulated in T. mairei, suggesting an abundant precursor supply in T. mairei. However, paclitaxel was primarily accumulated in T. cuspidata rather than in T. mairei. This suggested that the efficiency of paclitaxel synthesis using MEP pathway precursors in T. cuspidata may be extremely high.
The cyclization of the GGPP to taxa-4(5),11(12)-dien is an essential oxidation step on the taxane core [37]. Though taxa-4(5),11(12)-dien has not been detected, its hydroxylated products, taxa-4(20),11(12)-dien-5α-ol and taxa-4(20),11(12)-dien-5α,13α-diol, were identified and showed similar accumulation pattern to GGPP. In the taxol biosynthesis pathway, 10-DAB, a downstream product of taxa-4(20),11(12)-dien-5α-ol, is converted to baccatin III by 10-deacetylbaccatin III-10-O-acetyltransferase [12]. Moreover, CoA-dependent acyl transfers occur on the taxane core, yielding several acetylated intermediates, such as 10-deacetyl-2-debenzoylbaccatin III [38]. Interestingly, these acetylated products, taxa-4(20),11(12)-dien-5α-yl acetate, 10-deacetyl-2-debenzoylbaccatin III, 10-DAB and baccatin III, highly accumulated in T. cuspidata and T. media. Then, the attachment of β-phenylalanine to the C13-O-position of baccatin III to yield 3′-N-debenzoyl-2′-deoxytaxol and 3′-N-debenzoyltaxol, which are the direct upstream metabolites for taxol biosynthesis [39]. In our study, 3′-N-debenzoyl-2′-deoxytaxol and 3′-N-debenzoyltaxol highly accumulated in T. cuspidata. Most intermediate products approaching the end point of taxol biosynthesis pathway were primarily accumulated in T. cuspidata, suggesting there were higher-efficiency pathways to paclitaxel in T. cuspidata and T. media compared with in T. mairei.
Multiple anastomosing routes involved in the paclitaxel biosynthesis pathway produce numerous taxoid derivatives [5]. An approach to shutting down the major diversionary routes, such as the routes leading to 14β-hydroxy taxoids, and C9- and C13-acetate derivatives, could elevate paclitaxel yields [40, 41].
In addition to taxoids, flavonoids, phenylpropanoids, and phenolic compounds have been isolated in Taxus species [16, 31, 42, 43]. In our study, the metabolite–metabolite interaction network revealed 222 taxoid-associated metabolites, belonging to 10 major categories. In total, 21 flavonoids, including 3 baccatin III-related metabolites and 18 paclitaxel-related metabolites, were identified in the interaction network. Interestingly, the majority of the flavonoids were negatively correlated with baccatin III and paclitaxel (Additional file 10: Table S3), which was in accord with data from our metabolomes. A previous work showed that total flavonoids, ginkgetin, and quercetin were highly accumulated in T. mairei and that paclitaxel was highly accumulated in T. media [31]. Under ultrasound and salicylic acid treatments, paclitaxel biosynthesis improved and the flavonoid content significantly decreased [44]. These data suggested a negative correlation between paclitaxel biosynthesis and flavonoid metabolism.
A number of transcription factors (TFs) have been reported to be involved in the transcriptional regulation of taxol biosynthesis- and flavonoid biosynthesis-related genes [45, 46]. In plants, basic helix-loop-helix (bHLH) TFs were considered to be involved in flavonoids biosynthesis [47]. For example, DvIVS, a bHLH TF in dahlia, activates the flavonoid synthesis by regulating the expression of chalcone synthase 1, flavanone 3-hydroxylase, dihydroflavonol 4-reductase, anthocyanidin synthase [48]. In Taxus plants, three bHLH TFs, TcJAMYC1, TcJAMYC2 and TcJAMYC4, negatively regulate the expression of paclitaxel biosynthetic genes [49]. The opposite effects of bHLH TFs in regulations of flavonoid and taxol biosynthesis might give an explanation of negative correlation between paclitaxel biosynthesis and flavonoid accumulations. However, whether flavonoids were associated with paclitaxel biosynthesis needs to be addressed in the future.
In addition to the metabolites involved in the MEP pathway, 18 paclitaxel biosynthesis-associated terpenoids were identified. Inversion and homeostasis among terpenoids may play important roles in the precursor supply required for paclitaxel biosynthesis [8]. Because of the complexity of paclitaxel biosynthesis, more studies are needed to reveal the roles of the other identified metabolites.
Conclusions
In our study, metabolic profiles reveal that the levels of metabolite accumulation may vary siginificantly among species. A large number of potential metabolites associated with paclitaxel biosynthesis were identified. Our results contribute to a deeper understanding of the interspecific differential accumulation of taxoids in three Taxus species.
Methods
Plant materials
Fresh twig samples were harvested from three-year-old cultivated Taxus trees, including T. media, T. mairei, and T. cuspidata, in March 2015 grown in a greenhouse of Hangzhou Normal University, Hangzhou, China. The growth conditions were set at 25 ± 1 °C with a light/dark cycle of 12/12 h and a 60–70% relative humidity.
Metabolite extraction
For metabolite extraction, fresh twig samples from different Taxus species (25 mg each, n = 15) were transferred to 1.5-mL Eppendorf tubes, and 800 μL pre-cooled methanol/water (1:1, v/v) was added to the tube with two steel balls. All of the tubes were placed into a pre-cooled 48-well tube holder and ground using the 2010 Geno/Grinder (SPEX SamplePrep, Metuchen, NJ, USA) for 2 min at a rate of 1900 strokes/min. The homogenized samples were extracted in 0.5-mL of the pre-cooled chloroform/methanol/water (v:v:v, 1:3:1) extraction solvent by vortexing for 15 min at 4 °C in the dark and then ultrasonication for 5 min on ice. The samples were centrifuged at 13,000 g for 15 min at 4 °C, and 550 μL of the supernatants were collected. The extracts were vacuum-dried and resuspended in a 50% methanol solution. The prepared extracts were then loaded onto the auto-sampler of the 2777C ultra-performance liquid chromatography (UPLC) system (Waters, Herts, UK) at 4 °C.
Untargeted metabolomic analysis
All of the samples were analyzed using the HPLC-MS/MS system. Firstly, the separation was achieved on a 100 × 2.1 mm, 1.7-μm particle size Waters ACQUITY UPLC BEH C18 column using an UPLC system (Waters, Herts, UK). The column oven was maintained at 50 °C, and the flow rate was set at 0.4 mL/min. The mobile phase consisted of solvent A (water with 0.1% formic acid) and solvent B (acetonitrile with 0.1% formic acid). Gradient elution conditions were set as follows: 100% phase A, 0–2 min; 0 to 100% phase B, 2–11 min; 100% phase B, 11–13 min; 0 to 100% phase A, 13–15 min. The injection volume for each sample was 10 μL.
A high resolution MS/MS Waters Xevo G2-XS Q-TOF (Waters, Herts, UK) was used to detect metabolites eluted from the column. The Q-TOF system was operated in both positive and negative ion modes. For the positive ion mode, the capillary and sampling cone voltages were set at 3 kV and 40 V, respectively. For the negative ion mode, the capillary and sampling cone voltages were set at 1 kV and 40 V, respectively. The MS data were acquired in centroid MSE mode. The mass range was from 50 to 1200 Da, and the scan time was 0.2 s. For the MS/MS detection, all of the precursors were fragmented using 20–40 eV, and the scan time was 0.2 s. During the acquisition, the LE signal was acquired every 3 s to calibrate the mass accuracy. To evaluate the stability of the UPLC-MS/MS system over the whole detection process, a quality control sample, which was prepared by mixing an equal volume of each experimental sample, was acquired after every 10 samples.
Bioinformatics of the untargeted metabolomic dataset
Raw data of UPLC-MS/MS were processed using the following procedures. For each sample, a matrix of molecular features, such as retention time and mass-to-charge ratio (m/z), was generated using the XCMS software with default parameters [50]. The data were normalized to the total ion current, and the relative quantity of each feature was calculated using the mean area of the chromatographic peaks from three replicate injections. The quantities of metabolites were generated using an algorithm that clustered masses into spectra based on co-variation and co-elution in the dataset. The online Kyoto Encyclopedia of Genes and Genomes (KEGG) and HMDB database was used to annotate the metabolites by matching the exact molecular mass data (m/z). If a mass difference between observed and the database value was less than 10 ppm, the metabolite would be annotated and the molecular formula of metabolites would further be identified and validated by the isotopic distribution measurements. We also used a in-house fragment spectrum library of metabolites to validate the metabolite identification. The intensity of peak data was further processed by an in-house software MetaX. For quality control, the identifications of precursor ions of the expected positive ion adduct with less than a 5 ppm error were defined using high-resolution MS. The raw data were uploaded as Additional file 11 and Additional file 12.
K-means cluster
ClusGap R function-cluster package (v.2.0.5) was used to determine the optimal number of clusters. Subsequently, K-means clustering with default algorithm was used to get clusters using the scaled normalized relative metabolite data on a log2 scale for each accumulated metabolite. The results of clustering were displayed using MeV program.
Analysis of targeted metabolites
Fresh twigs of each sample were collected from three Taxus species, dried at 40 °C for 3 d, and powdered. A modified version of a previously published method was used to prepare crude extracts [51]. In brief, 2.0 g powder of each sample was mixed with 30 mL of 100% methanol, and the mixture was subjected to ultrasonication for 60 min. After centrifugation at 5000 g for 5 min, the supernatant was filtered through 0.22-μm membrane filters and transferred to a new tube.
The quantifications of four targeted taxoids, paclitaxel, BAC, 10-DAB III, and 10-Desacetyl paclitaxel (10-DAP), were performed using HPLC-MS/MS analyses. Paclitaxel (≥ 99%; CAS No. 33069–62-4), baccatin III (≥ 99%; CAS No. 27548–93-2), and 10-DAB III (≥ 98%; CAS No. 32981–86-5) were purchased from Aladdin Biochemical Technology (Shanghai, China). 10-DAP (98%; CAS No. 78432–77-6) was obtained from the Jiangsu Yew Pharmaceutical Co., Ltd. (Jiangsu, China).
Taxoids were detected using a Thermo Dionex UltiMate 3000 series HPLC system equipped with a Finnigan TSQ Quantum Discovery triple quadrupole MS (Thermo Fisher Scientific, Waltham, MA, USA). The separation of the above four compounds was carried out on a Phenomenex Kinetex C18 column (100 × 4.6 mm, 2.6-μm particle size; Phenomenex, Torrance, CA, USA). The mobile phase consisted of 35% of solvent A (2 mM ammonium formate and 0.1% formic acid aqueous solution) and 65% of solvent B (100% methanol). The flow rate was 0.2 mL/min, the temperature of column oven was 30 °C, and the injection volume was 5 μL. Other detailed parameters of the HPLC-MS/MS analysis were as follows: the capillary temperature was 270 °C; the ion spray voltage was 3000 V; the auxiliary gas and sheath gas was N2; and the collision gas was high purity argon. Additionally, the positive electrospray ionization mode was employed and multiple-reaction monitoring was applied for the determination. The transition of m/z 567.2 → 445.3 was used for 10-DAB III quantification, and the transitions of m/z 567.2 → 385.2 and 567.2 → 427.3 were utilized for confirmation. The transitions of m/z 829.4 → 286.1 and 829.4 → 122.0 were measured for baccatin III quantification and confirmation, respectively. The transition of m/z 876.4 → 308.1 was chosen for paclitaxel quantification, and the transitions of m/z 876.4 → 531.2 and 876.4 → 591.4 were utilized for confirmation. The transition of m/z 834.4 → 308.2 was used for 10-Desacetyl paclitaxel quantification. Data was acquired and processed using the Xcalibur 2.2 software (Thermo Scientific, Waltham, MA, USA).
The separation and determination of eight flavonoids, including quercetin, luteolin, kaempferol, amentoflavone and ginkgetin, were performed according to the same UPLC-MS/MS method described in our paper [51].
Systematic correlativity analysis and statistical analysis
For the untargeted metabolome analyses, Pearson’s and Spearman’s correlations, a one-way analysis of variance (ANOVA), and hierarchical clustering were conducted. P values of the ANOVA were adjusted for the false discovery rate. A principal component analysis (PCA) of the metabolites was performed on the data that was mean-centered with the Pareto-scaling method using SIMCA v14.0 (Umetrics, Umea, Sweden).
The quantification results of targeted metabolites are presented as the means of at least three replicates ± standard error. Statistical analyses were performed using SPSS software version 19.0 (SPSS Inc., Chicago, IL, USA), and an ANOVA was applied to compare taxoid content differences. A P value < 0.05 was considered to be statistically significant.
Availability of data and materials
All the datasets generated and analysed during the current study were uploaded as with the manuscript as additional files.
Abbreviations
- 10-DAB III:
-
10-deacetylbaccatin III
- 10-DAB:
-
10-deacetylbaccatin-III
- ANOVA:
-
Analysis of variance
- DAM:
-
Differential accumulated metabolite
- DMAPP:
-
Dimethylallyl diphosphate
- GGPP:
-
Geranylgeranyl diphosphate
- HPLC-MS/MS:
-
high-performance liquid chromatography-tandem mass spectrometry
- IPP:
-
Isopentenyl diphosphate
- JA:
-
Jasmonic acid
- MEP:
-
2-C-methyl-D-erythritol phosphate
- PCA:
-
Principal component analysis
- TS:
-
Taxadiene synthase
References
Liu WC, Gong T, Zhu P. ChemInform abstract: advances in exploring alternative Taxol sources. RSC Adv. 2016;6(54):48800–9.
Thornburg CK, Walter T, Walker KD. Biocatalysis of a paclitaxel analogue: conversion of baccatin III to N-debenzoyl-N-(2-furoyl)paclitaxel and characterization of an amino phenylpropanoyl CoA transferase. Biochemistry. 2017;56(44):5920–30.
Onrubia M, Moyano E, Bonfill M, Palazon J, Goossens A, Cusido RM. The relationship between TXS, DBAT, BAPT and DBTNBT gene expression and taxane production during the development of Taxus baccata plantlets. Plant Sci. 2011;181(3):282–7.
Guerra-Bubb J, Croteau R, Williams RM. The early stages of taxol biosynthesis: an interim report on the synthesis and identification of early pathway metabolites. Nat Prod Rep. 2012;29(6):683–96.
Croteau R, Ketchum RE, Long RM, Kaspera R, Wildung MR. Taxol biosynthesis and molecular genetics. Phytochem Rev. 2006;5(1):75–97.
Ketchum RE, Horiguchi T, Qiu D, Williams RM, Croteau RB. Administering cultured Taxus cells with early precursors reveals bifurcations in the taxoid biosynthetic pathway. Phytochemistry. 2007;68(3):335–41.
Li C, Huo C, Zhang M, Shi Q. Chemistry of Chinese yew, Taxus chinensis var. mairei. Biochem Systematics Ecol. 2008;36(4):266–82.
Eisenreich W, Menhard B, Hylands PJ, Zenk MH, Bacher A. Studies on the biosynthesis of taxol: the taxane carbon skeleton is not of mevalonoid origin. Proc Natl Acad Sci U S A. 1996;93(13):6431–6.
Vranova E, Coman D, Gruissem W. Network analysis of the MVA and MEP pathways for isoprenoid synthesis. Annu Rev Plant Biol. 2013;64:665–700.
Harrison JW, Scrowston RM, Lythgoe B, Harrison JW, Scrowston RM, Lythgoe B. Taxine. Part IV. The constitution of taxine-I. J Chem Soc C Org. 1966:1933–45.
Williams DC, Wildung MR, Jin AQ, Dalal D, Oliver JS, Coates RM, et al. Heterologous expression and characterization of a “Pseudomature” form of taxadiene synthase involved in paclitaxel (Taxol) biosynthesis and evaluation of a potential intermediate and inhibitors of the multistep Diterpene cyclization reaction. Arch Biochem Biophys. 2000;379(1):137–46.
Lee YH, Lee YR, Park CS, Im SA, Song S, Hong JT, et al. Baccatin III, a precursor for the semisynthesis of paclitaxel, inhibits the accumulation and suppressive activity of myeloid-derived suppressor cells in tumor-bearing mice. Int Immunopharmacol. 2014;21(2):487–93.
Jiménez-Barbero J, Amat-Guerri F, Snyder JP. The solid state, solution and tubulin-bound conformations of agents that promote microtubule stabilization. Curr Med Chem Anticancer Agents. 2002;2(1):91–122.
Wang YF, Shi QW, Dong M, Kiyota H, Gu YC, Cong B. Natural taxanes: developments since 1828. Chem Rev. 2011;111(12):7652–709.
Shi Q, Oritani T, Sugiyama T, Murakami R, Wei H. Six new taxane diterpenoids from the seeds of Taxus chinensis var. mairei and Taxus yunnanensis. J Nat Prod. 1999;62(8):1114–8.
Yang L, Zheng ZS, Cheng F, Ruan X, Jiang DA, Pan CD, et al. Seasonal dynamics of metabolites in needles of Taxus wallichiana var. mairei. Molecules. 2016;21(10):1403.
Zu Y, Fu Y, Li S, Sun R, Li Q, Schwarz G. Rapid separation of four main taxoids in Taxus species by a combined LLP-SPE-HPLC (PAD) procedure. J Sep Sci. 2006;29(9):1237–44.
Li S, Fu Y, Zu Y, Sun R, Wang Y, Zhang L, et al. Determination of paclitaxel and other six taxoids in Taxus species by high-performance liquid chromatography-tandem mass spectrometry. J Pharm Biomed Anal. 2009;49(1):81–9.
Wang LY, Ding LM, Huo SC, Sun L, Sun Z. Three new taxoids from the seed of Taxus cuspidata. J Nat Med. 2013;67(4):827–32.
Itokawa H, Lee KH. Taxus : the genus Taxus: Taylor & Francis; 2003.
Poupat C, Hook I, Gueritte F, Ahond A, Guenard D, Adeline MT, et al. Neutral and basic taxoid contents in the needles of Taxus species. Planta Med. 2000;66(6):580–4.
Lommen A, van der Weg G, van Engelen MC, Bor G, Hoogenboom LA, Nielen MW. An untargeted metabolomics approach to contaminant analysis: pinpointing potential unknown compounds. Anal Chim Acta. 2007;584(1):43–9.
Ketchum RE, Rithner CD, Qiu D, Kim YS, Williams RM, Croteau RB. Taxus metabolomics: methyl jasmonate preferentially induces production of taxoids oxygenated at C-13 in Taxus x media cell cultures. Phytochemistry. 2003;62(6):901–9.
Tanaka K, Li F, Morikawa K, Nobukawa T, Kadota S. Analysis of biosynthetic fluctuations of cultured Taxus seedlings using a metabolomic approach. Phytochemistry. 2011;72(14–15):1760–6.
Zheng W, Komatsu S, Zhu W, Zhang L, Li X, Cui L, et al. Response and defense mechanisms of Taxus chinensis leaves under UV-A radiation are revealed using comparative proteomics and metabolomics analyses. Plant & cell physiology. 2016;57(9):1839–53.
Jin J, Zhang H, Zhang J, Liu P, Chen X, Li Z, et al. Integrated transcriptomics and metabolomics analysis to characterize cold stress responses in Nicotiana tabacum. BMC Genomics. 2017;18(1):496.
Xu Q, Zhu J, Zhao S, Hou Y, Li F, Tai Y, et al. Transcriptome profiling using single-molecule direct RNA sequencing approach for in-depth understanding of genes in secondary metabolism pathways of Camellia sinensis. Front Plant Sci. 2017;8:1205.
Hao da C, Huang B, Yang L. Phylogenetic relationships of the genus Taxus inferred from chloroplast intergenic spacer and nuclear coding DNA. Biol Pharm Bull. 2008;31(2):260–5.
van Rozendaal EL, Lelyveld GP, van Beek TA. Screening of the needles of different yew species and cultivars for paclitaxel and related taxoids. Phytochemistry. 2000;53(3):383–9.
Howat S, Park B, Oh IS, Jin YW, Lee EK, Loake GJ. Paclitaxel: biosynthesis, production and future prospects. New Biotechnol. 2014;31(3):242–5.
Hao J, Guo H, Shi X, Wang Y, Wan Q, Song Y, et al. Comparative proteomic analyses of two Taxus species (Taxus × media and Taxus mairei) reveals variations in the metabolisms associated with paclitaxel and other metabolites. Plant Cell Physiol. 2017;114(24):6388.
Shen YC, Chen CY. Taxane diterpenes from Taxus mairei. Planta Med. 1997;63(6):569–70.
Ohtsuki K, Miyai S, Yamaguchi A, Morikawa K, Okano T. Biochemical characterization of novel lignans isolated from the wood of Taxus yunnanensis as effective stimulators for glycogen synthase kinase-3beta and the phosphorylation of basic brain proteins by the kinase in vitro. Biol Pharm Bull. 2012;35(3):385–93.
Yu J, Wang Y, Qian H, Zhao Y, Liu B, Fu C. Polyprenols from the needles of Taxus chinensis var. mairei. Fitoterapia. 2012;83(5):831–7.
Tang W, Hazebroek J, Zhong C, Harp T, Vlahakis C, Baumhover B, et al. Effect of genetics, environment, and phenotype on the metabolome of maize hybrids using GC/MS and LC/MS. J Agric Food Chem. 2017;65(25):5215–25.
Aversano R, Contaldi F, Adelfi MG, D'Amelia V, Diretto G, De Tommasi N, et al. Comparative metabolite and genome analysis of tuber-bearing potato species. Phytochemistry. 2017;137:42–51.
Hefner J, Rubenstein SM, Ketchum RE, Gibson DM, Williams RM, Croteau R. Cytochrome P450-catalyzed hydroxylation of taxa-4(5),11(12)-diene to taxa-4(20),11(12)-dien-5alpha-ol: the first oxygenation step in taxol biosynthesis. Chem Biol. 1996;3(6):479–89.
Nevarez DM, Mengistu YA, Nawarathne IN, Walker KD. An N-aroyltransferase of the BAHD superfamily has broad aroyl CoA specificity in vitro with analogues of N-dearoylpaclitaxel. J Am Chem Soc. 2009;131(16):5994–6002.
Kaspera R, Croteau R. Cytochrome P450 oxygenases of Taxol biosynthesis. Phytochem Rev. 2006;5(2–3):433–44.
Alder JD, Jarvis KP, Marsh KC, Klein LL, Clement JJ. Preclinical in vivo efficacy of two 9-dihydrotaxane analogues against human and murine tumours. Br J Cancer. 1996;73(5):560–4.
Distefano M, Scambia G, Ferlini C, Gaggini C, De Vincenzo R, Riva A, et al. Anti-proliferative activity of a new class of taxanes (14beta-hydroxy-10-deacetylbaccatin III derivatives) on multidrug-resistance-positive human cancer cells. Int J Cancer. 1997;72(5):844–50.
Bulgakov VP, Tchernoded GK, Veselova MV, Fedoreyev SA, Muzarok TI, Zhuravlev YN. Catechin production in cultured cells of Taxus cuspidata and Taxus baccata. Biotechnol Lett. 2011;33(9):1879–83.
Zhang M, Dong Y, Nie L, Lu M, Fu C, Yu L. High-throughput sequencing reveals miRNA effects on the primary and secondary production properties in long-term subcultured Taxus cells. Front Plant Sci. 2015;6:604.
Rezaei A, Ghanati F, Behmanesh M, Mokhtari-Dizaji M. Ultrasound-potentiated salicylic acid-induced physiological effects and production of taxol in hazelnut (Corylus avellana L.) cell culture. Ultrasound Med Biol. 2011;37(11):1938–47.
Kuang X, Sun S, Wei J, Li Y, Sun C. Iso-Seq analysis of the Taxus cuspidata transcriptome reveals the complexity of Taxol biosynthesis. BMC Plant Biol. 2019;19(1):210.
Zhou T, Luo X, Yu C, Zhang C, Zhang L, Song Y-B, et al. Transcriptome analyses provide insights into the expression pattern and sequence similarity of several taxol biosynthesis-related genes in three Taxus species. BMC Plant Biol. 2019;19(1):33.
Zhao L, Gao L, Wang H, Chen X, Wang Y, Yang H, et al. The R2R3-MYB, bHLH, WD40, and related transcription factors in flavonoid biosynthesis. Funct Integr Genomics. 2013;13(1):75–98.
Ohno S, Hosokawa M, Hoshino A, Kitamura Y, Morita Y, Park KI, et al. A bHLH transcription factor, DvIVS, is involved in regulation of anthocyanin synthesis in dahlia (Dahlia variabilis). J Exp Bot. 2011;62(14):5105–16.
Lenka SK, Nims NE, Vongpaseuth K, Boshar RA, Roberts SC, Walker EL. Jasmonate-responsive expression of paclitaxel biosynthesis genes in Taxus cuspidata cultured cells is negatively regulated by the bHLH transcription factors TcJAMYC1, TcJAMYC2, and TcJAMYC4. Front Plant Sci. 2015;6:115.
Smith CA, Want EJ, O'Maille G, Abagyan R, Siuzdak G. XCMS: processing mass spectrometry data for metabolite profiling using nonlinear peak alignment, matching, and identification. Anal Chem. 2006;78(3):779–87.
Yu C, Guo H, Zhang Y, Song Y, Pi E, Yu C, et al. Identification of potential genes that contributed to the variation in the taxoid contents between two Taxus species (Taxus media and Taxus mairei). Tree Physiol. 2017;37(12):1659–71.
Acknowledgements
We are also grateful to LC Sciences company (Hangzhou, China) for technical support. We are grateful to Kaidong Liu (Life Science and Technology School, Lingnan Normal University) for reading this manuscript.
Funding
Our work was funded by the Zhejiang Provincial Natural Science Foundation of China under Grant No. LY19C160001, LY19C200010 and LY17C020004; the National Science Foundation of China (31970286 and 31301053); Open Foundation of State Key Laboratory of Subtropical Silviculture, Zhejiang A & F University (KF201708); the Hangzhou Science and Technology Bureau (20170432B01). There is no role of the funding body in the design of the study and collection, analysis, and interpretation of data and in writing the manuscript.
Author information
Authors and Affiliations
Contributions
CS, EP and BZ made substantial contributions to conception, was involved in drafting the manuscript, and given final approval of the version to be published. TZ, XL, CZ, EP and XX made substantial contributions to acquisition of data analysis, was involved in revising the manuscript, and given final approval of the version to be published. CY, ZJ, LZ and HY made substantial contributions to analysis and interpretation of data, was involved in revising the manuscript, and given final approval of the version to be published. All authors have read and approved the manuscript, and ensure that this is the case.
Corresponding authors
Ethics declarations
Ethics approval and consent to participate
This project uses plant materials and does not utilize transgenic technology. The authorities responsible for the Taxus resources are the Mount Changbai National Nature Reserve, who provided permission to collect the samples of T. cuspidata, the Mount Tianmu National Nature Reserve, who provided permission to collect the samples of T. mairei and T. chinensis, and Motuo National Nature Reserve, who provided permission to collect the samples of T. fuana and T. yunnanensis, for our scientific research. T. media is cultivated variety purchased from the Wuwangnong company (Chengdu, China), who provided permission to use the seedlings for our scientific research.
Consent for publication
Not applicable.
Competing interests
The authors declare that they have no competing interests.
Additional information
Publisher’s Note
Springer Nature remains neutral with regard to jurisdictional claims in published maps and institutional affiliations.
Supplementary information
Additional file 1: Table S1.
Detail information of 2246 identified metabolites.
Additional file 2: Figure S1.
The total ion chromatograms of all the samples.
Additional file 3: Table S2.
The KEGG annotations of 747 identified metabolites.
Additional file 4: Figure S2.
Identification of DAMs in the T. mairei vs T. cuspidata comparisons. The box indicated the ‘diterpenoid biosynthesis’ pathway.
Additional file 5: Figure S3.
Identification of DAMs in the T. media and T. mairei comparison. The box indicated the ‘diterpenoid biosynthesis’ pathway.
Additional file 6: Figure S4.
Identification of DAMs in the T. media and T. cuspidata comparison. The box indicated the ‘diterpenoid biosynthesis’ pathway.
Additional file 7: Figure S5.
Chromatograms of individual taxoids.
Additional file 8: Figure S6.
A more exhaustive profile of taxoids in the Taxus genus.
Additional file 9: Figure S7.
Chromatograms of individual flavonoids.
Additional file 10: Table S3.
The important information of taxoid-related networks.
Additional file 11:
Dataset 1 Metabolomic input raw data 1.
Additional file 12:
Dataset 2 Metabolomic input raw data 2.
Rights and permissions
Open Access This article is distributed under the terms of the Creative Commons Attribution 4.0 International License (http://creativecommons.org/licenses/by/4.0/), which permits unrestricted use, distribution, and reproduction in any medium, provided you give appropriate credit to the original author(s) and the source, provide a link to the Creative Commons license, and indicate if changes were made. The Creative Commons Public Domain Dedication waiver (http://creativecommons.org/publicdomain/zero/1.0/) applies to the data made available in this article, unless otherwise stated.
About this article

Cite this article
Zhou, T., Luo, X., Zhang, C. et al. Comparative metabolomic analysis reveals the variations in taxoids and flavonoids among three Taxus species. BMC Plant Biol 19, 529 (2019). https://doi.org/10.1186/s12870-019-2146-7
Received:
Accepted:
Published:
DOI: https://doi.org/10.1186/s12870-019-2146-7