
Abstract
Background
Next Generation Sequencing (NGS) experiments produce millions of short sequences that, mapped to a reference genome, provide biological insights at genomic, transcriptomic and epigenomic level. Typically the amount of reads that correctly maps to the reference genome ranges between 70% and 90%, leaving in some cases a consistent fraction of unmapped sequences. This ’misalignment’ can be ascribed to low quality bases or sequence differences between the sample reads and the reference genome. Investigating the source of the unmapped reads is definitely important to better assess the quality of the whole experiment and to check for possible downstream or upstream ’contamination’ from exogenous nucleic acids.
Results
Here we propose DecontaMiner, a tool to unravel the presence of contaminating sequences among the unmapped reads. It uses a subtraction approach to identify bacteria, fungi and viruses genome contamination. DecontaMiner generates several output files to track all the processed reads, and to provide a complete report of their characteristics. The good quality matches on microorganism genomes are counted and compared among samples. DecontaMiner builds an offline HTML page containing summary statistics and plots. The latter are obtained using the state-of-the-art D3 javascript libraries. DecontaMiner has been mainly used to detect contamination in human RNA-Seq data. The software is freely available at http://www-labgtp.na.icar.cnr.it/decontaminer.
Conclusions
DecontaMiner is a tool designed and developed to investigate the presence of contaminating sequences in unmapped NGS data. It can suggest the presence of contaminating organisms in sequenced samples, that might derive either from laboratory contamination or from their biological source, and in both cases can be considered as worthy of further investigation and experimental validation. The novelty of DecontaMiner is mainly represented by its easy integration with the standard procedures of NGS data analysis, while providing a complete, reliable, and automatic pipeline.
Background
Standard NGS data analysis procedures involve a pre-processing step of quality assessment of the reads, followed by the alignment of the filtered ones to a reference genome. The mapped sequences are then investigated to extract the relevant biological information, such as transcripts expression, splicing events, nucleotide or structural variations and enriched regions of specific binding sites. Typically, the amount of reads that correctly maps to the specific reference genome ranges between 70% and 90%, leaving in some cases a consistent fraction of unmapped sequences.
The alignment process usually rejects two classes of reads: those which map several times along the genome (known as multimapped reads) and those which fail to correctly map on the reference. The first case is mostly due to the presence of repetitive elements, whereas the latter can be ascribed either to technical errors of the sequencing experiment, not detected or resolved through the quality assessment step, or to sequence differences between the reads and the reference. Investigating the reasons for this discrepancy may provide relevant information about the source of the so called unmapped reads.
As demonstrated by the literature, is not unusual that genetic material of microorganisms is present in biological samples undergoing sequencing [1–3]. The interest in detecting microorganisms-derived sequences in high-throughput data has grown up together with the knowledge that commensal and pathogenic microbes play an essential role in human health [4], thus fostering the possibility to find new disease-associated pathogens. Indeed, it is well established that the interplay of genetic and environmental factors determines the onset and progression of chronic diseases [5–8]. While the study of the genes and their tight regulation is a topic under constant investigation, the nature of the environmental components, their interaction with the genome and their specific role in physio-pathological mechanisms still represent a challenge of biological research.
Several studies have contributed to the definition of microbial populations in the human body as an important environmental factor, able to regulate the cellular behaviour and to influence the pathological processes [9–12]. These studies mainly focused on the gut microbiome characterisation, for which the regulatory function is very well known. Indeed, diseases as diabetes [13], coeliac disease [14, 15], obesity [16] and colorectal cancer [17] have been associated to the variation of the gut microbiome composition. The advent of high-throughput technologies allowed to understand that also other body sites, always considered sterile, such as lung, stomach and breast, host peculiar indigenous microbial populations [18–20]. Commensal microorganisms mostly show beneficial properties, especially in immune system homeostasis, but in particular conditions or predispositions can represent risk factors and are then defined as ’pathobionts’. The mechanisms by which these microorganisms are responsible for the onset of some chronic diseases are still unknown, although several studies have characterised a tight communication with host cells and identified the induction of DNA damage, chromosome instability and aneuploidy [21].
In literature, there are many shreds of evidence of the presence of contaminating organisms in high throughput sequencing data. The exogenous sequences can derive from the normal or altered tissues microbiome (upstream contamination) or environmental contamination during the samples processing (downstream contamination). Upstream contamination has been reported by several research groups which have used NGS techniques purposely to discover exogenous agents in human tissues samples and cell lines [22–25].
The detection of downstream contamination is equally important, since it can help to check the quality of the working environment and procedures. Strong et al. identified bacterial RNA, belonging to different taxa, in cell line data of different sequencing experiments. Microbial-derived sequences were present in polyA enriched RNA-Seq data and this finding made authors hypothesize that the exogenous reads did not derive from the specimens themselves but from downstream contamination [1]. Indeed, since bacteria are poorly polyadenylated [26], the mRNA enrichment step should remove eventual upstream contamination. Interestingly, laboratory-peculiar contamination has been found by a study which illustrated how various sequencing centres had specific signatures of contaminating genomes as ’time stamps’ [27]. Among the different NGS approaches, chromatin immunoprecipitation experiments (ChIP-Seq) are particularly characterised by a low read mappability, having very often a large portion (20-90%) of unaligned reads. Unmapped ChIP-Seq reads from A. thaliana, Z. mays, H. sapiens, and D. Melanogaster datasets were investigated and found contaminated by foreign sequences. The authors characterised the contaminant organisms and calculated the relative abundance for each dataset by taxonomic classification [28]. Quality assessment of the working environment is crucially important, since sequence-based methods are particularly sensitive to reagents and laboratory contamination. Mycoplasma contamination, which is particularly worth of attention for biologists, was searched in DNA sequences obtained from The Thousand Genome Project [29] and was detected in 7% of samples [30, 31]. Negative control libraries are strongly recommended to check contaminant DNAs in the context of high throughput sequencing, although they have a limited ability to recover low-frequency contaminants [32]. Low-abundance microbes and novel sequences are often hidden by common contaminants of NGS experiments, but their detection and characterization can be pursued by a detailed analysis of the unmapped reads [33]. Besides the contamination within samples, another alarm is represented by the cross-contamination among samples, that can invalidate the whole experimental protocol as well. Ballenghien et al. very recently highlighted the importance of examining NGS datasets for contamination and identifying the most susceptible steps, to propose targeted solutions. They uncovered indirect evidence that the vast majority of cross-contamination events is ascribable to sequencing centres [34].
Several tools, based on different computational approaches, have been developed and used for the detection of pathogens in high-throughput sequencing data. As far as we know, many of the available tools, such as PathSeq [35], SURPI [36] and RNA-COMPASS [37], are primarily aimed to the analysis of metagenomic data. Consequently, their pipelines are not appropriate for the detection of contamination among the unmapped reads. Moreover, they have features that might prevent their easy inclusion in an already established NGS analysis pipeline: PathSeq, for example, requires a commercial computing platform (i.e. Amazon Elastic Compute Cloud, EC2). SURPI aims at detecting microorganisms in complex clinical metagenomic samples, and, to this extent, it uses the entire NCBI nt and/or NCBI nr protein databases in comprehensive mode, requiring up to 2 terabytes of free space for the reference data creation. RNA Compass is specially designed for the simultaneous analysis of transcriptome and metatranscriptome data. It offers automation of analysis and works on the cloud and local servers but it requires a cumbersome installation. Other tools are DeconSeq [38], that works only on longer-read metagenomic datasets (> 150 bp mean read length), or CaPSID [39]. However, in order to reduce the required time and computational efforts, CaPSID works on BAM files provided by the user, who should take care of aligning the sequences both to human and to each pathogen reference genome of interest. Approaches developed to clean the fastq sequences from contaminants often require an a-priori knowledge, as expected in FastQ Screen [40] or contamination_screen [41], where the user must provide the genome of each putative contaminating species. Other tools, such as TruePure [42], have limits on the input size and process only small subsets of a fastq file.
Here we propose DecontaMiner, a tool developed to unravel the presence of contaminating sequences among the reads that fail to map to the reference genome. We described the first DecontaMiner prototype and analyzed the results in a previous work [43]. Here we present a more complete and mature version of the pipeline: the DecontaMiner’s code was completely reorganized in a way that permits to run all the processing steps separately. This is an essential feature, since it lets the user independently tune the parameters on the various analyzed databases as well as filter the results on different thresholds. Moreover, the code has been freely released for the first time and a companion website is provided, that permits an interactive visualization of the results. Unlike the above-cited tools, DecontaMiner has been conceived purposely to provide a method for investigating the possible foreign source of the unmapped reads. It does not require commercial platform or complicated installation, since it exploits several tools that are widely used by the sequencing community. It does not have limits of reads length and performs the alignment to several microorganism databases. It uses a subtraction approach in which the sequences are first filtered accordingly to quality parameters and then sequentially mapped to ribosomal, mitochondrial and foreign organisms databases. Although the experimental protocols provide a rRNA removal step, often this procedure is not sufficient, due to the high number of rRNA copies. The reads that do not map on human genome are then mapped, through a local alignment algorithm (MegaBLAST), to bacteria, fungi and viral genomes. DecontaMiner generates several output files to track all the processed reads, and to provide a complete report of their characteristics. The good quality matches on microorganism genomes are counted and compared among samples. Results are also generated as an offline HTML page, containing interactive plots. Furthermore, DecontaMiner provides an online page where the user can upload the result files and, setting the desired thresholds both on samples and detected contaminants, narrow the search and view the aggregated results in different charts. It is worth noting that, apart from being a tool for examining the source of unmapped reads, DecontaMiner can be also used as a pre-filtering step, i.e. to remove the low quality and non-human reads before the alignment to the reference genome. The strength of DecontaMiner is the flexibility of its use, coupled with a complete, easy to plug-in, and automatic pipeline.
Methods
DecontaMiner has been developed to work on one or more samples, and both on paired- and single-end experiments. The input is a directory containing all the samples to analyze. The tool is composed of two main modules, the first one involving the format conversion, filtering and mapping steps, and the second one performing the extraction and the parsing of the results. The first module automatically and sequentially executes all the steps up to the alignment to the microbial genomes. All the single scripts belonging to this module are provided, allowing the user to run them separately, depending on the needs and data. The second module is composed of two parts, one for the filtering of the BLAST alignment results, and one to collect the information accordingly to user defined settings. The code is written in Perl, with bash scripts to connect and launch the various submodules of the pipeline. A schematic view of the pipeline is shown in Fig. 1.
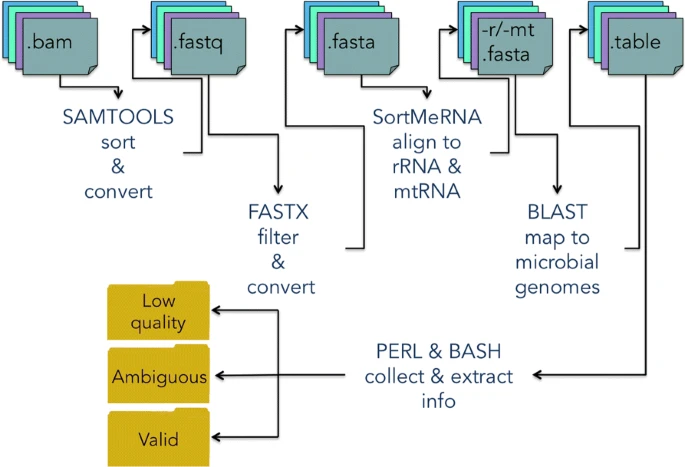
The DecontaMiner pipeline. The tools and the relative functions, input and output file formats are shown. The outputs are grouped in three main directories: ‘Low quality’, ‘Ambiguous’ and ‘Valid’, which collect the result files of each analyzed sample
DecontaMiner has the following dependencies from external tools: Samtools [44], FastX toolkit [45], SortmeRNA [46] and BLAST [47]. These softwares are widely used by the NGS community. The input files are accepted in fastq, fasta and bam formats, and this option determines the starting point of the pipeline. If a bam file is given as input, it is converted first to the fastq format and then to fasta. The quality parameters to retain or discard reads can be set by the user to override default values. The sequences which pass the filtering step are then aligned against the human ribosomal and mitochondrial RNA using SortmeRNA, a software designed to this aim. For DNA sequencing data it is sufficient to omit this step.
The hypothetical non-human sequences can then be mapped to bacteria, fungi and viral genome databases (NCBI nt) using the MegaBLAST algorithm and specifying the alignment length and the number of allowed mismatches/gaps. The BLAST databases have been created downloading the sequences of the complete genomes from the RefSeq repository through the biomartr 0.7.0 R package [48]. The fasta files have then been assembled as blast databases trough the blast command “makeblastdb”. The databases are available for download at the DecontaMiner website. The user can also create its own db and provide it to the tool, simply indicating the absolute path in the configuration file.
The output from the BLAST alignment step is in tabular format and contains all the matches satisfying the alignment criteria. Additionally, the files containing the reads discarded along the overall pipeline are also generated. Hence, low quality, rRNA/mtRNA-mapped, ambiguous and unaligned reads are all stored, to allow users to trace every single unmapped read along the whole process. To execute the second module some thresholds must be specified. In particular, the user must indicate the match count threshold (MCT), i.e. the minimum number of total reads successfully mapped to a single organism to consider it as a contaminant. The default is five, a very low threshold, so that the user can have the whole list of the possibly significant detections. However it is highly recommended to tune this parameter based on the size of the database, and the aim of the performed analyses. The uniqueness of the mapping is evaluated at the genus level, i.e. considering ambiguous two reads perfectly mapping on different genera. The results are extracted and organised both by genus and species annotation.
The result files are collected and grouped in three main output directories: ’Low quality’, which contains, for each sample, reads not compliant with the filtering parameters (i.e. length of alignment, number of allowed gaps and mismatches); ’Ambiguous’, containing, for each sample, the reads list and the tables of the ambiguous reads (i.e. paired reads not aligning on the same organisms, or reads showing correct matches with more than one genus); ’Valid’, containing tables and match counts of the alignment satisfying the filtering and collecting criteria. Additionally, a matrix reporting the percentage of species detected above a specified count threshold is produced and stored in this directory. This matrix, containing the distribution of contaminating organisms in all the samples, can be used to easily create a bar plot or other desired charts. Besides, DecontaMiner builds an offline HTML page containing summary statistics and plots, for the overall experiment and each sample. The interactive plots are obtained using the D3 javascript libraries [49].
DecontaMiner code is freely available for download at the website http://www-labgtp.na.icar.cnr.it/decontaminer, together with a toy example and the user guide. Furthermore, it is possible to upload the matrix file into a dedicated area of the above cited DecontaMiner online website. This functionality allows users to filter the results and narrow the search of interesting contaminants by selecting a subset of samples and/or setting up thresholds for the contaminants abundance.
Results
This section is organised as follows: the first part is a short comparison on synthetic data between DecontaMiner and other available tools, in which we discuss what are the features that make DecontaMiner the best choice to detect and analyze contamination in unmapped NGS data; the second part is devoted to the analysis of the biological results obtained by the tool on two different NGS datasets.
Accuracy assessment and comparison with other tools
We decided to compare DecontaMiner against CaPSID [39], FastQ Screen [40], and TruePure [42], since they are, to the best of our knowledge, the only software performing a similar contamination check. Unfortunately, it has been impossible to successfully install CaPSID: the tool relies on very old versions of the underlying software, and seems as not maintained since 2012. In Table 1 the principal features of the three compared software are shown. It is worth noticing that DecontaMiner is the most flexible and complete tool: it allows for multiple samples processing at the same time, in several input formats; it process paired-end reads, enforcing the consistency of contamination detection (two mate pairs must align on the same organism to be counted as a match); it does not have any limitation on the number or size of input samples, and supports any kind of contaminating organisms database provided in blast index format. Additionally, Decontaminer gives the possibility to check the quality of the reads and filter them accordingly. When screening for contamination in a human samples, DecontaMiner performs a preprocessing step of mitochondrial and ribosomal reads removal, to avoid false detections due to the high number of copies of these RNAs and similarity of those sequences among different species. It is also possible to fine-tune the DecontaMiner stringency setting different parameters to filter the BLAST output according to the user demand. On viral genomes, for instance, it is important to allow gaps or mismatches, thus taking into account their high variability with respect to the reference. Another important feature of DecontaMiner is the possibility to have different views of the data: a coarse-grained one at the sample level, and a fine-grained view at the level of the single reads.
To test the level of accuracy of DecontaMiner and to compare its performances with the other softwares, a synthetic sample was generated using the InSilicoSeq tool [50]. The test file contains reads coming from the human genes (≈77.5% of the total), from ten bacterial (≈18.1%), nine viral (≈4.1%) and four fungal (≈0.3%) genomes. About one million reads were generated, but, since only DecontaMiner supports paired-end processing, the file was split into two, and only half a million single-end reads were considered. Moreover, only DecontaMiner is able to process the whole file: TruePure manages no more than ten thousand reads, and FastQScreen one hundred thousand. Obtaining comparable results was not an easy task: TruePure and its provided extraction tool do not extract randomly the reads from the input file, but simply take the first ten thousand. Being the human reads at the beginning of our input file, no contamination at all was initially detected by TruePure. To evaluate the accuracy of the results, a five-thousand reads file containing the same fraction of genomes of the whole input was manually built and given in input to TruePure.
TruePure uses internal databases that can not be changed or updated, whereas DecontaMiner and FastQScreen were tested on the complete Bacteria/Fungi/Viruses databases obtained form NCBI. FastQScreen gives the possibility to choose among three different aligner (BWA, Bowtie, and Bowtie2) and requires the specific index files of the reference genomes, but it fails to manage the large indexes created by Bowtie and Bowtie2 in case of genomes greater than 4 billion nucleotides in length. The results are summarised in Table 2 and in Table 3. The comparison among the softwares was not straightforward, since FastQScreen does not provide information on the single species distribution, but only an overall result. In Table 2 the simulated data read counts and fraction on the non-human species are reported, alongside the results obtained by the three softwares. Although working on a manually curated input TruePure was not able to detect fungal contamination, while extracting correct percentages of bacterial and viral contamination. FastQScreen detects also the fungal contamination. Both FastQScreen and DecontaMiner detect lower percentages of fungal and viral contamination, and a higher bacterial one. Nonetheless, the results of DecontaMiner in terms of correctness are very high, as Table 3 shows. It is worth to note that DecontaMiner is able to give a very detailed species report while working on the complete databases and on a half million reads. TruePure results are biased, since the read in the input file were manually chosen to be representative of all the species. Nonetheless, the tool is not able to detect at all the fungal contamination, and misses one of the viruses. Details on the used data, and the obtained results are available in the Additional file 1.
Tests on biological data
The DecontaMiner pipeline has been tested on two publicly available datasets downloaded from the GEO (Gene Expression Omnibus) portal. These datasets have also been used to test the first prototype as described in [43]. However, the pipeline has changed since then, and the NCBI databases of contaminant organisms as well. The first dataset (GSE69240) contains 25 pure HG-DCIS (High-Grade Ductal Carcinoma In Situ) and ten normal breast organoids samples. RNA was polyA enriched, and 76 nt paired-end sequencing was performed. The second dataset (GSE68086) contains 228 samples plus two replicates of six different malignant tumors and 55 samples plus two replicates of healthy donors. Total RNA from blood platelets was sequenced in a single-end mode and with 101-bp reads. The data in SRA (Sequence Read Archive) format were downloaded and converted to fastq format using the SRAToolkit [51].
The reads quality was assessed by FastQC [52]. FastQ files were aligned to the reference genome (assembly hg19) using the fast splice junction mapper TopHat [53] guided by UCSC gene annotation. The alignment statistics were checked by SamStat [54]. The reads which failed to map were stored in a separate bam file for each sample and put in the same directory, given as input to DecontaMiner. The samples from the dataset GSE69240 show a good and consistent mapping rate for all the samples, and, as expected, we did not observe matches to contaminating genomes. We also lowered the analysis stringency with respect to allowed mismatches and gaps (2 for each), obtaining the same outcome. This result totally agrees with the experiment characteristics. Moreover, to confirm DecontaMiner’s results, we processed the same samples with FastQScreen, obtaining the same outcome. Indeed, an efficient polyA enrichment and a sterile environment should guarantee contamination-free samples. The absence of matches may suggest a sterile working environment and careful experimental processes. The mapping rate of GSE68086 samples, instead, shows a high variability (Figs. 2 and 3).

Overall read mapping rate distribution (GSE68086) Area chart showing the mapping rate of the GSE68086 dataset samples. The amount of mapped reads ranges from 45.5% to 94.2%, indicating a great variability among samples

Bacterial abundance in the tumoral samples. The heatmaps show the relative abundance of bacterial species in 4 tumor types: breast cancer (a), GBM (b), Lung (c) and digestive system cancers (d). Bacteria with a match count ≥ 100 and a relative abundance ≥ 5% in at least one sample/group are shown. P. Acnes is highlighted by a dot in all groups, being the most abundant contaminant. The heatmaps are generated by the DecontaMiner offline HTML page and online website
The number of unmapped reads range from 5 to 40% and show several matches to microorganism genomes. Only contaminants having at least 100 matches were retained for further investigations (MCT = 100). Among them, we considered only organisms having a relative abundance ≥ 5% in at least one sample of the two groups. These settings were chosen to avoid weak detections, and to extract only contaminations significant across all the samples. A summary of the obtained results is reported in Table 4.
It is evident that tumur samples show a higher number of detected microorganisms than the control samples. The quality parameters set to filter the BLAST alignments were very stringent: match length equal to the read length; no gaps; no mismatches. Collecting the results obtained from the alignment to bacterial genomes, we observed many matches to Propionibacterium Acnes in almost all samples, both from tumors and healthy donors, suggesting the possibility of either a downstream or a common blood platelets contamination (Figs. 3-4).

Bacterial abundance in the healthy samples. The dot chart shows the relative abundance of bacteria, grouped by genus. Only genera with a match count ≥ 100 and a relative abundance ≥ 5% in at least one sample are shown. The dot size is proportional to the abundance. The most relevant bacteria belong to the Paeniglutamicibacter and Propionibacterium genera. The dot charts are generated by the DecontaMiner offline html page and online website
Indeed, as reported by literature, P. acnes is a ubiquitous bacterium and its presence has been detected in human tissues, hospital devices, lab reagents and environment [55]. Furthermore, bacterial contamination of blood components is one of the most challenging issues of transfusion medicine and sepsis [56, 57]. Bacteremia diagnosis can be performed by using NGS approaches [58, 59]. Propionibacterium Acnes is considered to be one of the most frequent contaminants of platelet concentrates [60, 61]. Except for the background contamination of Propionibacterium Acnes, some samples seem to be more contaminated than others, suggesting a different timing of sample processing, or an upstream rather than downstream contamination. In particular, these contaminations involve E. coli and several species of Staphylococcus and Acinetobacter genera. Multiple studies have demonstrated that pathogenic E. coli strains can be related particularly to gastrointestinal cancers, since these strains have the potential to transform enterocytes by cyclomodulin toxin effects and promote the development of cancer [62, 63]. Also almost all healthy control samples show a remarkable amount of Propionibacterium genus (Fig. 4), strengthening the hypothesis of a downstream contamination during sample processing. Along with it, also Paeniglutamicibacter is clearly present in some of the samples. Reclassification of some species of the genus Arthrobacter into novel genera, among which Paeniglutamicibacter, have been recently proposed [64]. The Arthrobacter genus belongs to the Actinobacteria phylum and is found primarily in soil.
Compared to bacteria, a more modest amount of reads aligned to fungal genomes. Both tumor and healthy samples show, as most predominant species, fungi and yeasts that can be ascribed to environmental contamination (Fig. 5). In particular, Wickerhamomyces species are often recovered from arboreal habitats [65, 66]. Malassezia species are skin commensal and frequently found as laboratory reagent contaminants [67, 68]. Penicillium, mostly present in healthy samples, is a common air contaminant [69].

Fungi contamination in tumor and healthy groups. The stacked bar chart shows the fungal genera having an average value in all groups ≥ 10%, considering tumor and healthy (HC) groups. Bars are stacked by the group for which the contaminating organism (x-axis) has been detected. The y-axis scale reports the sum of the values in all the samples. Groups are ranked in a increasing order, in terms of contaminant abundance, from the bottom to the top. The stacked bar charts are automatically generated by the DecontaMiner online companion website
Concerning viruses, we predominantly found matches to Enterobacteria phage, and, to a lower extent, to Propionibacterium phage and Staphylococcus phage. This result can be considered a further confirmation of the detection of the bacterial species, since bacteriophages are commonly found where their bacterial hosts are present, including the human body [70], but also it suggests the presence of cloning vectors contamination. Another finding worth to be mentioned is the alignment of some samples to the human Herpes virus. Association of this particular virus with cancer and its feasible etiologic role in tumorigenesis have been largely studied [71, 72].
Conclusions
DecontaMiner is a tool designed and developed to investigate the presence of contaminating sequences in NGS data. It analyzes the sequences rejected during the alignment to the reference genome, the so called unmapped reads. The sequences in input can be in fastq, fasta or bam format. Hence, DecontaMiner can be used both as a filtering tool, to remove foreign reads from the raw sequencing file, usually in fastq or fasta format, and as a detection tool to identify contaminating sequences among the unmapped reads, generally stored in a bam file.
The novelty of DecontaMiner is mainly represented by its easy integration with the standard procedures of NGS data analysis, thus making DecontaMiner a useful tool for additional investigation of the data and condition under study. We assessed the accuracy of DecontaMiner on a synthetic dataset that was also used to compare its performances with similar tools: the results show that DecontaMiner is both reliable and precise, while being highly flexible in the choice of databases and filtering parameters. To test the functionality of our tool on real data, we used two different RNA-Seq datasets. The lack of matches to microorganisms in the case of the polyA-RNA samples (GSE69240) was in perfect agreement with the nature of the experiment. The reliability of our pipeline was further tested on a dataset of total RNA sequencing (GSE68086) of tumor and healthy samples. We found in almost all the samples a background contamination of P. Acnes, which is very well known as common contaminant of hospital and laboratory environments. From the alignment to fungal and virus genomes the matches were very modest compared to bacteria, although the mapping to bacteriophages was in agreement with what we found as bacterial contamination.
In conclusion, DecontaMiner can suggest the presence of contaminating organisms in samples sequenced by NGS, that might derive either from laboratory contamination or be part of their biological source, and can be considered as worthy of further investigation and experimental validation.
Abbreviations
- BAM:
-
Binary alignment map
- BLAST:
-
Basic local alignment search tool
- mtRNA:
-
mitochondrial RNA
- nr:
-
non-redundant
- nt:
-
nucleotides
- NCBI:
-
National center for biotechnology information
- NGS:
-
Next generation sequencing
- polyA:
-
polyadenylated
- RNA-seq:
-
RNA sequencing
- rRNA:
-
ribosomal RNA
References
Strong MJ, Xu G, Morici L, Bon-Durant SS, Baddoo M, Lin Z, Fewell C, Taylor CM, Flemington EK. Microbial contamination in next generation sequencing: implications for sequence-based analysis of clinical samples. PLoS Pathog. 2014; 10(11):1004437.
Glassing A, Dowd SE, Galandiuk S, Davis B, Chiodini RJ. Inherent bacterial dna contamination of extraction and sequencing reagents may affect interpretation of microbiota in low bacterial biomass samples. Gut Pathog. 2016; 8(1):24.
Hadfield J, Eldridge MD. Multi-genome alignment for quality control and contamination screening of next-generation sequencing data. Front Genet. 2014; 5:31.
Martín R, Miquel S, Ulmer J, Kechaou N, Langella P, Bermúdez-Humarán LG. Role of commensal and probiotic bacteria in human health: a focus on inflammatory bowel disease. Microb Cell Factories. 2013; 12(1):71.
Rappaport SM, Smith MT. Environment and disease risks. Science. 2010; 330(6003):460–1.
Migliore L, Coppedè F. Genetic and environmental factors in cancer and neurodegenerative diseases. Mutat Res/Rev Mutat Res. 2002; 512(2):135–53.
Cosselman KE, Navas-Acien A, Kaufman JD. Environmental factors in cardiovascular disease. Nat Rev Cardiol. 2015; 12(11):627–42.
Burgio E, Lopomo A, Migliore L. Obesity and diabetes: from genetics to epigenetics. Mol Biol Rep. 2015; 42(4):799–818.
Garrett WS. Cancer and the microbiota. Science. 2015; 348(6230):80–6.
Charbonneau MR, Blanton LV, DiGiulio DB, Relman DA, Lebrilla CB, Mills DA, Gordon JI. A microbial perspective of human developmental biology. Nature. 2016; 535(7610):48–55.
Falony G, Joossens M, Vieira-Silva S, Wang J, Darzi Y, Faust K, Kurilshikov A, Bonder MJ, Valles-Colomer M, Vandeputte D, et al. Population-level analysis of gut microbiome variation. Science. 2016; 352(6285):560–4.
Ehrlich SD. The human gut microbiome impacts health and disease. C R Biologies. 2016; 339(7):319–23.
Larsen N, Vogensen FK, van den Berg FW, Nielsen DS, Andreasen AS, Pedersen BK, Al-Soud WA, Sørensen SJ, Hansen LH, Jakobsen M. Gut microbiota in human adults with type 2 diabetes differs from non-diabetic adults. PloS ONE. 2010; 5(2):9085.
Verdu EF, Galipeau HJ, Jabri B. Novel players in coeliac disease pathogenesis: role of the gut microbiota. Nat Rev Gastroenterol Hepatol. 2015; 12(9):497.
Cenit MC, Olivares M, Codoñer-Franch P, Sanz Y. Intestinal microbiota and celiac disease: cause, consequence or co-evolution?Nutrients. 2015; 7(8):6900–23.
Kootte R, Vrieze A, Holleman F, Dallinga-Thie GM, Zoetendal EG, de Vos WM, Groen A, Hoekstra JB, Stroes ES, Nieuwdorp M. The therapeutic potential of manipulating gut microbiota in obesity and type 2 diabetes mellitus. Diabetes Obes Metab. 2012; 14(2):112–20.
Mira-Pascual L, Cabrera-Rubio R, Ocon S, Costales P, Parra A, Suarez A, Moris F, Rodrigo L, Mira A, Collado M. Microbial mucosal colonic shifts associated with the development of colorectal cancer reveal the presence of different bacterial and archaeal biomarkers. J Gastroenterol. 2015; 50(2):167–79.
Bik EM, Eckburg PB, Gill SR, Nelson KE, Purdom EA, Francois F, Perez-Perez G, Blaser MJ, Relman DA. Molecular analysis of the bacterial microbiota in the human stomach. Proc Natl Acad Sci U S A. 2006; 103(3):732–7.
Beck JM, Young VB, Huffnagle GB. The microbiome of the lung. Transl Res. 2012; 160(4):258–66.
Urbaniak C, Cummins J, Brackstone M, Macklaim JM, Gloor GB, Baban CK, Scott L, O’Hanlon DM, Burton JP, Francis KP, et al.Microbiota of human breast tissue. Appl Environ Microbiol. 2014; 80(10):3007–14.
Wang X, Yang Y, Huycke MM. Commensal bacteria drive endogenous transformation and tumour stem cell marker expression through a bystander effect. Gut. 2015; 64(3):459–68.
Kostic AD, Gevers D, Pedamallu CS, Michaud M, Duke F, Earl AM, Ojesina AI, Jung J, Bass AJ, Tabernero J, et al.Genomic analysis identifies association of fusobacterium with colorectal carcinoma. Genome Res. 2012; 22(2):292–8.
Lin Z, Puetter A, Coco J, Xu G, Strong MJ, Wang X, Fewell C, Baddoo M, Taylor C, Flemington EK. Detection of murine leukemia virus in the epstein-barr virus-positive human b-cell line jy, using a computational rna-seq-based exogenous agent detection pipeline, parses. J Virol. 2012; 86(6):2970–7.
Strong MJ, O’Grady T, Lin Z, Xu G, Baddoo M, Parsons C, Zhang K, Taylor CM, Flemington EK. Epstein-barr virus and human herpesvirus 6 detection in a non-hodgkin’s diffuse large b-cell lymphoma cohort by using rna sequencing. J Virol. 2013; 87(23):13059–62.
Bhatt AS, Freeman SS, Herrera AF, Pedamallu CS, Gevers D, Duke F, Jung J, Michaud M, Walker BJ, Young S, et al.Sequence-based discovery of bradyrhizobium enterica in cord colitis syndrome. N Engl J Med. 2013; 369(6):517–28.
Régnier P, Marujo PE. Polyadenylation and degradation of mRNA in prokaryotes In: Lapointe J, Brakier-Gingras L, editors. Translation Mechanisms. Landes Bioscience /Eurekah.com: 2013. p. 184–93.
Tae H, Karunasena E, Bavarva JH, McIver LJ, Garner HR. Large scale comparison of non-human sequences in human sequencing data. Genomics. 2014; 104(6):453–8.
Ouma WZ, Mejia-Guerra MK, Yilmaz A, Pareja-Tobes P, Li W, Doseff AI, Grotewold E. Important biological information uncovered in previously unaligned reads from chromatin immunoprecipitation experiments (ChIP-Seq). Sci Rep. 2015; 5:8635.
Consortium GP, et al.A map of human genome variation from population-scale sequencing. Nature. 2010; 467(7319):1061–73.
Langdon WB. Mycoplasma contamination in the 1000 genomes project. BioData Min. 2014; 7(1):3.
Olarerin-George AO, Hogenesch JB. Assessing the prevalence of mycoplasma contamination in cell culture via a survey of ncbi’s rna-seq archive. Nucleic Acids Res. 2015; 43(5):2535–42.
Salter SJ, Cox MJ, Turek EM, Calus ST, Cookson WO, Moffatt MF, Turner P, Parkhill J, Loman NJ, Walker AW. Reagent and laboratory contamination can critically impact sequence-based microbiome analyses. BMC Biol. 2014; 12(1):87.
Laurence M, Hatzis C, Brash DE. Common contaminants in next-generation sequencing that hinder discovery of low-abundance microbes. PloS ONE. 2014; 9(5):97876.
Ballenghien M, Faivre N, Galtier N. Patterns of cross-contamination in a multispecies population genomic project: detection, quantification, impact, and solutions. BMC Biol. 2017; 15(1):25.
Kostic AD, Ojesina AI, Pedamallu CS, Jung J, Verhaak RG, Getz G, Meyerson M. Pathseq: software to identify or discover microbes by deep sequencing of human tissue. Nat Biotechnol. 2011; 29(5):393–6.
Naccache SN, Federman S, Veeraraghavan N, Zaharia M, Lee D, Samayoa E, Bouquet J, Greninger AL, Luk K-C, Enge B, et al.A cloud-compatible bioinformatics pipeline for ultrarapid pathogen identification from next-generation sequencing of clinical samples. Genome Res. 2014; 24(7):1180–92.
Xu G, Strong MJ, Lacey MR, Baribault C, Flemington EK, Taylor CM. Rna compass: a dual approach for pathogen and host transcriptome analysis of rna-seq datasets. PLoS ONE. 2014; 9(2):89445.
Schmieder R, Edwards R. Fast identification and removal of sequence contamination from genomic and metagenomic datasets. PloS ONE. 2011; 6(3):17288.
Borozan I, Wilson S, Blanchette P, Laflamme P, Watt SN, Krzyzanowski PM, Sircoulomb F, Rottapel R, Branton PE, Ferretti V. Capsid: a bioinformatics platform for computational pathogen sequence identification in human genomes and transcriptomes. BMC Bioinformatics. 2012; 13(1):206.
Andrews S. FastQ Screen - Babraham Bioinformatics Institute. http://www.bioinformatics.babraham.ac.uk/projects/fastq_screen. Accessed 17 Jan 2019.
Cresswell G. Contamination_screen. http://github.com/luslab/contamination_screen. Accessed 17 Jan 2019.
Expedeon True Helix. TruePure. https://www.expedeon.com/truehelix-free-bioinformatics-tools/truepure-contamination-analysis-sequencing/truepure-extraction-tool/. Accessed 17 Jan 2019.
Granata I, Sangiovanni M, Guarracino M. DecontaMiner: a pipeline for the detection and analysis of contaminating sequences in human NGS sequencing data. In: Dynamics of mathematical models in biology. Cham: Springer International Publishing: 2016. p. 137–48. https://doi.org/10.1007/978-3-319-45723-9_11.
Li H, Handsaker B, Wysoker A, Fennell T, Ruan J, Homer N, Marth G, Abecasis G, Durbin R, et al.The sequence alignment/map format and samtools. Bioinformatics. 2009; 25(16):2078–9.
Hannon G. Fastx-toolkit. http://hannonlab.cshl.edu/fastx_toolkit/. Accessed 17 Jan 2019.
Kopylova E, Noé L, Touzet H. Sortmerna: fast and accurate filtering of ribosomal rnas in metatranscriptomic data. Bioinformatics. 2012; 28(24):3211–7.
Zhang Z, Schwartz S, Wagner L, Miller W. A greedy algorithm for aligning dna sequences. J Comput Biol. 2000; 7(1-2):203–14.
Drost H-G, Paszkowski J. Biomartr: genomic data retrieval with R. Bioinformatics. 2017; 33:1216–7.
Bostok M. Data-Driven Documents. https://d3js.org/. Accessed 17 Jan 2019.
Gourlé H. Simulating Illumina Data with InSilicoSeq. https://doi.org/10.6084/m9.figshare.5053327.v1. Accessed 17 Jan 2019.
Staff S. Using the sra toolkit to convert. sra files into other formats. National Center for Biotechnology Information (US). 2011. http://www.ncbi.nlm.nih.gov/books/NBK158900/. Accessed 22 Aug 2015.
Andrews S. FastQC: a quality control tool for high throughput sequence data. 2010. Available online at: http://www.bioinformatics.babraham.ac.uk/projects/fastqc.
Trapnell C, Pachter L, Salzberg SL. Tophat: discovering splice junctions with rna-seq. Bioinformatics. 2009; 25(9):1105–11.
Lassmann T, Hayashizaki Y, Daub CO. Samstat: monitoring biases in next generation sequencing data. Bioinformatics. 2011; 27(1):130–1.
Mollerup S, Friis-Nielsen J, Vinner L, Hansen TA, Richter SR, Fridholm H, Herrera JAR, Lund O, Brunak S, Izarzugaza JM, et al.Propionibacterium acnes: Disease-causing agent or common contaminant? detection in diverse patient samples by next-generation sequencing. J Clin Microbiol. 2016; 54(4):980–7.
Brecher ME, Hay SN. Bacterial contamination of blood components. Clin Microbiol Rev. 2005; 18(1):195–204.
Goldman M, Blajchman MA. Blood product-associated bacterial sepsis. Transfus Med Rev. 1991; 5(1):73–83.
Schrezenmeier H, Walther-Wenke G, Muller TH, Weinauer F, Younis A, Holland-Letz T, Geis G, Asmus J, Bauerfeind U, Burkhart J, Deitenbeck R, Förstemann E, Gebauer W, Höchsmann B, Karakassopoulos A, Liebscher U-M, Sänger W, Schmidt M, Schunter F, Sireis W, Seifried E. Bacterial contamination of platelet concentrates: results of a prospective multicentre study comparing pooled whole blood-derived platelets and apheresis platelets. Transfusion. 2007; 47:644–52.
Grumaz S, Stevens P, Grumaz C, Decker SO, Weigand MA, Hofer S, Brenner T, von Haeseler A, Sohn K. Next-generation sequencing diagnostics of bacteremia in septic patients. Genome Med. 2016; 8(1):73.
Störmer M, Kleesiek K, Dreier J. Propionibacterium acnes lacks the capability to proliferate in platelet concentrates. Vox Sang. 2008; 94(3):193–201.
Park HJ, Na S, Park SY, Moon SM, Cho O-H, Park K-H, Chong YP, Kim S-H, Lee S-O, Kim YS, et al.Clinical significance of propionibacterium acnes recovered from blood cultures: analysis of 524 episodes. J Clin Microbiol. 2011; 49(4):1598–601.
Khan S. Potential role of escherichia coli dna mismatch repair proteins in colon cancer. Crit Rev Oncol Hematol. 2015; 96(3):475–82.
Buc E, Dubois D, Sauvanet P, Raisch J, Delmas J, Darfeuille-Michaud A, Pezet D, Bonnet R. High prevalence of mucosa-associated e. coli producing cyclomodulin and genotoxin in colon cancer. PloS ONE. 2013; 8(2):56964.
Busse H-J. Review of the taxonomy of the genus arthrobacter, emendation of the genus arthrobacter sensu lato, proposal to reclassify selected species of the genus arthrobacter in the novel genera glutamicibacter gen. nov., paeniglutamicibacter gen. nov., pseudoglutamicibacter gen. nov., paenarthrobacter gen. nov. and pseudarthrobacter gen. nov., and emended description of arthrobacter roseus. Int J Syst Evol Microbiol. 2016; 66(1):9–37.
James SA, Barriga EJC, Barahona PP, Harrington TC, Lee C. -F., Bond CJ, Roberts IN. Wickerhamomyces arborarius fa, sp. nov., an ascomycetous yeast species found in arboreal habitats on three different continents. Int J Syst Evol Microbiol. 2014; 64(3):1057–61.
Janisiewicz WJ, Jurick WM, Peter KA, Kurtzman CP, Buyer JS. Yeasts associated with plums and their potential for controlling brown rot after harvest. Yeast. 2014; 31(6):207–18.
Dawson Jr TL. Malassezia globosa and restricta: breakthrough understanding of the etiology and treatment of dandruff and seborrheic dermatitis through whole-genome analysis. J Investig Dermatol Symp Proc. 2007; 12:15–9. https://doi.org/10.1038/sj.jidsymp.5650049.
Czurda S, Smelik S, Preuner-Stix S, Nogueira F, Lion T. Occurrence of fungal dna contamination in pcr reagents: approaches to control and decontamination. J Clin Microbiol. 2016; 54(1):148–52.
Rogawansamy S, Gaskin S, Taylor M, Pisaniello D. An evaluation of antifungal agents for the treatment of fungal contamination in indoor air environments. Int J Environ Res Public Health. 2015; 12(6):6319–32.
Brown-Jaque M, Muniesa M, Navarro F. Bacteriophages in clinical samples can interfere with microbiological diagnostic tools. Sci Rep. 2016; 6:33000.
Schiller JT, Lowy DR. Virus infection and human cancer: an overview. In: Recent Results Cancer Res: 2014. p. 1–10. https://doi.org/10.1007/978-3-642-38965-8_1.
Panagiotakis GI, Papadogianni D, Chatziioannou MN, Lasithiotaki I, Delakas D, Spandidos DA. Association of human herpes, papilloma and polyoma virus families with bladder cancer. Tumor Biol. 2013; 34(1):71–9.
Acknowledgements
MRG work has been conducted at National Research University Higher School of Economics (HSE) and has been supported by the RSF grant n. 14-41-00039. MS work has been conducted while at the High Performance Computing and Networking Institute, National Research Council of Italy (ICAR-CNR). The authors of this paper are grateful to Gennaro Oliva for his assistance in tools and cluster maintenance. They also would like to thank Giuseppe Trerotola and Simona Sada for their administrative support.
Funding
This work was supported by MIUR PON02-00619, Interomics Italian Flagship Project and COFUND INCIPIT Project. The publication costs are funded by MIUR PON02-00619.
Availability of data and materials
The datasets analysed during the current study are available trough the Gene Expression Omnibus portal at https://www.ncbi.nlm.nih.gov/gdsusing their accession numbers GSE69240, GSE68086.
About this supplement
This article has been published as part of BMC Bioinformatics Volume 20 Supplement 4, 2019: Methods, tools and platforms for Personalized Medicine in the Big Data Era (NETTAB 2017). The full contents of the supplement are available online at https://bmcbioinformatics.biomedcentral.com/articles/supplements/volume-20-supplement-4.
Author information
Authors and Affiliations
Contributions
IG and MS conceived the project. IG proposed the overall idea, the case studies and curated the biological interpretation. MS designed, developed and tested the Perl and PHP codes. AST developed the online and offline interactive web pages. MRG supervised the whole project. IG and MS wrote the manuscript, which all authors read, edited and reviewed. All authors read and approved the final manuscript.
Corresponding author
Ethics declarations
Ethics approval and consent to participate
Not applicable.
Consent for publication
Not applicable.
Competing interests
The authors declare that they have no competing interests.
Publisher’s Note
Springer Nature remains neutral with regard to jurisdictional claims in published maps and institutional affiliations.
Additional file
Additional file 1
This Excel file includes several sheets containing all the details on the data used for the accuracy assessment and the comparison with other tools, and the obtained results. (XLSX 139 kb)
Rights and permissions
Open Access This article is distributed under the terms of the Creative Commons Attribution 4.0 International License (http://creativecommons.org/licenses/by/4.0/), which permits unrestricted use, distribution, and reproduction in any medium, provided you give appropriate credit to the original author(s) and the source, provide a link to the Creative Commons license, and indicate if changes were made. The Creative Commons Public Domain Dedication waiver (http://creativecommons.org/publicdomain/zero/1.0/) applies to the data made available in this article, unless otherwise stated.
About this article

Cite this article
Sangiovanni, M., Granata, I., Thind, A. et al. From trash to treasure: detecting unexpected contamination in unmapped NGS data. BMC Bioinformatics 20 (Suppl 4), 168 (2019). https://doi.org/10.1186/s12859-019-2684-x
Published:
DOI: https://doi.org/10.1186/s12859-019-2684-x