
Abstract
Introduction
Signal detection yields confirmed signals in only 2.1%, which imposes a heavy burden on the pharmacovigilance system in the European Union.
Objectives
We aimed to develop a network theoretical metric to increase the confirmed signal ratio of individual case safety report (ICSR) networks.
Methods
ICSRs of five cardiovascular adverse events were requested from EudraVigilance. We developed Vigilace™, a web-based application to build network representation of ICSRs. Three network-based signal scores, which we termed NEWS (normalized edge weight for signals) scores, were calculated by normalizing the weight of each edge in the report-based weighted network by the weight of the same edge in topological weighted networks. Depending on the third node in topological network edges, we defined full-, adverse event-, and drug-type NEWS scores. Area under the receiver operating characteristic curves (AUROC) were analyzed to compare the reporting odds ratio (ROR) and NEWS scores.
Results
Overall, 72,475 ICSRs were accessed from EudraVigilance. Drug-type NEWS (NEWSD) score performed better (DeLong test, p-value <0.05) compared with the ROR in case of four adverse events: acute myocardial infarction (AUROC: 0.856 vs. 0.720), arrhythmia (0.657 vs. 0.614), pulmonary hypertension (0.861 vs. 0.720), and QT prolongation (0.830 vs. 0.749). Postural orthostatic tachycardia syndrome was excluded due to the lack of reference data.
Conclusion
This is the first demonstration that report-based weighting normalized by topological weighting of co-reported drugs, which we termed as NEWSD score, can perform better compared with the ROR. An application was developed for ICSR network analysis that facilitates the calculation of this score.
To increase the confirmed safety signal ratio, a network theoretical metric was created for the analysis of individual case safety reports (ICSRs). |
This is the first demonstration that report-based weighting normalized by topological weighting of co-reported drugs, which we termed as NEWSD score (drug-type of normalized edge weight for signals), can perform better compared with a disproportionality method. |
An application, called Vigilace™, was developed that facilitates the ICSR network analysis. |
1 Introduction
Signal detection is one of the basic constituents of proactive pharmacovigilance that ensure early detection of adverse effects. Multiple sources are used for detecting signals, such as literature review, postmarketing studies and spontaneous adverse event reports, for which spontaneous reporting systems have been set up to collect the reports in a structured and standardized format, providing a framework for data analysis. Commonly used spontaneous reporting databases are VigiBase [1], FDA Adverse Event Reporting System (FAERS) [2], and EudraVigilance [3]. Each of these databases contains more than 10 million individual case safety reports (ICSRs) that allow the application of various robust data analysis methods for statistical signal detection.
EudraVigilance is maintained by the European Medicines Agency (EMA) and the national competent authorities of the European Union (EU) for monitoring the safety of medicines. EudraVigilance is used in all stages of pharmacovigilance procedures, from the ICSR collection to signal detection and decision support.
In 2020, 1888 potential signals were reviewed by the EMA, and approximately 80% of them were not validated. Moreover, only 2.1% were prioritized and assessed by the EMA Pharmacovigilance Risk Assessment Committee (PRAC) [4]. This gap between detected and prioritized signals reveals the resource cost of detailed signal assessments that imposes a heavy burden on the pharmacovigilance system. Considering that 81% of the signals were originating from EudraVigilance, the screening efficiency of used statistical methods has a major impact on the overall effectiveness of the signal detection system.
The cornerstone of the EudraVigilance signal detection is the disproportionality methods, which are based on the calculation of statistical association between the constituents of so-called drug–event combinations (DECs). One of the main limitations of disproportionality methods [5] is that they are incapable of considering possible factors that might cause signals in disproportionate reporting with no causal relationship between the elements of DECs. Sensitivity and specificity of statistical signal detection methods have been compared previously [6] but no superior method was identified. The EMA approach is to use the reporting odds ratio (ROR) [7]. To reduce random variability effect and false results, data filtering rules were introduced, like a threshold for the minimum number of required adverse event reports on drugs or the use of the important medical event (IME) list [8].
Recent EMA initiatives aimed to identify new ways of signal detection methods as a future prospective of this field [7]. In 2017, the EMA published a data access procedure to the EudraVigilance database in order to facilitate pharmacovigilance-related research [9]. The access level 2A for academia provides 228 of the 272 data elements of the ICH E2B(R3) standard ICSR format, providing deeper insights for researchers to analyze ICSRs compared with publicly available data [10].
Studies were published in relation to the development of improved statistical signal detection methodologies that showed promising results, such as vigiRank [11], combination of supervised learning and Bradford Hill’s causality considerations [12], application of machine learning [13], false discovery rate detection [14, 15], competition bias removal [16], and co-prescription bias and associated unmasking [17], but currently these methods are not used widely by regulatory bodies or pharmaceutical companies. In recent years, the field of network theory and analysis was researched extensively, and various methods were applied on spontaneous reporting databases in order to describe the network characteristics of spontaneous adverse event report databases [18,19,20], certain adverse events [21, 22] and support decision rules [23]. Network analysis as a part of signal detection methods has also been published recently, for co-reported community detection [24] and adverse event severity estimation and risk profiling [25]. In this study, we aimed to investigate the application of previously described network edge-weighting metrics for signal detection as a novel approach.
2 Methods
ICSRs containing five selected cardiovascular adverse events were accessed from the EudraVigilance database as individual datasets. These were processed by our Vigilace™ web-based application that built four different networks for each, representing the connections among all drugs and adverse events reported in the selected ICSRs. Three metrics, which we termed normalized edge weight for signals (NEWS) scores, were calculated based on the edge weights of the networks and were used for signal detection purposes. Area under the receiver operating characteristic curves (AUROC) were calculated to compare the performance of NEWS scores to the ROR disproportionality method as a control. A detailed process workflow is presented in Fig. 1 using the example of the acute myocardial infarction (AMI) ICSR dataset.
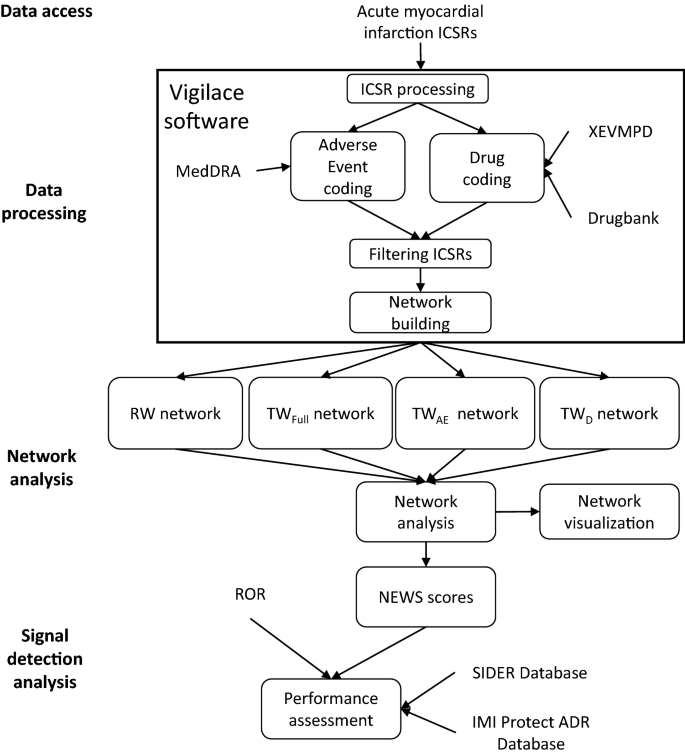
Process workflow. Data access: All ICSRs, including acute myocardial infarction, were obtained from EudraVigilance on the 2A access level. Data processing: ICSRs were processed using Vigilace™ software. AE data were coded using the MedDRA®, and drug data were coded using the XEVMPD and DrugBank dictionary. ICSR filtering was applied based on the defined study settings, and four drug–AE networks (RW, TWFull, TWAE, TWD) were built. Network analysis: The built networks were analyzed and visualized. NEWS scores were calculated. Signal detection analysis: ROR and NEWS scores were applied as signal detection methods for all drug–acute myocardial infarction edges, and AUROC analysis was performed to compare NEWS scores with ROR. The Merged SIDER and IMI Protect—ADR Database were used as the reference dataset. ICSRs individual case safety reports, AE adverse event, MedDRA® Medical Dictionary for Regulatory Activities, RW report-based weighted, TW topological weighted, TWFull full topological weighted, TWAE adverse event topological weighted, TWD drug topological weighted, ROR reporting odds ratio, NEWS normalized edge weight for signals, AUROC area under the receiver operating characteristic curve, XEVMPD Extended EudraVigilance medicinal product dictionary
2.1 Data Access
We focused on the analysis of cardiovascular adverse events, considering their high ratio among safety-related drug withdrawals [26]. Signals assessed by the PRAC [27] were reviewed and five cardiovascular-related signals of centrally authorized products, where the adverse event was described in the form of single Medical Dictionary for Regulatory Affairs (MedDRA®) [28] Preferred Terms (PTs), were selected for further analysis. We submitted our data request to the EMA for accessing all ICSRs reported in connection with the above-mentioned PT codes on access level 2A. Our research plan was approved by the Semmelweis University Regional and Institutional Committee of Science and Research Ethics (SE RKEB 82/2018), and our data access request was accepted by the EMA.
2.2 Data Processing
Literature data about the application of network analysis on ICSRs are available [18, 19, 29, 30], however no publicly available tool was accessible to test signal detection methods using the networks built from ICSRs of the EudraVigilance database. Therefore, we developed a web-based application called Vigilace™ (www.vigilace.com; Pharmahungary, Szeged, Hungary), which allows us to process the accessed ICSRs on access level 2A from EudraVigilance and build networks from the reported data. The data processing and network building parts of Vigilace™ were written in the C++ programming language, where queries can be configured by user-defined parameters regarding the processing of ICSRs (e.g. reporting type, drug role, handling of combination drugs) and network settings (edge weighting algorithm). Vigilace™ was developed by the Pharmahungary Group in collaboration with Semmelweis University under commercial license, but it is available free of charge for reasonable academic research use. The networks can be downloaded in graph modelling language (GML) and in custom value separated (CSV) file format, which allows flexible analysis of the data.
The ICSRs of the selected cardiovascular adverse events were accessed from EudraVigilance as a relational database in the form of Microsoft Excel Open XML Spreadsheet (XLSX) files (Microsoft Corporation, Redmond, WA, USA). In the published data, the adverse events and drugs were provided in text format in line with MedDRA® and Extended EudraVigilance medicinal product dictionary (XEVMPD). In case the reported information could not be coded by the EMA, the original reported text was provided in the XLSX files. Further preprocessing was applied on the published files to change the separator characters to a unique separator character in order to allow the correct reading of free-text fields within ICSRs by Vigilace™. After preprocessing, each cardiovascular ICSR dataset was uploaded for a separate query to the website of Vigilace™. As the drug and adverse event data were only published in text format (e.g. XEVMPD code was not provided), the different terms and synonyms for the same event could not be unified directly, therefore we utilized dictionaries as additional input files that served as look-up tables for string-matching and enabled unification.
Adverse events of accessed ICSRs were coded by mapping them in text format to MedDRA® (version 23.0) PTs. If an adverse event-related data field could not be mapped against MedDRA®, it was not included in the internal data representation of the ICSR.
Drugs of accessed ICSRs were coded by mapping the corresponding drug to XEVMPD identifiers (IDs) provided by the EMA. This could not cover all reported drugs, as non-coded drugs in EudraVigilance were also published. Therefore, DrugBank [31] IDs were applied to improve the coding performance. Drugs reported under various names (brand name, synonyms) were unified under one common ID. If a drug in an ICSR could not be coded by the above-mentioned drug dictionaries, then that drug was not included in the internal data representation of the ICSR. Active substances of combination products were coded separately. Drugs reported as suspected, interacting, or concomitant in the ICSRs were all coded.
Only spontaneous ICSRs containing at least one successfully coded drug and at least one successfully coded adverse event were used in order to minimize the data loss. The ICSRs that satisfied these filtering criteria were kept for network building and analysis.
2.3 Network Analysis
Based on the previously described internal data representation of drugs and adverse events, four different networks were built by Vigilace™ for each accessed cardiovascular ICSR dataset using the filtered ICSRs. The reported drugs and adverse events corresponded to the nodes of the networks, while undirected edges were created between them, representing the interactions between the nodes.
Edge weights were calculated by different algorithms described by Botsis et al. [29], and these algorithms were implemented in their original form by our research group. The report-based weighting (RW) algorithm calculates weights for each edge in the network by counting the ICSRs that contain their respective two nodes. In our study, the node that represents the selected cardiovascular adverse event of the accessed dataset is called the ‘central adverse event node’, considering that it occurs in all ICSRs of the dataset and therefore forms an edge with all other nodes in the networks built by the RW algorithm. These types of networks are called RW networks.
The topological weighting (TW) algorithm iterates on each possible edge and sets the edge weight based on the number of triangles in which the edge is included in the network. As described by Botsis et al., the TW method considers the triangle counts within the whole network, and it does not take into account the reporting frequencies. Triangles are defined as a subgraph of a network with three nodes and three edges. In these triangles, the nodes that belong to the investigated edge are called ‘base nodes’, while the node outside that edge is termed the ‘third node’. The TW algorithm can return three types of edge weights depending on the third node type considered during the calculation. If both types (drug and adverse event), only adverse event type, or only drug type nodes are considered as the third node during network building, the resulting network is called full- (TWFull), adverse event- (TWAE), or drug- (TWD) type of TW network, respectively. TWFull gives the number of co-reported adverse events and drugs with a certain edge; TWAE gives the number of adverse events co-reported with a certain edge; and TWD gives the number of drugs co-reported with a certain edge from the network. Edges with a weight of 0 by TW algorithm were excluded from the TW networks. If all edges of a given node were weighted 0, and therefore the node became isolated, then that node was excluded from the network.
In Fig. 2 an example of the networks built by the four edge weighting algorithms is shown. In this example, the first and second ICSRs both contain AMI as the reported adverse event, and cefalexin, nifedipine and rofecoxib as reported drugs (Fig. 2a). The third ICSR contains AMI and depression as adverse events, and cephalexin and nifedipine as drugs. In Fig. 2b, RW, TWFull, TWAE, and TWD networks from this set of ICSRs are visualized and calculated edge weights for all edges are presented.

Example networks were built by RW, TWFull, TWAE, and TWD algorithms. A The list of drugs and adverse events reported in three example ICSRs. B RW, TWFull, TWAE, and TWD networks are visualized from the ICSRs listed in (A). Acute myocardial infarction as the central adverse event node is visualized with dark green ovals, depression as the adverse event node is visualized with green ovals, and the drug nodes are visualized with blue diamonds. Calculated edge weights are presented on each edge by the number in squares. ICSRs individual case safety reports, RW report-based weighting, TWFull full topological weighting, TWAE adverse event topological weighting, TWD drug topological weighting
Vigilace™ performs the data processing, network building, edge weighting, and creation of GML output files. The GML file format is widely used to describe networks, as most of the network analysis software and libraries are equipped to process this format. Vigilace™ also creates CSV files with the node and edge attributes of the networks.
2.3.1 Network Characterization and Visualization
Each GML network file of the selected five cardiovascular ICSR datasets were loaded to the Cytoscape software [32] and characterized by overall node count, drug type node count (i.e. the number of coded drugs), adverse event type node count (i.e. the number of coded adverse events), and edge count (i.e. the number of connections among the nodes based on the applied edge weighting algorithm) with the built-in network analysis functions of Cytoscape. EntOptLayout plugin version 2.1 [33] for the Cytoscape software was used to visualize the networks and manual amendments were made for demonstration purposes.
2.3.2 Normalized Edge Weight for Signals (NEWS) Scores
We used the networks built by different edge weighting algorithms from the selected cardiovascular ICSR datasets for network-based signal detection. Here, we investigated only the drug–adverse event edges connected to their respective central adverse event node in the networks, as not all edges and weights could be included for other adverse event nodes in these networks, and thus only the central adverse event node-related DECs could be properly described with the created networks. In this study, NEWS scores of a drug–adverse event edge were calculated by normalizing the edge weight in the RW network by the corresponding edge weight in the TW networks. NEWS scores were considered 0 using our method, if the given TW algorithm would result in a 0 denominator. By this approach, we calculated three types of NEWS scores depending on the TW type in the denominator, and we termed them full-, adverse event-, and drug-type NEWS (NEWSFull, NEWSAE, NEWSD) scores as presented in Fig. 3a.

A Formulas of NEWS score calculation for a certain edge considering the RW, TWFull, TWAE, and TWD algorithms. B Edge weights of drug–adverse event edges between AMI, CEF, NIF, and ROF) nodes in networks presented in Fig. 2. C Calculated NEWSFull, NEWSAE, and NEWSD scores for drug–adverse event edges. * NEWS score was considered 0, if the given TW algorithm resulted in a 0 denominator. NEWS normalized edge weight for signals, RW report-based weighting, TWFull full topological weighting, TWAE adverse event topological weighting, TWD drug topological weighting, AMI acutemyocardial infarction, CEF cefalexin, NIF nifedipine, ROF rofecoxib, NEWSFull full topological weighting normalized edge weight for signals, NEWSAE adverse event topological weighting normalized edge weight for signals, NEWSD drug topological weighting normalized edge weight for signals
In Figs. 3b, c, an example is shown for the calculation of NEWS scores of certain edges of the networks described in Fig. 2. In this example, the central adverse event node was AMI, therefore only drug–adverse event edge weights in relation to AMI were calculated, while depression-related drug–adverse event edges were not. Figure 3b shows edge weights in the RW and TW networks of AMI, with cefalexin, nifedipine, and rofecoxib nodes. In Fig. 3c the NEWS scores for each drug–AMI edge were presented.
2.4 Signal Detection Analysis
AUROC analysis was used to assess the predictive value of the NEWS scores as a signal detection method.
The reference dataset for the analysis was prepared by merging SIDER [34] and IMI protect—Adverse Drug Reaction Database [35]. These databases contain known DECs that we used as positive controls in the AUROC analysis. Drug-adverse event edges that did not appear in this merged reference dataset were considered as negative controls.
ROR, which is the standard statistical signal detection method used by the EMA, was chosen for the control method to evaluate the signal detection efficiency of NEWS scores. For ROR calculation, all ICSRs would have been needed from the EudraVigilance database, therefore the ROR results and their 95% confidence interval lower bound values [ROR(−)] were provided, after additional data request, by the EMA. The equal comparability of ROR and NEWS scores was still ensured, considering that to investigate the selected cardiovascular adverse event-related DECs we needed the full dataset for ROR, but for NEWS score calculations the adverse event-related ICSRs were sufficient.
To determine whether the differences between the AUROC values of ROR(−), NEWSFull, NEWSAE, and NEWSD scores were significant, pairwise DeLong tests were applied [36] with a significance level of p < 0.05, and Bonferroni correction was applied to adjust for multiple comparisons. Assessment was performed using edges where all methods could be calculated. The same assessment was performed using edges over three reports for ROR calculations in order to provide a description of the dataset with the similar settings as in the ROR methods applied by the EMA [7]. This process was implemented using the R programming language [37] with pROC (v1.18.0) [38] and rjson (v0.2.20) [39] packages.
Receiver operating characteristic (ROC) curves were further analyzed for the investigation of sensitivity and specificity on different thresholds. Threshold was searched at which the NEWS scores yielded the same sensitivity as ROR(−) on signal level [ROR(−) >1], and at that threshold, specificity of the NEWS scores and ROR was compared. The classification differences of the positive and negative controls by ROR(−) and NEWS score methods were shown in a Venn diagram. The same procedure was repeated by searching NEWS thresholds for fixed specificity and comparing the sensitivities.
3 Results
3.1 Data Access
In the PRAC signal list (data cut-off date: February 2018), we identified five signals (temsirolimus–myocardial infarction, daclatasvir, sofosbuvir, sofosbuvir and ledipasvir–arrhythmia, human papillomavirus vaccine– postural orthostatic tachycardia syndrome (POTS), leflunomide-pulmonary hypertension (PH), agomelatine–QT prolongation) that satisfied our predefined criteria. As a result, the cardiovascular adverse event PTs were AMI, arrhythmia, POTS, PH, and ‘electrocardiogram QT prolonged’ (QTP, QT prolongation). We accessed all ICSRs of the selected five adverse events from the EudraVigilance database post-authorisation module on access level 2A in the form of five XLSX file packages (one for each adverse events) with a data cut-off date of July 2018.
The largest was the arrhythmia dataset with 26,028 ICSRs, while the POTS dataset was the smallest with only 539 ICSRs, as shown in Table 1. Only spontaneous ICSRs were processed further by Vigilace™.
3.2 Data Processing
We identified the drugs and adverse events that could not be coded using the dictionaries in Vigilace™. The number of ICSRs including non-coded drugs and adverse events is presented in electronic supplementary material (ESM) Table 1. Overall, 93 AMI, 314 arrhythmia, 6 POTS, 32 PH, and 468 QTP ICSRs were filtered out as these ICSRs did not have at least one successfully coded drug and at least one successfully coded adverse event node after data processing. The remaining, filtered ICSRs were used for network building.
3.3 Network Analysis
Drug–adverse event networks were built by the RW, TWFull, TWAE, and TWD algorithms, resulting in GML output files. These networks were analyzed to obtain the basic characteristics, such as overall node count, drug type node count, adverse event type node count, and edge count. The characteristics of RW networks for all five cardiovascular ICSR datasets are presented in Table 2. The characteristics of the three subtypes of TW networks are presented in ESM Tables 2, 3, and 4. The highest node and edge count were found in the RW networks for each cardiovascular dataset. TWFull networks contained the most edges among different types of TW networks. The edge count difference of TWFull networks compared with RW networks arose from those edges that were not included in triangles, therefore the respective edge weights were 0, while the node count difference represented the isolated nodes compared with RW networks. TWD networks contained the least edges among all networks, showing that more triangles existed with adverse event node as the third node. TWAE networks had less edges compared with TWFull networks, but the node counts were equal, representing that no node became isolated in TWAE networks due to these missing edges. TWD networks had the lowest node count, but only drug type nodes were isolated.
In order to identify possible structural characteristics, we visualized the networks by loading the GML files into Cytoscape. We found that the complete networks representing all nodes and edges (Fig. 4a) were not suitable for visual investigation, as these are too dense to identify separate modules. Therefore, only the sub-networks representing nodes connected by edges of the top 100 weights were visualized for demonstration purposes (Fig. 4b). The thickness of the edges shows the edge weight, meaning that the higher the weight is, the thicker the edge appears. In Fig. 5, the sub-networks for each edge weighting algorithm are presented for AMI. In Fig. 5a, the RW sub-network contains 29 adverse event nodes and 34 drug nodes besides the AMI central adverse event node. In this sub-network, rofecoxib (edge weight: 2543) and coronary artery disease (edge weight: 2157) edges have the highest weight with AMI among all drugs and adverse events. In Fig. 5b, the TWFull sub-network contains 28 adverse events and 12 drug nodes besides AMI, and acetylsalicylic acid (edge weight: 3822) and coronary artery disease (edge weight: 3592) edges have the highest weight. In Fig. 5c, the TWAE sub-network contains 29 adverse events and 8 drug nodes besides AMI, and acetylsalicylic acid (edge weight: 2443) and coronary artery disease (edge weight: 2690) edges have the highest weight. In Fig. 5d, the TWD sub-network contains 11 adverse events and 25 drug nodes besides AMI, and acetylsalicylic acid (edge weight: 1379) and chest pain (edge weight: 1017) edges have the highest weight.

Acute myocardial infarction RW network generated by Vigilace™ software and visualized in Cytoscape. A Visualization of the complete acute myocardial infarction RW network. B Sub-network representing nodes that were connected by edges of the top 100 weights and visualized for demonstration purposes for acute myocardial infarction. Nodes representing drugs are shown as blue diamonds, while nodes representing adverse events are shown as green ovals. Acute myocardial infarction as the central adverse event is labelled with dark green ovals. Edge thickness represents the weight. RW report-based weighted

Acute myocardial infarction networks visualized by different edge weighting algorithms. The panels represent the sub-networks containing the nodes that were connected by edges of the top 100 weights. Nodes representing drugs are shown as blue diamonds, while nodes representing adverse events are shown as green ovals. Acute myocardial infarction as the central adverse event is labelled with dark green ovals. Edge thickness represents the weight. A RW network; B TWFull network; C TWAE network; D TWD network. RW report-based weighted, TWFull full topological weighted, TWAE adverse event topological weighted, TWD drug topological weighted
Sub-networks of arrhythmia, POTS, PH, and QTP are visualized in ESM Figs. 1, 2, 3, and 4, respectively.
3.4 Signal Detection Analysis
3.4.1 Reference Dataset
The reference dataset of known drug–adverse event relationships was formed using the SIDER and IMI Protect—Adverse Drug Reaction Database. In this merged reference dataset for the drug–adverse event edges of our networks, 16, 306, 1, 30, and 90 positive controls were found for AMI, arrhythmia, POTS, PH, and QTP, respectively, for which all methods could be calculated. Based on the created edges, 1541 AMI, 1713 arrhythmia, 298 POTS, 1391 PH, and 1544 QTP negative controls were included in the analysis. Considering that there was only one positive control in the reference dataset for POTS, we excluded it from further analysis, as it did not provide sufficient amount of data for AUROC analysis.
3.4.2 Signal Detection Efficiency
In order to assess the performance of our novel NEWSFull, NEWSAE, and NEWSD scores for signal detection purposes, we performed AUROC analysis along with ROR(−) as the control method. All drug–central adverse event edges were included, where all methods could be calculated, and the reference dataset was used to determine the sensitivity and specificity at the different thresholds. AUROCs of different methods within the same selected cardiovascular ICSR dataset were compared with each other by DeLong test. In Fig. 6, the results of the AUROCs are presented, and the significance of the NEWS scores compared with ROR(−) values is indicated on the bar plots.

AUROC of full, adverse event, and drug normalized edge weight for signal scores (NEWSFull, NEWSAE, NEWSD) was compared with the AUROC of ROR(−) in acute myocardial infarction, arrhythmia, pulmonary hypertension, electrocardiogram QT prolonged networks. AUROCs were compared using the DeLong test (# indicates p < 0.05 without Bonferroni correction; * indicates adjusted p < 0.05 with Bonferroni correction). AUROC area under the receiver operating characteristic curve, ROR(−) 95% confidence interval lower bound of the reporting odds ratio, NEWSFull full topological weighting normalized edge weight for signals, NEWSAE adverse event topological weighting normalized edge weight for signals, NEWSD drug topological weighting normalized edge weight for signals
NEWSD and NEWSFull scores both performed significantly better on the AMI, PH, and QTP ICSR datasets (adjusted p < 0.05, with Bonferroni correction) compared with ROR(−). On the arrhythmia dataset, only NEWSD scores performed better compared with ROR(−) [AUROC 0.657 vs. 0.614, p-value < 0.05, without Bonferroni correction), while NEWSFull performed poorer in tendency on arrhythmia (0.608 vs. 0.614, p = 0.77).
We found that on three (arrhythmia, PH, QTP) of the four analyzed cardiovascular datasets, NEWSD scores yielded slightly more favourable results compared with NEWSFull scores (AMI 0.856 vs. 0.863; arrhythmia 0.657 vs. 0.608; PH 0.861 vs. 0.827, QTP 0.830 vs. 0.819).
NEWSAE score gave the lowest AUROC values among all methods on all four ICSR datasets. In comparison with ROR(−), it significantly performed poorer on arrhythmia (0.512 vs. 0.614, adjusted p < 0.05, with Bonferroni correction) and poorer on QTP (0.693 vs. 0.749, p < 0.05). NEWSAE performed better compared with ROR(−) in tendency on AMI (0.739 vs. 0.720, p = 0.77) and PH (0.725 vs. 0.720, p = 0.89).
To better understand the AUROC results, the ROC curves of the different datasets are presented in Fig. 7. These results show that the overall higher AUROCs of NEWSD and NEWSFull scores compared with the ROR(−) originate from higher sensitivity and specificity. Additionally, we determined the specificity at a fixed sensitivity level, set with an ROR(−) >1 signal threshold, for each method. On this threshold, the sensitivity was 0.688, 0.477, 0.667 and 0.744, while the specificity was 0.623, 0.692, 0.628 and 0.607 for AMI, arrhythmia, PH and QTP, respectively. On the same level of sensitivity, the specificity of NEWSD scores was 0.812, 0.727, 0.853 and 0.784, respectively.

ROC curves are presented for full, adverse event, and drug normalized edge weight for signals (NEWSFull, NEWSAE, NEWSD) scores, and ROR(−) on different adverse event datasets. Threshold was searched at which the NEWS scores yielded the same sensitivity as 1.001 ROR(−) signal threshold, and at that threshold the specificity of the NEWSD scores and ROR(−) was compared and was labelled with grey lines. A Acute myocardial infarction; B arrhythmia; C pulmonary hypertension; D electrocardiogram QT prolonged. ROC receiver operating characteristic, ROR(−) 95% confidence interval lower bound of the reporting odds ratio
The classification differences of the positive and negative controls in the reference dataset by ROR(−) and NEWSD scores were illustrated in Fig. 8 by Venn diagrams at a fixed sensitivity level of 1.001 ROR(−) signal threshold. Figure 8a, b show the true positive and true negative findings, while Figs. 8c, d show the false positive and false negatives. As the sensitivity is fixed, the true positive and false negative ratio is equal for both methods, while the true negative and false positive ratio shows that NEWSD scores have greater specificity at this sensitivity level.

Venn diagram of A true positive; B true negative; C false negative; and D false positive results of ROR(−) and NEWSD scores at a fixed sensitivity level of 1.001 ROR(−) signal threshold for acute myocardial infarction, arrhythmia, pulmonary hypertension, and QT prolongation. Reference data classified properly are included in A and B, while the falsely classified reference data are included in C and D. NEWSD drug topological weighting normalized edge weight for signals, ROR(−) 95% confidence interval lower bound of the reporting odds ratio
ESM Figs. 5 and 6 show similar representation for NEWSFull and NEWSAE scores, while ESM Data 1 provides the list of true positive findings (i.e. signals) of ROR and NEWS score-based classification. The results for fixed specificity are presented in ESM Figs. 7, 8, and 9, and ESM Data 2.
In ESM Fig. 10, we present a comparison of the AUROC values on bar plots, considering only edges with over three reports. These limited AUROC results were comparable with the results of the full analysis in Fig. 6. The ROC curves are shown for edges over three reports in ESM Fig. 11, where similar results were found as for the full dataset, except for arrythmia, where at a 1.001 ROR(−) signal threshold the ROR(−) yields slightly better specificity compared with NEWSD score (0.676 vs. 0.672) on sensitivity level 0.505. Elsewhere, the NEWSD score ROC curve shows higher sensitivity and specificity.
4 Discussion
We have shown here for the first time that network-based NEWS scores developed by us, can outperform the standard disproportionality-based ROR method. NEWSD score, which is the RW (i.e. the number of ICSRs in which the DEC appears), divided by the co-reported drug count in connection with a drug–adverse event edge in the network (TWD) performed better compared with ROR(−) on four different cardiovascular adverse event ICSR datasets.
We accessed all ICSRs of the selected cardiovascular adverse events from EudraVigilance. Cardiovascular adverse events were selected for analysis, as a high percentage of drug withdrawals were triggered by these adverse events in the postmarketing phase [26], and therefore a network theoretical description of such adverse events might improve future signal assessment. We included signals only where the adverse event was defined with a single PT, as we intended to describe the basic correlations of network-based statistical signal detection. If signals from higher MedDRA® levels or Standardized MedDRA Queries (SMQs) were included in the analysis, the impact of multiple nodes for the same event would have required a more complex assessment.
EudraVigilance access level 2A for academia was used as it allowed us to access more ICSR data fields in structured format compared with access level 1, which is the publicly available ICSR data for EudraVigilance on the www.adrreports.eu webpage. The features of the www.adrreports.eu website are useful in terms of transparency and ICSR analysis of certain active substances and products, but they are not suitable for statistical signal detection-related research due to the limitations of query functions. For a streamlined analysis of ICSR data from EudraVigilance, a user-friendly, web-based application, called Vigilace™ (www.vigilace.com), which is able to handle the reported drugs and adverse events of the ICSRs from EudraVigilance in access level 2A, was developed by our research group. Even the ICSR datasets published by the EMA contained non-coded data (i.e., that could not be associated with standardized drug names), therefore further data processing was needed. In the absence of a widely accepted method for handling such non-coded ICSR data, we applied additional drug coding in order to enable the inclusion of as many ICSRs as possible in the network analysis. Vigilace™ performs internal coding of data with the use of two drug dictionaries for reported drugs, and MedDRA® for reported adverse events, then builds a set of networks from the filtered ICSRs for further network analysis. Currently, there are only a limited number of publicly available tools that allow network theoretical analysis on ICSR datasets [1, 20, 23, 29, 40, 41], therefore we believe that Vigilace™ could facilitate the related research projects. For this purpose, the use of Vigilace™ is free of charge for academic research.
In order to develop and test our network-based signal detection metrics, the five selected cardiovascular ICSR datasets were processed by Vigilace™. After ICSR filtering, 96.5–99.6% of the spontaneous ICSRs were kept for further analysis. Based on the data loss, we found that MedDRA® [28] provided a solid framework for standardized adverse event coding, however for drug coding, there were no such efficient dictionary, which made the data processing challenging. The International Organization for Standardization (ISO) for the identification of medicinal products (IDMP) standards [42] might help to solve this problem in the future, as more structured data will be available for drug data.
Vigilace™ built four networks from the ICSRs that allowed us to investigate the network characteristics of selected cardiovascular adverse events (AMI, arrhythmia, POTS, PH, QTP) using report-based and topological edge weighting algorithms (RW, TWFull, TWAE, TWD), as described by Botsis et al. [29]. Our network analysis proved that the different edge weighting algorithms highlight distinct characteristics of each dataset. The networks and network edges alone are not suitable for signal detection, and high edge weight does not necessarily imply a signal. For example, in the Results section, we described acetylsalicylic acid with the highest edge weight for all AMI TW networks. However, without normalization, this result only shows that the acetylsalicylic acid–AMI edge was co-reported with the most adverse events and drugs, which, for example, can be caused by bystander effect [43]. We also need to take into account that the TW algorithm uses all created triangles within the networks irrespective of the reporting frequency, therefore a single report contributes with the same weight as the most co-reported drugs. There are methods to filter out such week associations in the network field [44], however, in signal detection, they need to be applied carefully, as by removing weak links from networks may result in losing weak true associations. In the future, by further improving our network theoretical approach, we might be able to incorporate not just mathematical descriptions for single drug–adverse event relationships but also a comprehensive description for multiple drug–drug, adverse event–adverse event, and drug–adverse event relationships. This might help us to solve the problem of confounders in the case of the currently used disproportionality methods, and to also include simple drug interaction analysis based on spontaneous reporting datasets.
In our present study, we hypothesized that the high number of overall reported drugs with a DEC reduces the chance that there is real causal relationship between the drug and the adverse event included in the DEC. To prove this, we calculated the so-called NEWS scores, of which the NEWSD score was suitable to investigate this hypothesis. In this study, drug–adverse event edges in connection with a given central adverse event node were analyzed, as sufficient data for NEWS scores calculation were available only for the related edges of requested central nodes in the accessed ICSR datasets. In contrary to the ROR, which requires all ICSRs within the database, to calculate NEWS scores for DECs of an adverse event it is sufficient to have only those ICSRs that contain the investigated adverse event. These less-limiting data requirements for the application of NEWS scores can be an advantage over the ROR method.
The AUROC analysis showed that NEWSD scores perform better compared with ROR(−) on the selected cardiovascular ICSR datasets. By investigating the ROC curves, we demonstrated that the gain of AUROC compared with ROR(−) is in connection to the overall higher sensitivity and specificity. These results show the potential of the original edge weighting algorithms by Botsis et al., and suggest that higher numbers of overall co-reported drugs and adverse events occurring with a given edge (i.e. DEC in signal detection) reduces the chances of having a real connection between the investigated drug–adverse event pair. Previous publications in the ICSR network analysis field were mainly focused on descriptive analysis of spontaneous reporting databases [18, 19, 30], while other studies provided support for case review during signal evaluation by network visualization [23, 29], or described certain adverse events [21, 22]. Furthermore, two recent studies applied network metrics for signal detection purposes [24, 25], but the approach was different from NEWS scores.
These findings highlighted that investigating ICSR networks during signal detection might have added value, as it can describe the characteristics of connections among not just drug–adverse events within the ICSRs but also adverse event–adverse event and drug–drug interaction with additional signal detection-related metrics.
4.1 Limitations
The first limitation of this study was that only five adverse events were accessed, from which only four were analyzed, therefore an extension of this study is required in order to better generalize our observations regarding NEWS scores. To limit this identified bias, an additional data request that would allow the full analysis based on our coding standards was submitted, to access all ICSRs within EudraVigilance, but it was not supported by the EMA. Nevertheless, NEWSD scores showed promising performance in four of four ICSR datasets, which is robust evidence for the utility of such metrics.
The lack of proper data standards further limited our study, as the accessed ICSRs contained data that could not be mapped against XEVMPD, and therefore EMA provided them in the originally reported text format. As no IDs were available in the dataset, a repeated coding was applied, which carries the risk of not fully coding in line with EudraVigilance. To manage this limitation, the same dictionary was used as that used by the EMA. To limit the excluded ICSRs due to missing drugs within the network representation, additional coding was applied by DrugBank IDs, however this might have an effect on the comparability with ROR calculations by the EMA.
The filtering settings of ICSRs based on report types, drug roles, inclusion and exclusion criteria might also have an impact on the results of this study.
The limited and out-of-date reference datasets of known DECs are plaguing the proper evaluation of performance for signal detection methods. Both applied reference datasets were text-mined from product information, but those mining algorithms had their own limitations, therefore one needs to account for additional false positive and false negative relationships. We did not apply internal text-mining algorithms to produce our own reference dataset, as that would have exceeded the scope of our current work; hence, we worked with the widely used datasets of the SIDER and IMI Protect projects to allow comparability. The eProduct Information approach, which is planned to be introduced in the future by EMA, might solve this issue, given that it will also be available for research purposes. [45]
5 Conclusions
This is the first demonstration of using edge-weighting normalization-based metrics for statistical signal detection purposes. Our results showed that RW normalized by TW of co-reported drugs, termed NEWSD score, can perform better when compared with ROR(−), which is promising for the application of network analysis on signal detection, therefore we are planning to further develop our approach.
The Vigilace™ software was developed for the network-based analysis of ICSR data, which could facilitate the research on this field and the calculation of NEWS scores for the improvement of signal detection. Vigilace™ is a flexible, user configurable, web-based application for the purpose of building and analyzing networks from selected ICSRs. Vigilace™ could be a useful tool for researchers in the investigation of the possible further applications of network metrics, and may lead to beneficial effects in drug safety.
References
Lindquist M. VigiBase, the WHO Global ICSR Database System: basic facts. Drug Inf J. 2008;42:409–19.
FDA Adverse Event Reporting System (FAERS). https://www.fda.gov/drugs/drug-approvals-and-databases/fda-adverse-event-reporting-system-faers. Accessed 6 Jun 2022.
EudraVigilance | European Medicines Agency. https://www.ema.europa.eu/en/human-regulatory/research-development/pharmacovigilance/eudravigilance. Accessed 6 Jun 2022.
European Medicines Agency. 2020 Annual Report on EudraVigilance for the European Parliament, the Council and the Commission. 2020. https://www.ema.europa.eu/en/documents/report/2020-annual-report-eudravigilance-european-parliament-council-commission_en.pdf
Bate A, Evans SJW. Quantitative signal detection using spontaneous ADR reporting. Pharmacoepidemiol Drug Saf. 2009;18:427–36.
Candore G, Juhlin K, Manlik K, Thakrar B, Quarcoo N, Seabroke S, et al. Comparison of statistical signal detection methods within and across spontaneous reporting databases. Drug Saf. 2015;38:577–87.
Screening for adverse reactions in EudraVigilance. EMA/849944/2016. 2016. https://www.ema.europa.eu/en/documents/other/screening-adverse-reactions-eudravigilance_en.pdf. Accessed 6 Jun 2022.
IME list inclusion-exclusion criteria | Enhanced Reader. moz-extension://5e9ac340-9326-460e-810f-793f4312e4d6/enhanced-reader.html?openApp&pdf=https%3A%2F%2Fwww.ema.europa.eu%2Fen%2Fdocuments%2Fother%2Feudravigilance-inclusion%2Fexclusion-criteria-important-medical-events-list_en.pdf. Accessed 17 Dec 2018.
Postigo R, Brosch S, Slattery J, van Haren A, Dogné JM, Kurz X, et al. EudraVigilance medicines safety database: publicly accessible data for research and public health protection. Drug Saf. 2018;41:665–75.
European Medicines Agency. European Medicines Agency policy on access to EudraVigilance data for medicinal products for human use. EMA/759287/2009 Revis. 4. 2019. https://www.ema.europa.eu/en/documents/other/european-medicines-agency-policy-access-eudravigilance-data-medicinal-products-human-use-revision-4_en.pdf.
Caster O, Sandberg L, Bergvall T, Watson S, Norén GN. vigiRank for statistical signal detection in pharmacovigilance: first results from prospective real-world use. Pharmacoepidemiol Drug Saf. 2017;26:1006–10.
Reps JM, Garibaldi JM, Aickelin U, Gibson JE, Hubbard RB. A supervised adverse drug reaction signalling framework imitating Bradford Hill’s causality considerations. J Biomed Inform. 2015;56:356–68.
Li J, Ji X, Hua L. Improving the prediction of adverse drug events using feature fusion-based predictive network models. IEEE Access. 2020;8:48812–21.
Ahmed I, Dalmasso C, Haramburu F, Thiessard F, Broët P, Tubert-Bitter P. False discovery rate estimation for frequentist pharmacovigilance signal detection methods. Biometrics. 2010;66:301–9.
Ahmed I, Thiessard F, Miremont-Salamé G, Bégaud B, Tubert-Bitter P. Pharmacovigilance data mining with methods based on false discovery rates: a comparative simulation study. Clin Pharmacol Ther. 2010;88:492–8.
Raschi E, Fusaroli M, Ardizzoni A, Poluzzi E, De Ponti F. Cyclin-dependent kinase 4/6 inhibitors and interstitial lung disease in the FDA adverse event reporting system: a pharmacovigilance assessment. Breast Cancer Res Treat. 2021. https://doi.org/10.1007/s10549-020-06001-w.
Avillach P, Salvo F, Thiessard F, Miremont-Salamé G, Fourrier-Reglat A, Haramburu F, et al. Pilot evaluation of an automated method to decrease false-positive signals induced by co-prescriptions in spontaneous reporting databases. Pharmacoepidemiol Drug Saf. 2014;23:186–94.
Botsis T, Ball R. Network analysis of possible anaphylaxis cases reported to the US vaccine adverse event reporting system after H1N1 influenza vaccine. Studies in Health Technologies and Informatics. New York: IOS Press; 2011. p. 564–8. https://doi.org/10.3233/978-1-60750-806-9-564.
Scott J, Botsis T, Ball R. Simulating adverse event spontaneous reporting systems as preferential attachment networks: application to the vaccine adverse event reporting system. Appl Clin Inform. 2014;5:206–18.
Nazir A, Ichinomiya T, Miyamura N, Sekiya Y, Kinosada Y. Identification of suicide-related events through network analysis of adverse event reports. Drug Saf. 2014;37:609–16.
Kim MG, Jeong CR, Kim HJ, Kim JH, Song YK, Kim KI, et al. Network analysis of drug-related problems in hospitalized patients with hematologic malignancies. Support Care Cancer. 2018;26:2737–42.
Martinez-De la Torre A, van Weenen E, Kraus M, Weiler S, Feuerriegel S, Burden AM. A network analysis of drug combinations associated with acute generalized exanthematous pustulosis (AGEP). J Clin Med. 2021;10:4486.
Botsis T, Jankosky C, Arya D, Kreimeyer K, Foster M, Pandey A, et al. Decision support environment for medical product safety surveillance. J Biomed Inform. 2016;64:354–62.
Fusaroli M, Raschi E, Gatti M, De Ponti F, Poluzzi E. Development of a network-based signal detection tool: the COVID-19 adversome in the FDA adverse event reporting system. Front Pharmacol. 2021;12:3542. https://doi.org/10.3389/fphar.2021.740707/full.
Lavertu A, Hamamsy T, Altman RB. Quantifying the severity of adverse drug reactions using social media: network analysis. J Med Internet Res. 2021;23(10): e27714.
Onakpoya IJ, Heneghan CJ, Aronson JK. Worldwide withdrawal of medicinal products because of adverse drug reactions: a systematic review and analysis. Crit Rev Toxicol. 2016;46:477–89.
PRAC recommendations on safety signals | European Medicines Agency. https://www.ema.europa.eu/en/human-regulatory/post-authorisation/pharmacovigilance/signal-management/prac-recommendations-safety-signals. Accessed 6 Jun 2022.
Brown EG, Wood L, Wood S. The medical dictionary for regulatory activities (MedDRA). Drug Saf. 1999;20(2):109–17.
Botsis T, Scott J, Goud R, Toman P, Sutherland A, Ball R. Novel algorithms for improved pattern recognition using the US FDA adverse event network analyzer. Studies in health technologies and informatics. New York: IOS Press; 2014. p. 1178–82. https://doi.org/10.3233/978-1-61499-432-9-1178.
Davazdahemami B, Delen D. A chronological pharmacovigilance network analytics approach for predicting adverse drug events. J Am Med Informatics Assoc. 2018;25:1311–21.
Wishart DS, Feunang YD, Guo AC, Lo EJ, Marcu A, Grant JR, et al. DrugBank 5.0: A major update to the DrugBank database for 2018. Nucleic Acids Res. 2018;46:D1074–82.
Shannon P, Markiel A, Ozier O, Baliga NS, Wang JT, Ramage D, et al. Cytoscape: A software Environment for integrated models of biomolecular interaction networks. Genome Res. 2003;13:2498–504.
Ágg B, Császár A, Szalay-Bekő M, Veres DV, Mizsei R, Ferdinandy P, et al. The EntOptLayout Cytoscape plug-in for the efficient visualization of major protein complexes in protein–protein interaction and signalling networks. Valencia A, editor. Bioinformatics. 2019;35:4490–2.
Kuhn M, Letunic I, Jensen LJ, Bork P. The SIDER database of drugs and side effects. Nucleic Acids Res. 2016;44:D1075–9.
PROTECT Home. http://www.imi-protect.eu/adverseDrugReactions.shtml. Accessed 13 Jan 2018.
DeLong ER, DeLong DM, Clarke-Pearson DL. Comparing the areas under two or more correlated receiver operating characteristic curves: a nonparametric approach. Biometrics. 1988;44:837–45. https://doi.org/10.2307/2531595.
R: The R Project for Statistical Computing. https://www.r-project.org/. Accessed 6 Jun 2022.
Robin X, Turck N, Hainard A, Tiberti N, Lisacek F, Sanchez JC, et al. pROC: an open-source package for R and S+ to analyze and compare ROC curves. BMC Bioinform. 2011;12:77. https://doi.org/10.1186/1471-2105-12-77.
CRAN—Package rjson. https://cran.r-project.org/web/packages/rjson/index.html. Accessed 6 Jun 2022.
Zhang Y, Wu P, Luo Y, Tao C. Identification of sex-associated network patterns in Vaccine-Adverse Event Association Network in VAERS. J Biomed Semantics. 2015;6:33.
Tao C, Wu P, Luo Y, Zhang Y. Linked vaccine adverse event data from VAERS for biomedical data analysis and longitudinal studies. BioData Min. 2014;7:36.
Data on medicines (ISO IDMP standards): Overview | European Medicines Agency. https://www.ema.europa.eu/en/human-regulatory/overview/data-medicines-iso-idmp-standards-overview. Accessed 6 Jun 2022.
Dijkstra L, Garling M, Foraita R, Pigeot I. Adverse drug reaction or innocent bystander? A systematic comparison of statistical discovery methods for spontaneous reporting systems. Pharmacoepidemiol Drug Saf. 2020;29:396–403.
Epskamp S, Borsboom D, Fried EI. Estimating psychological networks and their accuracy: a tutorial paper. Behav Res Methods. 2018;50:195–212.
European Medicines Agency. Electronic product information for human medicines in the EU: key principles A joint EMA-HMA-EC collaboration. https://www.ema.europa.eu/en/electronic-product-information-human-medicines-european-union-key-principles. Accessed 6 Jun 2022.
Author information
Authors and Affiliations
Corresponding author
Ethics declarations
Funding
Open access funding provided by Semmelweis University. This study was supported by the National Research, Development and Innovation Office of Hungary (NKFIA; NVKP-16-1-2016-0017 National Heart Program). The Ministry for Innovation and Technology in Hungary provided funding to this study under Thematic Excellence Programme (2020-4.1.1.-TKP2020), 2020-1.1.5-GYORSÍTÓSÁV call programme (2020-1.1.5-GYORSÍTÓSÁV-2021-00011), TKP2021-EGA funding scheme (TKP2021-EGA-23), Research Excellence Programme (TKP/ITM/NKFIH). This study was also supported by Project no. RRF-2.3.1-21-2022-00003 implemented with the support provided by the EU. BÁ was supported by the New National Excellence Program of the Ministry for Innovation and Technology from the National Research, Development and Innovation Fund source (ÚNKP-20-4-I-SE-7, ÚNKP-21-4-II-SE-18), and MP was supported by EFOP-3.6.3-VEKOP-16-2017-00009 “Semmelweis 250+ Kiválósági PhD Ösztöndíj” grant.
Conflict of Interest/Competing Interests
PF is the founder and CEO of, and BÁ is employed by, Pharmahungary Group, a group of research and development (R&D) companies (www.pharmahungary.com) and the provider of Vigilace™. MP is the founder and CEO of Sanovigado Kft, a pharmaceutical consultancy and R&D company. BB, OB, and BP declare they have no conflicts of interest.
Ethical Approval
Ethics approval was obtained from the Semmelweis University Regional and Institutional Committee of Science and Research Ethics (SE RKEB 82/2018)
Consent to Participate
This study was based on administrative claims data and therefore did not require patient consent.
Consent for Publication
Not applicable.
Availability of Data and Material
Unpublished data related to this study are available from the corresponding author on reasonable request.
Code Availability
The code is the intellectual property of Pharmahungary Group and Semmelweis University.
Author Contributions
MP: Software coding and architecture design; study design; data curation, analysis, and interpretation; drafting of the manuscript. BB: Statistical analysis, data interpretation. OB, BP: Software coding. BÁ: Software architecture, study design, data interpretation, critical revision of the manuscript. PF: Funding acquisition, study design, critical revision of the manuscript. All authors read and approved the final manuscript.
Supplementary Information
Below is the link to the electronic supplementary material.
Rights and permissions
Open Access This article is licensed under a Creative Commons Attribution-NonCommercial 4.0 International License, which permits any non-commercial use, sharing, adaptation, distribution and reproduction in any medium or format, as long as you give appropriate credit to the original author(s) and the source, provide a link to the Creative Commons licence, and indicate if changes were made. The images or other third party material in this article are included in the article's Creative Commons licence, unless indicated otherwise in a credit line to the material. If material is not included in the article's Creative Commons licence and your intended use is not permitted by statutory regulation or exceeds the permitted use, you will need to obtain permission directly from the copyright holder. To view a copy of this licence, visit http://creativecommons.org/licenses/by-nc/4.0/.
About this article

Cite this article
Pétervári, M., Benczik, B., Balogh, O.M. et al. Network Analysis for Signal Detection in Spontaneous Adverse Event Reporting Database: Application of Network Weighting Normalization to Characterize Cardiovascular Drug Safety. Drug Saf 45, 1423–1438 (2022). https://doi.org/10.1007/s40264-022-01225-9
Accepted:
Published:
Issue Date:
DOI: https://doi.org/10.1007/s40264-022-01225-9