
Abstract
While the Sustainable Development Goals (SDG) are broadly framed with 17 goals, the goals and their targets inherently connect with each other forming a complex system. Actions supporting one goal may influence progress in other goals, either positively (synergies) or negatively (trade-offs). Effective managing the synergies and trade-offs is a prerequisite for ensuring policy coherence. This is particular relevant at the river basin scale where the implementation of national policies may generate inequalities at the sub-basin levels, such as the upstream and the downstream. In the existing literature, there is still a lack of methodologies to assess the SDG interlinkages and their differences at the subnational levels. This paper presents a methodology on the development of an SDG interlinkages analysis model at the basin scale and its application to a case study in China’s Luanhe River Basin (LRB). Seven broad areas, namely land use and land cover change, climate change, ecosystem services, flood risks, water sector, urbanisation, and energy, were set as the scope of study. Through a systematic review, key elements of the SDG interlinkages system were identified and their interactions were mapped. The resulting generic SDG interlinkages model were validated with expert survey and stakeholders’ consultation and tailored to the LRB. Quantification of the SDG interlinkages was conducted for 27 counties in the LRB and demonstrated by the results of 3 selected counties located in the upstream, midstream and downstream areas, respectively. The methodology and its applications can be used to support integrated water resource management in river basins.
Introduction
The 2030 Agenda charts out a set of 17 Sustainable Development Goals (SDGs) explicitly combining the economic, environmental and social dimensions of sustainability (United Nations 2015). The SDGs cover a diverse range of issues such as poverty (SDG1), education (SDG4), inequality (SDG10), and climate change (SDG13), in separate goals. These goals, however, do not exist independently from each other; rather, the SDGs and associated targets all interact at a deeper level, through inextricable links. Actions supporting one goal or target may influence progress in other goals or targets, either positively (synergies) or negatively (trade-offs). Improved agricultural productivity (Target 2.3), for instance, can help address hunger (Target 2.1) and nutrition (Target 2.2), but may intensify water use, affecting access to water and sanitation (Targets 6.1 and 6.2). Policy formulation, therefore, needs to break away from silo-based thinking and take SDG interlinkages into account (UNDG 2015). For example, the 2030 Agenda notes the SDGs’ “integrated and indivisible” nature (United Nations 2015), but fails to explain how the goals are interconnected. To address this issue, a Working Group within the Inter-Agency and Expert Group on SDG Indicators (IAEG-SDGs) was mandated to define these intrinsic interlinkages (UNSD 2016). Meanwhile, many scholars, think-tanks and international agencies have highlighted the presence of synergies and trade-offs across the SDGs, with some of them providing concepts and analytical frameworks to better comprehend and assess the interlinkages (see, for example, Le Blanc 2015; Nilsson et al. 2016a, b; ICSU 2017; UNESCAP 2017; Zhou and Moinuddin 2017; Weitz et al. 2018; Miola et al. 2019; Zhou et al. 2019). Le Blanc (2015) and Zhou and Moinuddin (2017) suggested looking at SDG interconnectedness from a network perspective, while Nilsson et al. (2016a, b) offered a seven-scale framework for the interactions among the SDGs. ICSU (2017) used this framework to provide a detailed analysis of selected goals and targets. UNESCAP (2017) mapped the interactions of the water targets (Goal 6) with other SDGs comprehensively but did not consider the integrated management aspect of water resources. Methodologies that provide options for quantifying the SDG interlinkages include the works of Zhou et al. (2019) and Miola et al. (2019).
The approaches to address SDG interlinkages thus have been a mix of data-driven methodologies, stakeholders’ consultation and expert opinion. Each approach may have its own advantages and disadvantages. A stakeholders’ consultation-based approach may provide useful insights into the context of the SDG interlinkages in a certain geographical area, but can be biased by the selection of the stakeholders. An expert opinion-based approach can provide very detailed and rich sector-specific information (such as UNESCAP 2017). However, as the SDGs cover a very wide range of issues, expert opinion-based approaches are more suitable for specific thematic discussions rather than the whole set of the SDGs. Data-driven approaches can capture the real situation of the SDG indicators, and the interlinkages among the SDGs, using real-life data. But a solely data-driven statistical approach may overlook the context and the theoretical basis of the causal links among the SDGs. Data-driven approaches are also compromised by the quality and quantity of available data. In brief, a combination of data-driven approaches based on a solid literature review, expert opinion and stakeholders’ consultation may be more effective in identifying and quantifying the interlinkages.
Despite these early-stage studies on SDG interactions, there is still a lack of methodologies and frameworks to address many other critical issues. For instance, aside from national policies, SDG interlinkage is also important in subnational policies. How two SDG targets interact with each other may differ across regions even within a country. The spatial dimensions, such as inter-regional interactions, also merit attention. For example, within a river basin, fishing practices in upstream areas may be synergistic with the local economy and society but may lead to water pollution downstream. Some recent initiatives such as UN-Habitat’s efforts to develop a Global Urban Monitoring Framework have noted the importance of interlinkages among different dimensions of development in local policymaking (UN-Habitat 2021). Some authors such as Patole (2018) and Saner et al. (2017) stressed the importance of SDG localisation. However, existing literature does not offer any methodological framework on the context-specific and spatial dimensions of SDG interlinkages.
Available studies on watersheds mostly focus on the physical environmental aspects, such as hydrological processes or ecosystems. Many studies (such as Bangash et al. 2013; Islam and Gan 2015; Nepal 2016; Nkhonjera and Dinka 2017; Trang et al. 2017; de Oliveira et al. 2019; Yang et al. 2020) analysed how climate change, land use change and other factors affect hydrological processes, and some studies assessed the impacts on ecosystems (such as Guo et al. 2013; Val et al. 2016; Johnston et al. 2017; Cheng et al. 2018; Wei et al. 2018; Zhou et al. 2020). However, the socio-economic aspects of basin dynamics received little attention. Among the few studies, Wang et al. (2017) assessed how human well-being, including income, is impacted by changes in land use and ecosystem services. The assessment methodology is also important—many existing literatures adopted hydrological models (Dahal et al. 2020; Shadmehri Toosi et al. 2019; Yang et al. 2019), system dynamics (Bakhshianlamouki et al. 2020; De Stercke et al. 2020), or GIS technics (Gebremicael et al. 2018; Luo et al. 2020; Morelli et al. 2014). However, there is a gap in studies that consider river basin dynamics from a holistic and integrated SDGs framework that includes the interconnectedness of the SDGs.
Under the Living Luanhe Lab project (https://luanhelivinglab.home.blog/), this study developed an SDG interlinkages analysis model at the river basin scale. River basins provide an example of connectivity among spatially distributed natural resources, such connectivity ranging from ‘fully connected to disconnected over diverse temporal and spatial scales’ (Wohl 2017). River basins also demonstrate clear hydrological boundaries. Consequently, movements of natural resources among the spatial units define how the supply and demand of these resources are interconnected. This physical interconnectedness affects and is affected by anthropogenic activities in the economic and social spheres.
Seven broad areas, namely land use and land cover change, climate change, ecosystem services, flood risk, water sector, urbanisation, and energy, were set as the scope of study under the Living Luanhe Lab project due to their importance in the human–environment interactions at the basin scale. Through a rigorous systematic review of the literature in the seven areas, key elements of the SDG interlinkages system were identified and their interactions were mapped. The resulting generic SDG interlinkages model for basins were validated with expert survey and stakeholders’ consultation and further customised to China’s Luanhe River Basin (LRB), which was selected for the case study. Quantification of the SDG interlinkages in LRB was conducted based on the data collected at the county level. The results of three counties located in the upstream, midstream and downstream areas, respectively, were selected to demonstrate the common features as well as the spatial differences in SDG interlinkages in LRB.
Located in the northeast of the North China Plain, LRB comprises a population of about 5.4 million over an area covering roughly 45,000 km2. The basin provides significant ecological benefits in the form of freshwater provision and sandstorm prevention for several major cities, including Beijing and Tianjin. However, human activities such as agriculture and urbanisation, together with imbalanced and unsustainable economic development have heavily stressed the basin’s capacities (“Luanhe Living Lab” project team 2020). The basin already faces decreasing quantity and quality of water resources, which are expected to further drop and degrade in the future. Climate change-induced impacts on precipitation and water loss are also likely to lead to deterioration of water availability and quality (“Luanhe Living Lab” project team 2020). Balancing the interactions between human and the environment, especially land use change and water and other ecosystem services, will thus be important to ensure the basin’s sustainability.
This paper aims to develop a generic methodology to analyse SDG interlinkages at the river basin scale and apply to a specific case study in the LRB. It is hoped that the knowledge built from this study and its application to the case study in LRB can be used for sustainable water resource management in other river basins.
Section 2 describes the SDG interlinkages analysis methodology, including a systematic review and integration of a statistical analysis with other analytical modelling results to quantify the interlinkages. Section 3 applies the methodology to develop three analytical cases in the LRB. Section 4 discusses the results and Sect. 5 concludes the paper.
Methodology
The present study, built on the methodology of the SDG Interlinkages Analysis and Visualisation Tool (V4.0) (https://sdginterlinkages.iges.jp/visualisationtool.html), developed an SDG interlinkages analysis model for the identification and quantification of SDG interlinkages at the basin scale and applied to the LRB.
Methodology of the SDG Interlinkages Analysis and Visualisation Tool and its extension to the river basin scale
The SDG Interlinkages Analysis and Visualisation Tool, hereafter referred to as the SDG Interlinkages Tool, was developed to enable visualisation of quantitative SDG interlinkages at the national level for 27 countries in Asia and Africa (Zhou et al. 2019), and has been used in various studies for analysing SDG synergies and trade-offs (Baffoe et al. 2021; Somanje et al. 2020; Zhou and Moinuddin 2021). It is included in the Toolboxes of ESCAP’s SDG Helpdesk (ESCAP, n.d.) and was selected as one of the successful practices/tools for exhibition at the UN 2020 High-level Political Forum (United Nations 2020).
The existing methodology, developed for analysis at the national level, cannot reflect the spatial differences (such as upstream vs. downstream areas) in SDG interlinkages in a river basin. In addition, the interactions among land use and land cover change, climate change, ecosystem services, land degradation and soil erosion, water availability, sediment yield, irrigation water use, water quality and groundwater level, etc. which are specific and important to the sustainable development in river basins, are not covered in the national level studies. To capture these features, the present study extended the existing methodology to the basin scale.
The methodology includes four steps (Zhou and Moinuddin 2017), as shown in Fig. 1.

Methodology on the identification, quantification and visualisation of the SDG interlinkages at the national level and its extension to the basin scale
Step I refers to the identification of the causal links between the SDG targets and building a qualitative SDG interlinkages model. Pairwise linkages, defined by causation, indicate the impacts of one target on the other. Identification of the causal relationships for the study at the national level is based on a literature review (Zhou and Moinuddin 2017). In the present study, a systematic review on the key elements of sustainable development and their interactions at the basin scale was conducted to build a generic qualitative interlinkage model for river basins. The generic model was further validated and tailored to the LRB through expert survey and stakeholders’ consultation.
Step II refers to the identification of the indicators with trackable data for the SDG targets. At the national level study, the global SDG indicators (United Nations Statistical Commission 2018) were used. When indicators or relevant data are not available, other proxy indicators (e.g. the World Bank’s World Development Indicators) were used. For the present study in the LRB, indicators for the variables defined in the qualitative SDG interlinkages model were identified based on various statistics in China and the results from other work packages under the Luanhe Living Lab project.
Under the Luanhe Living Lab project, there are four work packages (WP). WP1 investigated historical changes in land use at the basin scale and developed future land use change scenarios by engaging with a range of stakeholders (Xu et al. 2021b). WP2 modelled flood risk and impacts under various land use and infrastructure change scenarios (Zhao et al. 2021). WP3 evaluated the main ecosystem services and disservices derived from various land use changes in the LRB (Xu et al. 2021a). WP4 is the SDG interlinkages analysis at the basin scale, which is the present study. Inputs from WPs 1–3 were used for the SDG interlinkages analysis.
In WP1, the land use and land cover change (LULCC) scenarios were developed based on different socio-economic development and environmental protection targets, local plans and policies in the LRB, and the results from a stakeholders’ workshop in Tianjin, China. LULCC under four future scenarios for 2015–2030 was simulated using the CLUMondo model, a model for the assessment of the dynamics of spatial land system change, based on the land system map of the LRB in 2000 and other statistical data (refer to Xu et al. () for details). Results from WP1 on the major drivers to LULCC, including crop production, livestock production, forestry, urbanisation, as well as the LULCC of six major land types, i.e. cropland, forest, grassland, built-up land, water area, and unused land, were used for the SDG interlinkages analysis.
In WP2, the High-Performance Integrated hydrodynamic Modelling System (HiPIMS) model (Xia et al. 2019) was set up using openly available digital elevation model (DEM) data and the land use maps generated from WP1 to predict the inundation maps and assess flood impact. The severe flood event caused by the heavy rainfall brought in by Typhoon Saola and Damrey in 2012 was simulated for model calibration. Considering also two climate scenarios, Representative Concentration Pathway (RCP) 4.5 and RCP 8.5, as well as construction of key infrastructure (i.e. dams and reservoirs), a total of 28 flood scenarios were simulated for the four projected LULCC scenarios from WP1 (refer to Zhao et al. (2021) for details). The simulation and impact analysis results, in terms of the inundation levels/extents of six major land use types and the flood impact on human lives were used to support the SDG interlinkages analysis.
In WP3, ecosystem services, including provisioning, regulating and cultural services, provided by the six land system types in the LRB were assessed through a stakeholder participatory approach (refer to Xu et al. (2021a) for details. Based on the LULCC results from WP1, changes in various ecosystem services were assessed and were used for the SDG interlinkages analysis.
Step III refers to the collection of the time-series data for the identified indicators. For the national level study, the Global SDG Database (UNDESA 2019) was used as the major data source. For the present study, time-series data (2005–2018) for the indicators identified by Step II were collected for 27 counties located in the LRB based on various statistics in China and the results from WPs 1–3 (see Fig. 2). The indicators used in the interlinkages analysis and their data sources are provided in Appendix 1.
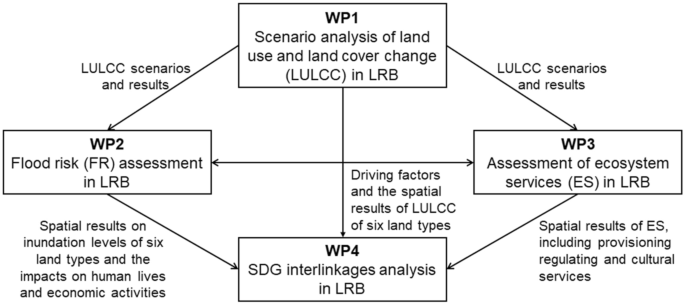
Inputs from Work Packages 1–3 to the quantification of the SDG interlinkages model
Step IV refers to the quantification of the SDG interlinkages built in Step I. A Pearson correlation analysis was conducted for the quantification of the pairwise linkages using the time-series data collected for the indicators from Step III. The correlation coefficient, ranging between [− 1, 1], refers to the linear relationship between the pairs—a positive coefficient representing a positive relationship and a negative coefficient representing a negative relationship.
Systematic review
A systematic review (SR) was conducted following the preferred reporting items for systematic reviews and meta-analyses (PRISMA) (Moher et al. 2009) to ensure replicability and transparency. The included papers and studies were further analysed through a quasi-automatic text analysis and content analysis to extract useful information for the identification of the key elements in the SDG interlinkages system and mapping their interactions at the basin scale.
Purpose and scope of the systematic review
Purpose of the systematic review
The purpose of conducting an SR is to extract useful information and synthesise it to help answer two research questions: (i) What are the key elements for achieving sustainable development in river basins? and (ii) How do the key elements interact with each other to achieve sustainable development in river basins? The first question addresses the identification and selection of key elements in the system and the second relates to mapping of the relationships between the elements.
Scope of the systematic review
The SDG interlinkages model is constructed at the basin scale in general. The SR was conducted for seven focused areas of the Luanhe Living Lab project—four SDGs and three specific topics—namely, LULCC, ecosystem services (ES) and flood risk (FR). The four SDGs are Goal 6 (Clean Water and Sanitation), Goal 7 (Affordable and Clean Energy), Goal 11 (Sustainable Cities and Communities) and Goal 13 (Climate Action) (see Fig. 3). There is an overlapping of the areas between FR and Goals 11 and 13 due to the links of FR with Target 11.5 (reducing losses from disasters including water-related disasters) and Target 13.1 (resilience to climate-related disasters).
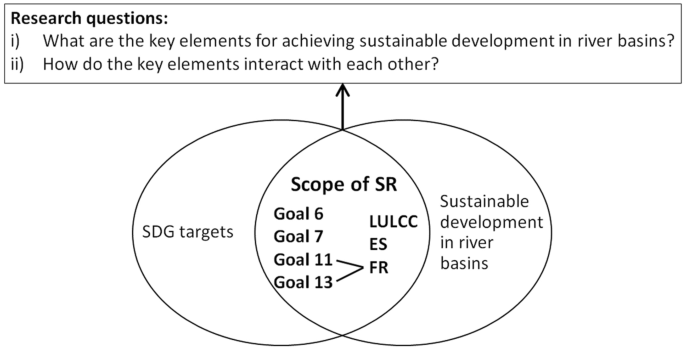
Scope of the SR. LULCC land use and land cover change, ES ecosystem services, FR flood risk
The pairwise linkages are defined by causation, f = (a, b), indicating the direction of the impacts of “a” on “b”. Both “a” and “b” belong to a set of elements which includes a subset of 169 SDG targets and other elements which are not included in the SDG framework but of importance to achieving sustainable development in river basins. Examples of such elements include engineering projects (e.g., reservoirs and dams for water storage, flood control and power generation), sediments, and different types of ecosystem services such as provisioning, regulating and cultural.
The DPIR framework as a basic structure of the SDG interlinkages model
The Driver-Pressure-Impact-Response (DPIR) framework, a simplified version of Driver-Pressure-State-Impact-Response (EEA 1999), was used as a base for constructing the SDG interlinkages model. In the context of a river basin, human activities (e.g., urbanisation and irrigation) as drivers exert pressures on the environment (e.g., water pollution and water use intensity), which result in changes in the state of the environment (such as chemical oxygen demand in fresh water and frequency of water shortages, etc.). These changes may cause ecological degradation (e.g., of the provisioning services of water-related ecosystems) and associated economic and social impacts (e.g., health impacts). Society then responds to address the environmental degradation and manage the risks through mitigation, adaptation and prevention measures (e.g., pollution abatement and water supply prices). As a causal chain framework, DPSIR is a useful tool to help identify the problems (pressures and impacts), their causes (drivers) and the solutions (responses) and enable communication among various stakeholders.
Grouping the identified key elements into each of the four components of DPIR followed the classifications provided by EEA on core indicators (Kristensen 2003).
Selection of references
ScienceDirect (https://www.sciencedirect.com/) was used to select research articles and studies of the desired quality. To address the two research questions, we selected “river basin” and “sustainable development” as the key terms and a timeframe of the most recent 3 decades (1992–2020) based on the time of the first earth summit on sustainable development, held in Rio de Janeiro in 1992. This identified 37,133 references (see Fig. 4).
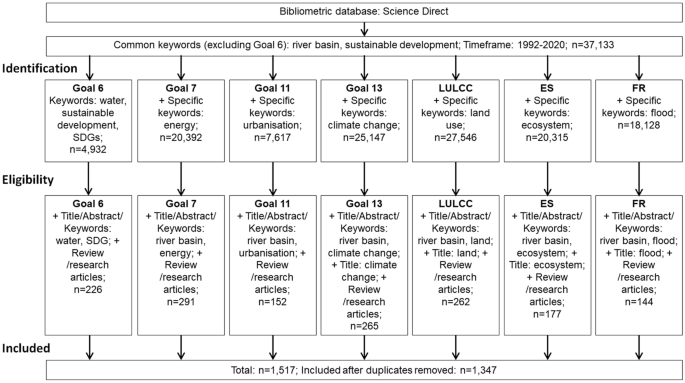
Process for selection of included references. The selection process was conducted between August and September, 2020
By reviewing the abstracts from the top 100 most relevant articles ranked by the database, we found that many of them had a research focus non-relevant to sustainable development in river basins, as such studies only mentioned these terms as either background or general context. We, therefore, modified the eligibility criteria to identify more relevant references. For each of the seven focus areas (excluding Goal 6), we refined the search by adding specific keywords in the title, abstract or keywords, e.g., “river basin” and “energy” for Goal 7 and “river basin” and “climate change” for Goal 13. As before, for the areas of climate change (Goal 13), ES and FR, since they cut across several research topics, many of the identified studies only mentioned these keywords in general in the abstract section. For these three areas, we further added specific keywords in the title search. For Goal 6, we selected “water”, “sustainable development” and “SDGs” as the keywords to confine the selection against the context of SDGs, since almost all the identified papers deal with “water”. In addition, for all seven focus areas, we included only research articles and review articles and excluded books/chapters and encyclopaedias.
The results revealed 1517 research articles/research reviews (see Supplementary Material 1). Since the results for the seven areas are not exclusive, after removing the duplicates, the final result was 1347.
A quasi-automatic process for construction of the qualitative SDG interlinkages model through machine-based text analysis and content analysis
Due to the complexity of SDG interlinkages and the large amount of reference data (n = 1347), manual processing to reach a systematic result that was also replicable presented a challenge. A quasi-automatic process was, therefore, developed to help extract and synthesise information, which utilised machine-based text analysis and content analysis. The process is quasi-, not fully automatic, due to the human intervention involving some model decisions and processing carried out by the modellers (see Fig. 5).

Machine-based quasi-automatic process for constructing the SDG interlinkages model. NVivo 12 Plus and KH Coder are the software used for a text analysis
Machine processing and human processing were conducted interactively to fulfil the task. Machine processing helped systematically extract information and inform the modellers, who could thus learn more effectively and with a broader perspective over the complex issues involved with SDG interlinkages. Human processing helped make the decisions on selection and collate as well as synthesise information, based on ingrained knowledge and expertise.
At Step 1, a machine-based word and term analysis provided a systematic ranking of words and terms by their frequency. The modellers determined the inclusion criterion of the top 100 based on the consideration over the size of the model and the effectiveness for visualisation. In addition, whether any other words and terms beyond the top 100 but were deemed important to addressing the research questions was checked which resulted in an adjusted list of top words and terms. At Step 2, informed by the results from the auto-coding using NVivo 12 Plus, the modellers collated and grouped the selected top words and terms into a shortlist which was included as key elements of the SDG interlinkages model.
At Step 3, the machine processing (by using KH Code) provided a systematic extraction of the contents for each of the key elements. At Step 4, the machine processing (using KH Coder and Nvivo 12 Plus) provided the results on the auto-mapping of the top words and terms. The modellers, based on a review of the extracted contents from Step 3 and the auto-mapping results, mapped the interactions between the key elements and provided the narratives for each mapped relation (see Supplementary Materials 2 and 3).
The whole process was conducted for each of the seven areas. The mapping results for the seven areas were then collated and synthesised to combine elements in common and remove duplicates.
Expert survey
The preliminary results on selected key elements and the mapping of their linkages from the systematic review were shared with eight experts, all members of the Luanhe Living Lab project. Three members worked on WP1 (LULCC) and WP3 (ES), four members on WP2 (FR) and one member on stakeholder engagement. The purpose of the expert survey was to validate the results as well as provide independent qualitative assessment. For validation, the experts were asked to check and revise the preliminary mapping results and add new linkages they considered important but were missing in the preliminary results. Through this process, the experts provided new perspectives on the narratives and suggested new linkages (e.g., disaggregation of the ecosystem services into three types, i.e., provisioning, regulating and cultural, and the inclusion of potential trade-offs of relevant policies). Qualitative assessment was conducted on the nature of each link (positive, negative, either positive or negative based on the context, or neutral), strength (strong vs. weak), level of importance to the LRB (scale from 0 to 5), and the links with WPs 1–3 (yes/no and how). See Supplementary Material 3.
Field campaign and stakeholders consultation
Seven project team members undertook 10 days of field work along the LRB in October 2019. To grasp first-hand information about the river basin, the team, accompanied by a local governmental expert, visited Panjiakou Reservoir and Daheiting Reservoir (midstream), the source of the LRB (upstream), and the estuary of the river in Laoting (downstream). During the trip, the team arranged two meetings with local governments and LRB conservation and management agencies. Issues of flourishing cage aquaculture in Panjiakou Reservoir and the resulted water pollution and downstream impacts, as well as the impacts of the Government’s ban on cage fish farming in Panjiakou Reservoir in 2019, were pointed out during these meetings (“Luanhe Living Lab” Project Team, 2021). Fishery and its linkages with water pollution, upstream–downstream conflicts, associated health impacts and the impacts from water conservation policies, which were not identified through the SR, were then added in the SDG interlinkages model based on the specific context of the LRB.
On 18 October 2019, a stakeholder workshop, attended by 15 participants from river basin management agencies, water resource conservation institutes, environmental research institutes and universities, was held to discuss future land use planning, policies and associated land use change scenarios. The participants also provided valuation on the ecological services of different types of land in the LRB.
Quantification of the SDG interlinkages
Quantification of the SDG interlinkages was based on the Pearson correlation coefficients calculated using the time-series data (2005–2018) collected from various sources for 27 counties and the integration of the results obtained from WP1 (LULCC) (Xu et al. ), WP2 (FR) (Zhao et al. 2021) and WP3 (ES) (Xu et al. 2021a). Specifically, statistical data were collected for 45 indicators relevant to the variables defined in the qualitative SDG interlinkages model. In addition, for the elements related to LULCC, ES and FR, the time-series data of relevant indicators was obtained from WP1 (9 indicators), WP2 (8 indicators) and WP3 (3 indicators) (see Fig. 2 and Appendix 1). Due to the presence of time-series gaps for most of the data, interpolation and extrapolation were conducted to prepare a full time-series for the data.
The SDG interlinkages model for river basins was then converted into a network graph for visualisation through use of Cytoscape software.
Results
Results from the systematic review and text analysis
Machine-based text and content analysis supported identification of the key elements and mapping of their linkages to construct the SDG interlinkages model. Results from the text analysis of the LULCC-related literature (262 included articles) are used as an example to demonstrate the results. The word cloud (Fig. 6) indicates that “land use change”, “river basin” and “water” are central words, together with other key words such as “agricultural”, “hydrological”, “climate”, “development”, “management”, “flow”, “quality”, “sediment”, “erosion”, “ecosystem”, “forest”, “groundwater”, and “flood”, etc. This result informs about the major topics covered by the literature.

Word cloud of LULCC literature, based on NVivo 12 Plus
Using KH Coder software, the co-occurrence network of the top 100 most frequent terms for the LULCC literature (Fig. 7) can provide information on associations between the top 100 terms. For example, land use and land cover link with ecosystem services and water quality, which further connect with human well-being and anthropogenic activities. Linking with human activities, climate change connects with LULCC and water yield, which further link with surface runoff and stream flow. Land cover change and land degradation link with hydrological response. Land use change links with sediment yield which further connects with stream flow. Though the results were not used directly for building the SDG interlinkages model, they provide useful information from a semantic perspective.

Graph depicting co-occurrence of words and terms for LULCC-related literature using KH Coder. Graph generated for the top 100 most frequent terms with a frequency above nine
Informed by the results from the word cloud analysis and word co-occurrence analysis, the top 100 words and terms identified from the LULCC literature (ranked by frequency using KH Coder software) were grouped into 11 representative terms (see Table 1) by the modellers. These terms were included as key elements (nodes) in the interlinkages model. In the next step, a review of the contents extracted by machine processing (using KWIC Concordance provided by KH Coder software) was conducted to map the linkages between the identified key elements (see Supplementary Material 2). After conducting a similar process for each of the seven areas, 60 key elements were identified and their key linkages were mapped (see Supplementary Material 3).
The qualitative SDG interlinkages model for river basins
By synthesising the results from the SR, expert survey and stakeholders’ consultation, the qualitative SDG interlinkages model for river basins was constructed. A summary of the key elements and their major interlinkages is provided in Table 2. For detailed narratives of the linkages, please see Supplementary Material 3.
Figure 8 presents the framework of the SDG interlinkages model in a graph, which includes the key elements grouped based on DPIR. The full model, including all mapped linkages between key elements, is presented in Fig. 9. A qualitative assessment of the synergies (positive linkages) and trade-offs (negative linkages) between relevant key elements was conducted based on the SR and the expert survey (see Supplementary Material 3).

Source: Graph generated using Cytoscape Version 3.8.2
Framework of the SDG interlinkages model with key elements classified based on DPIR. Edges with arrows indicate the causal relationships among the four components of DPIR. Edges without arrows indicate the structure of each components of DPIR. The size of nodes and the thickness of edges in the graph are just for the purpose of visualisation and do not have specific meaning.

SDG interlinkages model in network graph. Arrow—indicates the causal relationship between the pair targets; Green links: synergies (positive links); red links: trade-offs (negative links); blue links: either positive or negative depending on the conditions and context
Results of quantitative SDG interlinkages analysis for the LRB at the county level
The constructed qualitative model was applied to a quantitative assessment of the SDG interlinkages at the county level in the LRB. The quantification was conducted by using the correlation coefficients calculated from the time-series data (2005–2018) collected for 27 counties as well as the results from WP1-3.
Three counties, namely Fengning Manchu Autonomous County (upstream), Chengde County (midstream) and Luanzhou City (downstream), were selected for presenting the quantification results. Location of three counties in the LRB is shown in Fig. 10.
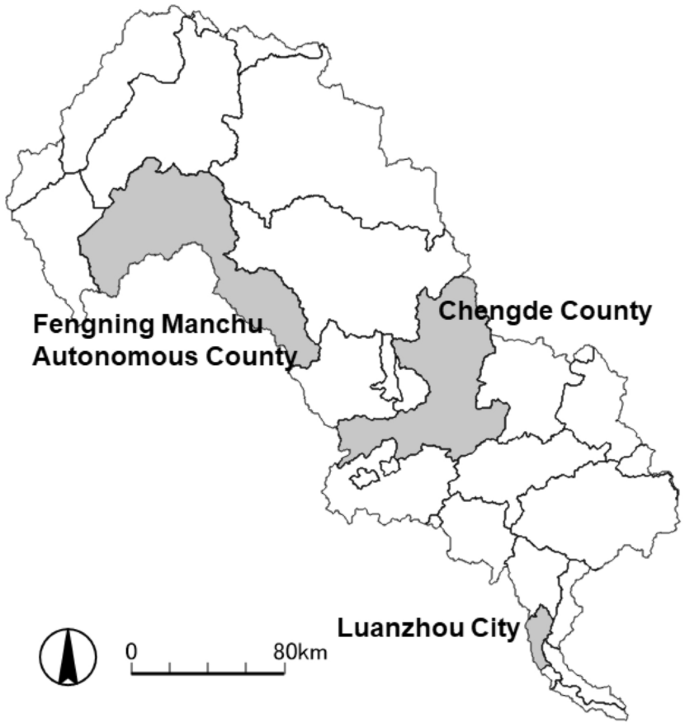
Location of Fengning (upstream), Chengde County (midstream) and Luanzhou City (downstream) in the LRB
Fengning Manchu Autonomous County (Fengning) is located in the northern part of Hebei Province, adjacent to Beijing in the south and Inner Mongolia in the north. Richly endowed with natural resources such as forests and grassland, Fengning acts as an ecological barrier and important water source for Beijing and Tianjin. The Chao River and Luan River originate in Fengning. The county has jurisdiction over nine towns, 17 townships and 309 administrative villages, with a total population of 411,000 (Fengning Manchu Autonomous County Government, 2021). In 2020, it had a regional GDP growth rate of 6.6%.
Chengde County is located in the northeast of Hebei Province and in the midstream of the LRB. It has 23 townships, one sub-district and 378 administrative villages. The Luan River, Laoniu River and eight other rivers converge in the territory of Chengde County. Its GDP growth in 2020 was 4.5% (Chengde County Government, 2021). While the county has shown a high achievement in poverty eradication, it is also a target recipient of financial support from the provincial government towards reducing poverty. Its population has been dropping.
Luanzhou City, a county-level city, is located south of Yanshan Mountain and on the west bank of the Luan River. The city has rich mineral resources, particularly iron ore, which accounts for one-fifth of the national total reserve, and 34 mining companies (Luanzhou City Government, 2020). However, mining and processing activities have led to pressures on water resources. Its 61 villages in 3 towns are located along the Luan River. Two sections of the Luanhe Dike, located at Caiying and the head of canal, are the foci of flood control.
Data availability and data trend for 65 indicators used for the quantification of the SDG interlinkages in three selected counties are shown in Appendix 1. The results of the quantified SDG interlinkages in three counties are shown in Appendix 2.
Results of quantitative interlinkages analysis on LULCC, ES, FR and other SDGs by integrating the results from WPs 1, WP2 and WP3
In the SDG interlinkages model, land use was further disaggregated into six types, namely cropland, forest, grassland, built-up land, water area and unused land. Based on the SDG interlinkages model (see Fig. 8), LULCC driven by human activities, including agriculture, industry/mining and urbanisation, impacted on water-related ecosystems services, water availability, soil erosion, rural development, and water-related disasters. The changes in water-related ecosystems services, which was further classified into three types, i.e. provisioning, regulating and cultural services, impacted further on agricultural production, economic growth, poverty eradication, and water-related disasters. Water-related disasters, such as flood inundation, may impact various land types causing damages to agriculture, industry and infrastructure, and affect human lives. Using the results from WP1 on the past trend of LULCC (Xu et al. 2021b), the assessment results from WP3 on the levels of ES (Xu et al. 2021a), and the results from WP2 on the flood risk assessment (Zhao et al. 2021), a correlation analysis was conducted for various land use types, ES, FR and other SDG targets (see Figs. 11, 12, 13). Other SDG targets include agriculture, industry/mining, economic growth, poverty eradication, rural development, and urbanisation.

Correlation coefficients calculated based on the historical data of LULCC, ES and other SDGs in Fengning Manchu Autonomous County (upstream). Code 1–16 in the first row indicate the same variables in the first column. For the definition of indicators, see Appendix 1

Correlation coefficients calculated based on the historical trends of LULCC, ES and other SDGs in Chengde County (midstream)

Correlation coefficients calculated based on the historical trends of LULCC, ES and other SDGs in Luanzhou City (downstream)
Discussion
Systematic review: Bias, transparency and replicability
The methodology and process used for conducting the SR may have generated bias in the results. ScienceDirect was the only bibliometric database used for reference retrieval which may have biased the selection results. To overcome this, Scopus and other databases including other languages can be included in future studies. The seven focused areas and relevant key words used for reference retrieval may also have generated bias since the majority of the literature is related to environmental issues but less literature is related to economic and social issues. Including social issues, such as jobs and gender equality, in the reference retrieval may help address this issue. In identifying the key elements, the top 100 most frequent terms were selected as the set due to considerations over the size of the model and the processing time taken by a PC. This may have led to biased results due to exclusion of terms that may have been highly relevant to causal relationships but which were only slightly relevant to semantic relationships.
Related to transparency and replicability, the SR-based process and machine-based semi-automatic data processing provide a transparent methodology and process, which can be replicated in other similar studies in the field of SDG interlinkages in particular, and in network analysis in general. It should be noted that human intervention in the process of machine-based semi-automatic data processing, including the selection of terms, mapping the linkages, and collating and compilation, may influence on the results.
Major SDG synergies and trade-offs in three counties
Fengning Manchu Autonomous County
For the interlinkages assessment, only 120 linkages of the total 294 (40.8%) could be quantified for Fengning, due to the limited availability of data. Some of the findings deduced from the quantitative interlinkages analysis follow (also see Appendices 1 and 2). Fengning has shown a declining trend in the share of agricultural output in the regional total output, which positively correlates with an increase in rural poverty (Target 1.2). This trend was associated with a decline in cropland area, and inversely, to an increase in agricultural productivity (Target 2.3), indicating more intensive agricultural practices. The latter factor was positively associated with increased fertilizer inputs (Target 2.4), implying increased pressure on water quality degradation (Target 6.3). Economic development (Target 8.1) and the increase in income levels positively linked with improved domestic water use for drinking and sanitation (Targets 6.1 and 6.2), as well as employment (Target 8.5). Per capita disposable income has increased in both urban and rural areas, but also with increased rural poverty, implying widened inequality (Target 10.1).
For LULCC, Fengning has shown a decreasing trend in areas of cropland, forestland and unused land and an opposite trend in the areas of grassland, built-up land and waters. Increased grassland and built-up land positively correlated with increased livestock production and increased urbanisation. Decreased cropland area, however, correlated with increased crop production (Targets 2.1 and 2.3), indicating more intensive production per unit of land. These trends resulted in reduced ecosystem services of all three types, namely provisioning, regulating and cultural. LULCC and the reduction in ES further linked with increased rural poverty (Target 1.2). On the other hand, economic development (Target 8.1), industrial growth (Target 9.2) and rural infrastructure development (Target 1.a), which correlated negatively with the decrease in cropland and forestland but positively with built-up land, are the major drivers of LULCC.
Chengde County
For the interlinkages assessment, 152 linkages of the total 294 (57.1%) could be quantified, due to the limited availability of data. Economic growth has slowed, with increased poverty (Target 1.2) and decreased employment (Target 8.5) in both rural and urban areas. In contrast to the increase in per capita disposable income in both urban and rural areas, this trend indicates a widening inequality (Target 10.1). In contrast to Fengning, the share of agricultural outputs has increased with decreased productivity (Target 2.3), indicating the practice has become more extensive. This has resulted in less fertilizer inputs (Target 2.4). In terms of water quality (Target 6.3), the chemical oxygen demand in wastewater discharge has decreased, mainly due to stricter industrial water pollution control (Target 6.3) and improved sewage treatment (Target 11.6). However, the ammonia nitrogen discharge has increased. Due to less fertilizer inputs, the increase in ammonia nitrogen discharge may have resulted from cage fishing.
In LRB, the flourishing cage aquaculture in the midstream reservoirs has brought economic benefits (Target 8.1) to local populations but also caused serious water pollution (Target 6.3), such as suspended solids, oxygen depletion substances, nitrogen and phosphorus. Water quality degradation has influenced the supply of safe water to downstream areas, including Tianjin Metropolitan. To address this urgent issue, the Central Government issued a ban on cage fishing in Panjiakou reservoir in early 2019 and forced the removal of all cages within a few months. The ban aims at protecting the water environment (Target 6.5) and ensuring access to safe drinking water (Target 6.1) in downstream cities; however, it also had a sudden impact on the economic development (Target 8.1) and livelihoods of aquaculture farmers in the midstream (see detailed analysis in Wei et al. (2021)). This case demonstrated the off-site trade-offs associated with economic development and governmental policies.
For LULCC, cropland and forestland have decreased. Similarly to Fengning, grassland, built-up land and water areas have increased. This trend in LULCC has contributed to a reduction in the three types of ecosystem services (Target 6.6, Target 15.1, Target 15.2 and Target 15.5).
Luanzhou City
For the interlinkages assessment, due to poor data availability, only 120 linkages of the total 294 (40.8%) could be quantified. Compared with Fengning and Chengde County, poverty reduction (Target 1.2) has been improved in both urban and rural areas, chiefly resulting from industrial development (Target 9.2). Similar to Fengning, the share of agricultural output in the total regional output has been decreasing. In contrast, total food production has increased due mainly to improved productivity (Target 2.3), which has been coupled with increased fertilizer use (Target 2.4). The protected areas from flood and drought impacts for maintaining harvest yield have been reduced, indicating higher exposure to climate-related disasters (Target 11.5).
For LULCC, in contrast with Fengning and Chengde County, cropland and grassland have lowered, but forestland, built-up land (Target 11.3) and waters have been increasing, which has resulted in reduced provisioning and regulating services but increased culture services (Targets 6.6, 15.1, 15.2 and 15.5). The trend in LULCC correlated with increased urbanisation (Target 11.3) and increased crop production (Target 2.3) mainly due to intensified agricultural practices, but decreased livestock production.
Data quality and implications
In relation to the process of quantitative analysis, analysing SDG interlinkages is heavily reliant on the quality and availability of the indicators and data, which poses certain challenges, as many of the SDG indicators are relatively new and may lack either trackable data or even the methodology to collect such data (UNSTAT, n.d.). The current study faced similar challenges in the identification of appropriate indicators for the counties in the LRB that are either identical to the SDG indicators or map well with them. Data were collected for 27 counties in LRB, from which the results of the quantitative interlinkage analysis for three counties are presented in this paper. A total of 164 indicators were identified as relevant to this study; however, availability of the related data varied across the three counties. In Luanzhou County, roughly 63% of the indicators had trackable data, while for Chengde County and Fengning, the data availability was 58% and 49%, respectively. Time-series data were collected, but unevenness was also found across the data points for many indicators. Statistical techniques were applied to fill the gaps in the missing data points, and for the indicators that lacked data availability, qualitative assessments on causal relationships were made on the basis of expert opinions. The interlinkages analysis results, therefore, have some data-related limitations, which constrain more accurate and robust assessments. Improvements in subnational or local SDG indicators and data availability in the future can help overcome some of these constraints.
Policy implications
While the SDGs provide a broad framework that integrates the three dimensions of sustainability, their effectiveness is heavily dependent on how national and subnational plans and policies are formulated and implemented. Interlinkages among the SDGs and the targets may be context- and location-specific, which is highly pertinent for river basins due to the complex interactions that take place among upstream, midstream and downstream regions and communities, along with their implications across the physical and socio-economic spheres. The systematic review and interlinkages mapping provided in this paper can help policymakers visualise, on a general level, the key elements and major interlinkages at the scale of river basins. Furthermore, the quantified SDG interlinkages analysis results for the three counties in the LRB can help identify common challenges and issues across the three counties as well as the specific challenges faced by each county. This can help identify priority issues and coordinate planning that takes into account the upstream–downstream dynamics and their implications for social and economic development of the counties and communities concerned. For instance, in Luanzhou City, there are signs of improvements in poverty reduction associated with industrial development (synergies), whereas poverty increased in Fengning and Chengde, indicating the policy priority of the latter two counties. Agricultural output and productivity increased in general though Chengde County also faces productivity issue. All the three counties face a common challenge of decreasing cropland.
Conclusion
Recognising the uniqueness of the geographical features and their implications for achieving sustainable development at the river basin scale, this paper developed a methodology to analyse SDG synergies and trade-offs from an SDG interlinkage perspective. A novel methodology, which made use of a standardised systematic review together with machine-based text analysis and content analysis, was developed to construct the SDG interlinkages model in general in a transparent way. The modelling included systematic identification of the key elements in the SDG interlinkages system and systematic mapping of their interactions. As the focus is on human–environmental interactions through the physical connectivity at the river basins, the systematic review covered seven areas: land use and land cover change, ecosystem services, flood risks, water (SDG 6), energy (SDG 7), urbanisation (SDG 11) and climate actions (SDG 13). The findings of the systematic review were further verified with expert opinions and stakeholders’ consultation. The river basin level interlinkages model was developed based on a DPIR framework, which is an effective tool enabling communication among relevant stakeholders for identifying the key issues, understanding their mechanisms and finding solutions. The study then involved a quantitative SDG interlinkages analysis with county-level SDG indicator data, collected in China’s Luanhe River Basin. Results of the analysis on the interlinkages of LULCC, ES, and other SDGs were then compared among three case-study counties, namely Fengning Manchu Autonomous County (upstream), Chengde County (midstream) and Luanzhou City (downstream). Going forward, the proposed methodology together with its applications to three counties in the LRB can be replicated in similar studies.
The results, discussed in Sect. 4 of this paper, provide some major insights related to the challenges and priorities of each of these counties, including how they differ across the counties. The results also show why subnational or river basin-level SDG policy integration needs to take into consideration the human–environment interactions from an SDG interlinkage perspective. The results of the analysis for the LRB suggest that water resources management needs to be cognizant about certain issues to ensure efficient management and to avoid conflicts over resources. In the counties studied in this paper, cropland was found to be decreasing, while agricultural practices intensified with impact on water-related ecosystem services. Another issue to take into consideration is the upstream–downstream interactions. The issue of caged aquaculture and its impacts across midstream to downstream show the need for taking into account such interaction in water resource management. Increased domestic water use for drinking and sanitation may have strong synergies with improved nutrition, health, education and gender equality. However, these synergistic effects have not yet been materialised in three selected counties and should be strengthened in an integrated water resource management for the LRB.
Due to the scope of this paper, the analysis did not extend to consideration of certain physical aspects such as analysis of hydrological regime. The focus of the analysis was also limited to within-county interlinkages without going deeper into spatial analysis. Future research agenda may, therefore, incorporate some of these issues and consider ways to use improved data, thus providing more effective results.
References
Baffoe G, Zhou X, Moinuddin M, Somanje AN, Kuriyama A, Mohan G, Saito O, Takeuchi K (2021) Urban–rural linkages: effective solutions for achieving sustainable development in Ghana from an SDG interlinkage perspective. Sustain Sci 1:3. https://doi.org/10.1007/s11625-021-00929-8
Bakhshianlamouki E, Masia S, Karimi P, van der Zaag P, Sušnik J (2020) A system dynamics model to quantify the impacts of restoration measures on the water-energy-food nexus in the Urmia lake Basin, Iran. Sci Total Environ 708:134874. https://doi.org/10.1016/j.scitotenv.2019.134874
Bangash RF, Passuello A, Sanchez-Canales M, Terrado M, López A, Elorza FJ, Ziv G, Acuña V, Schuhmacher M (2013) Ecosystem services in Mediterranean river basin: climate change impact on water provisioning and erosion control. Sci Total Environ 458–460:246–255. https://doi.org/10.1016/j.scitotenv.2013.04.025
Cheng X, Chen L, Sun R, Kong P (2018) Land use changes and socio-economic development strongly deteriorate river ecosystem health in one of the largest basins in China. Sci Total Environ 616–617:376–385. https://doi.org/10.1016/j.scitotenv.2017.10.316
Dahal P, Shrestha ML, Panthi J, Pradhananga D (2020) Modeling the future impacts of climate change on water availability in the Karnali River Basin of Nepal Himalaya. Environ Res 185:109430. https://doi.org/10.1016/j.envres.2020.109430
de Oliveira VA, de Mello CR, Beskow S, Viola MR, Srinivasan R (2019) Modeling the effects of climate change on hydrology and sediment load in a headwater basin in the Brazilian Cerrado biome. Ecol Eng 133:20–31. https://doi.org/10.1016/j.ecoleng.2019.04.021
De Stercke S, Chaturvedi V, Buytaert W, Mijic A (2020) Water-energy nexus-based scenario analysis for sustainable development of Mumbai. Environ Model Softw 134:104854. https://doi.org/10.1016/j.envsoft.2020.104854
EEA (1999) Environmental indicators: typology and overview—European Environment Agency. https://www.eea.europa.eu/publications/TEC25. Accessed 15 July 2019
ESCAP (2021) Toolboxes | SDG Help Desk. http://sdghelpdesk.unescap.org/toolboxes?title=&field_sdgs_target_id=All&page=8. Accessed 14 April 2021.
Gebremicael TG, Mohamed YA, van der Zaag P, Hagos EY (2018) Quantifying longitudinal land use change from land degradation to rehabilitation in the headwaters of Tekeze-Atbara Basin, Ethiopia. Sci Total Environ 622–623:1581–1589. https://doi.org/10.1016/j.scitotenv.2017.10.034
Guo C, Ye S, Lek S, Liu J, Zhang T, Yuan J, Li Z (2013) The need for improved fishery management in a shallow macrophytic lake in the Yangtze River basin: evidence from the food web structure and ecosystem analysis. Ecol Model 267:138–147. https://doi.org/10.1016/j.ecolmodel.2013.07.013
ICSU (2017) A guide to SDG interactions: from science to implementation. International Council for Science, Paris. https://doi.org/10.24948/2017.01
Islam Z, Gan TY (2015) Potential combined hydrologic impacts of climate change and El Niño Southern Oscillation to South Saskatchewan River Basin. J Hydrol 523:34–48. https://doi.org/10.1016/j.jhydrol.2015.01.043
Johnston JM, Barber MC, Wolfe K, Galvin M, Cyterski M, Parmar R (2017) An integrated ecological modeling system for assessing impacts of multiple stressors on stream and riverine ecosystem services within river basins. Ecol Model 354:104–114. https://doi.org/10.1016/j.ecolmodel.2017.03.021
Kristensen P (2003) EEA core set of indicators
Le Blanc D (2015) Towards integration at last? The sustainable development goals as a network of targets. Sustain Dev 10:10. https://doi.org/10.1002/sd.1582
“Luanhe Living Lab” project team (2020) Lessons learnt from synergies and trade—offs between SDGs at the sub—national scale (Luange Living Lab Research Brief)
“Luanhe Living Lab” Project Team (2021) Research Brief: Lessons learnt from synergies and trade-offs between SDGs at the sub-national scale. https://sdginterlinkages.iges.jp/luanhe/index.html
Luo Z, Shao Q, Zuo Q, Cui Y (2020) Impact of land use and urbanization on river water quality and ecology in a dam dominated basin. J Hydrol 584:124655. https://doi.org/10.1016/j.jhydrol.2020.124655
Miola A, Borchardt S, Neher F (2019) Interlinkages and policy coherence for the Sustainable Development Goals implementation (JRC Technical Reports). Eur Commission Jt Res Centre. https://doi.org/10.2760/472928
Moher D, Liberati A, Tetzlaff J, Altman DG (2009) Preferred reporting items for systematic reviews and meta-analyses: the PRISMA statement. BMJ 339(7716):332–336. https://doi.org/10.1136/bmj.b2535
Morelli S, Battistini A, Catani F (2014) Rapid assessment of flood susceptibility in urbanized rivers using digital terrain data: application to the Arno river case study (Firenze, northern Italy). Appl Geography 54:35–53. https://doi.org/10.1016/j.apgeog.2014.06.032
Nepal S (2016) Impacts of climate change on the hydrological regime of the Koshi river basin in the Himalayan region. J Hydro-Environ Res 10:76–89. https://doi.org/10.1016/j.jher.2015.12.001
Nilsson M, Griggs D, Visback M (2016a) Map the interactions between Sustainable Development Goa. Nature. https://doi.org/10.1038/534320a
Nilsson M, Griggs D, Visbeck M (2016b) Policy: map the interactions between sustainable development goals. Nature. https://doi.org/10.1038/534320a
Nkhonjera GK, Dinka MO (2017) Significance of direct and indirect impacts of climate change on groundwater resources in the Olifants River basin: a review. Global Planet Change 158:72–82. https://doi.org/10.1016/j.gloplacha.2017.09.011
Patole M (2018) Localization of SDGs through disaggregation of KPIs. Economies. https://doi.org/10.3390/economies6010015
Saner R, Saner-Yiu L, Gollub N, Sidibe D (2017) Implementing the SDGs by subnational governments: urgent need to strengthen administrative capacities. Public Adm Policy 20(2):23–40
ShadmehriToosi A, Calbimonte GH, Nouri H, Alaghmand S (2019) River basin-scale flood hazard assessment using a modified multi-criteria decision analysis approach: a case study. J Hydrol 574:660–671. https://doi.org/10.1016/j.jhydrol.2019.04.072
Somanje AN, Mohan G, Lopes J, Mensah A, Gordon C, Zhou X, Moinuddin M, Saito O, Takeuchi K (2020) Challenges and potential solutions for sustainable urban-rural linkages in a Ghanaian context. Sustainability. https://doi.org/10.3390/su12020507
Trang NTT, Shrestha S, Shrestha M, Datta A, Kawasaki A (2017) Evaluating the impacts of climate and land-use change on the hydrology and nutrient yield in a transboundary river basin: a case study in the 3S River Basin (Sekong, Sesan, and Srepok). Sci Total Environ 576:586–598. https://doi.org/10.1016/j.scitotenv.2016.10.138
UNDESA (2019) United Nations Global SDG Database. United Nations Department of Economic and Social Affairs. https://unstats.un.org/sdgs/indicators/database/
UNDG (2015) Mainstreaming the 2030 Agenda for Sustainable Development: Reference Guide to UN Country Teams (Issue October)
UNESCAP (2017) Integrated approaches for sustainable development goals planning: the case of goal 6 on water and sanitation
UN-Habitat (2021) A UN System-Wide Urban Monitoring Framework is being developed to support Local and Regional Governments | Urban Agenda Platform
United Nations (2015) Transforming our world: The 2030 agenda for sustainable development. In https://sustainabledevelopment.un.org/content/documents/7891Transforming%20Our%20World.pdf (Issue 1). https://doi.org/10.1007/s13398-014-0173-7.2
United Nations (2020) 2020 High Level Political Forum (HLPF): Exhibitions. https://sustainabledevelopment.un.org/hlpf/2020#exhibit
United Nations Statistical Commission (2018) SDG Indicators—Global indicator framework for the Sustainable Development Goals and targets of the 2030 Agenda for Sustainable Development. United Nations. https://unstats.un.org/sdgs/indicators/indicators-list/
UNSD (2016) Working Group on Interlinkages of Sdg Statistics To Allow for Integrated Analyses in the Monitoring. UNSD, New York
UNSTAT (2021) IAEG-SDGs—SDG Indicators Tier Classification for Global SDG Indicators. https://unstats.un.org/sdgs/iaeg-sdgs/tier-classification/. Accessed 5 Oct 2021
Val J, Chinarro D, Pino MR, Navarro E (2016) Global change impacts on river ecosystems: a high-resolution watershed study of Ebro river metabolism. Sci Total Environ 569–570:774–783. https://doi.org/10.1016/j.scitotenv.2016.06.098
Wang X, Dong X, Liu H, Wei H, Fan W, Lu N, Xu Z, Ren J, Xing K (2017) Linking land use change, ecosystem services and human well-being: a case study of the Manas River Basin of Xinjiang, China. Ecosyst Services 27:113–123. https://doi.org/10.1016/j.ecoser.2017.08.013
Wei H, Xu Z, Liu H, Ren J, Fan W, Lu N, Dong X (2018) Evaluation on dynamic change and interrelations of ecosystem services in a typical mountain-oasis-desert region. Ecol Indic 93:917–929. https://doi.org/10.1016/j.ecolind.2018.05.051
Wei M, Huang S, Li L, Tq Z, Waseem A, Zobia K, Renaud F (2021) Evolution of water quality and biota in the Panjiakou Reservoir, China as a consequence of social and economic development: implications for synergies and trade-offs between Sustainable Development Goals. Sustain Sci. https://doi.org/10.1007/s11625-021-01046-2
Weitz N, Carlsen H, Nilsson M, Skånberg K (2018) Towards systemic and contextual priority setting for implementing the 2030 agenda. Sustain Sci 13(2):531–548. https://doi.org/10.1007/s11625-017-0470-0
Wohl E (2017) Connectivity in rivers. Progress Phys Geography Earth Environ 41(3):345–362. https://doi.org/10.1177/0309133317714972
Xia X, Liang Q, Ming X (2019) A full-scale fluvial flood modelling framework based on a high-performance integrated hydrodynamic modelling system (HiPIMS). Adv Water Resour 132:103392. https://doi.org/10.1016/J.ADVWATRES.2019.103392
Xu J, Barrett B, Renaud F (2021a) Ecosystem services and disservices in the Luanhe River Basin in China under past, current and future land uses: implications for the Sustainable Development Goals. Sustain Sci (forthcoming)
Xu J, Renaud FG, Barrett B (2021b) Modelling land system evolution and dynamics of terrestrial carbon stocks in the Luanhe River Basin, China: a scenario analysis of trade-offs and synergies between sustainable development goals. Sustain Sci 2021(1):1–23. https://doi.org/10.1007/S11625-021-01004-Y
Yang W, Long D, Bai P (2019) Impacts of future land cover and climate changes on runoff in the mostly afforested river basin in North China. J Hydrol 570:201–219
Yang L, Feng Q, Yin Z, Deo RC, Wen X, Si J, Liu W (2020) Regional hydrology heterogeneity and the response to climate and land surface changes in arid alpine basin, northwest China. CATENA 187:104345. https://doi.org/10.1016/j.catena.2019.104345
Zhao J, Liang Q, Chen H, Xia X, Xu J, Hoey T, Barrett B, Renaud F, Bosher L, Xin Z (2021) Large-scale flood risk assessment under different development strategies: the Luanhe River Basin in China. Sustain Sci. https://doi.org/10.1007/s11625-021-01034-6
Zhou X, Moinuddin M (2017) Sustainable development goals interlinkages and network analysis: a practical tool for SDG integration and policy coherence (issue June). Institute for Global Environmental Strategies (IGES), London
Zhou X, Moinuddin M (2021) Impacts and implications of the COVID-19 crisis and its recovery for achieving Sustainable Development Goals in Asia: a review from an SDG interlinkage perspective. In: Ramanathan A, Chidambaram S, Jonathan MP, Prasanna MV, Kumar P, Arriola FM (eds) Scenarios of environmental resilience and transformation in times of climate change: effects and lessons from the COVID-19. Elsevier, Amsterdam
Zhou X, Moinuddin M, Li Y (2019) SDG Interlinkages Analysis & Visualisation Tool (V3.0). Institute for Global Environmental Strategies (IGES), London
Zhou J, Zhao Y, Huang P, Zhao X, Feng W, Li Q, Xue D, Dou J, Shi W, Wei W, Zhu G, Liu C (2020) Impacts of ecological restoration projects on the ecosystem carbon storage of inland river basin in arid area, China. Ecol Indic 118:106803. https://doi.org/10.1016/j.ecolind.2020.106803
Acknowledgements
This research was conducted under a project entitled “River basins as ‘living laboratories’ for achieving sustainable development goals (SDGs) across national and sub-national scales”. The project was funded by the Natural Environment Research Council (NERC; NE/S012427/1), UK, National Natural Science Foundation of China (NSFC), China, and Japan Science and Technology Agency (JST), Japan. The authors also thank and acknowledge the inputs from the local stakeholders who provided input to the research through participation in relevant meetings and the stakeholder consultation workshop. The IGES’ team also received financial support from the IGES’ Strategic Research Fund (FY2019, FY2020 and FY2021) covering part of the personnel costs and publication cost.
Author information
Authors and Affiliations
Corresponding author
Additional information
Handled by Osamu Saito, Institute for Global Environmental strategies, Japan.
Publisher's Note
Springer Nature remains neutral with regard to jurisdictional claims in published maps and institutional affiliations.
Electronic supplementary material
Below is the link to the electronic supplementary material.
Appendices
Appendix I Indicators, data availability and trend in three selected counties in the LRB
Indicator code | Indicator | FN | CD | LZ | Data source |
|---|---|---|---|---|---|
1 | Proportion of urban population receiving minimum living allowance / % | n.a | n.a | n.a | Statistics |
2 | Urban population receiving minimum living allowance | – | + | - | Statistics |
3 | Rural population receiving minimum living allowance | + | + | - | Statistics |
4 | Per capita food production / (ton/capita) | + | + | + | Statistics |
5 | Total food production / ton | + | + | + | Statistics |
6 | Per capita disposable income of urban residents / (yuan/capita) | + | + | + | Statistics |
7 | Per capita disposable income of rural residents / (yuan/capita) | + | + | + | Statistics |
8 | Agricultural fertiliser use / ton | + | - | + | Statistics |
9 | Effective irrigation area / ha | n.a | n.a | - | Statistics |
10 | Guaranteed harvest area under drought and flood conditions / ha | - | + | - | Statistics |
11 | Share of the output value of agriculture, forestry, animal husbandry and fishery in total output value / % | - | + | - | Statistics |
12 | Share of agriculture, forestry, animal husbandry and fishery expenditure in total governmental expenditure / % | n.a | n.a | n.a | Statistics |
13 | Per capita medical and health care expenditure / (yuan/capita) | n.a | 0 | + | Statistics |
14 | Urban residents' medical and health care expenditure as a percentage of per capita consumption / % | n.a | - | + | Statistics |
15 | Rural residents' medical and health care expenditure as a percentage of per capita consumption / % | n.a | n.a | + | Statistics |
16 | Water quality compliance rate of urban concentrated drinking water sources / % | n.a | n.a | n.a | Statistics |
17 | Proportion of villages access to tap water / % | + | + | + | Statistics |
18 | Water supply throughout the year / ton | n.a | + | n.a | Statistics |
19 | Urban sewage treatment rate / % | n.a | n.a | + | Statistics |
20 | Chemical oxygen demand (COD) discharge / ton | n.a | - | n.a | Statistics |
21 | COD reduction rate / % | n.a | n.a | n.a | Statistics |
22 | Ammonia nitrogen discharge / ton | n.a | + | n.a | Statistics |
23 | Industrial value added / 10,000 yuan | + | + | n.a | Statistics |
24 | Urban registered unemployment rate / % | 0 | - | 0 | Statistics |
25 | Rural employment / person | + | + | + | Statistics |
26 | GDP per capita / (yuan/capita) | + | + | + | Statistics |
27 | Average number of employees in industrial enterprises above designated size / person | - | - | n.a | Statistics |
28 | Number of employees / person | 0 | 0 | n.a | Statistics |
29 | Average wages of currently employed workers / yuan | + | + | + | Statistics |
30 | Electricity generation / 100 GWh | n.a | n.a | + | Statistics |
31 | Harmless treatment rate of domestic solid waste / % | n.a | n.a | 0 | Statistics |
32 | Proportion of villages with broadband access / % | + | + | 0 | Statistics |
33 | Proportion of villages connected to public transportation / % | - | + | + | Statistics |
34 | Relative humidity during the year / % | - | + | n.a | Statistics |
35 | Annual precipitation / mm | + | + | n.a | Statistics |
36 | SO2 emissions / ton | n.a | + | 0 | Statistics |
37 | GDP / 10,000 yuan | + | + | + | Statistics |
38 | Total output value of agriculture, forestry, animal husbandry and fishery / 10,000 yuan | + | + | + | Statistics |
39 | Total governmental expenditure / 10,000 yuan | + | + | + | Statistics |
40 | Total population at the end of the year | + | - | + | Statistics |
41 | Number of workers who have not attended school | - | + | - | Statistics |
42 | Number of employees with college education or above | + | + | + | Statistics |
43 | Number of villages access to tap water | + | + | + | Statistics |
44 | Number of villages with broadband access | + | + | 0 | Statistics |
45 | Cropland / km2 | - | - | - | WP1 |
46 | Forest / km2 | - | - | + | WP1 |
47 | Grassland / km2 | + | + | - | WP1 |
48 | Water / km2 | + | + | + | WP1 |
49 | Built-up land / km2 | + | + | + | WP1 |
50 | Unused land / km2 | - | - | - | WP1 |
51 | Crop production (t) | + | + | + | WP1 |
52 | Urbanization rate (%) | + | + | + | WP1 |
53 | Forest rate (%) | - | - | + | WP1 |
54 | Provisioning Service | - | - | - | WP3 |
55 | Regulating Service | - | - | - | WP3 |
56 | Culture Service | - | - | + | WP3 |
57 | Inundated_Cropland (above 0.5 m) / km2 | + | - | - | WP2 |
58 | Inundated_Forest (above 2 m) / km2 | - | - | + | WP2 |
59 | Inundated_Grassland (above 0.5 m) / km2 | - | - | - | WP2 |
60 | Inundated_Water (above 2 m) / km2 | + | + | - | WP2 |
61 | Inundated_Built-up land (above 2 m) / km2 | + | + | + | WP2 |
62 | Inundated_Unused land (above 2 m) / km2 | - | n.a | - | WP2 |
63 | Inundated area_Total / km2 | - | - | - | WP2 |
64 | Moderate, high and extremely high life risks / persons | + | + | + | WP2 |
65 | Ratio of the proportion of the rural and urban population receiving minimum living allowance | n.a | n.a | n.a | Statistics |
Data availability | 75% | 83% | 80% |
Appendix II Assessment of the SDG interlinkages in three selected counties in the upstream, midstream and downstream of the LRB
Name of node/From | Name of node/To | Indicator code/From | Indicator code/To | FN | CD | LZ |
|---|---|---|---|---|---|---|
Agriculture (2.3) | Built-up land (15.3) | 51 | 49 | 0.99 | 0.92 | 0.51 |
Agriculture (2.3) | Climate change (13.1) | 5 | + (S) | + (S) | + (S) | |
Agriculture (2.3) | Cropland (15.3) | 51 | 45 | − 0.85 | − 0.79 | − 0.64 |
Agriculture (2.3) | Deforestation (15.2) | 51 | 53 | 0.93 | − 0.10 | − 0.99 |
Agriculture (2.3) | Economic growth (8.1) | 5 | 11 | − 0.08 | 0.59 | − 0.81 |
Agriculture (2.3) | Food security (2.1) | 5 | 4 | 0.99 | 0.92 | 0.99 |
Agriculture (2.3) | Forest (15.2) | 51 | 46 | − 0.93 | 0.10 | 0.99 |
Agriculture (2.3) | Grassland (15.3) | 51 | 47 | 1.00 | 0.85 | − 0.45 |
Agriculture (2.3) | Poverty eradication (1.2) | 5 | 3 | 0.38 | − 0.76 | − 0.63 |
Agriculture (2.3) | Unused land (15.3) | 51 | 50 | − 0.28 | − 0.37 | − 0.27 |
Agriculture (2.3) | Water area (6.6) | 51 | 48 | 1.00 | 1.00 | 0.43 |
Agriculture (2.3) | Water pollution (6.3) | 8 | 22 | + (S) | − 0.98 | + (S) |
Agriculture (2.3) | Water stress (6.4) | 5 | 18 | + (S) | 0.71 | + (S) |
Aquaculture (2.3) | Economic growth (8.1) | 38 | 11 | − 0.87 | 0.95 | − 0.90 |
Aquaculture (2.3) | Nutrition (2.2) | 38 | + (W) | + (W) | + (W) | |
Aquaculture (2.3) | Poverty eradication (1.2) | 38 | 3 | 0.98 | − 0.97 | − 0.97 |
Aquaculture (2.3) | Water pollution (6.3) | 38 | 22 | + (S) | 0.97 | + (S) |
Aquaculture (2.3) | Water stress (6.4) | 38 | 18 | + (W) | 0.92 | + (W) |
Built-up land (15.3) | Deforestation (15.2) | 49 | 53 | 0.88 | − 0.48 | − 0.37 |
Built-up land (15.3) | ES_Culture (6.6/15.1) | 49 | 56 | − 0.99 | − 0.94 | 0.66 |
Built-up land (15.3) | ES_Provision (6.6/15.1) | 49 | 54 | − 0.99 | − 0.94 | − 0.80 |
Built-up land (15.3) | ES_Regulation (6.6/15.1) | 49 | 55 | − 0.99 | − 0.94 | − 0.78 |
Built-up land (15.3) | Rural development (2.a) | 49 | 33 | − 0.91 | 0.99 | 0.97 |
Built-up land (15.3) | Soil erosion (15.3) | 49 | ± (S) | ± (S) | ± (S) | |
Built-up land (15.3) | Urbanisation (11.3) | 49 | 52 | 1.00 | 1.00 | 1.00 |
Built-up land (15.3) | Water availability (6.4) | 49 | ± (S) | ± (S) | ± (S) | |
Built-up land (15.3) | Water-related disasters (11.5) | 49 | 63 | 0.54 | 1.00 | 0.95 |
Climate change (13.1) | Agriculture (2.3) | 35 | 51 | 0.89 | 0.92 | ± (S) |
Climate change (13.1) | Economic growth (8.1) | 37 | − (S) | − (S) | − (S) | |
Climate change (13.1) | ES_Culture (6.6/15.1) | 35 | 56 | − 0.89 | − 0.94 | − (S) |
Climate change (13.1) | ES_Provision (6.6/15.1) | 35 | 54 | − 0.89 | − 0.94 | − (S) |
Climate change (13.1) | ES_Regulation (6.6/15.1) | 35 | 55 | − 0.89 | − 0.94 | − (S) |
Climate change (13.1) | Ground water (6.4) | 35 | ± (S) | ± (S) | ± (S) | |
Climate change (13.1) | Water availability (6.4) | 35 | ± (S) | ± (S) | ± (S) | |
Climate change (13.1) | Water-related disasters (11.5) | 35 | 63 | − 0.69 | − 0.96 | + (S) |
Communities participation (6.b) | Integrated management (6.5) | + (S) | + (S) | + (S) | ||
Cropland (15.3) | Deforestation (15.2) | 45 | 53 | − 0.99 | 0.69 | 0.51 |
Cropland (15.3) | ES_Culture (6.6/15.1) | 45 | 56 | 0.85 | 0.81 | − 0.54 |
Cropland (15.3) | ES_Provision (6.6/15.1) | 45 | 54 | 0.85 | 0.82 | 0.89 |
Cropland (15.3) | ES_Regulation (6.6/15.1) | 45 | 55 | 0.85 | 0.82 | 0.87 |
Cropland (15.3) | Rural development (2.a) | 45 | 38 | − 0.94 | − 0.92 | − 0.97 |
Cropland (15.3) | Soil erosion (15.3) | 45 | ± (S) | ± (S) | ± (S) | |
Cropland (15.3) | Urbanisation (11.3) | 45 | 52 | − 0.79 | − 0.97 | − 0.99 |
Cropland (15.3) | Water availability (6.4) | 45 | ± (S) | ± (S) | ± (S) | |
Cropland (15.3) | Water-related disasters (11.5) | 45 | 63 | − 0.82 | 0.95 | 0.94 |
Deforestation (15.2) | Climate change (13.1) | 53 | + (S) | + (S) | + (S) | |
Deforestation (15.2) | ES_Culture (6.6/15.1) | 53 | 56 | − 0.93 | 0.14 | 0.45 |
Deforestation (15.2) | ES_Provision (6.6/15.1) | 53 | 54 | − 0.93 | 0.15 | 0.85 |
Deforestation (15.2) | ES_Regulation (6.6/15.1) | 53 | 55 | − 0.93 | 0.15 | 0.87 |
Deforestation (15.2) | Ground water (6.4) | 53 | − (S) | − (S) | − (S) | |
Deforestation (15.2) | Soil erosion (15.3) | 53 | + (S) | + (S) | + (S) | |
Deforestation (15.2) | Water availability (6.4) | 53 | ± (S) | ± (S) | ± (S) | |
Deforestation (15.2) | Water-related disasters (11.5) | 53 | 63 | − 0.78 | 0.43 | 0.36 |
Disaster risk reduction (13.1) | Water infrastructure (9.1) | ± (S) | ± (S) | ± (S) | ||
Disaster risk reduction (13.1) | Water-related disasters (11.5) | 10 | 63 | 0.65 | − 0.98 | 0.85 |
Domestic water use (6.1/6.2) | Health (3.2/3.3/3.9) | 43 | 15 | + (S) | + (S) | − 0.82 |
Domestic water use (6.1/6.2) | Poverty eradication (1.2) | 43 | 3 | − 1.00 | − 0.99 | 0.93 |
Domestic water use (6.1/6.2) | Reduce inequalities (10.2) | 43 | 65 | + (W) | + (W) | + (W) |
Domestic water use (6.1/6.2) | Wastewater generation (11.6) | 43 | 20 | + (S) | − 1.00 | + (S) |
Domestic water use (6.1/6.2) | Water pollution (6.3) | 18 | 20 | + (S) | − 0.93 | + (S) |
Domestic water use (6.1/6.2) | Water stress (6.4) | 18 | + (S) | + (S) | + (S) | |
Economic growth (8.1) | Climate change (13.1) | 37 | + (W) | + (W) | + (W) | |
Economic growth (8.1) | Employment (8.5) | 37 | 24 | 0.00 | − 0.19 | 0.00 |
Economic growth (8.1) | ES_Culture (6.6/15.1) | 37 | 56 | − 0.97 | − 0.95 | 0.46 |
Economic growth (8.1) | ES_Provision (6.6/15.1) | 37 | 54 | − 0.97 | − 0.95 | − 0.92 |
Economic growth (8.1) | ES_Regulation (6.6/15.1) | 37 | 55 | − 0.97 | − 0.95 | − 0.90 |
Economic growth (8.1) | Poverty eradication (1.2) | 26 | 1 | + (S) | + (S) | + (S) |
Education (4.1/4.3) | Employment (8.5) | 42 | 24 | − 0.00 | − 0.36 | − 0.00 |
Education (4.1/4.3) | Poverty eradication (1.2) | 41 | 29 | 1.00 | − 0.58 | 0.99 |
Effective institutions (16.6) | Integrated management (6.5) | + (S) | + (S) | + (S) | ||
Employment (8.5) | Poverty eradication (1.2) | 24 | 1 | + (S) | + (S) | + (S) |
End hunger (2.1) | Health (3.2/3.3/3.9) | 4 | 13 | + (S) | 0.00 | − 0.53 |
Energy supply (7.1) | Agriculture (2.3) | 30 | 5 | + (S) | + (S) | 0.40 |
Energy supply (7.1) | Economic growth (8.1) | 30 | 37 | + (S) | + (S) | 0.55 |
Energy supply (7.1) | Industry/mining (9.2) | 30 | 23 | + (S) | + (S) | + (S) |
Energy supply (7.1) | Poverty eradication (1.2) | 30 | 3 | + (S) | + (S) | 0.58 |
Energy supply (7.1) | Rural development (2.a) | 30 | 44 | + (S) | + (S) | 0.00 |
Energy supply (7.1) | Urbanisation (11.3) | 30 | 52 | + (S) | + (S) | 0.56 |
Environmental enforcement (16.3) | Integrated management (6.5) | 19 | + (S) | + (S) | + (S) | |
Environmental enforcement (16.3) | Water pollution (6.3) | 19 | 21 | − (S) | − (S) | − (S) |
Environmental water (6.6) | ES_Culture (6.6/15.1) | 56 | + (S) | + (S) | + (S) | |
Environmental water (6.6) | ES_Provision (6.6/15.1) | 54 | + (S) | + (S) | + (S) | |
Environmental water (6.6) | ES_Regulation (6.6/15.1) | 55 | + (S) | + (S) | + (S) | |
ES_Culture (6.6/15.1) | Economic growth (8.1) | 56 | 37 | − 0.97 | − 0.95 | 0.46 |
ES_Culture (6.6/15.1) | Poverty eradication (1.2) | 56 | 6 | 0.96 | 0.96 | 0.46 |
ES_Culture (6.6/15.1) | Tourism (8.9) | 56 | + (S) | + (S) | + (S) | |
ES_Provision (6.6/15.1) | Agriculture (2.3) | 54 | 51 | − 1.00 | − 1.00 | − 0.92 |
ES_Provision (6.6/15.1) | Aquaculture (2.3) | 54 | 38 | − 0.94 | − 0.93 | − 0.89 |
ES_Provision (6.6/15.1) | Economic growth (8.1) | 54 | 38 | − 0.94 | − 0.93 | − 0.89 |
ES_Provision (6.6/15.1) | Poverty eradication (1.2) | 54 | 7 | 0.96 | 0.95 | − 0.89 |
ES_Provision (6.6/15.1) | Tourism (8.9) | 54 | + (S) | + (S) | + (S) | |
ES_Regulation (6.6/15.1) | Agriculture (2.3) | 55 | 51 | − 1.00 | − 1.00 | − 0.94 |
ES_Regulation (6.6/15.1) | Aquaculture (2.3) | 55 | 38 | − 0.94 | − 0.93 | − 0.87 |
ES_Regulation (6.6/15.1) | Climate change (13.1) | 55 | 34 | 0.67 | − 0.93 | ± (S) |
ES_Regulation (6.6/15.1) | Water availability (6.4) | 55 | + (S) | + (S) | + (S) | |
ES_Regulation (6.6/15.1) | Water-related disasters (11.5) | 55 | 63 | 0.61 | 0.95 | 0.74 |
Financial capacity (17.1) | Integrated management (6.5) | 39 | + (S) | + (S) | + (S) | |
Food security (2.1) | End hunger (2.1) | 5 | 4 | 0.99 | 0.92 | 0.99 |
Food security (2.1) | Nutrition (2.2) | 5 | 4 | 0.99 | 0.92 | 0.99 |
Forest (15.2) | ES_Culture (6.6/15.1) | 46 | 56 | 0.93 | − 0.14 | − 0.45 |
Forest (15.2) | ES_Provision (6.6/15.1) | 46 | 54 | 0.93 | − 0.15 | − 0.85 |
Forest (15.2) | ES_Regulation (6.6/15.1) | 46 | 55 | 0.93 | − 0.15 | − 0.87 |
Forest (15.2) | Rural development (2.a) | 46 | 38 | − 0.97 | 0.41 | 0.55 |
Forest (15.2) | Soil erosion (15.3) | 46 | − (S) | − (S) | − (S) | |
Forest (15.2) | Urbanisation (11.3) | 46 | 52 | − 0.88 | 0.48 | 0.37 |
Forest (15.2) | Water availability (6.4) | 46 | ± (S) | ± (S) | ± (S) | |
Forest (15.2) | Water-related disasters (11.5) | 46 | 63 | 0.78 | 0.43 | 0.36 |
Gender equality (5.1) | Domestic water use (6.1/6.2) | 17 | + (S) | + (S) | + (S) | |
Gender equality (5.1) | Poverty eradication (1.2) | 3 | + (W) | + (W) | + (W) | |
Grassland (15.3) | Deforestation (15.2) | 47 | 53 | 0.93 | − 0.61 | 0.31 |
Grassland (15.3) | ES_Culture (6.6/15.1) | 47 | 56 | − 1.00 | − 0.87 | − 0.71 |
Grassland (15.3) | ES_Provision (6.6/15.1) | 47 | 54 | − 1.00 | − 0.88 | 0.76 |
Grassland (15.3) | ES_Regulation (6.6/15.1) | 47 | 55 | − 1.00 | − 0.87 | 0.74 |
Grassland (15.3) | Rural development (2.a) | 47 | 38 | 0.94 | 0.95 | − 0.93 |
Grassland (15.3) | Soil erosion (15.3) | 47 | ± (S) | ± (S) | ± (S) | |
Grassland (15.3) | Urbanisation (11.3) | 47 | 52 | 0.99 | 0.99 | − 1.00 |
Grassland (15.3) | Water availability (6.4) | 47 | ± (S) | ± (S) | ± (S) | |
Grassland (15.3) | Water-related disasters (11.5) | 47 | 63 | − 0.61 | − 0.98 | 0.95 |
Ground water (6.4) | Water availability (6.4) | + (S) | + (S) | + (S) | ||
Health (3.2/3.3/3.9) | Economic growth (8.1) | 14 | 6 | + (S) | 1.00 | − 0.94 |
Health (3.2/3.3/3.9) | Education (4.1/4.3) | 13 | 41 | + (S) | 0.00 | − 1.00 |
Health (3.2/3.3/3.9) | Employment (8.5) | 13 | 28 | + (W) | 0.00 | + (W) |
Health (3.2/3.3/3.9) | Poverty eradication (1.2) | 14 | 2 | + (S) | − 0.79 | − 0.94 |
Hydropower (7.1) | Energy supply (7.1) | 30 | + (S) | + (S) | + (S) | |
Hydropower (7.1) | Water infrastructure (9.1) | + (S) | + (S) | + (S) | ||
Hydropower (7.1) | Water stress (6.4) | 18 | ± (S) | ± (S) | ± (S) | |
Industry/mining (9.2) | Built-up land (15.3) | 23 | 49 | 0.93 | 0.95 | ± (S) |
Industry/mining (9.2) | Climate change (13.1) | 23 | 36 | + (S) | 0.63 | + (S) |
Industry/mining (9.2) | Cropland (15.3) | 23 | 45 | − 0.96 | − 0.89 | ± (S) |
Industry/mining (9.2) | Economic growth (8.1) | 23 | 37 | 1.00 | 0.98 | + (S) |
Industry/mining (9.2) | Employment (8.5) | 23 | 27 | − 1.00 | − 0.83 | + (S) |
Industry/mining (9.2) | Forest (15.2) | 23 | 46 | − 0.99 | 0.35 | ± (S) |
Industry/mining (9.2) | Grassland (15.3) | 23 | 47 | 0.97 | 0.92 | ± (S) |
Industry/mining (9.2) | Unused land (15.3) | 23 | 50 | − 0.02 | − 0.09 | ± (S) |
Industry/mining (9.2) | Waste generation (11.6) | 23 | 31 | + (S) | + (S) | + (S) |
Industry/mining (9.2) | Wastewater generation (11.6) | 23 | 20 | + (S) | − 0.96 | + (S) |
Industry/mining (9.2) | Water area (6.6) | 23 | 48 | 0.97 | 0.93 | ± (S) |
Industry/mining (9.2) | Water pollution (6.3) | 23 | 20 | + (S) | − 0.96 | + (S) |
Industry/mining (9.2) | Water stress (6.4) | 23 | 18 | + (S) | 0.87 | + (S) |
Integrated management (6.5) | Built-up land (15.3) | 49 | ± (S) | ± (S) | ± (S) | |
Integrated management (6.5) | Cropland (15.3) | 45 | ± (S) | ± (S) | ± (S) | |
Integrated management (6.5) | Economic growth (8.1) | 37 | ± (S) | ± (S) | ± (S) | |
Integrated management (6.5) | ES_Culture (6.6/15.1) | 56 | ± (S) | ± (S) | ± (S) | |
Integrated management (6.5) | ES_Provision (6.6/15.1) | 54 | ± (S) | ± (S) | ± (S) | |
Integrated management (6.5) | ES_Regulation (6.6/15.1) | 55 | ± (S) | ± (S) | ± (S) | |
Integrated management (6.5) | Food security (2.1) | 4 | + (S) | + (S) | + (S) | |
Integrated management (6.5) | Forest (15.2) | 46 | ± (S) | ± (S) | ± (S) | |
Integrated management (6.5) | Grassland (15.3) | 47 | ± (S) | ± (S) | ± (S) | |
Integrated management (6.5) | Ground water (6.4) | + (S) | + (S) | + (S) | ||
Integrated management (6.5) | Industry/mining (9.2) | 23 | + (S) | + (S) | + (S) | |
Integrated management (6.5) | Poverty eradication (1.2) | 3 | + (S) | + (S) | + (S) | |
Integrated management (6.5) | Reduce inequalities (10.2) | 65 | + (S) | + (S) | + (S) | |
Integrated management (6.5) | Rural development (2.a) | 12 | + (S) | + (S) | + (S) | |
Integrated management (6.5) | Soil erosion (15.3) | − (S) | − (S) | − (S) | ||
Integrated management (6.5) | Unused land (15.3) | 50 | ± (S) | ± (S) | ± (S) | |
Integrated management (6.5) | Waste generation (11.6) | 31 | ± (S) | ± (S) | ± (S) | |
Integrated management (6.5) | Water area (6.6) | 48 | ± (S) | ± (S) | ± (S) | |
Integrated management (6.5) | Water infrastructure (9.1) | + (S) | + (S) | + (S) | ||
Integrated management (6.5) | Water pollution (6.3) | 22 | − (S) | − (S) | − (S) | |
Integrated management (6.5) | Water stress (6.4) | 18 | − (S) | − (S) | − (S) | |
Land right (1.4) | Built-up land (15.3) | 49 | ± (S) | ± (S) | ± (S) | |
Land right (1.4) | Cropland (15.3) | 45 | ± (S) | ± (S) | ± (S) | |
Land right (1.4) | Forest (15.2) | 46 | ± (S) | ± (S) | ± (S) | |
Land right (1.4) | Grassland (15.3) | 47 | ± (S) | ± (S) | ± (S) | |
Land right (1.4) | Integrated management (6.5) | + (S) | + (S) | + (S) | ||
Land right (1.4) | Unused land (15.3) | 50 | ± (S) | ± (S) | ± (S) | |
Land right (1.4) | Water area (6.6) | 48 | ± (S) | ± (S) | ± (S) | |
Nutrition (2.2) | Health (3.2/3.3/3.9) | 4 | 13 | + (S) | 0.00 | − 0.53 |
Partnerships (17.17) | Integrated management (6.5) | + (S) | + (S) | + (S) | ||
Partnerships (17.17) | Urban water management (6.5) | 19 | ± (W) | ± (W) | ± (W) | |
Population growth | Domestic water use (6.1/6.2) | 40 | 18 | ± (S) | − 0.82 | ± (S) |
Poverty eradication (1.2) | Domestic water use (6.1/6.2) | 3 | 17 | − 1.00 | − 0.99 | 0.93 |
Poverty eradication (1.2) | Economic growth (8.1) | 3 | 26 | − 0.99 | − 0.98 | 0.99 |
Poverty eradication (1.2) | ES_Culture (6.6/15.1) | 3 | 56 | 0.96 | 0.96 | 0.46 |
Poverty eradication (1.2) | ES_Provision (6.6/15.1) | 3 | 54 | 0.96 | 0.96 | − 0.92 |
Poverty eradication (1.2) | ES_Regulation (6.6/15.1) | 3 | 55 | 0.96 | 0.96 | − 0.91 |
Poverty eradication (1.2) | Gender equality (5.1) | 3 | + (S) | + (S) | + (S) | |
Poverty eradication (1.2) | Reduce inequalities (10.2) | 3 | 65 | + (S) | + (S) | + (S) |
Rural development (2.a) | Economic growth (8.1) | 32 | 38 | 0.98 | 0.97 | 0.00 |
Rural development (2.a) | Poverty eradication (1.2) | 7 | 3 | − 0.99 | − 0.99 | 0.99 |
Sediments (6.3) | Water availability (6.4) | ± (S) | ± (S) | ± (S) | ||
Sediments (6.3) | Water quality degradation (6.3) | 16 | ± (S) | ± (S) | ± (S) | |
Soil erosion (15.3) | Ground water (6.4) | ± (S) | ± (S) | ± (S) | ||
Soil erosion (15.3) | Sediments (6.3) | + (S) | + (S) | + (S) | ||
Soil erosion (15.3) | Water availability (6.4) | − (S) | − (S) | − (S) | ||
Soil erosion (15.3) | Water-related disasters (11.5) | 63 | + (S) | + (S) | + (S) | |
Thermal power (7.1) | Climate change (13.1) | 30 | 36 | + (S) | + (S) | 0.00 |
Thermal power (7.1) | Energy supply (7.1) | 30 | + (S) | + (S) | + (S) | |
Thermal power (7.1) | Water stress (6.4) | 30 | 18 | + (W) | + (W) | + (W) |
Tourism (8.9) | Economic growth (8.1) | 37 | + (S) | + (S) | + (S) | |
Tourism (8.9) | Employment (8.5) | 25 | + (S) | + (S) | + (S) | |
Tourism (8.9) | Rural development (2.a) | 7 | ± (S) | ± (S) | ± (S) | |
Tourism (8.9) | Water stress (6.4) | 18 | + (W) | + (W) | + (W) | |
Unused land (15.3) | Deforestation (15.2) | 50 | 53 | 0.10 | − 0.89 | 0.12 |
Unused land (15.3) | ES_Culture (6.6/15.1) | 50 | 56 | 0.27 | 0.33 | − 0.83 |
Unused land (15.3) | ES_Provision (6.6/15.1) | 50 | 54 | 0.27 | 0.32 | 0.62 |
Unused land (15.3) | ES_Regulation (6.6/15.1) | 50 | 55 | 0.27 | 0.32 | 0.59 |
Unused land (15.3) | Rural development (2.a) | 50 | 38 | − 0.00 | − 0.04 | − 0.85 |
Unused land (15.3) | Soil erosion (15.3) | 50 | ± (S) | ± (S) | ± (S) | |
Unused land (15.3) | Urbanisation (11.3) | 50 | 52 | − 0.38 | 0.02 | − 0.97 |
Unused land (15.3) | Water availability (6.4) | 50 | ± (S) | ± (S) | ± (S) | |
Unused land (15.3) | Water-related disasters (11.5) | 50 | 63 | 0.38 | 0.03 | 0.91 |
Urban water management (6.5) | Integrated management (6.5) | 19 | + (S) | + (S) | + (S) | |
Urban water management (6.5) | Wastewater generation (11.6) | 19 | 20 | + (S) | + (S) | + (S) |
Urban water management (6.5) | Water infrastructure (9.1) | 19 | ± (S) | ± (S) | ± (S) | |
Urban water management (6.5) | Water pollution (6.3) | 19 | 20 | − (S) | − (S) | − (S) |
Urban water management (6.5) | Water stress (6.4) | 19 | 18 | − (S) | − (S) | − (S) |
Urban water management (6.5) | Water transfer (6.5) | 19 | ± (S) | ± (S) | ± (S) | |
Urbanisation (11.3) | Built-up land (15.3) | 52 | 49 | 1.00 | 1.00 | 1.00 |
Urbanisation (11.3) | Climate change (13.1) | 52 | 36 | + (S) | 0.80 | 0.00 |
Urbanisation (11.3) | Cropland (15.3) | 52 | 45 | − 0.79 | − 0.97 | − 0.99 |
Urbanisation (11.3) | Deforestation (15.2) | 52 | 53 | 0.88 | − 0.48 | − 0.37 |
Urbanisation (11.3) | Economic growth (8.1) | 52 | 37 | 0.93 | 0.97 | 0.96 |
Urbanisation (11.3) | Employment (8.5) | 52 | 24 | 0.00 | − 0.22 | 0.00 |
Urbanisation (11.3) | ES_Culture (6.6/15.1) | 52 | 56 | − 0.99 | − 0.94 | 0.66 |
Urbanisation (11.3) | ES_Provision (6.6/15.1) | 52 | 54 | − 0.99 | − 0.94 | − 0.80 |
Urbanisation (11.3) | ES_Regulation (6.6/15.1) | 52 | 55 | − 0.99 | − 0.94 | − 0.78 |
Urbanisation (11.3) | Forest (15.2) | 52 | 46 | − 0.88 | 0.48 | 0.37 |
Urbanisation (11.3) | Grassland (15.3) | 52 | 47 | 0.99 | 0.99 | − 1.00 |
Urbanisation (11.3) | Unused land (15.3) | 52 | 50 | − 0.38 | 0.02 | − 0.97 |
Urbanisation (11.3) | Waste generation (11.6) | 52 | 31 | + (S) | + (S) | 0.00 |
Urbanisation (11.3) | Water area (6.6) | 52 | 48 | 0.99 | 0.94 | − 0.56 |
Urbanisation (11.3) | Water-related disasters (11.5) | 52 | 61 | 0.94 | 0.88 | 0.97 |
Waste generation (11.6) | Sediments (6.3) | 31 | + (S) | + (S) | + (S) | |
Waste generation (11.6) | Water pollution (6.3) | 31 | 20 | + (S) | + (S) | + (S) |
Wastewater generation (11.6) | Water pollution (6.3) | 19 | 20 | + (S) | + (S) | + (S) |
Water area (6.6) | Deforestation (15.2) | 48 | 53 | 0.93 | − 0.14 | − 0.56 |
Water area (6.6) | ES_Culture (6.6/15.1) | 48 | 56 | − 1.00 | − 1.00 | − 0.99 |
Water area (6.6) | ES_Provision (6.6/15.1) | 48 | 54 | − 1.00 | − 1.00 | − 0.05 |
Water area (6.6) | ES_Regulation (6.6/15.1) | 48 | 55 | − 1.00 | − 1.00 | − 0.09 |
Water area (6.6) | Rural development (2.a) | 48 | 43 | 0.97 | 0.97 | 0.22 |
Water area (6.6) | Soil erosion (15.3) | 48 | ± (S) | ± (S) | ± (S) | |
Water area (6.6) | Urbanisation (11.3) | 48 | 52 | 0.99 | 0.94 | − 0.56 |
Water area (6.6) | Water availability (6.4) | 48 | 18 | ± (S) | 0.88 | ± (S) |
Water area (6.6) | Water-related disasters (11.5) | 48 | 63 | 0.61 | 0.95 | − 0.52 |
Water availability (6.4) | Environmental water (6.6) | + (S) | + (S) | + (S) | ||
Water availability (6.4) | Water stress (6.4) | 18 | − (S) | − (S) | − (S) | |
Water availability (6.4) | Water-related disasters (11.5) | 35 | 63 | − 0.69 | − 0.96 | ± (S) |
Water fees (12.c) | Integrated management (6.5) | + (S) | + (S) | + (S) | ||
Water fees (12.c) | Water pollution (6.3) | 20 | − (W) | − (W) | − (W) | |
Water fees (12.c) | Water stress (6.4) | ± (W) | ± (W) | ± (W) | ||
Water infrastructure (9.1) | Agriculture (2.3) | 7 | ± (S) | ± (S) | ± (S) | |
Water infrastructure (9.1) | Built-up land (15.3) | 49 | ± (S) | ± (S) | ± (S) | |
Water infrastructure (9.1) | Cropland (15.3) | 9 | 45 | ± (S) | ± (S) | 0.83 |
Water infrastructure (9.1) | Displacement (10.7) | ± (S) | ± (S) | ± (S) | ||
Water infrastructure (9.1) | Economic growth (8.1) | 37 | + (S) | + (S) | + (S) | |
Water infrastructure (9.1) | Employment (8.5) | 28 | + (W) | + (W) | + (W) | |
Water infrastructure (9.1) | ES_Culture (6.6/15.1) | 56 | ± (W) | ± (W) | ± (W) | |
Water infrastructure (9.1) | ES_Provision (6.6/15.1) | 54 | ± (W) | ± (W) | ± (W) | |
Water infrastructure (9.1) | ES_Regulation (6.6/15.1) | 55 | ± (W) | ± (W) | ± (W) | |
Water infrastructure (9.1) | Forest (15.2) | 46 | ± (S) | ± (S) | ± (S) | |
Water infrastructure (9.1) | Grassland (15.3) | 47 | ± (S) | ± (S) | ± (S) | |
Water infrastructure (9.1) | Sediments (6.3) | + (S) | + (S) | + (S) | ||
Water infrastructure (9.1) | Unused land (15.3) | 50 | ± (S) | ± (S) | ± (S) | |
Water infrastructure (9.1) | Water area (6.6) | 48 | ± (S) | ± (S) | ± (S) | |
Water infrastructure (9.1) | Water availability (6.4) | 18 | ± (S) | ± (S) | ± (S) | |
Water pollution (6.3) | Aquaculture (2.3) | 22 | 38 | − (S) | 0.97 | − (S) |
Water pollution (6.3) | Economic growth (8.1) | 22 | 38 | − (S) | 0.97 | − (S) |
Water pollution (6.3) | ES_Culture (6.6/15.1) | 22 | 56 | − (S) | − 0.97 | − (S) |
Water pollution (6.3) | ES_Provision (6.6/15.1) | 22 | 54 | − (S) | − 0.97 | − (S) |
Water pollution (6.3) | ES_Regulation (6.6/15.1) | 22 | 55 | − (S) | − 0.97 | − (S) |
Water pollution (6.3) | Food security (2.1) | 20 | 4 | − (W) | − 0.92 | − (W) |
Water pollution (6.3) | Ground water (6.4) | 20 | − (S) | − (S) | − (S) | |
Water pollution (6.3) | Water quality degradation (6.3) | 22 | 16 | + (S) | + (S) | + (S) |
Water pollution (6.3) | Water stress (6.4) | 20 | 18 | + (S) | − 0.93 | + (S) |
Water pollution (6.3) | Water-related disasters (11.5) | 20 | + (S) | + (S) | + (S) | |
Water quality degradation (6.3) | ES_Culture (6.6/15.1) | 22 | 56 | − (S) | − 0.97 | − (S) |
Water quality degradation (6.3) | ES_Provision (6.6/15.1) | 22 | 54 | − (S) | − 0.97 | − (S) |
Water quality degradation (6.3) | ES_Regulation (6.6/15.1) | 22 | 55 | − (S) | − 0.97 | − (S) |
Water quality degradation (6.3) | Water stress (6.4) | 22 | 18 | + (S) | 0.93 | + (S) |
Water right (1.4) | Integrated management (6.5) | + (S) | + (S) | + (S) | ||
Water stress (6.4) | Agriculture (2.3) | 18 | 51 | − (S) | 0.86 | − (S) |
Water stress (6.4) | Displacement (10.7) | 18 | + (S) | + (S) | + (S) | |
Water stress (6.4) | Domestic water use (6.1/6.2) | 18 | − (S) | − (S) | − (S) | |
Water stress (6.4) | Economic growth (8.1) | 18 | 26 | − (S) | 0.92 | − (S) |
Water stress (6.4) | Energy supply (7.1) | 18 | 30 | − (S) | − (S) | − (S) |
Water stress (6.4) | Environmental water (6.6) | 18 | − (S) | − (S) | − (S) | |
Water stress (6.4) | Industry/mining (9.2) | 18 | 23 | − (S) | 0.87 | − (S) |
Water transfer (6.5) | Water availability (6.4) | 18 | ± (S) | ± (S) | ± (S) | |
Water transfer (6.5) | Water infrastructure (9.1) | + (S) | + (S) | + (S) | ||
Water-related disasters (11.5) | Agriculture (2.3) | 57 | 51 | 0.82 | − 0.96 | 0.05 |
Water-related disasters (11.5) | Built-up land (15.3) | 61 | 49 | 0.94 | 0.88 | 0.97 |
Water-related disasters (11.5) | Cropland (15.3) | 57 | 45 | − 0.94 | 0.83 | 0.50 |
Water-related disasters (11.5) | Displacement (10.7) | 61 | + (S) | + (S) | + (S) | |
Water-related disasters (11.5) | Economic growth (8.1) | 63 | − (S) | − (S) | − (S) | |
Water-related disasters (11.5) | Forest (15.2) | 58 | 46 | 0.69 | 0.53 | 0.37 |
Water-related disasters (11.5) | Grassland (15.3) | 59 | 47 | − 0.95 | − 0.68 | 0.64 |
Water-related disasters (11.5) | Health (3.2/3.3/3.9) | 63 | 64 | − 0.79 | − 1.00 | − 1.00 |
Water-related disasters (11.5) | Poverty eradication (1.2) | 63 | 3 | 0.76 | 0.99 | − 0.92 |
Water-related disasters (11.5) | Sediments (6.3) | 63 | + (S) | + (S) | + (S) | |
Water-related disasters (11.5) | Unused land (15.3) | 62 | 50 | 0.21 | − (S) | 0.56 |
Water-related disasters (11.5) | Water area (6.6) | 60 | 48 | 0.97 | 0.89 | − 0.09 |
Women's participation (5.5) | Gender equality (5.1) | + (S) | + (S) | + (S) | ||
Women's participation (5.5) | Integrated management (6.5) | + (S) | + (S) | + (S) |
Rights and permissions
Open Access This article is licensed under a Creative Commons Attribution 4.0 International License, which permits use, sharing, adaptation, distribution and reproduction in any medium or format, as long as you give appropriate credit to the original author(s) and the source, provide a link to the Creative Commons licence, and indicate if changes were made. The images or other third party material in this article are included in the article's Creative Commons licence, unless indicated otherwise in a credit line to the material. If material is not included in the article's Creative Commons licence and your intended use is not permitted by statutory regulation or exceeds the permitted use, you will need to obtain permission directly from the copyright holder. To view a copy of this licence, visit http://creativecommons.org/licenses/by/4.0/.
About this article

Cite this article
Zhou, X., Moinuddin, M., Renaud, F. et al. Development of an SDG interlinkages analysis model at the river basin scale: a case study in the Luanhe River Basin, China. Sustain Sci 17, 1405–1433 (2022). https://doi.org/10.1007/s11625-021-01065-z
Received:
Accepted:
Published:
Issue Date:
DOI: https://doi.org/10.1007/s11625-021-01065-z