
Introduction
In this editorial, we present trends and popular topics in educational technology for the year 2022. We used a similar public internet data mining approach (Kimmons & Veletsianos, 2018) to previous years (Kimmons, 2020; Kimmons et al., 2021; Kimmons & Rosenberg, 2022), extracting and analyzing data from three large data sources: the Scopus research article database, the Twitter #EdTech affinity group, and K-12 school and district Facebook pages. This year, we also added information related to Open Educational Resources (OER), specifically data from an edtech-focused open publishing platform, EdTech Books. Our analysis provides a snapshot of educational technology trends in 2022 from four different perspectives, affording insights into what is of interest in the field as institutions, educators, learners, and researchers adjust to the post-pandemic ‘normal’ and adopt educational technologies, resources, and practices at a more mature level.
What Were Trending Topics in EdTech Journals in 2022?
Research topics in the field of educational technology in 2022 were, with a few exceptions, noticeably consistent with those of previous years (see Table 1; Kimmons et al., 2021; Kimmons & Rosenberg, 2022). We compiled the titles of 2699 articles from top educational technology journals (n = 16) identified by Google Scholar and retrieved their abstracts from Scopus. Following this, we looked at the number of times each keyword and bigram (two-word phrase) appeared in the titles and abstracts of the papers to see which words were most frequently referenced. Generic word stems like “learn,” “student,” “education,” and “teach,” modalities like “online” and “digital,” and methods-related terms like “study” and “review” were the most frequently occurring words in titles. Analysis of bigrams showed recurring references to (a) educational settings, like “higher education,” (b) specific modalities like “online learning,” “virtual reality,” and “augmented reality,” and (c) methods, like “systematic review,” “meta-analysis,” and “case study.” Moreover, references to “COVID-19” understandably dropped from 2021 to 2022, while references to “online learning” continued to grow. This may imply that interest in online learning has continued and even grown beyond the pandemic. Appearance of “during+COVID” in the top 15 bigrams in EdTech article titles in 2022 suggested that researchers and practitioners were still reporting on educational practices during the pandemic.
To aid in making sense of the results, we further manually categorized keywords and bigrams into the four information types suggested by the data (contexts, methods, modalities, and topics). Context included terms related to the research settings. Methods included terms referring to research methods in the article. Modalities included terms referring to the technical modality featured in the study. Topics included terms referring to the intervention, objective, or theoretical goal of the study. The most common keywords and bigrams for each type may be found in Table 2. Contextual bigrams like “higher education” (3.9%) and “COVID-19” (3.6%) were among the most popular bigrams used in educational technology journal article titles in 2022. When we looked specifically at the educational level, we found that references to “higher+education” (3.9%) continued to be considerably higher than to “K-12” (1.2%). The abstract analysis of context bigrams paralleled the title bigram analysis.
A closer analysis of methods mentioned in the titles suggested that the terms “systematic review” (3.1%), “case study” (2.2%), and “meta-analysis” (2%) remained the top three methods mentioned in the journal article titles, just like in previous years., followed by “literature review” (1.5%) and “systematic literature” (1.1%; see Table 2 for details). Rather than assuming that these methods were more prevalent, we recognized that researchers commonly mention these particular methods in their titles, whereas other methods are generally mentioned only in the abstract or in the body of an article. Bigram analyses of abstracts confirmed this notion, suggesting a broader coverage of distinct research approaches, such as “mixed method,” “quasi-experimental,” “randomly assigned,” “pre-post,” “systematic review,” and “meta-analysis.” Amongst the methods, bigrams “mixed method” and “quasi-experimental” occupied the leading position in journal abstracts, each carrying an equal percentage of 4.6%, whereas “systematic review” and “meta-analysis” scored 2.3% and 1.8%, respectively. These results suggested that in 2022 EdTech articles with primary data sources were published more frequently than articles using secondary data sources, although secondary data methods were more frequently mentioned in the article titles. Moreover, quantitative components (e.g., “test,” “experiment,” and “survey”) were found more frequently than qualitative components (e.g., “interview” and “qualitative”) in the 2022 EdTech journal article abstracts. Finally, several specific methods that frequently appeared in the article abstracts included “structure equation,” “thematic analysis,” “equation modeling,” “network analysis,” “data mining,” and “cluster analysis.”
When we looked at modality types, we saw that, similarly to 2021, “online learning” (3.5%) and “virtual reality” (2.7%) were the most referenced modalities mentioned in EdTech journal titles (Table 2). In abstracts, the occurrence of “virtual reality,” “online learning,” and “online courses” were far more common than “emergency remote” learning, clearly indicating a post-pandemic adoption of online technologies and an end of pandemic-related emergency remote learning research. Finally, the analysis of topics revealed that “computational thinking” (2.8%) and “learning environments” (2.8%) were the most-referenced bigrams in journal titles (Table 2). In the abstracts, the keyword “science” was used 33.9% and “language” 14.6% implying research focus in these content areas. Another noteworthy trend in the topic analysis of article abstracts was the popularity of terms related to Open Educational Resources (OER), specifically, the frequent use of terms such as “creative commons” and “cc license.”
What Were the Trending #EdTech Topics and Tools on Twitter in 2022?
We also continued to analyze trending #EdTech topics on Twitter (cf., Kimmons et al., 2021; Kimmons & Rosenberg, 2022). In 2022, #EdTech continued to be popular, and its analysis provided a window into relevant conversations, resources, and ideas that researchers and practitioners shared. We collected all English-language original tweets using the hashtag #EdTech for 2022. This included 478,269 original tweets (ignoring retweets) posted by 35,789 authors, which was 39,856 average monthly tweets. This indicated a 10.43% growth in #edtech original tweets (45,191) and average tweets (3766) from 2021, whereas the number of authors declined by 12.21% (4978; cf. Table 3).
The increase in total tweets indicated continuous popularity of the #edtech affinity space in general. The growth in tweets despite declining authorship suggested that the loyal authors increased their activity. Decreases in authorship could be connected to the general Twitter struggle to keep its most active users (Dang, 2022), but it could also be connected to uncertainties brought on by changes in Twitter ownership. Some users might have become more hesitant tweeters, fearing and anticipating changes in the platform’s nature and culture. Others may have abandoned the platform completely for more deeply-rooted reasons (Sweney, 2022). In the future, changes in Twitter ownership may even impact this report. Shifts in the platform’s business model may make data collection less feasible and analyzed information may become less useful.
We also looked at the most popular #EdTech co-occurring hashtags in two categories: audience and topics (see Table 4). #edchat remained the most popular co-occurring hashtag in the audience category. Other top hashtags from 2021 representing audience, such as #edutwitter, #teachers, #edtechchat, #students, #highered, and #k12, remained in the top 10 but slightly changed ranking. Interestingly, many top co-occurring hashtags (#edchat, #highered, #k12, #school, #highereducation) experienced at least a 15% reduction in the number of tweets and at least a 20% decrease in authorship. Another noteworthy trend is the appearance of more specialized, audience-related hashtags, such as #homeschool, #homeschooling, #suptchat, and #iste, in the top 50. Such differentiation in hashtag usage may reflect evolving users’ needs and desires (Kimmons & Veletsianos, 2016; Veletsianos, 2017).
The most popular topic by number of tweets in 2022 was #byjus, a hashtag associated with an educational technology company from India. In spite of its popularity (108,794 or 22.75% of all #edtech tweets), the low diversity score (0.62%) indicated that this hashtag was used by relatively few accounts at high frequencies, likely a result of focused marketing campaigns. This points to the fact that the Twitter space, and #edtech space in particular, can be unduly influenced by corporate influences and marketing. To keep these outliers from our dataset, we determined popularity first through sorting by number of users, then we sorted the top 200 by number of tweets.
We saw similar trends in co-occurring topics. The top ten topics slightly changed order but remained popular overall. The top two hashtags, #education and #learning, remained top ranking, but both experienced a significant loss of total tweets and number of authors. Other top hashtags, such as #technology, #stem, #teaching, and #innovation, had both fewer tweets and fewer authors. The exception was #ai, which had 2908 (25.7%) more tweets despite 484 (22.9%) fewer authors. This may not be a surprising trend as #ai has been gaining popularity in recent years. Other hashtags, such as #artificialintelligence, #machinelearning, #ML, and #mlearning, also appeared in the list. We can probably anticipate a sharp rise in this subgroup’s activity, including #chatGTP and related hashtags, in the #EdTech space in 2023.
As with the audience co-occurring hashtags, there was a clear pattern of emerging specialized topic-related hashtags that modified previously popular ones. For example, the popular term #stem evolved to include #steam, #stemeducation, #stemed, and #womeninstem appearing in the top 100. This differentiation and increased related hashtag usage could be one reason for decreased tweet count for top hashtags in 2022: greater specialization yields lower numbers in the general tags. Users gravitated to related, more specialized hashtags to create more focused dialogic spaces. Additionally, looking at the overall trends in both the audience and topic co-occurring hashtags, we noticed that diversity (#dei, #inclusion, #diversity, #quality, #equity), women (#womenintech, #womeninstem, #womenempowerment), and English language learning (#esl, #tefl, #efl, #elt, #tesol) became increasingly important in the #EdTech space. This specific type of differentiation may reflect the rising importance of these issues to the audience.
Another important trend in the #EdTech space this year was related to COVID-19 hashtags. In 2020, the most popular co-occurring hashtags after #education and #edchat were #remotelearning, #onlinelearning, #elearning, and #distancelearning, making up 11.47% (15,114 tweets by 4600 authors). These hashtags remained very popular in 2021, and together with #virtuallearning, #blendedlearning, #onlineeducation, and #digitallearning made up 16.10% (69,737 tweets by 10,611 authors) of #EdTech, while dropping to a mere 9% (43,034 tweets by 5910 authors) in 2022 (see Fig. 1). Clearly, conversations on Twitter paralleled a shift in perspective as we transitioned from the pandemic years. Of note, #elearning and #onlinelearning remained relatively popular (31,029 tweets or 72.1% of the 2022 subset). These two hashtags are more general and may represent the post-pandemic transition into accepting online learning environments and digital courseware (Seaman & Seaman, 2022a). On the other hand, #remotelearning and #distancelearning, hashtags closely tied to COVID-19 emergency learning, significantly decreased in usage (76.6% and 69.2%, respectively) in 2022.

COVID-19 Related Tweets in the #EdTech Affinity Space
Our #EdTech tweet analysis also examined attached external links. We found that 454,258 (95.0%) tweets included either an external link or an embedded media item (e.g., an image). Similarly, as in the past, prominent external links included news sites (edsurge.com, edtechmagazine.com, eschoolnews.com), specifically those connected to India (timesofindia.indiatimes.com, financialexpress.com, and indiaeducationadiary.com). Multimedia resources (youtube.com), file-sharing platforms (drive.google.com), and other social media (linkedin.com) links were also among the most common external links. Noteworthy among the top shared external links is the increased popularity of links to learning resource sites, such as oodlu.org, shakeuplearning.com, ilearn2.co.uk, and freetech4teachers.com.
What Were Trending Topics among School and School District Facebook Groups in 2022?
To understand which technologies were shared on school and district Facebook pages, we examined the domain names for all the hyperlinks posted by 16,309 publicly accessible pages. To carry out this analysis, we searched the homepages of all of the schools and school districts in the U.S. for links to Facebook pages. We then uploaded the links to Facebook pages we found to the CrowdTangle platformFootnote 1 to access publicly available posts for 2020–2022 and identified the domains of websites linked within schools’ and districts’ posts; more information on the data collection approach is provided in Rosenberg et al. (2022). The ten most-shared domains broken down by year (2020, 2021, and 2022) are presented in Table 5. The n represents the number of schools or districts sharing one or more links to these domains, and the percentage is the proportion of pages sharing one or more links that year. Thus, 9705 is the frequency with which links to YouTube were shared in 2020, and the percentage indicates that 60% of schools and districts with publicly accessible Facebook pages posted one or more links to YouTube over the year.
Looking across the years, we found that domains shared were largely consistent, with Google services—YouTube, Google Docs, and Google Drive—being the most shared in 2020, 2021, and 2022. We note that a greater proportion of districts shared links to YouTube in 2020 than in 2021 and 2022, possibly due to fewer activities being recorded and shared during the months following the beginning of the COVID-19 pandemic, specifically, late 2019 and early 2020. After Google services, links to Zoom were commonly shared the fourth-most across all three years, though the number of districts sharing Zoom links decreased from 26% in 2020 and 21% in 2021 to 11% in 2022—like fewer links to YouTube, a suggestion that districts were carrying out fewer activities remotely. Links to the CDC were the eighth-most shared in 2020, but such links were not in the top ten in 2021 and 2022. Apart from these, the domains shared were similar in makeup and frequency across years, showing the importance of tools for carrying out digital work and productivity as well as tools to facilitate event sign-ups (SignUpGenius), school-parent communication (Smore), and book and sports ticket sales (Scholastic and GoFan).
What Were Trends in EdTech Open Educational Resources (OER) in 2022?
In addition to Scopus and social media trends, we also examined an EdTech-focused Open Educational Resource (OER) platform EdTech Books (https://edtechbooks.org). OER are “teaching, learning, and research materials that reside in the public domain or have been released under an open license that permits their free use and re-purposing by others” (Creative Commons, 2020). OER can take various forms and sizes, including textbooks, lessons, courses, learning activities, assessments, technologies, syllabi, images, presentations, videos, and graphics. Being ‘open’ means that OER are freely accessible to anyone with internet access and can be retained, reused, redistributed, revised, and remixed as needed (Wiley, n.d.), providing significant opportunities for improving “the quality and affordability of education for learners everywhere” (Wiley & Hilton, 2018, p. 144). Research has repeatedly shown that OER quality is comparable to commercial resources (Clinton & Khan, 2019; Kimmons, 2015), and their adoption does not negatively impact student learning (Hilton, 2016; Hilton, 2019) while saving students money (Clinton, 2018; Hilton, 2016; Ikahihifo et al., 2017) and providing a variety of other benefits (Kimmons, 2016).
Though a shift to OER over the years has been slower than many would like (Seaman & Seaman, 2022b), and research on adoption patterns is problematized by an absence of central controlling agencies and systems, the field of educational technology may be somewhat ahead of the curve when compared to many other fields (cf., Rosenberg, 2023). The emergence of OER platforms like EdTech Books, Pressbooks, and LibreTexts supports this notion. For this year’s OER analysis, we selected EdTech Books as the authors are most familiar with this platform and have ready access to data. We believe that as an EdTech-focused platform, EdTech Books analytics may provide valuable insights into user behavior and how OER are developed, adopted, and used in our field.
In 2022, ETB provided free OER to more than 1.4 million users worldwide. A perusal of the most popular books or journal issues (Table 6), chapters (Table 7), and search terms revealed that readers seemed to be drawn to these resources when they were seeking information on broad theoretical aspects of educational technology (e.g., cognitivism, constructivism, sociocultural theory), technology-specific guidance (e.g., how to use Blooket, MySQL, or Photopea), or research and evaluation materials (e.g., sampling procedures or survey design), and analysis of end-of-chapter quality assurance ratings (similar to e-commerce five-star reviews) revealed that readers generally found the provided OER to be “High Quality” (3.0 = “Moderate Quality,” 4.0 = “High Quality,” 5.0 = “Very High Quality”).
Some of these works were peer-reviewed, while others were not. Some chapters and books were authored by professional scholars, while others were authored by students as part of open pedagogical learning projects (cf. Casey et al., 2023). Notably, some of the most-used and highest-quality OER in EdTech Books were authored by students or were published without peer review. This trend suggests the need to rethink peer reviews as a sole indicator of quality (Woodward et al., 2017; Kimmons, 2015), potentially including triangulation of data points, such as quality assurance ratings, citations and dissemination rates, times remixed, accessibility, usefulness, and prestige of adopting organizations.
Additionally, one of the stated goals of EdTech Books (and OER more broadly) is to improve access to learning opportunities for people all over the world. Analysis of readers’ country of origin and device type (Fig. 2) revealed that EdTech Books resources were heavily used throughout the world and accessed on a variety of devices. The top users of the site were the United States (33.8%), the Philippines (16.6%), and India (6.7%), with each other country accounting for 2.7% or less of total traffic. Moreover, more than one-third of users accessed resources on mobile devices, underscoring the importance of mobile-first design when creating OER because, in many countries, mobile devices with limited internet access are the norm for online-enabled learning.
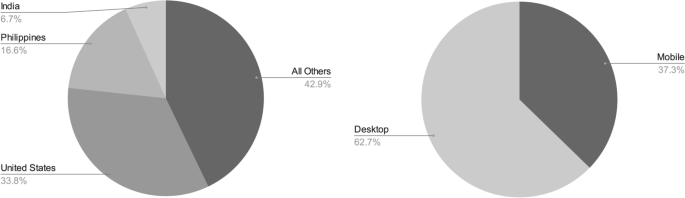
Most Common Countries and Device Types of ETB Users for 2022
Summary and Discussion
The analysis of 2022 edtech-related data from Scopus, Twitter, Facebook, and EdTech Books provided triangulated snapshots of the state of the educational technology field in 2022. Additionally, comparisons of the 2022 data trends to trends from previous years afforded additional insights into developments, directions, and shifts as the EdTech field responds to past and current events. We observed several noteworthy patterns, such as the general stability of trends in the field, specific post-pandemic shifts, the maturation of specialized topics, and emerging areas of interest. We hope that researchers and practitioners find the overall trends useful and those focusing on specific areas find the more detailed analyses of topics and terms helpful.
First, we found that the overall patterns across the platforms remained similar to previous years. The emphasis remained on “e-learning” and “online learning” in Scopus and on Twitter and Facebook. We continued to see a keen interest in emergent technologies, such as artificial intelligence and virtual/augmented reality, in Scopus data and on Twitter. It is possible that these topics are not as frequently mentioned on school and district Facebook pages because they serve a different communication function than Twitter and Scopus (schools-to-families vs. scholars-to-scholars). Rather than exchanging the latest technology ideas and tips among researchers and practitioners, school and district Facebook pages serve as a day-to-day communication tool and an information hub between schools (teachers and administrators) and families (students and parents). As in previous years, the school and school district Facebook page analysis and the Twitter external link analysis highlighted the continuous predominance of digital services by a single tech company: Google. Indeed, tools such as YouTube, Google Docs, and Google Drive have been widely adopted and have become intrinsic to any technology-related activities.
Second, not surprisingly, the analysis revealed a strong post-pandemic shift across the data on all three platforms: Scopus, Twitter, and Facebook. The Twitter data analysis suggested a sharp decline in COVID-19-related terms usage, including technology terms like “remote teaching.” Facebook data clearly indicated a shift from remote learning (a decline in remote technology use) to in-person activities (an increase in sports and events). Despite this shift, we saw increased references to online and hybrid learning across all three platforms, suggesting more ubiquitous use of these technologies and practices within existing educational systems as a supplement rather than a wholesale replacement (e.g., Seaman & Seaman, 2022a, b). Additionally, the appearance of “COVID-19,” “online learning,” and “during COVID” bigrams in Scopus data suggested that researchers are still reporting on EdTech activities during the pandemic.
Third, among other trends, Twitter data analysis suggested the maturation and specialization of topics reflective of evolving users’ needs and desires. Many popular hashtags remained at the top in 2022. However, the number of their tweets dropped, and new, yet related hashtags noticeably appeared at the top. For example, #stem evolved to include #steam, #stemeducation, #stemed, and #womeninstem. Such development suggests users’ understanding of hashtag functionality and responsiveness to the dynamic social media landscape. As hashtags become popular and mature, they may lose their differentiating power, and users start coining related hashtags to create more specialized spaces. As a related trend, we saw the emergence of diversity, women, and English language learning hashtags on Twitter this year, possibly suggesting that these issues are becoming increasingly important to the EdTech community.
In response to the commentaries from previous editorials, this year’s analysis indicates that many technology-related changes initiated during the pandemic may influence longer-term shifts, such as the increased interest in and normalization of online and blended learning. In addition, our OER analysis suggests that there is an appetite for resources to support both theoretical and practical work in educational technology and that the quality of resources available to professionals at all levels may be indicated by a variety of emergent methods beyond historic reliance on peer review and expertise (e.g., consider the widespread use and perceived quality of student-generated OER). As educational technology professionals grapple with this new reality in a world that increasingly requires focused guidance for our professionals worldwide, we should continue to move the field in directions that are responsive to the needs of a global educational technology community, in terms of topics, resources, contexts, formats, and accessibility.
References
Casey, C. C., Goodsett, M., Hoover, J. K., Robertson, S., & Whitchurch, M. (2023). Open Pedagogy. EdTechnica: The Open Encyclopedia of Educational Technology. https://edtechbooks.org/encyclopedia/open_pedagogy
Clinton, V. (2018). Savings without sacrifices: A case study of open-source textbook adoption. Open Learning: The Journal of Distance and Open Learning, 33(3), 177–189.
Clinton, V., & Khan, S. (2019). Efficacy of open textbook adoption on learning performance and course withdrawal rates: A meta-analysis. AERA Open, 5(3), 1–20. https://doi.org/10.1177/2332858419872212
Creative Commons (2020). Open education. https://creativecommons.org/about/program-areas/education-oer
Dang, S. (2022, October 26). Exclusive: Twitter is losing its most active users, internal documents show. Reuters. https://www.reuters.com/technology/exclusive-where-did-tweeters-go-twitter-is-losing-its-most-active-users-internal-2022-10-25/
Hilton, J. (2016). Open educational resources and college textbook choices: A review of research on efficacy and perceptions. Educational Technology Research and Development, 64(4), 573–590. https://doi.org/10.1007/s11423-016-9434-9
Hilton, J. (2019). Open educational resources, student efficacy, and user perceptions: A synthesis of research published between 2015-2018. Educational Technology Research and development. https://doi.org/10.1007/s11423-019-09700-4
Ikahihifo, T. K., Spring, K. J., Rosecrans, J., & Watson, J. (2017). Assessing the savings from open educational resources on student academic goals. The International Review of Research in Open and Distance Learning, 18(7). https://doi.org/10.19173/irrodl.v18i7.2754
Kimmons, R. (2015). OER quality and adaptation in K-12: Comparing teacher evaluations of copyright-restricted, open, and open/adapted textbooks. The International Review of Research in Open and Distributed Learning, 16(5).
Kimmons, R. (2016). Expansive openness in teacher practice. Teachers College Record, 118(9).
Kimmons, R. (2020). Current trends (and missing links) in educational technology research and practice. TechTrends, 64(6), 803–809.
Kimmons, R., & Rosenberg, J. M. (2022). Trends and topics in educational technology, 2022 edition. TechTrends, 66(2), 134–140.
Kimmons, R., & Veletsianos, G. (2016). Education scholars’ evolving uses of twitter as a conference backchannel and social commentary platform. British Journal of Educational Technology, 47(3), 445–464. https://doi.org/10.1111/bjet.12428
Kimmons, R., & Veletsianos, G. (2018). Public internet data mining methods in instructional design, educational technology, and online learning research. TechTrends, 62(5), 492–500. https://doi.org/10.1007/s11528-018-0307-4
Kimmons, R., Rosenberg, J., & Allman, B. (2021). Trends in educational technology: What Facebook, twitter, and Scopus can tell us about current research and practice. TechTrends, 65, 125–136.
Rosenberg, J. M. (2023). Open and useful? An exploration of the science education resources on OER Commons. Contemporary Issues in Technology and Teacher Education.
Rosenberg, J. M., Borchers, C., Stegenga, S. M., Burchfield, M. A., Anderson, D., & Fischer, C. (2022). How educational institutions reveal students’ personally identifiable information on Facebook. Learning, Media and Technology, 1–17. https://www.tandfonline.com/doi/full/10.1080/17439884.2022.2140672
Seaman, J. E. & Seaman, J. (2022a). Coming back together: Educational resources in U.S. K-12 education, 2022. https://www.bayviewanalytics.com/reports/k-12_oer_comingbacktogether.pdf
Seaman, J. E. & Seaman, J. (2022b). Turning point for digital curricula: Educational resources in U.S. higher education, 2022. https://www.bayviewanalytics.com/reports/turningpointdigitalcurricula.pdf
Sweney, M. (2022, December 13). Twitter ‘to lose 32m users in two years after Elon Musk takeover.’ The Guardian. https://www.theguardian.com/technology/2022/dec/13/twitter-lose-users-elon-musk-takeover-hate-speech
Veletsianos, G. (2017). Three cases of hashtags used as learning and professional development environments. TechTrends, 61, 284–292. https://doi.org/10.1007/s11528-016-0143-3
Wiley, D. (n.d.). Defining the “open” in open content and open educational resources. Retrieved from http://opencontent.org/definition/. Accessed 1 Feb 2023.
Wiley, D., & Hilton, J. L., III. (2018). Defining OER-enabled pedagogy. The International Review of Research in Open and Distributed Learning, 19(4). https://doi.org/10.19173/irrodl.v19i4.3601
Woodward, S., Lloyd, A., & Kimmons, R. (2017). Student voice in textbook evaluation: Comparing open and restricted textbooks. The International Review of Research in Open and Distributed Learning, 18(6). https://doi.org/10.19173/irrodl.v18i6.3170
Author information
Authors and Affiliations
Corresponding author
Additional information
Publisher’s Note
Springer Nature remains neutral with regard to jurisdictional claims in published maps and institutional affiliations.
Rights and permissions
About this article

Cite this article
Allman, B., Kimmons, R., Rosenberg, J. et al. Trends and Topics in Educational Technology, 2023 Edition. TechTrends 67, 583–591 (2023). https://doi.org/10.1007/s11528-023-00840-2
Published:
Issue Date:
DOI: https://doi.org/10.1007/s11528-023-00840-2