
Abstract
In addition to motor functions, it has become clear that in humans the cerebellum plays a significant role in cognition too, through connections with associative areas in the cerebral cortex. Classical anatomy indicates that neo-cerebellar regions are connected with the contralateral cerebral cortex through the dentate nucleus, superior cerebellar peduncle, red nucleus and ventrolateral anterior nucleus of the thalamus. The anatomical existence of these connections has been demonstrated using virus retrograde transport techniques in monkeys and rats ex vivo. In this study, using advanced diffusion MRI tractography we show that it is possible to calculate streamlines to reconstruct the pathway connecting the cerebellar cortex with contralateral cerebral cortex in humans in vivo. Corresponding areas of the cerebellar and cerebral cortex encompassed similar proportion (about 80 %) of the tract, suggesting that the majority of streamlines passing through the superior cerebellar peduncle connect the cerebellar hemispheres through the ventrolateral thalamus with contralateral associative areas. This result demonstrates that this kind of tractography is a useful tool to map connections between the cerebellum and the cerebral cortex and moreover could be used to support specific theories about the abnormal communication along these pathways in cognitive dysfunctions in pathologies ranging from dyslexia to autism.
Introduction
The cerebellum is a brain structure forming complex large-scale connections, whose integrative functions are still poorly understood. Besides a well-known role in motor learning and control (Holmes 1939; Evarts and Thach 1969), recent works have demonstrated a crucial role of the cerebellum in a number of other functions including cognition (Middleton and Strick 1994; Schmahmann and Caplan 2006). Tract-tracing and functional investigations both in non-human primates and in humans have shown projections from the dentate nucleus of the cerebellum to prefrontal and posterior parietal cortices via the thalamus supporting the hypothesis of a significant role for the cerebellum in higher cognitive and emotional processes (Middleton and Strick 1994; Schmahmann and Pandya 1995; Kelly and Strick 2003; Ramnani 2006; Strick et al. 2009). However, evidence in humans is more limited compared to that in non-human primates due to technical challenges of assessing in vivo the long polysynaptic connections between the cerebellum and the cerebral cortex (Snider and Eldred 1952; Nandi et al. 2002).
Recent developments in MRI technology have enabled the study of the anatomical cerebellar connections in vivo in humans using diffusion tensor imaging (DTI) and tractography (Habas and Cabanis 2007a, b; Jissendi et al. 2008; Doron et al. 2010; Anderson et al. 2011; Hyam et al. 2012). These techniques have already provided a visualization of afferent and efferent projections through the superior cerebellar peduncles (SCPs), the red nuclei (RN) and the thalamic projections to the cortex (Behrens et al. 2003a; Salamon et al. 2005). A major problem of these studies is that the diffusion tensor model has intrinsic limitations; in particular, it does not directly resolve crossing fibre structures (Alexander et al. 2001, 2002; Tuch et al. 2002; Jissendi et al. 2008; Tournier et al. 2011). The consequence is that tractography methods based on the diffusion tensor (DT) properties allow only partial reconstruction of cerebellar white matter tracts, and therefore have limited capability to reveal complex anatomical cerebello-thalamo-cortical circuits (Salamon et al. 2007). Some investigations have used alternative techniques, which overcome the intrinsic limitations of the DT model: diffusion spectrum imaging (DSI) (Wedeen et al. 2005) was used to study the intra-cerebellar connections in vivo in humans (Granziera et al. 2009) while multi-tensor reconstruction (Behrens et al. 2007) and constrained spherical deconvolution (CSD) (Tournier et al. 2007, 2012) were used to identify the dentate-rubro-thalamic pathway, originating from the dentate nucleus in the cerebellum and terminating in the contralateral ventrolateral (VL) and ventroanterior (VA) nuclei of the thalamus (Kwon et al. 2011; Van Baarsen et al. 2013; Akhlaghi et al. 2013). However, nobody has yet reconstructed the cerebello-thalamo-cortical pathway respecting the predicted decussation occurring just after the exit of the pathway from the SCP and leading it to the contralateral thalamus and cerebral cortex in a cohort of healthy subjects.
In this paper, we used advanced diffusion imaging methods to reconstruct, in humans in vivo, the pathway connecting the cerebellar cortex to the contralateral cerebral cortex, passing through the SCP, the RN and the thalamus. Figure 1 shows a schematic view of the most important connections that we expect to find in the cerebello-cerebral circuit. While recognizing that tractography provides only indirect evidence of anatomical connectivity between regions and cannot distinguish between direct connections and pathways involving synapses (like the cerebello-thalamo-cortical pathway) (Catani et al. 2012; Jones et al. 2013), we aimed to assess the usefulness of tractography for investigations of such large-scale neural circuits. In particular, we aimed to ascertain whether (1) pathways connecting the cerebellar cortex with the contralateral cerebral cortex can be reconstructed from in vivo diffusion data; (2) there is a consistency of the tract involvement in cortical areas of the cerebrum and cerebellum with similar function or anatomical meaning; (3) the majority of streamlines passing through the SCP connects the cerebellar hemisphere with contralateral associative areas, as has been hypothesized based on the supposed parallel evolution of these two brain structures (Sultan 2002). Achieving these aims would support the hypothesis that the cerebellum takes part in central circuits involved in higher brain functions and cognitive processing (Habas et al. 2009; Krienen and Buckner 2009; Buckner et al. 2011), and underpin future studies of abnormal communication along these pathways, which could be implicated in pathologies recently shown to involve the cerebellum, such as dyslexia and autism (Schmahmann and Caplan 2006; D’Angelo and Casali 2013).

The most important connections in the cerebello-cortical circuit. Projections from the basal ganglia (through the subthalamic nucleus, STN) go mainly to the thalamic nuclei (VA/VL). The cerebellum sends its output through the superior cerebellar peduncle (SCP), the contralateral red nucleus (RN), and VA/VL of the thalamus to various cerebral areas including the motor cortex (MC), the prefrontal cortex (PFC), the parietal cortex (PC), and the temporal cortex (TC). The decussation (d) of the cerebello-thalamo-cortical pathway is indicated by the yellow circle. Modified from D’Angelo and Casali (2013)
Materials and methods
In this paper, the reconstruction of the contralateral cerebello-thalamo-cortical pathway was achieved by combining two advanced diffusion techniques: tract reconstruction based on CSD, which can model multiple fibre populations within a voxel and is able to resolve the decussation of the trans-hemispheric connection, and super-resolution maps based on track-density imaging (TDI) (Calamante et al. 2010), which allowed accurate seed and target region placement. TDI maps improve resolution and white matter contrast compared with conventional DTI maps (such as mean diffusivity, MD, and fractional anisotropy, FA) and can be generated from high angular resolution diffusion imaging (HARDI) datasets (Calamante et al. 2010). After reconstruction of the cerebello-thalamo-cortical connections, a number of “tractography metrics” were defined in an attempt to quantify the pattern of the connections for specific cerebral and cerebellar cortical regions. Given the well-known challenges in quantifying connectivity based on tractography (Jones et al. 2013), we defined two simple metrics that, while imperfect, should nonetheless provide sufficiently robust evidence to support our conclusions. These are the proportion of each cortical region that is reached by the tractography algorithm and the proportion of the total cortical volume reached by the tractography algorithm that is contained within each cortical region; neither of these is expected to be overly influenced by streamline count. For completeness, we also report the streamline counts reaching each cortical region.
Subjects
The study was carried out on 15 right-handed healthy adults (7 males and 8 females; mean age 36.1 years and range 22–64 years) with no previous history of neurological symptoms. All participants gave written informed consent. The study protocol was approved by the local institutional research ethics committee.
MRI acquisition
All data were acquired on a Philips Achieva 3T MRI scanner (Philips Healthcare, Best, The Netherlands) using a 32-channel head coil. The HARDI scan consisted of a cardiac-gated SE echo-planar imaging (EPI) sequence acquired axial-oblique and aligned with the anterior commissure/posterior commissure line, for a total scan time of approximately 20 min. The imaging parameters were TR ≈ 24 s (depending on the cardiac rate), TE = 68 ms, SENSE factor = 3.1, acquisition matrix = 96 × 112, 2 mm isotropic voxel and 72 axial slices with no gap. The diffusion weighting was distributed along 61 optimized non-collinear directions with a b value of 1,200 s/mm2 (Cook et al. 2007). For each set of diffusion-weighted data, 7 volumes with no diffusion weighting (b0) were acquired. For anatomical reference a whole brain high-resolution 3D sagittal T1-weighted (3DT1w) fast field echo (FFE) scan was acquired using the following parameters: TR = 6.9 ms, TE = 3.1 ms, TI = 824 ms, acquisition matrix = 256 × 256, 1 mm isotropic voxel, 180 sagittal slices, acquisition time 6 min 31 s.
Diffusion analysis and fibre tracking
HARDI data were analysed using the FSL (FMRIB Software Library, http://fsl.fmrib.ox.ac.uk/fsl/fslwiki/) and MRtrix (http://www.brain.org.au/software/mrtrix/) software packages, following these steps:
-
1.
Pre-processing: Eddy current correction and brain extraction (Smith 2006) were performed using FSL.
-
2.
Structural-diffusion data alignment: The high-resolution 3DT1w volume was realigned to the diffusion data by inverting the full-affine transformation (12 degrees of freedom, FLIRT, FSL) (Jenkinson et al. 2002) from diffusion to high-resolution space.
-
3.
Decussation realignment: For each participant, the 3DT1w volume in diffusion space (obtained in step 2) was realigned along the superior/inferior direction to the MNI-152 template using a rigid body transformation (6 degrees of freedom) with nearest neighbour interpolation. This transformation was chosen to align the decussation region between all subjects to compare parameter values along the aligned tracts while minimizing potential biases that could be introduced when using non-linear registration of diffusion data; hence, we chose to perform the analysis in the individual subjects’ space. The transformations were then applied to the diffusion-weighted data. This space will be considered the subject’s native space from this point onward, rather than the acquired space.
-
4.
Whole brain tractography: To generate the TDI maps, whole brain tractography was performed with MRtrix using an algorithm that combines the CSD technique with probabilistic streamlines tractography (Tournier et al. 2012); the relevant parameters were seed = whole brain, step size = 0.1 mm, maximum angle between steps = 10°, maximum harmonics order = 8, termination criteria: exit the brain or when the CSD fibre-orientation distribution amplitude was <0.1. Streamlines were generated by randomly seeding throughout the whole brain until the desired total of 2.5 million streamlines had been selected.
-
5.
TDI map: From the streamlines obtained in step 4, a TDI map was created as the total number of streamlines passing within each element of a user-defined super-resolution grid (Calamante et al. 2010); for this study a 1-mm resolution grid was used.
-
6.
Cerebello-thalamo-cortical pathways: Cerebello-thalamo-cortical pathways were reconstructed by combining the CSD algorithm with probabilistic tractography and by tracking the bundle passing through two regions of interest (ROIs) (Schmahmann et al. 1999; Habas and Cabanis 2007a, b; Kwon et al. 2011): the SCP and the contralateral RN. These pathways were reconstructed by randomly seeding streamlines throughout the SCP seed ROI (see step 7) until 3,000 streamlines were reconstructed. For clarity, from this point onward the word “tract” is meant to indicate the tractography reconstruction of the cerebello-thalamo-cortical connection. To compare this with the conventional diffusion tensor model, cerebello-thalamo-cortical pathways were also reconstructed using a DTI-based streamline deterministic tractography by randomly seeding streamlines throughout the seed ROI defined by the SCP, and using the following parameters: step size = 0.1 mm, maximum angle between steps = 4.5°, initial FA ≥0.2, termination criteria: exit the brain or when the FA was <0.1; once again, a total of 3,000 streamlines were reconstructed. No contralateral target ROI was defined because with this approach tracts run only ipsilaterally.
-
7.
Seed/target ROIs placement: SCP and RN masks were placed using the high-resolution TDI images. The seed ROI was defined as a sphere with 2 mm radius centred on the SCP in each cerebellar hemisphere and was identified in the coronal plane, as described by Calamante et al. (2010), while the target ROI on the whole contralateral RN was recognized as a very hypointense region (Calamante et al. 2013).
-
8.
MNI normalization: 3DT1w images from all participants were normalized to the MNI-152 template using a non-linear registration algorithm with nearest neighbour interpolation from the FSL library (FNIRT) (Klein et al. 2009).
-
9.
Atlases-diffusion data alignment: The atlas of Brodmann areas (BA) and of the cerebellum (SUIT) (Diedrichsen et al. 2009) was aligned to native space of each subject by inverting the warping transformation obtained in step 8 to more accurately study the cerebellar pathways.
-
10.
Parcellation of cerebral and cerebellar cortices: For all participants, in native space, cerebral and cerebellar cortices were parcellated in two ways: one based on anatomical grounds, the other on a functional basis.
Anatomical parcellation consisted of the following areas:
-
Cerebrum: prefrontal cortex, frontal, parietal, temporal, occipital and limbic lobes (Brodmann 2006);
-
Cerebellum: anterior, VI, lateral Crus I–II, VIIb/VIII and inferior lobules (Schmahmann et al. 1999).
Functional parcellation consisted in the following areas:
-
Cerebrum: motor, associative, primary sensory, primary auditory and primary visual areas (Brodmann 2006);
-
Cerebellum: primary motor, sensory motor and cognitive/sensory areas (Diedrichsen et al. 2009).
Deep grey matter nuclei were segmented using FIRST (FSL). The following areas were considered in the analysis: basal ganglia (caudate, putamen and pallidus), thalamus, nucleus accumbens, amygdala and hippocampus.
-
-
11.
Quantification of cROItract, i.e. the percentage of each cortical region (cROI) within the tract: as shown by Fig. 2 this index reflects the proportion of the parcellated cortical region under consideration (cROI) that is involved in the cerebello-thalamo-cortical pathway. For each parcellation and for each subject in native space, cROItract was calculated as the percentage number of voxels within the parcellation that were reached by any number of streamlines within the tract.
Fig. 2 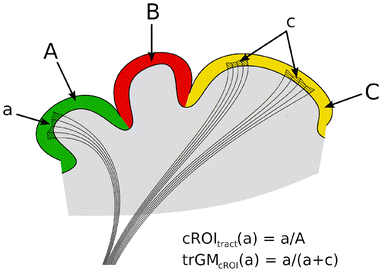
The two tractography metrics: cROItr and trGMcROI. Each different colour (green, red, yellow) and capital letter represents a different cortical parcellation (cROI) while each lowercase letter represents the cortical region reached by the tract for each cROI
-
12.
Quantification of trGMcROI, i.e. the proportion of the overall tract grey matter (GM) belonging to a specific cROI: as shown by Fig. 2 this index reflects the proportion of the total cortical GM involved in the tract that belongs to a particular parcellated cortical region. For each parcellation and for each subject in native space, trGMROI was calculated as the percentage of all cortical voxels reached by any streamline in the tract that belong to the particular cROI of interest. This analysis was also performed for the deep GM nuclei, by computing the metric over all voxels within the deep GM regions.
-
13.
Quantification of TSC, i.e. the total streamline count: this measure reflects the number of the streamlines reaching the cortex rather than the number of voxels of the tract included in the cortex. For each cortical parcellation TSC was calculated with MRtrix isolating from a tract only the streamlines that entered a given region.
-
14.
Mean cerebello-thalamo-cortical pathway: To assess the consistency of the tracts in MNI space and for display purposes the tracts from all subjects were normalized using the same transformation calculated for 3DT1w images in step 8. A mean image of tracts was calculated from the binarized tracts for each subject (Ciccarelli et al. 2003). Voxels were assigned the count of the number of subjects with that specific voxel included in the mask. The mean tracts’ image was thresholded to include voxels common to at least 20 % of subjects. The unthresholded left and right mean tracts in MNI space are available on request.
-
15.
Thalamus parcellation: Since the thalamus is a synaptic relay, to assess whether the reconstructed cerebello-thalamo-cortical pathways actually reflected the thalamo-cortical connectivity, the thalamus was parcellated as indicated by Behrens et al. (2003a, b) and the mean cerebello-thalamo-cortical pathway was superimposed in MNI space.

Results
The reconstruction of the cerebello-thalamo-cortical pathway
The combination of using the CSD algorithm and probabilistic tractography successfully reconstructed the cerebello-thalamo-cortical pathways in all subjects. Seeding from the SCP, streamlines were identified connecting the cerebellar cortex to the contralateral cortical hemisphere, passing through the contralateral RN. Figure 3 shows a comparison between the cerebello-thalamo-cortical pathway reconstructed using DTI and the streamline deterministic tractography (Fig. 3a) and a combination of CSD and the probabilistic tractography (Fig. 3b) in a representative subject. As can be seen in Fig. 3a, the DTI approach fails to reconstruct contralateral connections, which is a problem that cannot be resolved even with the usage of a contralateral target ROI. To select the contralateral connections it is therefore necessary to start from a non-tensor-based approach such as CSD, which produces streamlines running both ipsi and contralaterally (Fig. 3b); to isolate just the contralateral pathway it is necessary to add of a target region that we chose to be the contralateral red nucleus (Fig. 3c). Figure 4 also shows a 2D rendering of both cerebello-thalamo-cortical pathways from a representative subject. In particular, Fig. 4a shows the tracts colour-coded by direction in order to represent their anatomy, while Fig. 4b shows the same tracts using a single colour per tract in order to distinguish left from right-side streamlines highlighting their extensions into the cerebral and cerebellar cortices.

Example of cerebello-thalamo-cortical pathway from a representative subject. This is a 2D rendering of streamlines extending over a volume of 5 mm, but mapped to a section of 1 mm thick. The same seed ROI (a–c) was placed on left superior cerebellar peduncle. a The tract was reconstructed using DTI and streamline tractography. No target ROI was drawn. b The tract was reconstructed using a combination of the CSD algorithm and probabilistic tractography. No target ROI was drawn. c The tract was reconstructed as in b with a target ROI drawn on the whole contralateral red nucleus. d Details of the fibre-orientation distribution (FOD) within the decussation region. e Details of the FOD and tract within the decussation region

2D rendering of both left and right cerebello-thalamo-cortical pathways from a representative subject. a The tracts are colour-coded by direction to follow the anatomy and the directionality of both left and right tracts. b The tracts are reported using a single solid colour for each tract to distinguish the streamlines from the left (red) and right (blue) pathways
To highlight the extent of the cerebello-thalamo-cortical pathway, Fig. 5 shows different views of the average tract across all subjects in MNI space. Figure 5a shows the distribution of streamlines in the cerebral cortex: the reconstructed tracts reach the prefrontal, frontal and temporal cortices with a high density of streamlines. Figure 5b shows streamlines distribution in the cerebellar cortex: the highest density of streamlines is observed in lateral Crus I–II and in lateral lobules VIIb/VIII. Figure 5c shows that specific deep grey matter nuclei were reached by a high number of streamlines, especially the VA and VL nuclei in the thalami and the caudate nuclei (but also putamen and pallidus) in the basal ganglia. The tracts also show that most of the cerebellar streamlines are ipsilateral to the SCP seed, with a minimal portion of streamlines crossing contralaterally; the connection to the cortex, instead, runs contralaterally to the SCP seed (as imposed by the presence of the waypoint region of the contralateral RN) with a small number of streamlines running into the septum.

Tridimensional view of the average cerebello-thalamo-cortical pathway across all subjects in MNI space. Cerebral (a), cerebellar (b) and deep grey matter (c) atlases are overlaid to assist visualization of cerebellar connections. a Distribution of left (red) and right (blue) tracts in the cerebral cortex: the reconstructed tracts reach the prefrontal (yellow), frontal (fuchsia) and temporal (violet) cortices with greater density of streamlines. b Streamlines distribution in the cerebellar cortex: the lateral Crus I–II (fuchsia) and the lateral lobules VIIb/VIII (green) are showing the greatest density of tracts. c Streamlines distribution of deep grey matter nuclei: the thalami (violet), the caudate (light blue) and the putamen (fuchsia) show the greatest trGMcROI
For completeness, we have also displayed the cerebello-thalamo-cortical pathway from cerebellar cortex to cerebral cortex by showing slice-by-slice its extension in Supplementary Materials (Supplementary Figure 1). This also demonstrates connections between the cerebellum and septal regions. For simplicity, we have chosen to show only the cerebello-thalamo-cortical pathway seeded in the left SCP.
To highlight the extension of the tract in the thalamic relay, Fig. 6 shows different views of the average tract across all subjects overlaid onto the parcellated thalamus in MNI space. The highest density of streamlines is seen in the VA and VL nuclei of the thalamus, which correspond to areas principally connected with prefrontal and frontal (motor) cortices (Behrens et al. 2003a; Zhang et al. 2008; Mang et al. 2012). A few streamlines reached the anterior thalamic area and from there the temporal lobe. An even smaller contingent of streamlines reached posterior thalamic nuclei and the pulvinar and from there the parietal and occipital lobes.

Extension of the left cerebello-thalamo-cortical pathway overlapped to the parcellated thalami in a representative subject. L indicates the left side of the brain. a 2D rendering: the highest density of streamlines is seen in the VA and VL nuclei of the thalamus, which correspond to areas principally connected with prefrontal (yellow) and frontal (orange and blue) cortices. b Tridimensional representation of the tract: the VA and VL nuclei of the right thalamus (yellow, orange and blue) are hidden from the tract
Tractography metric results
The destination of SCP streamlines in different brain structures, including cerebellar and cerebral cortices and deep grey matter nuclei, was evaluated using three parameters: cROItract, trGMcROI and TSC (see steps 11–13 of the “Materials and methods”). In turn, cerebral and cerebellar cortices were parcellated into two sets of regions based on either their anatomical or functional basis (see step 10 of the methods) (Schmahmann et al. 1999; Diedrichsen et al. 2009).
Anatomical parcellation Table 1 reports cROItract, trGMcROI and TSC (averaged across subjects) for left and right tracts added together in all cerebral and cerebellar cortical areas as defined by anatomical parcellation. In the cerebrum, the prefrontal cortex showed the highest value of the three tractography metrics. In the cerebellum, the area of lobule VIIb–VIII showed the highest value of cROItract and Crus I–II showed the highest value of trGMcROI, while the anterior lobule showed the highest TSC value.
Functional parcellation Table 2 reports cROItract, trGMcROI and TSC (averaged across subjects) for left and right tracts added together in all cerebral and cerebellar cortical areas defined on their functional bases. In the cerebrum, the motor area showed the highest value of cROItract, while the associative area showed the highest value of trGMcROI and TSC. In the cerebellum, the sensory motor area showed the highest value of cROItract, while the cognitive and sensory area showed the highest value of trGMcROI and the primary motor area showed the highest value of TSC.
Deep grey matter parcellation Table 3 reports cROItract, trGMcROI and TSC (averaged across subjects) for left and right tracts added together in deep grey matter nuclei. The pallidi showed the highest value of cROItract, while the thalami showed the highest value of trGMcROI and of TSC.
Tractography suggests that the cerebello-thalamo-cortical pathway spreads out to many different areas of the brain. We also compared the proportions of the tract that reached the cerebellar and cerebral cortices in anatomically and functionally corresponding areas, providing evidence for the presence of structural connectivity between these regions. The results are visualized in Fig. 7, where the mean values of trGMcROI and of TSC are shown for each parcellation of the cerebral and cerebellar cortices.

Histograms of mean values of trGMcROI and TSC for each region of the cerebral cortex and of the cerebellar cortex. PFC prefrontal cortex, FC frontal cortex, PC parietal cortex, TE temporal cortex, OCC occipital cortex, LC limbic cortex, MOT motor, ASS associative, SOM-SEN somatosensory, PVIS primary visual, PAUD primary auditory, PMOT primary motor, COGN cognitive/sensory, SEN-MOT sensory motor. a trGMcROI values of all cerebral and cerebellar regions created on anatomical bases. PFC and Lateral Crus I–II have the highest values in cerebrum and cerebellum, respectively. b TSC values of all regions created on anatomical bases. PFC and lobules I–V have the highest values in cerebrum and cerebellum, respectively. c trGMcROI values of all regions created on functional bases. ASS and COGN areas have the highest values in cerebrum and cerebellum, respectively. d TSC values of all regions created on functional bases. ASS and PMOT areas have the highest values in cerebrum and cerebellum, respectively
Anatomical parcellation
The main findings from Table 1 are as follows:
-
Correspondence between trGMcROI of the anterior cerebellum (lobules I–V and lobule VI) and the cerebral frontal lobe, with values of 14 % ± 4 % and 16 % ± 5 %, respectively.
-
Correspondence between trGMcROI of the prefrontal cortex and the lateral Crus I–II, with values of 38 % ± 11 % and 48 % ± 4 %, respectively.
Functional parcellation
The main findings from Table 2 are as follows:
-
The hemispheres of the cerebellum and the cortical associative areas have comparable trGMcROI of 79 % ± 4 % and 80 % ± 8 %, respectively.
-
The primary auditory and visual cortices show negligible values of trGMcROI of 1 % ± 1 % and 3 % ± 3 %, respectively.
Discussion
In this study, we show that tractography can realistically be used to map the pathway connecting the cerebellar hemispheres with the contralateral cerebral cortex passing through the SCP, RN and thalamus, despite the complications introduced by synapses and the decussation just after the SCP. Based on the more details of the TDI maps, the SCP was used as seed and the contralateral RN as target. The combination of a CSD algorithm with probabilistic tractography then allowed the reconstruction of the cerebellar connections towards several regions of the cerebral cortex. Quantitative analysis of tract projections passing through the SCP and RN showed that the cerebellar hemispheres on one side and the associative cerebral cortex on the other encompassed about 80 % of the tract. Our findings provide structural reconstruction in humans in vivo of the crossed-fibre pathways from cerebellar to cerebral cortex in accordance with predictions by ex vivo anatomical investigations (Voogd 2003; Standring 2008) and support the hypothesis of a prominent connectivity of lateral cerebellum to contralateral associative areas (Buckner et al. 2011).
It is however important to emphasize that tractography methods are inherently incapable of distinguishing between single neuron pathways and connections involving synapses, such as those assessed in this study. Nevertheless, tractography is currently the only in vivo in human method for investigating structural connectivity of specific systems and can be used to obtain reliable results, provided certain conditions are met; these are discussed in detail in the “Limitations of the present study” section below.
The reconstruction of the cerebello-thalamo-cortical pathway
Recent studies have assessed cerebellar tract reconstruction using different types of tractography in vivo in human subjects (Salamon et al. 2007; Habas and Cabanis 2007a, b; Jissendi et al. 2008; Granziera et al. 2009; Doron et al. 2010; Anderson et al. 2011; Kwon et al. 2011; Hyam et al. 2012). Most of these studies have investigated cerebello-thalamo-cortical pathways (Salamon et al. 2007; Habas and Cabanis 2007a, b; Jissendi et al. 2008; Doron et al. 2010; Anderson et al. 2011) and a few others have reconstructed intra-cerebellar pathways (Granziera et al. 2009; Takahashi et al. 2013; Dell’Acqua et al. 2013). Several of these studies used the DT model and showed pathways passing through the SCPs and running ipsilaterally towards the cerebral cortex (Salamon et al. 2007; Habas and Cabanis 2007a, b; Jissendi et al. 2008; Doron et al. 2010; Anderson et al. 2011; Hyam et al. 2012). Some other studies instead exploited more complex models to reconstruct portions of the pathway or the intra-cerebellum connections in vivo (Granziera et al. 2009; Kwon et al. 2011; Van Baarsen et al. 2013; Akhlaghi et al. 2013) and post-mortem (Takahashi et al. 2013; Dell’Acqua et al. 2013). The decussation of the SCP is expected to occur from classical neuroanatomical descriptions (Voogd 2003; Standring 2008), but its reconstruction using MRI techniques in vivo in humans has only been achieved by a few studies using advanced diffusion approaches (Tuch et al. 2002; Tuch 2004; Wedeen et al. 2008; Tournier et al. 2012; Fernandez-Miranda et al. 2012; Van Baarsen et al. 2013; Akhlaghi et al. 2013). To the best of our knowledge, only two studies used advanced techniques, e.g. CSD and probabilistic tractography, to reconstruct the dentate–rubral and dentate–thalamic pathways in pathological conditions. Akhlaghi et al. (2013) demonstrated that the dentate-thalamo-cortical tracts of patients with Friedreich ataxia showed a decreased FA value and an increased MD value compared with controls, while Van Baarsen et al. (2013) demonstrated, in a single patient with cerebellar mutism, that changes in FA and MD values along the dentate-rubro-thalamic tract and its alterations might be the cause of the mutism. Both of these studies assessed how specific pathologies affected structural characteristics of the tracts of interest rather than investigating cerebellar involvement in cognitive processes, therefore offering complementary information to our findings. These observations confirm the importance of anatomical and functional studies of cerebellar connections in understanding pathologies.
In this paper we have shown contralateral connections between the cerebellum and the prefrontal, frontal and parietal cortices via the thalamus in humans in vivo, which we achieved by implementing a pipeline with two key points: the selection of a non-Gaussian diffusion model and the definition of a seed and a target ROI (Palesi et al. 2013). We chose to combine a method based on CSD with probabilistic tractography, because this approach has been shown to allow tracking through complex crossing fibre regions (Tournier et al. 2012; Akhlaghi et al. 2013). Using this approach we could reconstruct the contralateral cerebello-thalamo-cortical pathways originating from both left and right SCPs, which are completely missed using DT-based tractography methods. In fact, streamline DTI tractography techniques are unable to resolve the convergence of differently oriented tracts into the same area, as occurs in the white matter in the medullary core of the cerebellum. This intrinsic limitation could only be partially overcome using probabilistic tractography. To better represent the fibre structure, non-tensor models must be used that are known to address these fibre-crossing issues. The further use of a seed and contralateral target ROI, placed on high-resolution TDI images, warranted the selection of streamlines crossing at the decussation point as we expected from anatomical knowledge. Notice that the use of a seed and contralateral target ROIs cannot help resolving the lack of crossing streamlines when using the DT model.
The pathways that we generated show anatomical consistency between subjects, involving several areas of the cerebellar cortex, cerebral cortex and deep grey matter nuclei, passing through the VA and VL nuclei of the thalamus, caudate and putamen. In particular, most cerebellar streamlines are ipsilateral compared to the SCP seed, while a minimal proportion of streamlines cross over to the contralateral side. These findings are anatomically plausible (Watt and Mihailoff 1983; Noda et al. 1990).
Tractography metric results
Having shown that the cerebello-thalamo-cortical pathway reconstructed by tractography was in accordance with findings from tract-tracing studies, as discussed above, we introduced metrics that reflect how different grey matter areas could be involved in the reconstructed tracts, allowing us to make further observations regarding the characteristics of the cerebello-thalamo-cortical pathway. In particular, comparable proportions of cortex were reached by the tract in anatomically and functionally corresponding areas of the cerebellar and cerebral cortices. Thus, areas expected to be connected from functional studies are also characterized by similar tractography metrics, in accordance with suggestions of strong links between the developments of corresponding regions (Sultan 2002).
From the anatomical parcellation point of view (Table 1), our results were in agreement with classical literature results by finding that the anterior cerebellum (lobules I–VI) and the cerebral frontal lobe were similarly involved in the tract (trGMcROI was 14 and 16 %, respectively). These findings support a correspondence between these two areas, in line with the expected topography of primary motor and premotor areas (Snider and Eldred 1952; Grodd et al. 2001; Kelly and Strick 2003). Indeed, these regions are known to be reciprocally connected and to subserve motor and premotor functions (Schmahmann et al. 1999; Diedrichsen et al. 2009; Krienen and Buckner 2009).
From a cognitive point of view we would expect to find anatomical correspondence between prefrontal cortex and the lateral Crus I–II (Habas et al. 2009; Krienen and Buckner 2009). Our data show that indeed there is similar involvement between lateral Crus I–II and prefrontal areas (trGMcROI was 48 ± 4 and 38 ± 11 %, respectively). Furthermore, our results are supported by recent tract-tracing and electro-physiological studies on primates and rats demonstrating that the cerebellum is effectively linked to the prefrontal cortex forming “closed-loop” connections (Middleton and Strick 2001; Mittleman et al. 2008; Arguello et al. 2012; Watson et al. 2014). Indeed, the cerebellar pathway extended considerably into prefrontal cortical areas in agreement with ex vivo anatomical determinations, which have shown that the cerebellum is reciprocally connected with the medial prefrontal cortex (PFC) (Watson et al. 2009), the dorsolateral PFC (Kelly and Strick 2003), and the anterior PFC (Krienen and Buckner 2009). The medial PFC is important in saccadic movements and cognitive control (Ridderinkhof et al. 2004) and is strongly involved in determining behaviour on the basis of expectations (Amodio and Frith 2006). Moreover, this cortical area plays a key role in fear extinction processes (Morgan et al. 1993; Milad and Quirk 2002). The dorsolateral PFC is particularly important in working memory (Petrides 2000), mental preparation for imminent actions (Pochon et al. 2001), and procedural learning (Pascual-Leone et al. 1996) and its functional alteration is involved in major psychoses (Weinberger et al. 1986, 1988; Dolan et al. 1993). The anterior PFC is less well understood (Ramnani and Owen 2004) but its main function could be that of integrating multiple distinct cognitive processes during goal-directed complex behaviours. Therefore, the fact that there is a possible correspondence of tractography metrics between cortices with similar functional roles, as reported here, supports the hypothesis of a route through which the cerebellum can influence both cognitive tasks through connections with various areas of the PFC and sensory and motor tasks through connections with frontal and parietal cortices (Schmahmann and Pandya 1993; D’Angelo and Casali 2013).
The observation that the parietal cortex only encompassed 4 % of the tract-connected GM is likely due to the low number of streamlines connecting between the cerebellum and the posterior thalamic nuclei (Fig. 6). Indeed studies focused on thalamic connectivity (Behrens et al. 2003b; Zhang et al. 2008; Mang et al. 2012) have demonstrated that the VA and VL nuclei of the thalamus are mainly connected with motor areas and the prefrontal cortex rather than the parietal cortex, which is in turn principally connected with the posterior thalamic nuclei receiving somatosensory information from pathway ascending from spinal cord and brain-stem. From ex vivo experiments it is known that the cerebellum sends outputs through the posterior VL of thalamus to the inferior parietal lobe (Clower et al. 2001), which is involved in response to the sight of an object, as well as to the act of grasping it, in reach-to-grasp arm movements (Tunik et al. 2005), and in the creation of cross-modal sensorial representations of objects (Grefkes et al. 2004). Therefore, the combination of findings from imaging studies on thalamo-cortical connectivity and from ex vivo experiments suggests the existence of a physiological connection between the cerebellum and the parietal cortex through the posterior VL thalamic nucleus. Our findings are in agreement with this hypothesis because the cerebello-thalamo-cortical pathway that we reconstructed mainly connects the cerebellum with the VA and VL thalamic nuclei. Further evidence of the coherence between our results and the literature is represented by the scarce connection we observed between the cerebellum and the parietal cortex through the posterior VL thalamic nucleus. Moreover, indications from literature suggest functional connectivity between the cerebellum and the parietal cortex (Buckner et al. 2011) but the existence of a direct anatomical pathway is still debated (Clower et al. 2005).
The temporal lobe encompassed 35 % of the tract-connected GM. Although the exact nature of connections between the temporal lobe (including the hippocampus and amygdala) and the cerebellum is still unclear, this connectivity is in line with studies showing that the temporal cortex indeed contributes to the cortico-pontine pathway both in humans and in macaque monkeys (Ramnani 2006). Indeed fMRI resting state (He et al. 2004) and dynamic causal modelling (Booth et al. 2007) have revealed functional connectivity between cerebellum and temporal areas, although this may in part depend on connections emitted by the fastigial nuclei through the middle cerebellar peduncle (at least in monkeys and cats) (Heath and Harper 1974).
Of the functional parcellation results (Table 2), the most striking finding was that the hemispheres of the cerebellum and the cortical associative areas encompassed 79 and 80 % of the tract GM, respectively. The associative cortex comprises the prefrontal (BA 9–12, 25, 46–47), parietal (except BA 1–3) and temporal (except BA 41–42) cortices and the limbic lobe. Since prefrontal, limbic and parts of parietal and temporal cortices are known to be involved in cognitive processes at different level of complexity (D’Angelo and Casali 2013), our results supports the theory that lateral areas of the cerebellum are also involved in higher cognitive processes (Schmahmann et al. 1999; Strick et al. 2009; Diedrichsen et al. 2009; Habas et al. 2009; Krienen and Buckner 2009; Watson et al. 2014).
The primary auditory and visual cortices only constituted 1 and 3 % of the tract-connected GM (Table 2), respectively, in line with the results from Buckner et al. (2011) who, using fMRI, have shown that primary auditory and visual cortices did not appear functionally connected with the cerebellum. On the other hand, these streamlines may be underestimated in this tractography study due to their relative position with respect to the cerebellum. Indeed, fibres connecting the cerebellum with visual and auditory areas (located in the occipital and temporal lobes, respectively) might have high curvature and therefore be partially undetected by tractography methods (e.g. see discussion in Buckner et al. 2011). A fairly recent DTI study (Doron et al. 2010) suggests that the cerebellum is strongly connected with the precentral gyrus and the superior frontal gyrus, which take part in motor and oculomotor processes as well as in the processing of spatial working memory (Du Boisgueheneuc et al. 2006). However, the very important role played by the cerebellum in controlling the execution of saccades, in elaborating the visuospatial information concerning the eye target (Tilikete et al. 2006; Guerrasio et al. 2010) and in controlling vestibulo-ocular reflexes, depends on connections emitted by the fastigial and vestibular nuclei through the inferior and middle cerebellar peduncles, which cannot be detected by placing a seed in the SCP.
An additional observation is the presence of a conspicuous number of streamlines connecting the cerebellum to the basal ganglia via the RN and the thalamus (Middleton and Strick 2002). Although the anatomo-functional relationship between basal ganglia and cerebellum remains unclear, a fast synaptic connection has recently been reported between these two structures (Chen and Khodakhah 2012), which also show coherent activity in fMRI recording (Mastropasqua et al. 2013). Moreover, basal ganglia are secondarily affected by atrophy in the presence of cerebellar damage (Dayan et al. 2013; Olivito et al. 2013). It has been postulated that a functional relationship between basal ganglia and cerebellum could be important for controlling movement (Amaral 2000). However, although our observation is in line with this concept, we have to point out that the present technique cannot be used to determine either the direction of the streamlines (projecting to or from the thalamus) or whether there are effective synaptic connections allowing communication between cerebellum and basal ganglia through the thalamus. Therefore, the nature of observed streamlines apparently connecting cerebellum and basal ganglia remains to be clarified.
Finally, our analysis also revealed streamlines reaching the septum. Again, although connections between the cerebellum and deep parts of the limbic system (including the septum) have been suggested (Heath et al. 1978), the synaptic nature and directionality of this pathway as well as functional evidence in humans await experimental confirmation.
Limitations of the present study
While tractography is compelling in being applicable in vivo non-invasively, and hence in human subjects, it suffers from well-documented shortcomings. Although these have already been reported in several tractography publications, these limitations are discussed here in the context of the specific pathway under investigation in this study.
First of all, MRI tractography cannot distinguish between efferent and afferent fibres, since water diffuses equally in both anterograde and retrograde directions. The present results therefore cannot be used to inform models that rely on the determination of the direction of axon potential propagation.
Second, tractography methods cannot at present discriminate between direct and indirect connections between regions, since the diffusion weighted signal is influenced by the average microstructural architecture over the scale of an imaging voxel, and not by the directionality of the signalling process or the presence of synapses. Indeed, the cerebello-thalamo-cortical pathways are known to be polysynaptic and are not expected to form a direct connection between the cerebral and cerebellar cortices. In particular, it must be acknowledged that the connections to/from the VA and VL nuclei of the thalamus are complex, including not only fibres from the SCP but potentially also fibres from the basal ganglia. However, while tractography cannot identify regions of synapses, it is a mathematical algorithm with predefined rules and as such it may nonetheless be able to delineate onward connections if these rules are respected; for example, fibre-tracking algorithms typically require a certain degree of alignment between the fibre orientations estimated in neighbouring voxels; provided this requirement is satisfied, the algorithm will proceed through a region of synapses. If on the other hand the fitting of the fibre orientation distribution is noisy or does not capture the correct microstructure, the tractography algorithm could terminate even if there is continuity of the underlying biological tract.
One further limitation of tractography studies in general is that diffusion MRI data are rarely acquired at resolutions higher than 2 mm isotropic; this low spatial resolution is a considerable limitation when reconstructing pathways that converge onto a small structure and subsequently diverge towards a wider area of the brain. Here, we used a combination of CSD and super-resolution track-density imaging at 1 mm resolution to minimize this problem.
Another issue is related to the fact that tractography algorithms preferentially choose streamlines with minimal bending and there is a dependency of tract volume on path length and the tractography algorithm itself. Connections from the VA thalamic nucleus towards the prefrontal cortex have the highest trGMcROI and TSC and also are characterized by minimal bending. Moreover, the anterior lobule of the cerebellum has the highest value of TSC and it is also the closest cerebellar region to the SCP seed point of the tract. However, the observed anatomical difference among these areas matches the expected difference in functional connectivity (Habas et al. 2009; Krienen and Buckner 2009), suggesting that, for this specific application, streamline connectivity revealed by our technique is not critically affected by anatomical constraints.
A final consideration on the validation of tractography results (Mori and van Zijl 2002) is that while tractography can indeed provide macroscopic neuroanatomical information on white matter pathways by reconstructing fibre structures that contain bundles of axons running along the same orientation, it cannot distinguish individual axonal pathways, whose diameter is typically less than 10 μm. For this reason, tractography cannot claim that the reconstructed tracts are anatomically accurate, and in fact results should be validated using other techniques. The most common way to infer information about axonal connectivity is using virus retrograde transport and chemical tract-tracing techniques in animals (Middleton and Strick 2002; Kelly and Strick 2003; Clower et al. 2005). The principal issue is that these techniques provide information at cellular level that cannot be compared directly to MR-derived results. Moreover, tract-tracing techniques cannot be applied to humans, where most information has come from post-mortem histological data (McNab et al. 2009; Miller et al. 2011; Seehaus et al. 2013; Dell’Acqua et al. 2013). An approach combining post-mortem dissection with advanced tractography seems best suited to characterize white matter architecture in humans and validate tractography results (Catani et al. 2012; Dell’Acqua et al. 2013), but requires the use of non-conventional scanners. A further way to validate tractography results is to compare the core of major white matter tracts with classical anatomical knowledge, because trajectories and locations of these tracts are fairly well known. However, the subcortical portions of the reconstructed tracts remain problematic due to the high uncertainty of fibre direction at the grey/white matter border.
Recent developments in tracking methods (e.g. Smith et al. 2012, 2013) may help minimize some of these effects in future work, and thus provide a more accurate estimate of the connections between cerebellar and cerebral cortices. Nonetheless, most of these limitations are inherent to diffusion MRI and will invariably need to be taken into consideration when interpreting any tractography results.
Conclusions
We have shown that our advanced imaging methods allow visualization of the pathway connecting the cerebellar hemispheres with the contralateral cerebral cortex, passing through the SCP, red nucleus and VL and VA nuclei of the thalamus. The demonstration of congruent trGMcROI of the cerebral and cerebellar cortices in functionally corresponding areas bears relevant functional implications. First, this result supports the coevolution of the two structures proposed on the basis of comparative cortical surface measurement across vertebrates (Sultan 2002). Secondly, since the cerebellar network has almost identical structure in all its sections and is organized in parallel poorly interacting modules (Standring 2008), it is possible that a similar computational cerebellar algorithm is applied to different cortical functions, ranging from motor control to sensory perception and cognition. This observation has special relevance for the generation of computational schemes and models of cerebro-cerebellar network loops (Ito 2008). Given that our advanced imaging analysis was successful using high-quality data acquired on standard clinical scanners, this method has immediate potential in the assessment of cerebellar structural connectivity in neurological conditions, for example in dyslexia and autism (e.g. Bauman and Kemper 2005; Boso et al. 2010) for which a cerebellar origin has been proposed (for review see D’Angelo and Casali 2013).
References
Akhlaghi H, Yu J, Corben L et al (2013) Cognitive deficits in friedreich ataxia correlate with micro-structural changes in dentatorubral tract. Cerebellum. doi:10.1007/s12311-013-0525-4
Alexander AL, Hasan KM, Lazar M et al (2001) Analysis of partial volume effects in diffusion-tensor MRI. Magn Reson Med 45:770–780
Alexander DC, Barker GJ, Arridge SR (2002) Detection and modeling of non-Gaussian apparent diffusion coefficient profiles in human brain data. Magn Reson Med 48:331–340. doi:10.1002/mrm.10209
Amaral DG (2000) The functional organization of perception and movement. In: Kandel ER, Schwartz JH, Jessell TM (eds) Princ. Neural Sci., 4th edn. McGraw-Hill, New York, pp 337–348
Amodio DM, Frith CD (2006) Meeting of minds: the medial frontal cortex and social cognition. Nat Rev Neurosci 7:268–277. doi:10.1038/nrn1884
Anderson VM, CaM Wheeler-Kingshott, Abdel-Aziz K et al (2011) A comprehensive assessment of cerebellar damage in multiple sclerosis using diffusion tractography and volumetric analysis. Mult Scler 17:1079–1087. doi:10.1177/1352458511403528
Arguello PA, Enquist LW, Wang SS-H (2012) Long-distance connectivity between prefrontal cortex and cerebellum in mouse. Neurosci. Meet. Planner. New Orleans, LA. Soc Neurosci 104:30
Bauman ML, Kemper TL (2005) Neuroanatomic observations of the brain in autism: a review and future directions. Int J Dev Neurosci 23:183–187. doi:10.1016/j.ijdevneu.2004.09.006
Behrens TEJ, Johansen-Berg H, Woolrich MW et al (2003a) Non-invasive mapping of connections between human thalamus and cortex using diffusion imaging. Nat Neurosci 6:750–757. doi:10.1038/nn1075
Behrens TEJ, Woolrich MW, Jenkinson M et al (2003b) Characterization and propagation of uncertainty in diffusion-weighted MR imaging. Magn Reson Med 50:1077–1088. doi:10.1002/mrm.10609
Behrens TEJ, Berg HJ, Jbabdi S et al (2007) Probabilistic diffusion tractography with multiple fibre orientations: what can we gain? Neuroimage 34:144–155. doi:10.1016/j.neuroimage.2006.09.018
Booth JR, Wood L, Lu D et al (2007) The role of the basal ganglia and cerebellum in language processing. Brain Res 1133:136–144. doi:10.1016/j.brainres.2006.11.074
Boso M, Emanuele E, Prestori F et al (2010) Autism and genius: is there a link? The involvement of central brain loops and hypotheses for functional testing. Funct Neurol 25:27–32
Brodmann K (2006) Brodmann’s localisation in the cerebral cortex, 3rd edn, pp 1–298
Buckner RL, Krienen FM, Castellanos A et al (2011) The organization of the human cerebellum estimated by intrinsic functional connectivity. J Neurophysiol 106:2322–2345. doi:10.1152/jn.00339.2011
Calamante F, Tournier J-D, Jackson GD, Connelly A (2010) Track-density imaging (TDI): super-resolution white matter imaging using whole-brain track-density mapping. Neuroimage 53:1233–1243. doi:10.1016/j.neuroimage.2010.07.024
Calamante F, Oh S-H, Tournier J-D et al (2013) Super-resolution track-density imaging of thalamic substructures: comparison with high-resolution anatomical magnetic resonance imaging at 7.0T. Hum Brain Mapp 34:2538–2548. doi:10.1002/hbm.22083
Catani M, Dell’acqua F, Vergani F et al (2012) Short frontal lobe connections of the human brain. Cortex 48:273–291. doi:10.1016/j.cortex.2011.12.001
Chen CH, Khodakhah K (2012) Short latency cerebellar modulation of the basal ganglia. Neuroscience
Ciccarelli O, Toosy A, Parker GJ et al (2003) Diffusion tractography based group mapping of major white-matter pathways in the human brain. Neuroimage 19:1545–1555. doi:10.1016/S1053-8119(03)00190-3
Clower DM, West RA, Lynch JC, Strick PL, Strick PL (2001) The inferior parietal lobule is the target of output from the superior colliculus, hippocampus, and cerebellum. J Neurosci 21:6283–6291
Clower DM, Dum RP, Strick PL (2005) Basal ganglia and cerebellar inputs to “AIP”. Cereb Cortex 15:913–920. doi:10.1093/cercor/bhh190
Cook PA, Symms M, Boulby PA, Alexander DC (2007) Optimal acquisition orders of diffusion-weighted MRI measurements. J Magn Reson Imaging 25:1051–1058. doi:10.1002/jmri.20905
D’Angelo E, Casali S (2013) Seeking a unified framework for cerebellar function and dysfunction: from circuit operations to cognition. Front Neural Circuits 6:1–23. doi:10.3389/fncir.2012.00116
Dayan M, Olivito G, Molinari M et al (2013) Impact of cerebellar atrophy on cortical grey matter and cerebellar peduncles as assessed by voxel based morphometry and diffusion imaging. In: Proc Int Soc Magn Reson Med, p 1014
Dell’Acqua F, Bodi I, Slater D et al (2013) MR diffusion histology and micro-tractography reveal mesoscale features of the human cerebellum. Cerebellum 12:923–931. doi:10.1007/s12311-013-0503-x
Diedrichsen J, Balsters JH, Flavell J et al (2009) A probabilistic MR atlas of the human cerebellum. Neuroimage 46:39–46. doi:10.1016/j.neuroimage.2009.01.045
Dolan L, Janmaat K, Willemsen V et al (1993) Cellular organisation of the Arabidopsis thaliana root. Dev Suppl 119:71–84
Doron KW, Funk CM, Glickstein M (2010) Fronto-cerebellar circuits and eye movement control: a diffusion imaging tractography study of human cortico-pontine projections. Brain Res 1307:63–71. doi:10.1016/j.brainres.2009.10.029
Du Boisgueheneuc F, Levy R, Volle E et al (2006) Functions of the left superior frontal gyrus in humans: a lesion study. Brain 129:3315–3328. doi:10.1093/brain/awl244
Evarts EV, Thach WT (1969) Motor mechanisms of the CNS: cerebrocerebellar interrelations. Annu Rev Physiol 31:451–498
Fernandez-Miranda JC, Pathak S, Engh J et al (2012) High-definition fiber tractography of the human brain: neuroanatomical validation and neurosurgical applications. Neurosurgery 71:430–453. doi:10.1227/NEU.0b013e3182592faa
Granziera C, Schmahmann JD, Hadjikhani N et al (2009) Diffusion spectrum imaging shows the structural basis of functional cerebellar circuits in the human cerebellum in vivo. PLoS ONE 4:e5101. doi:10.1371/journal.pone.0005101
Grefkes C, Ritzl A, Zilles K, Fink GR (2004) Human medial intraparietal cortex subserves visuomotor coordinate transformation. Neuroimage 23:1494–1506. doi:10.1016/j.neuroimage.2004.08.031
Grodd W, Hülsmann E, Lotze M et al (2001) Sensorimotor mapping of the human cerebellum: fMRI evidence of somatotopic organization. Hum Brain Mapp 13:55–73
Guerrasio L, Quinet J, Bu U, Goffart L (2010) Fastigial oculomotor region and the control of foveation during fixation. J Neurophysiol 103:1988–2001. doi:10.1152/jn.00771.2009
Habas C, Cabanis EA (2007a) Cortical projection to the human red nucleus: complementary results with probabilistic tractography at 3 T. Neuroradiology 49:777–784. doi:10.1007/s00234-007-0260-y
Habas C, Cabanis EA (2007b) Anatomical parcellation of the brainstem and cerebellar white matter: a preliminary probabilistic tractography study at 3 T. Neuroradiology 49:849–863. doi:10.1007/s00234-007-0267-4
Habas C, Kamdar N, Nguyen D et al (2009) Distinct cerebellar contributions to intrinsic connectivity networks. J Neurosci 29:8586–8594. doi:10.1523/JNEUROSCI.1868-09.2009
He Y, Zang Y, Jiang T et al (2004) Detecting functional connectivity of the cerebellum using low frequency fluctuations (LFFs). Med Image Comput Comput Assist Interv 3217:907–915
Heath RG, Harper JW (1974) Ascending projections of the cerebellar fastigial nucleus to the hippocampus, amygdala, and other temporal lobe sites: evoked potential and histological studies in monkeys and cats. Exp Neurol 45:268–287
Heath RG, Dempesy CW, Fontana CJ, Myers WA (1978) Cerebellar stimulation: effects on septal region, hippocampus, and amygdala of cats and rats. Biol Psychiatry 13:501–529
Holmes G (1939) The cerebellum of man. Brain 62:1–30
Hyam JA, Owen SLF, Kringelbach ML et al (2012) Contrasting connectivity of the ventralis intermedius and ventralis oralis posterior nuclei of the motor thalamus demonstrated by probabilistic tractography. Neurosurgery 70:162–9. (discussion 169) doi:10.1227/NEU.0b013e3182262c9a
Ito M (2008) Control of mental activities by internal models in the cerebellum. Nat Rev Neurosci 9:304–313. doi:10.1038/nrn2332
Jenkinson M, Bannister P, Brady M, Smith S (2002) Improved optimization for the robust and accurate linear registration and motion correction of brain images. Neuroimage 17:825–841. doi:10.1006/nimg.2002.1132
Jissendi P, Baudry S, Balériaux D (2008) Diffusion tensor imaging (DTI) and tractography of the cerebellar projections to prefrontal and posterior parietal cortices: a study at 3T. J Neuroradiol 35:42–50. doi:10.1016/j.neurad.2007.11.001
Jones DK, Knösche TR, Turner R (2013) White matter integrity, fiber count, and other fallacies: the do’s and don’ts of diffusion MRI. Neuroimage 73:239–254. doi:10.1016/j.neuroimage.2012.06.081
Kelly RM, Strick PL (2003) Cerebellar loops with motor cortex and prefrontal cortex of a nonhuman primate. J Neurosci 23:8432–8444
Klein A, Andersson J, Ardekani B a et al (2009) Evaluation of 14 nonlinear deformation algorithms applied to human brain MRI registration. Neuroimage 46:786–802. doi:10.1016/j.neuroimage.2008.12.037
Krienen FM, Buckner RL (2009) Segregated fronto-cerebellar circuits revealed by intrinsic functional connectivity. Cereb Cortex 19:2485–2497. doi:10.1093/cercor/bhp135
Kwon HG, Hong JH, Hong CP et al (2011) Dentatorubrothalamic tract in human brain: diffusion tensor tractography study. Neuroradiology 53:787–791. doi:10.1007/s00234-011-0878-7
Mang SC, Busza A, Reiterer S et al (2012) Thalamus segmentation based on the local diffusion direction: a group study. Magn Reson Med 67:118–126. doi:10.1002/mrm.22996
Mastropasqua C, Bozzali M, Ponzo V et al (2013) Functional connectivity in patients with progressive sopranuclear palsy is modulated by cerebellar intermittent theta burst stimulation. In: Proc Int Soc Magn Reson Med, p 2847
McNab JA, Jbabdi S, Deoni SCL et al (2009) High resolution diffusion-weighted imaging in fixed human brain using diffusion-weighted steady state free precession. Neuroimage 46:775–785. doi:10.1016/j.neuroimage.2009.01.008
Middleton FA, Strick PL (1994) Anatomical evidence for cerebellar and basal ganglia involvement in higher cognition function. Science 266(80):458–461
Middleton FA, Strick PL (2001) Cerebellar projections to the prefrontal cortex of the primate. J Neurosci 21:700–712
Middleton FA, Strick PL (2002) Basal-ganglia “projections” to the prefrontal cortex of the primate. Cereb Cortex 12:926–935
Milad MR, Quirk GJ (2002) Neurons in medial prefrontal cortex signal memory for fear extinction. Nature 420:70–74. doi:10.1038/nature01144.1
Miller KL, Stagg CJ, Douaud G et al (2011) Diffusion imaging of whole, post-mortem human brains on a clinical MRI scanner. Neuroimage 57:167–181. doi:10.1016/j.neuroimage.2011.03.070
Mittleman G, Goldowitz D, Heck DH, Blaha CD (2008) Cerebellar modulation of frontal cortex dopamine efflux in mice: relevance to autism and schizophrenia. Synapse 62:544–550. doi:10.1002/syn.20525
Morgan MA, Romanski LM, LeDoux JE (1993) Extinction of emotional learning: contribution of medial prefrontal cortex. Neurosci Lett 163:109–113
Mori S, van Zijl PCM (2002) Fiber tracking: principles and strategies—a technical review. NMR Biomed 15:468–480. doi:10.1002/nbm.781
Nandi D, Aziz TZ, Liu X, Stein JF (2002) Brainstem motor loops in the control of movement. Mov Disord 17:22–27. doi:10.1002/mds.10139
Noda H, Sugita S, Ikeda Y (1990) Afferent and efferent connections of the oculomotor region of the fastigial nucleus in the macaque monkey. J Comp Neurol 302:330–348
Olivito G, Dayan M, Molinari M et al (2013) The contribution of cerebellar white matter damage to cortical grey matter: evidence from voxel based morphometry and diffusion imaging. In: Proc Int Soc Magn Reson Med, p 1099
Palesi F, Tournier D, Calamante F et al (2013) Reconstructing cerebellar–cortical connections with advanced diffusion tractography. In: Proc Int Soc Magn Reson Med, p 3163
Pascual-Leone A, Wassermann EM, Grafman J, Hallett M (1996) The role of the dorsolateral prefrontal cortex in implicit procedural learning. Exp Brain Res 107:479–485
Petrides M (2000) The role of the mid-dorsolateral prefrontal cortex in working memory. Exp Brain Res 133:44–54
Pochon JB, Levy R, Poline JB et al (2001) The role of dorsolateral prefrontal cortex in the preparation of forthcoming actions: an fMRI study. Cereb Cortex 11:260–266
Ramnani N (2006) The primate cortico-cerebellar system: anatomy and function. Nat Rev Neurosci 7:511–522. doi:10.1038/nrn1953
Ramnani N, Owen AM (2004) Anterior prefrontal cortex: insights into function from anatomy and neuroimaging. Nat Rev Neurosci 5:184–194. doi:10.1038/nrn1343
Ridderinkhof KR, Ullsperger M, Crone EA, Nieuwenhuis S (2004) The role of the medial frontal cortex in cognitive control. Science 306(80):443–447. doi:10.1126/science.1100301
Salamon N, Sicotte N, Alger J et al (2005) Analysis of the brain-stem white-matter tracts with diffusion tensor imaging. Neuroradiology 47:895–902. doi:10.1007/s00234-005-1439-8
Salamon N, Sicotte N, Drain A et al (2007) White matter fiber tractography and color mapping of the normal human cerebellum with diffusion tensor imaging. J Neuroradiol 34:115–128
Schmahmann JD, Caplan D (2006) Cognition, emotion and the cerebellum. Brain 129:290–292. doi:10.1093/brain/awh729
Schmahmann JD, Pandya DN (1993) Prelunate, occipitotemporal, and parahippocampal projections to the basis pontis in rhesus monkey. J Comp Neurol 337:94–112
Schmahmann JD, Pandya DN (1995) Prefrontal cortex projections to the basilar pons in rhesus monkey: implications for the cerebellar contribution to higher function. Neurosci Lett 199:175–178
Schmahmann JD, Doyon J, McDonald D et al (1999) Three-dimensional MRI atlas of the human cerebellum in proportional stereotaxic space. Neuroimage 10:233–260. doi:10.1006/nimg.1999.0459
Seehaus AK, Roebroeck A, Chiry O et al (2013) Histological validation of DW-MRI tractography in human postmortem tissue. Cereb Cortex
Smith SM (2006) BET: brain extraction tool. Rev Lit Arts Am 39:1–2. doi:10.1080/08905760600696445
Smith RE, Tournier J-D, Calamante F, Connelly A (2012) Anatomically-constrained tractography: improved diffusion MRI streamlines tractography through effective use of anatomical information. Neuroimage 62:1924–1938. doi:10.1016/j.neuroimage.2012.06.005
Smith RE, Tournier J-D, Calamante F, Connelly A (2013) SIFT: spherical-deconvolution informed filtering of tractograms. Neuroimage 67:298–312. doi:10.1016/j.neuroimage.2012.11.049
Snider R, Eldred E (1952) Cerebrocerebellar relationships in the monkey. J Neurophysiol 15:27–40
Standring S (2008) The cerebellum. Gray’s Anat. Anat. basis Clin. Pract., 40th edn. Churchill Livingstone, pp 297–309
Strick PL, Dum RP, Fiez JA (2009) Cerebellum and nonmotor function. Annu Rev Neurosci 32:413–434. doi:10.1146/annurev.neuro.31.060407.125606
Sultan F (2002) Analysis of mammalian brain architecture. Nature 415:133–134. doi:10.1038/415133a
Takahashi E, Song JW, Folkerth RD et al (2013) Detection of postmortem human cerebellar cortex and white matter pathways using high angular resolution diffusion tractography: a feasibility study. Neuroimage 68:105–111. doi:10.1016/j.neuroimage.2012.11.042
Tilikete C, Koene A, Nighoghossian N et al (2006) Saccadic lateropulsion in Wallenberg syndrome: a window to access cerebellar control of saccades? Exp Brain Res 174:555–565. doi:10.1007/s00221-006-0495-6
Tournier J-D, Calamante F, Connelly A (2007) Robust determination of the fibre orientation distribution in diffusion MRI: non-negativity constrained super-resolved spherical deconvolution. Neuroimage 35:1459–1472
Tournier J-D, Mori S, Leemans A (2011) Diffusion tensor imaging and beyond. Magn Reson Med 65:1532–1556. doi:10.1002/mrm.22924
Tournier J-D, Calamante F, Connelly A (2012) MRtrix: diffusion tractography in crossing fiber regions. Int J Imaging Syst Technol 22:53–66. doi:10.1002/ima.22005
Tuch DS (2004) Q-ball imaging. Magn Reson Med 52:1358–1372. doi:10.1002/mrm.20279
Tuch DS, Reese TG, Wiegell MR et al (2002) High angular resolution diffusion imaging reveals intravoxel white matter fiber heterogeneity. Magn Reson Med 48:577–582. doi:10.1002/mrm.10268
Tunik E, Frey SH, Grafton ST (2005) Virtual lesions of the anterior intraparietal area disrupt goal-dependent on-line adjustments of grasp. Nat Neurosci 8:505–511. doi:10.1038/nn1430
Van Baarsen K, Kleinnijenhuis M, Konert T et al (2013) Tractography demonstrates dentate-rubro-thalamic tract disruption in an adult with cerebellar mutism. Cerebellum 12:617–622. doi:10.1007/s12311-013-0473-z
Voogd J (2003) The human cerebellum. J Chem Neuroanat 26:243–252. doi:10.1016/j.jchemneu.2003.07.005
Watson TC, Jones MW, Apps R (2009) Electrophysiological mapping of novel prefrontal—cerebellar pathways. Front Integr Neurosci 3:1–11. doi:10.3389/neuro.07
Watson TC, Becker N, Apps R, Jones MW (2014) Back to front: cerebellar connections and interactions with the prefrontal cortex. Front Syst Neurosci 8:1–11. doi:10.3389/fnsys.2014.00004
Watt C, Mihailoff G (1983) The cerebellopontine system in the rat. I. Autoradiographic studies. J Comp Neurol 215:312–330
Wedeen VJ, Hagmann P, Tseng W-YI et al (2005) Mapping complex tissue architecture with diffusion spectrum magnetic resonance imaging. Magn Reson Med 54:1377–1386. doi:10.1002/mrm.20642
Wedeen VJ, Wang RP, Schmahmann JD et al (2008) Diffusion spectrum magnetic resonance imaging (DSI) tractography of crossing fibers. Neuroimage 41:1267–1277. doi:10.1016/j.neuroimage.2008.03.036
Weinberger DR, Berman KF, Zec RF (1986) Physiologic dysfunction of dorsolateral prefrontal cortex in schizophrenia. I. Regional cerebral blood flow evidence. Arch Gen Psychiatry 43:114–124
Weinberger DR, Berman KF, Illowsky BP (1988) Physiological dysfunction of dorsolateral prefrontal cortex in schizophrenia. Arch Gen Psychiatry 45:609–615
Zhang D, Snyder AZ, Fox MD et al (2008) Intrinsic functional relations between human cerebral cortex and thalamus. J Neurophysiol 100:1740–1748. doi:10.1152/jn.90463.2008
Acknowledgments
This work was supported by Multiple Sclerosis Society of Great Britain and Northern Ireland; University College of London Hospital/University College of London Comprehensive Biomedical Research Centre; Neurological Institute “C. Mondino” of Pavia; University of Pavia; Multiple Sclerosis International Federation Du Pré grant; National Health and Medical Research Council of Australia; Australian Research Council and the Victorian State Government infrastructure; European Union (CEREBNET FP7-ITN238686, REALNET FP7-ICT270434) to ED, Human Brain Project (HBP-604102) to ED and the Italian Ministry of Health (RF-2009-1475845) to ED. A particular thank goes to Dr. Varun Sethi and Dr. Marios Yiannakas for the recruitment of subjects and data acquisition and to Dr. Matteo Pardini for advice.
Conflict of interest
JDT and FC have a patent application on the track-density imaging technique.
Author information
Authors and Affiliations
Corresponding author
Additional information
E. D’Angelo and C. A. M. Wheeler-Kingshott contributed equally to this work.
Electronic supplementary material
Below is the link to the electronic supplementary material.
Rights and permissions
Open Access This article is distributed under the terms of the Creative Commons Attribution License which permits any use, distribution, and reproduction in any medium, provided the original author(s) and the source are credited.
About this article

Cite this article
Palesi, F., Tournier, JD., Calamante, F. et al. Contralateral cerebello-thalamo-cortical pathways with prominent involvement of associative areas in humans in vivo. Brain Struct Funct 220, 3369–3384 (2015). https://doi.org/10.1007/s00429-014-0861-2
Received:
Accepted:
Published:
Issue Date:
DOI: https://doi.org/10.1007/s00429-014-0861-2