
Abstract
Objectives
Delayed post-gadolinium magnetic resonance imaging (MRI) detects changes of endolymphatic hydrops (EH) within the inner ear in Meniere’s disease (MD). A systematic review with meta-analysis was conducted to summarise the diagnostic performance of MRI descriptors across the range of MD clinical classifications.
Materials and methods
Case-controlled studies documenting the diagnostic performance of MRI descriptors in distinguishing MD ears from asymptomatic ears or ears with other audio-vestibular conditions were identified (MEDLINE, EMBASE, Web of Science, Scopus databases: updated 17/2/2022). Methodological quality was evaluated with Quality Assessment of Diagnostic Accuracy Studies version 2. Results were pooled using a bivariate random-effects model for evaluation of sensitivity, specificity and diagnostic odds ratio (DOR). Meta-regression evaluated sources of heterogeneity, and subgroup analysis for individual clinical classifications was performed.
Results
The meta-analysis included 66 unique studies and 3073 ears with MD (mean age 40.2–67.2 years), evaluating 11 MRI descriptors. The combination of increased perilymphatic enhancement (PLE) and EH (3 studies, 122 MD ears) achieved the highest sensitivity (87% (95% CI: 79.92%)) whilst maintaining high specificity (91% (95% CI: 85.95%)). The diagnostic performance of “high grade cochlear EH” and “any EH” descriptors did not significantly differ between monosymptomatic cochlear MD and the latest reference standard for definite MD (p = 0.3; p = 0.09). Potential sources of bias were case-controlled design, unblinded observers and variable reference standard, whilst differing MRI techniques introduced heterogeneity.
Conclusions
The combination of increased PLE and EH optimised sensitivity and specificity for MD, whilst some MRI descriptors also performed well in diagnosing monosymptomatic cochlear MD.
Key Points
• A meta-analysis of delayed post-gadolinium magnetic resonance imaging (MRI) for the diagnosis of Meniere’s disease is reported for the first time and comprised 66 studies (3073 ears).
• Increased enhancement of the perilymphatic space of the inner ear is shown to be a key MRI feature for the diagnosis of Meniere’s disease.
• MRI diagnosis of Meniere’s disease can be usefully applied across a range of clinical classifications including patients with cochlear symptoms alone.
Introduction
Meniere’s disease (MD) is an inner ear disorder characterised by the clinical presentation of episodic vertigo, low- to mid-frequency hearing loss and fluctuating aural symptoms, with a potentially devastating impact on quality of life. Prevalence as high as 513/100,000 has been reported in population-based studies [1]. A series of diagnostic criteria have been proposed by international societies, most recently in 1995 and 2015 [4, 6], which are largely based on the subjective reporting of symptoms and audiometry [2,3,4,5,6,7,8]. However, MD may have variable manifestations, with the cardinal symptoms present in only 40% of patients with early disease [9, 10]. The ability of clinical criteria to capture atypical phenotypes [11] and to distinguish MD from alternative diagnoses has also been questioned [8, 12, 13]. Nevertheless, there have been no other reliable diagnostic methods until recently [14, 15], with the conventional role of MRI being to exclude other pathologies.
Endolymphatic hydrops (EHs) refer to the expansion of the endolymphatic space (ES) of the inner ear at the expense of the surrounding perilymphatic space (PS) and is considered to be the histological hallmark of MD [4, 16]. The MRI depiction of EH with delayed post-gadolinium MRI was first described in 2007 [17]. The ability of MRI to demonstrate EH and diagnose MD with both intra-tympanic and intravenous contrast administration has been evaluated in subsequent studies [18,19,20,21,22,23,24,25,26,27,28,29,30,31,32,33,34,35,36,37,38,39,40,41,42,43,44,45,46,47,48,49,50,51,52,53,54,55,56,57,58,59,60,61,62,63,64,65,66,67,68,69,70,71,72,73,74,75,76,77,78,79,80,81,82,83,84,85,86,87]. The utilisation of delayed post-gadolinium MRI has been a major advance in otological imaging, with increasing worldwide application and a consequent shift in the diagnostic paradigm of MD. Some recent MD classifications [7] have even incorporated MRI within the diagnostic criteria [8, 88].
The reporting of EH on MRI is generally based on the evaluation of descriptors and semi-quantitative grading scales [19, 22, 24, 31, 46, 79, 94,95,96,97] but there is little consensus on which of these perform best in distinguishing affected ears. Despite previous systematic reviews on the subject [89,90,91,92,93], there have been no attempts to determine the pooled diagnostic performance of MRI descriptors. Meta-analysis would provide greater certainty as to how MRI should be interpreted to optimally corroborate the diagnosis of MD. Furthermore, whilst previous systematic reviews have been applied to a narrowly defined reference clinical standard such as “definite MD”, another question relates to whether MRI is diagnostically useful in atypical or monosymptomatic forms, such as cochlear MD (cMD) and vestibular MD (vMD) [98].
This systematic review and meta-analysis aimed to determine the diagnostic performance of MR descriptors in distinguishing ears with clinical MD, and how this differs between the MD clinical subcategories.
Method
This study applied the Preferred Reporting Items for Systematic Reviews and Meta-analyses (PRISMA) guidelines [99] and enrolled on the Prospective Register of Systematic Reviews (PROSPERO), CRD42022299285.
Search strategy
The search strategy was based on PICOS (population; intervention; comparator; outcome; study design). Population was defined as ears with MD symptoms; intervention as delayed (3–6 h for intravenous; 24 h for intratympanic) post-gadolinium MRI; comparator (reference standard) as clinical criteria for MD; outcome as qualitative or semi-quantitative MRI descriptors for MD; and study design as case-controlled cross-sectional studies [100]. Search terms were adapted after a pilot search to include relevant synonyms, before being subjected to Peer Review of Electronic Search Strategies (PRESS) [101]. Searches were performed in MEDLINE, EMBASE, Web of Science, Scopus, Cochrane Register of Controlled Trials and LILACS databases (supplementary 1). The search was performed from 2000 onwards. The searches were finally updated on 17/02/2022. Manual forward and backward searches were performed for all eligible and review articles. The five most frequently cited journals were hand-searched (2010–2021) and grey literature interrogated. Mendeley Reference Manager was used to collate the literature and duplicate studies were manually removed.
Selection of studies
Two independent reviewers (S.C./I.P.) applied a piloted screening tool to the titles and abstracts with the following inclusion criteria: defined MD ear disease group (supplementary 2); potential inclusion of control ears without MD; analysis of delayed post-gadolinium MRI. Case studies, review articles, foreign language literature and clearly duplicate studies were excluded. The full text was then independently assessed for eligibility by both reviewers according to the PICOS criteria. Inclusion required the extraction of 2-by-2 contingency tables, comparing the presence of MRI descriptors in MD ears (supplementary 3) with either asymptomatic ears contralateral to MD, asymptomatic ears in other subjects, or ears with an alternative audio-vestibular condition. Reasons for exclusions are listed in supplementary 4. Discrepancies were resolved by discussion. Authors were contacted to address any missing data from conference abstracts and full papers, and for clarification regarding potential overlapping data.
Data extraction
The same reviewers independently extracted data regarding (a) study characteristics: authors, year of publication, study centre and period, retrospective v prospective, sample size of MD and controls, gadolinium concentration, agent and route of administration, MRI system strength and sequences; (b) control type; (c) demographic and clinical characteristics: age and sex of the MD group, duration of MD, unilateral or bilateral MD, and clinical diagnostic criteria; and (d) MRI descriptors or grading scale analysed and number of observers.
Contingency tables (2-by-2) were constructed comparing the presence of clinical MD (reference test) to the presence of each MRI descriptor (index test).
Quality assessment
The methodological quality of the eligible studies was evaluated with a tailored Quality Assessment of Diagnostic Accuracy Studies version 2 (QUADAS-2) tool [102] by the two reviewers independently. Review specific guidance was developed with respect to the signalling questions (supplementary 5).
Statistical analysis
Bivariate diagnostic random-effects meta-analysis was conducted with R 4.2.1 (package “meta”) to evaluate the diagnostic performance of each MRI descriptor. The results were tabulated with receiver operating curve (ROC) plots and corresponding forest plots [103]. Sensitivity, specificity, diagnostic odds ratio (DOR), area under the curve, and positive and negative likelihood ratios were calculated after pooling of true positive, true negative, false positive and false negative values. Heterogeneity was assessed using Cochran’s Q test which tests the equality of sensitivities and specificities among the studies based on a chi-square distributed statistic (p < 0.001).
Meta-regression used a random effects model with restricted maximum likelihood estimation and the Kruskal–Wallis test evaluated (p < 0.05) differences in sensitivity and specificity between subgroups. The diagnostic performance of MRI descriptors for distinguishing ears with MD according to the current reference standard of the 2015 Barany criteria (“definite 2015”) was compared with that for each of the other clinical classifications: “definite 1995”, “probable 2015”, “probable 1995”, “possible 1995”, “cMD” and “vMD” (supplementary 2). Subgroup analysis of diagnostic performance for each MRI descriptor was performed for the “definite 2015” category, those clinical classifications in which diagnostic performance significantly differed (p < 0.05) and any other mono-symptomatic clinical classifications.
The following variables were also analysed for their potential influence on diagnostic performance: (a) control group type (asymptomatic ears contralateral to MD v asymptomatic ears in other subjects v ears with other audio-vestibular conditions); (b) route of gadolinium administration (IV v IT); (c) number of image reviewers (single v multiple observers); (d) analysed on an ear basis v patient basis; (e) sequences or post-processing depicting different bone signal (intermediate v low); (f) low risk of bias (any domain vs none); (g) high applicability (any vs none); (h) study design (prospective v other, consecutive recruitment v other). Deek’s funnel plots [104] depicted publication bias and sample size effect.
Results
Systematic review
Figure 1 is a study flow diagram documenting the search results and reasons for exclusion at each stage. The screening tool indicated 256 potentially relevant articles. After full text review, 72 studies were considered eligible.

Flow chart summary of the literature search and systematic review process
Study characteristics
The characteristics of all eligible studies are documented in Table 1 and supplementary 6 [12,13,14,15,16,17,18,19,20,21,22,23,24,25,26,27,28,29,30,31,32,33,34,35,36,37,38,39,40,41,42,43,44,45,46,47,48,49,50,51,52,53,54,55,56,57,58,59,60,61,62,63,64,65,66,67,68,69,70,71,72,73,74,75,76,77,78,79,80,81,82,83,84,85,86,87]. There was a total of 3073 MD ears (mean age 40.2–67.2 years). The clinical classifications applied were as follows (supplementary 2): “definite MD” (2015, n = 37; 1995 n = 23), “probable MD” (2015, n = 13; 1995, n = 16), “possible MD” (n = 16), “cMD” (n = 11) and “vMD” (n = 7) (Table 1). The commonest control group type was asymptomatic ears contralateral to MD (n = 59) (Table 1). Gadolinium administration was described as intravenous (n = 57), intra-tympanic (n = 14) or both (n = 1), whilst MRI was most frequently performed at 3 T (n = 71) and with a 3D FLAIR sequence (n = 62) (supplementary 6). Multiple observers were documented in 40/72 studies, with inter-observer agreement statistics presented in 18/72 (kappa range 0.59–0.93) (supplementary 6). After clarification with authors, six studies were deemed to have partly overlapped data sets (supplementary 6). The meta-analysis therefore included 66 unique studies.
Categorisation of MRI descriptors
The two reviewers selected eleven MRI descriptors for analysis since they could be derived from at least four eligible studies. There were nine individual descriptors (Fig. 2) with two further combinations of descriptors. The presence of MRI descriptors was usually extracted from grading systems applied to the eligible studies [19, 22, 24, 46, 79, 91, 95] (supplementary 3). Due to subtle differences in some grading systems, descriptor definitions were adapted to capture the breadth of data across multiple studies (supplementary 7). Vestibular MRI descriptors of EH were as follows: “any vestibular EH”, “ > 33% area of ES relative to total vestibular fluid area” (Fig. 2F), “ > 50% area of ES relative to total vestibular fluid area” (Fig. 2G), “saccule to utricle ratio (SURI) or higher vestibular grade” (Fig. 2E),” fused utricle and saccule” (Fig. 2F) and “enhancing PS of the vestibule not visible” (Fig. 2G). Cochlear MRI descriptors of EH were “any cochlear EH” and “highest grade cochlear EH” (Fig. 2G). “Increased ipsilateral perilymphatic enhancement (PLE)” was additionally evaluated (Fig. 2H). Two MRI descriptors used a combination of features; when there was either “any vestibular EH” or “any cochlear EH”, it was termed “any EH”, and with additional increased PLE it was termed “increased ipsilateral PLE or any EH”.
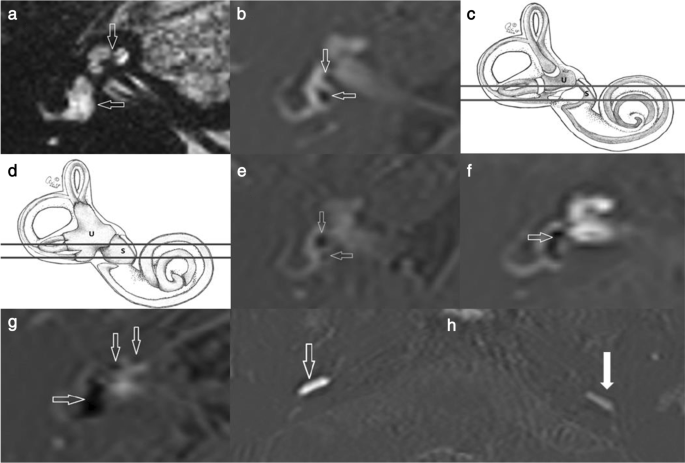
Illustrations of the MRI descriptors. a T2 SPACE axial image is unable to distinguish the endolymphatic from the perilymphatic space and demonstrates the inner ear structures as high signal throughout. The cochlea (vertical arrow) and the vestibule (horizontal arrow) are indicated. b Delayed post-gadolinium 3D REAL IR axial image in a normal ear shows that the endolymphatic structures of the saccule (vertical arrow) and the utricle (horizontal arrow) demonstrated within the vestibule with the saccule being the smaller structure. The low signal endolymph is clearly distinguished from the surrounding enhancing perilymph. Schematic representations of (c) the normal endolymphatic structures and (d) the hydropic (dilated) endolymphatic structures in a MD ear (permission to use from Miss Irumee Pai). The lines depict the level of the axial sections which encompass the utricle (U) and saccule (S) in the other images Delayed post-gadolinium 3D REAL IR axial images in e to h depict the MR descriptors in ears with MD. e “Saccule to utricle ratio (SURI)”. There is inversion of the saccule to utricle ratio (SURI) with the saccule (vertical arrow) being larger than the utricle (horizontal arrow). f “Fused utricle and saccule”. The low-signal saccule and utricle are seen to be merged (horizontal arrow). There is also borderline “ > 33% area of ES relative to total vestibular fluid area” but it does not reach “ > 50% of ES relative to total vestibular fluid area”. g “Enhancing PS of the vestibule not visible “and “highest grade cochlear EH”. Severe EH is demonstrated with replacement of the vestibular perilymph by non enhancing endolymph (horizontal arrow) and there is also “ > 50% of ES relative to total vestibular fluid area”. There is severe cochlear hydrops (vertical arrows) as indicated by the non enhancing cochlear duct replacing the scala vestibuli enhancement (vertical arrows). h A right MD ear demonstrating “increased ipsilateral perilymphatic enhancement (PLE)”. The degree of perilymphatic enhancement within the inferior segment of the right basal turn (open arrow) is increased in the right symptomatic MD ear relative to the contralateral left asymptomatic ear (filled arrow)
Quality of studies
QADAS-2 evaluation showed high bias across all four domains in 22/66 studies, whilst only 3/66 studies demonstrated high bias in ≤ 1 domain (Fig. 3(A)). “Patient selection” always resulted in high bias since all studies were case-controlled. High bias was reported for “conduct and interpretation of test” since most studies only analysed MD cohorts and observers could not be blinded. “Reference standard conduct and interpretation” resulted in high bias when clinical classifications other than “definite 2015” were applied. “Flow and timing” bias occurred when multiple clinical criteria were evaluated within the study, thus not applying the same reference standard. There was applicability concern in ≤ 1 domain in 64/66 studies (Fig. 3(B)). The principal applicability concern was introduced in the “patient selection” domain when only a narrow range of clinical diagnostic criteria were studied.

Bar charts demonstrate (a) the risk of bias and (b) applicability concerns derived from the QUADAS-2 tool for the 66 eligible studies included in the meta-analysis
Diagnostic performance of individual MRI descriptors for MD
Pooled sensitivity, specificity, DOR, positive likelihood ratio and negative likelihood ratio are presented in Table 2. Forest plots for MRI descriptors are shown in Fig. 4, whilst summary ROC curves are shown in supplementary Fig. 1.


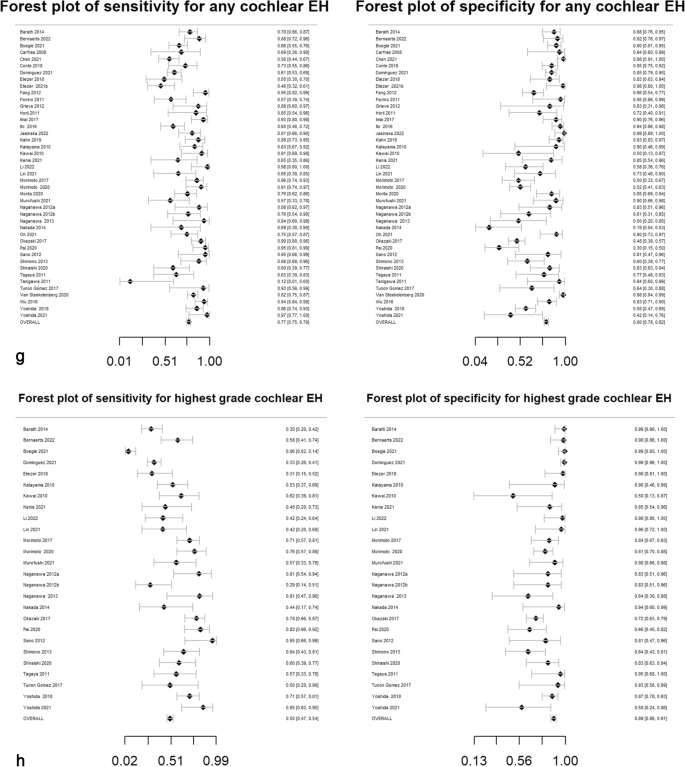


Forest plots with sensitivity and specificity for each MRI descriptor (a–k), incorporating all relevant reports and with pooled values
All MRI descriptors were highly informative, with DORs ranging from 8.0 (6.1, 10.4) for “highest grade cochlear EH” to 131.7 (66.9, 259.2) for “increased ipsilateral PLE”. Five of the 11 MRI descriptors achieved a pooled specificity of > 90%: “SURI or higher vestibular grade” (92%; 95% CI: 90%, 93%), “fused utricle and saccule” (96%; 95% CI: 93%, 97%), “enhancing PS of the vestibule not visible” (99%; 95% CI: 97%, 99%), “increased ipsilateral PLE” (98%; 95% CI: 96%, 99%) and “increased ipsilateral PLE or any EH” (91%; 95% CI: 85%, 95%). Of these, the highest sensitivity was achieved with “increased ipsilateral PLE or any EH” (87%; 95% CI: 79%, 92%) which demonstrated a pooled DOR of 64.8 (95% CI: 29.7%, 141.2%). The other MRI descriptors with a sensitivity greater than 80% were “ > 33% area of ES relative to total vestibular fluid area” (83%; 95% CI: 81%, 85%) and “any EH” (81%; 95% CI: 79%, 82%).
Heterogeneity
All MRI descriptors demonstrated heterogeneity of sensitivity (Cochran’s Q test, p < 0.001). There were 4/11 MRI descriptors judged to show consistent specificity; however, 7/11 were heterogeneous predictors (Cochran’s Q test, p < 0.001) (supplementary 8). This heterogeneity is also reflected in the forest plots (Fig. 4) and Deek’s funnel plots (supplementary Fig. 2).
Clinical classifications and other covariates
The results of subgroup analysis for the clinical classifications and the meta-regression for other co-variates are shown in Tables 3 and 4. When “definite 2015” MD classification was used, “increased ipsilateral PLE or any EH” achieved improved sensitivity of 89% (95% CI: 83%, 95%) and specificity of 91% (95% CI: 86%, 96%). There was no significant difference in diagnostic performance for any MRI descriptors between “definite 2015” and either “probable 2015” or “definite 1995” clinical classifications.
With respect to the monosymptomatic classifications, the diagnostic performance of “high grade cochlear EH” (sensitivity 41%, specificity 94%, DOR 10.12) and “any EH” descriptors (sensitivity 69%, specificity 79%, DOR 8.37) did not significantly differ between “cMD” and “definite 2015” MD ears (p = 0.3; p = 0.09). As for vMD, the MRI descriptors “any EH” (sensitivity 20%, specificity 87%, DOR 1.75), “any vestibular EH” (sensitivity 40%, specificity 82%, DOR 3.15) and “any cochlear EH” (sensitivity 40%, specificity 84%, DOR 3.54) demonstrated low sensitivity and the diagnostic performance was inferior to “definite 2015” MD.
The meta-regression showed that the type of the control group type had no significant influence on the diagnostic performance. Regarding other covariates, “any EH” and “any vestibular EH” showed superior diagnostic performance with multiple observers or intra-tympanic gadolinium administration. Superior diagnostic performance was achieved with sequences or post-processing which depicted bone as intermediate signal for four MRI descriptors (Table 4).
The Deek’s funnel plots demonstrated a small studies effect (p < 0.05) for three MRI descriptors.
Discussion
Despite increasing clinical application and impact on the diagnostic paradigm of Meniere’s disease (MD), there remains inconsistency in how delayed post-gadolinium MRI is interpreted and applied in clinical settings. This systematic review and meta-analysis evaluated 11 MRI descriptors for their ability to distinguish MD ears as defined by various clinical criteria. All descriptors were considered highly informative with DORs ranging from 8.0 (6.1, 10.4) to 131.7 (66.9, 259.2). “Increased ipsilateral perilymphatic enhancement (PLE)”, alone or in combination with “any endolymphatic hydrops (EH)”, demonstrated the highest DORs. This combination achieved the highest sensitivity (87% (95% CI: 79.92%)) whilst maintaining high specificity (91% (95% CI: 85.95%)) for MD, although it was only evaluated in three studies. Evaluation of EH for MD diagnosis was best attained with MRI features assessing the endolymphatic space alone, rather than comparing it with the perilymphatic area. Such descriptors with high DORs of 19.9 (15.5, 25.6) and 27.8 (16.6, 46.5) were “saccule to utricle ratio inversion or higher vestibular grade” and “fused utricle and saccule”. Diagnostic performance did not differ across definite 2015, probable 2015 and definite 1995 clinical classifications for any MRI descriptor. “Highest grade cochlear EH” and “any EH” performed similarly in monosymptomatic cochlear MD to the clinical reference standard of “definite 2015” MD (p = 0.3; p = 0.09). Sequences or post-processing which depicted bone as intermediate signal demonstrated superior diagnostic performance for four MRI descriptors. High risk of bias and heterogeneity was noted across the eligible studies included in the meta-analysis.
The current study differs in several respects from previous systematic reviews of delayed post-gadolinium MRI in MD [89,90,91,92,93]. Firstly, our contemporary literature search resulted in 72 eligible studies compared with 11–43 studies in previous reviews, providing sufficient data to enable a meta-analysis and pooled statistics for the first time. Secondly, this review evaluated 11 MRI descriptors compared with 1–4 descriptors in prior publications. Finally, inclusion and subgroup analysis of all clinical classifications explored the diagnostic performance of MRI in different symptomatic presentations.
The appropriate selection of specific versus sensitive MRI descriptors for the diagnosis of MD may depend on the clinical setting, as illustrated by a comparison of different vestibular EH descriptors. For instance, when low risk treatment or non-destructive interventions (e.g., intratympanic steroids) are being considered then overdiagnosis may be acceptable so “ > 33%” area of endolymph relative to total fluid area “would be a reasonable descriptor due to its higher pooled sensitivity (83%), despite low specificity (75%)”. Conversely, if vestibular-destructive procedures or trials of new interventions with potential morbidity are envisaged, then application of highly specific descriptors would be more appropriate. Regarding potential application to automated MRI analysis, it is of interest that vestibular MRI descriptors evaluating endolymphatic appearances alone demonstrated superior diagnostic performance, since current techniques focus on comparison with the perilymphatic space area.
Evaluation of MRI descriptors across the whole range of symptomatic presentations provided evidence for their diagnostic performance in differing clinical phenotypes [8]. The meta-regression indicated that most descriptors had a similar ability to diagnose MD when applying the current “definite 2015” reference standard or alternative clinical classifications, supporting the role of MRI in wider clinical situations. This extended to monosymptomatic presentations for some descriptors, with the presence of “any EH” being able to detect cMD ears with DOR of 8.37 (4.34, 16.12).
There are limitations to the current study, with respect to both the review process and the evidence available. Firstly, although the risk of missing data was minimised as far as possible, a body of non-English language literature (36 screened studies) was not reviewed. Secondly, since only a limited range of MRI descriptors were applied in individual studies, it was not feasible to perform head-to-head comparisons, introducing bias due to the indirect comparison of individual MRI descriptors. Thirdly, as the eligible studies principally focused on definite MD, the subgroup analysis of atypical forms of MD for less frequently analysed MRI descriptors yielded insufficient numbers for pooling data. Fourthly, it would have been pertinent to perform meta-regression for the “Increased ipsilateral PLE” descriptor with respect to the control group of “other audio vestibular disorders” (since it may also occur with differential diagnoses such as perilymphatic fistula) and for constant versus variable flip angle FLAIR sequences (since this influences the degree of PLE); however, this was precluded due to the limited number of eligible studies. Fifthly, variations in sensitivity (all descriptors) and specificity (7/11 descriptors) led to significant heterogeneity across studies. Meta-regression demonstrated that this was at least partly due to variable clinical classifications, MRI technique, analysis, study design, applicability and bias. Finally, the high level of bias should be considered. In particular, all eligible studies were case controlled, potentially resulting in an overestimation of diagnostic accuracy [105].
Conclusion
This systematic review and meta-analysis evaluated the relative performance of MRI descriptors for the diagnosis of MD. “Increased ipsilateral PLE” was a key descriptor, and in combination with EH, it achieved optimal specificity with sensitivity. MRI descriptors of EH which did not rely on a comparison with perilymphatic area showed the best diagnostic performance for MD. MRI diagnosis of EH can be usefully applied across a range of clinical classifications including monosymptomatic cMD. Future research and meta-analysis would benefit from consensus on standardised MRI descriptors and a minimum clinical data set, whilst MRI descriptors should also be evaluated for prognosis and prediction of treatment response through longitudinal studies.
Data availability
The data supporting this article is openly available from the King’s College London research data repository, KORDS, at https://doi.org/10.18742/20522376.
Abbreviations
- cMD:
-
Cochlear Meniere’s disease
- DOR:
-
Diagnostic odds ratio
- EH:
-
Endolymphatic hydrops
- ES:
-
Endolymphatic space
- MD:
-
Meniere’s disease
- PLE:
-
Perilymphatic enhancement
- PS:
-
Perilymphatic space
- SURI:
-
Saccule to utricle ratio
- vMD:
-
Vestibular Meniere’s disease
References
Havia M, Kentala E, PyykkÖ I (2005) Prevalence of Menière’s disease in general population of Southern Finland. Otolaryngol Head Neck Surg 133(5):762–768
Committee on Hearing and Equilibrium (1972) Report of Subcommittee on Equilibrium and its Measurement .Meniere’s disease: criteria for diagnosis and evaluation of therapy for reporting. Trans Am Acad Ophthalmol Otolaryngol 76 6 1462–4
Pearson BW, Brackmann DE (1985) Committee on Hearing and Equilibrium Guidelines for Reporting Treatment Results in Meniere’s Disease. Otolaryngol Head Neck Surg 6;93(5):579–81
Committee on Hearing and Equilibrium Guidelines for the Diagnosis and Evaluation of Therapy in Meniere’s Disease (1995) Otolaryngol Head Neck Surg 113(3):181–5.
Ikezono T, Itoh A, Takeda N, Nakamura T, Asai M, Ikeda T (2017) Documents for standards in diagnostic criteria for dizziness. Equilibrium Res 76:233–241
Lopez-Escamez JA, Carey J, Chung WH et al (2015) Diagnostic criteria for Menière’s disease. J Vestib Res 25(1):1–7
Iwasaki S, Shojaku H, Murofushi T et al (2021) Diagnostic and therapeutic strategies for Meniere’s disease of the Japan Society for Equilibrium Research. Auris Nasus Larynx 48(1):15–22
Gürkov R, Hornibrook J (2018) On the classification of hydropic ear disease (Menière’s disease). Vol. 66, HNO. Springer Verlag p455–63.
Belinchon A, Perez-Garrigues H, Tenias JM (2012) Evolution of symptoms in Ménière’s disease. Audiol Neurootol 17(2):126–132
Claes GME, de Valck CFJ, van de Heyning P, Wuyts FL (2011) The Ménière’s Disease Index: an objective correlate of Ménière’s disease, based on audiometric and electrocochleographic data. Otol Neurotol 32(5):887–892
Gürkov R, Jerin C, Flatz W, Maxwell R (2019) Clinical manifestations of hydropic ear disease (Menière’s). Eur Arch Otorhinolaryngol 276(1):27–40
Nakada T, Yoshida T, Suga K et al (2014) Endolymphatic space size in patients with vestibular migraine and Ménière’s disease. J Neurol 261(11):2079–2084
Sun W, Guo P, Ren T, Wang W (2017) Magnetic resonance imaging of intratympanic gadolinium helps differentiate vestibular migraine from Ménière disease. Laryngoscope 127(10):2382–2388
Nguyen LT, Harris JP, Nguyen QT (2010) Clinical utility of electrocochleography in the diagnosis and management of Ménière’s disease: AOS and ANS membership survey data. Otol Neurotol 31(3):455–459
Maheu M, Alvarado-Umanzor JM, Delcenserie A, Champoux F (2017) The clinical utility of vestibular-evoked myogenic potentials in the diagnosis of Ménière’s disease. Vol. 8, Frontiers in Neurology 8:415.
Hallpike CS, Cairns H (1938) Observations on the pathology of Ménière’s syndrome. J Laryngol Otol 53(10):625–655
Nakashima T, Naganawa S, Sugiura M et al (2007) Visualization of endolymphatic hydrops in patients with Meniere’s disease. Laryngoscope 117(3):415–420
Attyé A, Eliezer M, Galloux A et al (2017) Endolymphatic hydrops imaging: differential diagnosis in patients with Meniere disease symptoms. Diagn Interv Imaging 98(10):699–706
Attyé A, Eliezer M, Boudiaf N et al (2017) MRI of endolymphatic hydrops in patients with Meniere’s disease: a case-controlled study with a simplified classification based on saccular morphology. Eur Radiol 27(8):3138–3146
Attyé A, Eliezer M, Medici M et al (2018) In vivo imaging of saccular hydrops in humans reflects sensorineural hearing loss rather than Meniere’s disease symptoms. Eur Radiol 28(7):2916–2922
Attyé A, Barma M, Schmerber S, Dumas G, Eliezer M, Krainik A (2020) The vestibular aqueduct sign: magnetic resonance imaging can detect abnormalities in both ears of patients with unilateral Meniere’s disease. J Neuroradiol 47(2):174–179
Baráth K, Schuknecht B, Monge Naldi A, Schrepfer T, Bockisch CJ, Hegemann SCA (2014) Detection and grading of endolymphatic hydrops in Menière disease using MR imaging. AJNR Am J Neuroradiol 35(7):1387–1392
Beckers K, Maryn Y, Zarowski A et al (2016) The role of magnetic resonance imaging in the diagnosis of endolymphatic hydrops and Meniere’s disease. B-ENT 12(Supplement 25):24
Bernaerts A, Vanspauwen R, Blaivie C et al (2019) The value of four stage vestibular hydrops grading and asymmetric perilymphatic enhancement in the diagnosis of Menière’s disease on MRI. Neuroradiology 61(4):421–429
Bernaerts A, Janssen N, Wuyts FL et al (2022) Comparison between 3D SPACE FLAIR and 3D TSE FLAIR in Menière’s disease. Neuroradiology 64(5):1011–1020
Boegle R, Gerb J, Kierig E et al (2021) Intravenous delayed gadolinium -enhanced MR imaging of the endolymphatic space: a methodological comparative study. Front Neurol 12:647296
Carfrae MJ, Holtzman A, Eames F, Parnes SM, Lupinetti A (2008) 3 Tesla delayed contrast magnetic resonance imaging evaluation of Ménière’s disease. Laryngoscope 118(3):501–505
Chen W, Geng Y, Lin N, Yu S, Sha Y (2021) Magnetic resonance imaging with intravenous gadoteridol injection based on 3D-real IR sequence of the inner ear in Meniere’s disease patient: feasibility in 3.5-h time interval. Acta Otolaryngol 141(10):899–906
Choi JE, Kim YK, Cho YS et al (2017) Morphological correlation between caloric tests and vestibular hydrops in Ménière’s disease using intravenous Gd enhanced inner ear MRI. PLoS One 12(11):e0188301
Connor S, Hulley K, Burd C, Amin N, Pai I (2021) Which is the optimally defined vestibular cross-section to diagnose unilateral Meniere’s disease with delayed post-gadolinium 3D fluid-attenuated inversion recovery MRI? Br J Radiol 94(1119)
Conte G, Caschera L, Calloni S et al (2018) MR imaging in menière disease: is the contact between the vestibular endolymphatic space and the oval window a reliable biomarker? AJNR Am J Neuroradiol 39(11):2114–2119
Domínguez P, Manrique-Huarte R, Suárez-Vega V, López-Laguna N, Guajardo C, Pérez-Fernández N (2021) Endolymphatic hydrops in fluctuating hearing loss and recurrent vertigo. Front Surg 8:673847
Eliezer M, Gillibert A, Tropres I, Krainik A, Attyé A (2017) Influence of inversion time on endolymphatic hydrops evaluation in 3D-FLAIR imaging. J Neuroradiol 44(5):339–343
Eliezer M, Poillon G, Gillibert A et al (2018) Comparison of enhancement of the vestibular perilymph between gadoterate meglumine and gadobutrol at 3-Tesla in Meniere’s disease. Diagn Interv Imaging 99(5):271–277
Eliezer M, Poillon G, Horion J et al (2021) MRI diagnosis of saccular hydrops: comparison of heavily-T2 FIESTA-C and 3D-FLAIR sequences with delayed acquisition. J Neuroradiol 48(6):446–452
Eliezer M, Toupet M, Housset J, Houdart E, Hautefort C (2022) Recurrent vestibulopathy: are cVEMP, oVEMP and inner ear MRI useful to distinguish patients with Menière’s disease and vestibular migraine? Eur Arch Otorhinolaryngol 279(2):713–721
Fang ZM, Chen X, Gu X et al (2012) A new magnetic resonance imaging scoring system for perilymphatic space appearance after intratympanic gadolinium injection, and its clinical application. J Laryngol Otol 126(5):454–459
Fiorino F, Pizzini FB, Beltramello A, Mattellini B, Barbieri F (2011) Reliability of magnetic resonance imaging performed after intratympanic administration of gadolinium in the identification of Endolymphatic Hydrops in patients With Ménière’s disease. Otol Neurotol 32(3):472–477
Grieve SM, Obholzer R, Malitz N, Gibson WP, Parker GD (2012) Imaging of endolymphatic hydrops in Meniere’s disease at 1.5 T using phase-sensitive inversion recovery: (1) Demonstration of feasibility and (2) overcoming the limitations of variable gadolinium absorption. Eur J Radiol 81(2):331–8
Grosser D, Willenborg K, Dellani P et al (2021) Vestibular aqueduct size correlates with the degree of cochlear hydrops in patients with and without Menière’s disease. Otol Neurotol 42(10):E1532–E1536
Hagiwara M, Thomas Roland Jr J, Wu X et al (2014) Identification of endolymphatic hydrops in Ménière’s disease utilizing delayed postcontrast 3D FLAIR and fused 3D FLAIR and CISS Color Maps 35 10 e337–42
Horii A, Osaki Y, Kitahara T et al (2011) Endolymphatic hydrops in Meniere’s disease detected by MRI after intratympanic administration of gadolinium: comparison with sudden deafness. Acta Otolaryngol 131(6):602–609
Imai T, Uno A, Kitahara T, Okumura T et al (2017) Evaluation of endolymphatic hydrops using 3-T MRI after intravenous gadolinium injection. Eur Arch Otorhinolaryngol 274(12):4103–4111
Ito T, Kitahara T, Inui H et al (2016) Endolymphatic space size in patients with Meniere’s disease and healthy controls. Acta Otolaryngol 136(9):879–882
Jasińska A, Lachowska M, Wnuk E, Pierchała K, Rowiński O, Niemczyk K (2022) Correlation between magnetic resonance imaging classification of endolymphatic hydrops and clinical manifestations and audiovestibular test results in patients with definite Ménière’s disease. Auris Nasus Larynx 49(1):34–45
Kahn L, Hautefort C, Guichard JP et al (2020) Relationship between video head impulse test, ocular and cervical vestibular evoked myogenic potentials, and compartmental magnetic resonance imaging classification in Menière’s disease. Laryngoscope 130(7):E444–E452
Katayama N, Yamamoto M, Teranishi M et al (2010) Relationship between endolymphatic hydrops and vestibular-evoked myogenic potential. Acta Otolaryngol 130(8):917–923
Kawai H, Naganawa S, Ishihara S, Sone M, Nakashima T (2010) MR imaging of the cochlear modiolus after intratympanic administration of Gd-DTPA. Magn Reson Med Sci 9:23–29
Kenis C, Crins T, Bernaerts A, Casselman J, Foer B de (2022) Diagnosis of Menière’s disease on MRI: feasibility at 1.5 Tesla. Acta Radiol 63(6):810–813.
Kierig E, Becker-Bense S, Gerb J, Kirsch V, Ertl-Wagner B, Dieterich M (2019) Endolymphatic hydrops: a common finding in vestibular migraine. Clin Neurophysiol 130(8):e144–e145
Li X, Wu Q, Sha Y, Dai C, Zhang R (2020) Gadolinium-enhanced MRI reveals dynamic development of endolymphatic hydrops in Ménière’s disease. Braz J Otorhinolaryngol 86(2):165–173
Li Y, Lv Y, Hu N, Li X, Wang H, Zhang D (2022) Imaging analysis of patients with Meniere’s disease treated with endolymphatic sac-mastoid shunt surgery. Front Surg 12(8):673323
Lin KT, Lu CJ, Young YH (2022) Magnetic resonance imaging: role on diagnosing all types of endolymphatic hydrops. J Formos Med Assoc 121(7):1325–1333
Liu Y, Jia H, Shi J, Zheng H, Li Y, Yang J et al (2015) Endolymphatic hydrops detected by 3-dimensional fluid-attenuated inversion recovery MRI following intratympanic injection of gadolinium in the asymptomatic contralateral ears of patients with unilateral Ménière’s disease. Med Sci Monit 21:701–707
Mainnemarre J, Hautefort C, Toupet M et al (2020) The vestibular aqueduct ossification on temporal bone CT: an old sign revisited to rule out the presence of endolymphatic hydrops in Menière’s disease patients. Eur Radiol 30(11):6331–6338
Morimoto K, Yoshida T, Sugiura S et al (2017) Endolymphatic hydrops in patients with unilateral and bilateral Meniere’s disease. Acta Otolaryngol 137(1):23–28
Morimoto K, Yoshida T, Kobayashi M et al (2020) Significance of high signal intensity in the endolymphatic duct on magnetic resonance imaging in ears with otological disorders. Acta Otolaryngol 140(10):818–822
Morita Y, Takahashi K, Ohshima S et al Is vestibular Meniere’s disease associated with endolymphatic hydrops? Front Surg 18; 7:601692.
Murofushi T, Tsubota M, Kanai Y, Endo H, Ushio M (2021) Association of cervical vestibular-evoked myogenic potential tuning property test results with MRI findings of endolymphatic hydrops in Meniere’s disease. Eur Arch Otorhinolaryngol 278(9):3267–3273
Naganawa S, Yamazaki M, Kawai H, Bokura K, Sone M, Nakashima T (2012) Visualization of endolymphatic hydrops in Meniere’s disease after single-dose intravenous gadolinium-based contrast medium: timing of optimal enhancement. Magn Reson Med Sci 11(1):43–51
Naganawa S, Yamazaki M, Kawai H, Bokura K, Sone M, Nakashima T (2012) Imaging of endolymphatic and perilymphatic fluid after intravenous administration of single-dose gadodiamide. Magn Reson Med Sci 11(2):145–150
Naganawa S, Yamazaki M, Kawai H, Bokura K, Sone M, Nakashima T (2013) Three-dimensional visualization of endolymphatic hydrops after intravenous administration of single-dose gadodiamide. Magn Reson Med Sci 12(2):147–151
Nahmani S, Vaussy A, Hautefort C et al (2020) Comparison of enhancement of the vestibular perilymph between variable and constant flip angle-delayed 3D-FLAIR sequences in Menière disease. AJNR Am J Neuroradiol 41(4):706–711
Noh TS, Park MK, Lee JH et al (2021) Three-dimensional volumetric measurement of endolymphatic hydrops in Meniere’s disease. Front Neurol 12:710422
Oh SY, Dieterich M, Lee BN et al (2021) Endolymphatic hydrops in patients with vestibular migraine and concurrent Meniere’s disease. Front Neurol 12:710422
Okazaki Y, Yoshida T, Sugimoto S et al (2017) Significance of endolymphatic hydrops in ears with unilateral sensorineural hearing loss. Otol Neurotol 38(8):1076–1080
Pai I, Mendis S, Murdin L, Touska P, Connor S (2020) Magnetic resonance imaging of Ménière’s disease: early clinical experience in a UK centre. J Laryngol Otol 134(4):302–310
Pakdaman MN, Ishiyama G, Ishiyama A et al (2016) Blood-labyrinth barrier permeability in Menière disease and idiopathic sudden sensorineural hearing loss findings on delayed postcontrast 3D-FLAIR MRI. AJNR Am J Neuroradiol 37(10):1903–1908
Pérez-Fernández N, Dominguez P, Manrique-Huarte R et al (2019) Endolymphatic hydrops severity in magnetic resonance imaging evidences disparate vestibular test results. Auris Nasus Larynx 46(2):210–217
Pyykkö I, Nakashima T, Yoshida T, Zou J, Naganawa S (2013) Meniere’s disease: a reappraisal supported by a variable latency of symptoms and the MRI visualisation of endolymphatic hydrops. BMJ Open 3:1555
Qin H, He B, Wu H et al (2021) Visualization of endolymphatic hydrops in patients with unilateral idiopathic sudden sensorineural hearing loss with four types according to Chinese criterion. Front Surg 8:682245
Quatre R, Attyé A, Karkas A, Job A, Dumas G, Schmerber S (2019) Relationship between audio-vestibular functional tests and inner ear MRI in Meniere’s disease. Ear Hear 40(1):168–176
Sano R, Teranishi M, Yamazaki M et al (2012) Contrast enhancement of the inner ear in magnetic resonance images taken at 10 minutes or 4 hours after intravenous gadolinium injection. Acta Otolaryngol 132(3):241–246
Shi S, Guo P, Wang W (2018) Magnetic resonance imaging of Ménière’s disease after intravenous administration of gadolinium. Ann Otol Rhinol Laryngol 127(11):777–782
Shimono M, Teranishi M, Yoshida T et al (2013) Endolymphatic hydrops revealed by magnetic resonance imaging in patients with acute low-tone sensorineural hearing loss. Otol Neurotol 34(7):1241–1246
Shiraishi K, Ohira N, Kobayashi T, Sato M, Osaki Y, Doi K (2020) Comparison of furosemide-loading cervical vestibular-evoked myogenic potentials with magnetic resonance imaging for the evaluation of endolymphatic hydrops. Acta Otolaryngol 140:715–719
Sousa R, Guerreiro C, Eça T, Campos J, Luis L (2021) MR imaging of cochlear modiolus and endolymphatic hydrops in patients with Menière’s disease. Front Surg 8:667248
Suarez Vega VM, Caballeros Lam FM, Dominguez et al (2019) Comparison between high-resolution 3D REAL-IR and 3D FLAIR sequences in the assessment of endolymphatic hydrops in 3 Tesla. Insights Imaging 10(S1):S248–S249
Tagaya M, Yamazaki M, Teranishi M et al (2011) Endolymphatic hydrops and blood-labyrinth barrier in Ménière’s disease. Acta Otolaryngol 131(5):474–479
Tanigawa T, Tamaki T, Yamamuro O et al (2011) Visualization of endolymphatic hydrops after administration of a standard dose of an intravenous gadolinium-based contrast agent. Acta Otolaryngol 131(6):596–601
Tuñón Gómez M, Lobo Duro DR, Brea Álvarez B, García-Berrocal JR (2017) Diagnosis of endolymphatic hydrops by means of 3 T magnetic resonance imaging after intratympanic administration of gadolinium. Radiologia 59(2):159–165
van Steekelenburg JM, van Weijnen A, de Pont LMH et al (2020) Value of endolymphatic hydrops and perilymph signal intensity in suspected Ménière disease. AJNR Am J Neuroradiol 41(3):529–534
Vanspauwen R, de Foer B, Maryn Y et al (2016) The role of magnetic resonance imaging in the diagnosis of endolymphatic hydrops and Meniere’s disease. J Vestib Res 26(1–2):57–154
Wu Q, Dai C, Zhao M, Sha Y (2016) The correlation between symptoms of definite Meniere’s disease and endolymphatic hydrops visualized by magnetic resonance imaging. Laryngoscope 126(4):974–979
Xie W, Shu T, Liu J et al (2021) The relationship between clinical characteristics and magnetic resonance imaging results of Ménière disease: a prospective study. Sci Rep 11(1):7212
Yoshida T, Sugimoto S, Teranishi M et al (2018) Imaging of the endolymphatic space in patients with Ménière’s disease. Auris Nasus Larynx 45(1):33–38
Yoshida T, Kobayashi M, Sugimoto S, Teranishi M, Naganawa S, Sone M (2021) Evaluation of the blood–perilymph barrier in ears with endolymphatic hydrops. Acta Otolaryngol 141(8):736–741
Eliezer M, Attyé A, Toupet M, Hautefort C (2021) Imaging of endolymphatic hydrops: a comprehensive update in primary and secondary hydropic ear disease. J Vestib Res 31(4):261–268
Conte G, Lo Russo FM, Calloni SF et al (2018) MR imaging of endolymphatic hydrops in Meniere’s disease: not all that glitters is gold. Acta Otorhinolaryngol Ital 38(4):369–376
Han AY, Kontorinis G (2022) A systematic review on delayed acquisition of post-gadolinium MRI in Meniere's disease: imaging of the endolymphatic spaces. J Laryngol Otol 2022:1–22
Lopez-Escamez JA, Attyé A (2019) Systematic review of magnetic resonance imaging for diagnosis of Meniere disease. J Vestib Res 29(2–3):121–129
Song CI, Andresen NS, Ward BK, Pogson JM (2021) MRI with gadolinium as a measure of blood-labyrinth barrier integrity in patients with inner ear symptoms: a scoping review. Front Neurol 12:662264
Zanetti D, Conte G, Scola E, Casale S, Lilli G, di Berardino F (2021) Advanced imaging of the vestibular endolymphatic space in Ménière’s disease. Front Surg 8:700271
Gürkov R, Flatz W, Ertl-Wagner B, Krause E (2013) Endolymphatic hydrops in the horizontal semicircular canal: a morphologic correlate for canal paresis in Ménière’s disease. Laryngoscope 123(2):503–506
Kirsch V, Becker-Bense S, Berman A, Kierig E, Ertl-Wagner B, Dieterich M (2018) Transient endolymphatic hydrops after an attack of vestibular migraine: a longitudinal single case study. J Neurol 265(Suppl 1):51–53
Nakashima T, Naganawa S, Pyykkö I et al (2009) Grading of endolymphatic hydrops using magnetic resonance imaging. Acta Otolaryngol Suppl 560:5–8
Yamazaki M, Naganawa S, Tagaya M et al (2012) Comparison of contrast effect on the cochlear perilymph after intratympanic and intravenous gadolinium injection. AJNR Am J Neuroradiol 33(4):773–778
Kimura H, Aso S, Watanabe Y (2003) Prediction of progression from atypical to definite Ménière’s disease using electrocochleography and glycerol and furosemide tests. Acta Otolaryngol 123(3):388–395
Moher D, Liberati A, Tetzlaff J et al (2009) Preferred reporting items for systematic reviews and meta-analyses: the PRISMA statement. PLoS Medicine 21;6 7 e1000097
Schardt C, Adams MB, Owens T, Keitz S, Fontelo P (2007) Utilization of the PICO framework to improve searching PubMed for clinical questions. BMC Med Inform Decis Mak 7:16
McGowan J, Sampson M, Salzwedel DM, Cogo E, Foerster V, Lefebvre C (2016) PRESS Peer Review of Electronic Search Strategies: 2015 Guideline Statement. J Clin Epidemiol 75:40–46
Whiting PF (2011) QUADAS-2: a revised tool for the quality assessment of diagnostic accuracy studies. Ann Intern Med 155(8):529
Macaskill P, Gatsonis C, Deeks J, Harbord R, Takwoingi Y (2010) Analysing and presenting results. In: Deeks JJ, Bossuyt PM, Gatsonis C (eds) Cochrane handbook for systematic reviews of diagnostic test accuracy. The Cochrane Collaboration, London, pp 1–61
Deeks JJ, Macaskill P, Irwig L (2005) The performance of tests of publication bias and other sample size effects in systematic reviews of diagnostic test accuracy was assessed. J Clin Epidemiol 58(9):882–893
Lijmer JG, Mol BW, Heisterkamp S et al (1999) Empirical evidence of design-related bias in studies of diagnostic tests. JAMA 282(11):1061–1066
Acknowledgements
The authors would like to acknowledge Dr. Arnaud Attye, Dr. Anja Banaerts, Dr. Wei Chen, Dr. Bert de Foer, Dr. Lisa de Pont, Dr. Michael Eliezer, Professor Valerie Kirsch, Dr. Sabrina Kosling, Dr. Yuriko Okazaki and Dr. Nicolas Perez-Fernandez for providing additional information on their research relevant to the systematic review.
Funding
The authors acknowledge funding support from Wellcome/Engineering and Physical Sciences Research Council Centre for Medical Engineering at King’s College London (WT 203148/Z/16/Z); National Institute for Health Research Biomedical Research Centre at Guy’s & St Thomas’ Hospitals and King’s College London; Cancer Research UK National Cancer Imaging Translational Accelerator (A27066); and the UK Research & Innovation London Medical Imaging and Artificial Intelligence Centre.
Author information
Authors and Affiliations
Corresponding author
Ethics declarations
Guarantor
The scientific guarantor of this publication is Dr. SEJ Connor.
Conflict of interest
SEJ Connor is a member of the European Radiology Advisory Editorial Board. He has not taken part in the review or selection process of this article.
The remaining authors of this manuscript declare no relationships with any companies, whose products or services may be related to the subject matter of the article.
Statistics and biometry
Mariusz T. Grzeda MSc and Babak Jamshidi PhD kindly provided statistical advice for this manuscript.
Informed consent
Written informed consent was not required for this study because the study entailed a systematic review of the literature, and it did not use any new patient data.
Ethical approval
Institutional Review Board approval was not required because the study entailed a systematic review of the literature, and it did not use any new patient data.
Study subjects or cohorts overlap
Study subjects are acquired from literature search of previously reported cohorts.
Methodology
• Methodology of reviewed literature includes prospective or retrospective case–control studies.
Additional information
Publisher's Note
Springer Nature remains neutral with regard to jurisdictional claims in published maps and institutional affiliations.
Supplementary Information
Below is the link to the electronic supplementary material.
Rights and permissions
Open Access This article is licensed under a Creative Commons Attribution 4.0 International License, which permits use, sharing, adaptation, distribution and reproduction in any medium or format, as long as you give appropriate credit to the original author(s) and the source, provide a link to the Creative Commons licence, and indicate if changes were made. The images or other third party material in this article are included in the article's Creative Commons licence, unless indicated otherwise in a credit line to the material. If material is not included in the article's Creative Commons licence and your intended use is not permitted by statutory regulation or exceeds the permitted use, you will need to obtain permission directly from the copyright holder. To view a copy of this licence, visit http://creativecommons.org/licenses/by/4.0/.
About this article

Cite this article
Connor, S., Grzeda, M.T., Jamshidi, B. et al. Delayed post gadolinium MRI descriptors for Meniere’s disease: a systematic review and meta-analysis. Eur Radiol 33, 7113–7135 (2023). https://doi.org/10.1007/s00330-023-09651-8
Received:
Revised:
Accepted:
Published:
Issue Date:
DOI: https://doi.org/10.1007/s00330-023-09651-8