
Abstract
Based on patent data in the field of genomics between 1990 and 2010, we investigate how social network relationships, various proximity dimensions (geographical, organizational, technological) and their interplay affect the likelihood of forming technological collaborations and their inventive performance. We show that the network and proximity characteristics of co-inventors enable them to access different sources of knowledge, in different geographical and organizational contexts, and finally affect the quality of inventive collaboration. Based on econometric estimations, our results enable to address the proximity paradox argument that proximity acts differently on the formation of collaborations and innovative performance. Our results partly support this paradox. Although all types of proximity positively impact on the formation of new collaborations, only organizational and technological proximities directly impact performance. Moreover, the optimal level of technological proximity critically varies given the organizational and social network context.


Notes
Berliant and Fujita (2012) propose a similar argument in a different theoretical framework. They argue that “[i]deas in common are important for communication, whereas ideas known exclusively by one of the partners are important for bringing originality into the potential partnership” (p. 649). The two arguments are fairly similar but with a different definition of what knowledge and learning are. In this case, knowledge is represented by an individual endowment of ideas and learning is a production of new ideas, which depends on the personal stock of each individual and their overlap.
The interaction term is not equivalent to the correlation. If we consider a simple model with two variables, the interaction term captures the fact that the main effect of a variable, say \(x_{1}\), depends on the value of another variable, \(x_{2}{:}\, y = {\upbeta }_{0}+{\upbeta }_{1}x_{1}+{\upbeta }_{2}x_{2}+ {\upbeta }_{3}x_{1}x_{2}+{\upvarepsilon }\). Thus although, \(x_{1}\) has a positive impact on y, if the interaction is negative (\({\upbeta }_{3}<0\)), then the marginal impact of \(x_{1}\) is lowered when \(x_{2}\) is different from zero as the following derivative illustrates: \(\frac{\partial y}{\partial x_1 }=\beta _1 +\beta _3 x_2 \).
The database was built during a recent research project carried out by ADIS-Paris Sud, LERECO-INRA and the OST—Observatoire des Sciences et des Techniques—supported by the French national research agency (ANR—Agence National pour la Recherche).
The disambiguation of inventors’ homonymies has been dealt following the methodology proposed in Carayol and Cassi (2009).
Social Network Analysis computation has been programmed, by the authors, themselves with SAS. The SPAM modules developed by Moody (2000) have been extremely helpful.
For a different approach where affiliation data are integrated with survey data, see, for instance, Rost (2011).
Even for industry–university collaborations, most of the time there is only one affiliation for a given patent; for this reason, inventors of a given patent have the same affiliation even if the applicant designated in the patent does not employ them.
Dyadic data are typically not independent since residual involving the same individual are likely to be correlated, that is, Cov(\({\upvarepsilon }_{ij},{\upvarepsilon }_{ik})\ne 0\). In consequence, standard errors must correct for cross-observation in the error terms involving the same inventors. The quadratic assignment procedure enables to handle this non-independence using a permutation procedure. Given the number of possible dyads, the procedure is difficult to apply on the whole sample. As a robustness check, we have applied the Netlogit procedure of the SNA R package on the final sample. The results provided as a supplementary material lead to similar results (Supplement 1).
If n is the number of active inventors, n*(n-1) is the number of potential ties between these inventors. We estimate this number to be approximately 14190 European inventors. The probability of an event to occur in the sample is approximately equal to \(2133/((14190^{*}14189)/2)\) given that the sample is composed of 2133 realized links.
Rare event logit has been implemented through the ReLogit Stata routine proposed by Tomz (1999).
We only observe the performance of dyads for which patents have been applied for and this induces a selection bias. A solution would be to employ a two-stage Heckman selection model, but this requires specifying independent variables that affect the probability of a dyad to patent but that do not affect the level of citations. Since we lack a theory that would suggest such variables, we are not totally confident in this two-stage procedure. However, estimates have been implemented after bootstrapping and the Mills Ratio is not significant.
We adjust the latitude and longitude coordinates for the earth curvature; thus, the distance in km between two points \(A\) and \(B\) is computed as:
$$\begin{aligned} d(A,B)&= 6371 \times \hbox {arccos}[\hbox {sin}(\hbox {latitude}(A)) \times \hbox {sin}(\hbox {latitude}(B)) + \hbox {cos}(\hbox {latitude}(A)) \times \hbox {cos}(\hbox {latitude}(B))\\&\quad \times \hbox {cos}(|\hbox {longitude}(A) - \hbox {longitude}(B) |)]. \end{aligned}$$Model 1a introduces technological proximity in a quadratic way, since it is not significant, we do not replicate this specification in the following logit models.
The turning point is equal to coefficient of technological proximity/2*coefficient of technological proximity sq.
The marginal effect of closure with interaction is tested with a Wald test; the null hypothesis that closure\(\,=\,\)0 & closure*technological proximity\(\,=\,\)0, is rejected with a \(p\) value of 0.0394 (\(\hbox {Chi}^{2}(2)=8.34\)).
Fig. 4 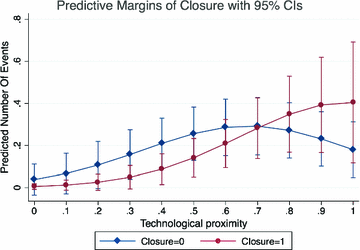
Predicted number of forward citations—closure versus non-closure

References
Agrawal A, Cockburn I, McHale J (2006) Gone but not forgotten: labor flows, knowledge spillovers, and enduring social capital. J Econ Geogr 6(5):571–591
Agrawal A, Kapur D, McHale J (2008) How do spatial and social proximity influence knowledge flows? Evidence from patent data. Jo Urban Econ 64(2):258–269
Albert MB, Avery D, Narin F, McAllister P (1991) Direct validation of citation counts as indicators of industrially important patents. Res Policy 20(3):251–259
Audretsch BD, Feldman PM (1996) R&D spillovers and the geography of innovation and production. Am Econ Rev 86(3):630–640
Autant-Bernard C, Billand P, Frachisse D, Massard N (2007) Social distance versus spatial distance in R&D cooperation: empirical evidence from European collaboration choices in micro and nanotechnologies. Pap Reg Sci 86(3):495–519
Bathelt H, Malmberg A, Maskell P (2004) Clusters and knowledge: local buzz, global pipelines and the process of knowledge creation. Progress Human Geogr 28:31–56
Beaudry C, Breschi S (2003) Are firms in clusters really more innovative? Econ Innov New Technol 12:325–342
Berliant M, Fujita M (2012) Culture and diversity in knowledge creation. Reg Sci Urban Econ 42(4):648–662
Boschma RA (2005) Proximity and innovation: a critical assessment. Reg Stud 39(1):61–74
Boschma RA, Frenken K (2010) The spatial evolution of innovation networks. A proximity perspective. In: Boschma RA, Martin R (eds) Handbook of evolutionary economic geography, chapter 5. Edward Elgar, Cheltenham
Boufaden N, Plunket A (2007) Proximity and innovation: do biotechnology firms located in the Paris Region benefit from localized technological externalities? Les Annales d’Economie et Statistique 87/88:197–220
Breschi S, Lissoni F (2001) Knowledge spillovers and local innovation systems: a critical survey. Ind Corp Change 10:975–1005
Breschi S, Lissoni F (2009) Mobility of skilled workers and co-invention networks: an anatomy of localized knowledge flows. J Econ Geogr 9(4):439–468
Broekel T, Boschma R (2012) Knowledge networks in the Dutch aviation industry—the proximity paradox. J Econ Geogr 12:409–433
Cameron AC, Trivedi PK (2005) Microeconometrics: methods and applications. Cambridge University Press, NY
Carayol N, Cassi L (2009) Who’s who in patents. A Bayesian approach, Université paris 1 Panthéon-Sorbonne, hal-00631750, HAL
Cassi L, Plunket A (2014) Research collaboration in co-inventor networks: combining closure, bridging and proximities, regional studies (forthcoming)
Cohen WM, Levinthal DA (1990) Absorptive capacity: a new perspective on learning and innovation. Adm Sci Q 35:128–152
Fafchamps M, Goyal S, van der Leij MJ (2010) Matching and network effects. J Eur Econ Assoc 8(1):203–231
Fornahl D, Broekel T, Boschma R (2011) What drives patent performance of German biotech firms? The impact of R&D subsidies, knowledge networks and their location. Pap Reg Sci 90(2):395–418
Frenken K, Ponds R, Van Oort FG (2010) The citation impact of research collaboration in science-based industries: a spatial-institutional analysis. Pap Reg Sci 89(2):351–371
Gambardella A, Harhoff D, Verspagen B (2008) The value of European patents. Eur Manag Rev 5(2):69–84
Gilsing V, Nooteboom B, Vanhaverbeke W, Duysters G, van den Oord A (2008) Network embeddedness and the exploration of novel technologies: technological distance, betweenness centrality and density. Res Policy 37(10):1717–1731
Harhoff D, Scherer FM, Vopel K (2003) Citations, family size, opposition and the value of patent rights—evidence from Germany. Res Policy 32:1343–1363
Hausman J, Hall B, Griliches Z (1984) Economic models for count data with an application to patents and R&D relationship. Econometrica 52:909–938
Huber F (2011) On the role and interrelationship of spatial, social and cognitive proximity: personal knowledge relationships of R&D workers in the Cambridge Information Technology. Cluster 46(9):1169–1182
Jaffe AB (1989) Real effects of academic research. Am Econ Rev 79(5):957–970
King G, Zeng L (2001) Logistic regression in rare events data. Political Anal 9:137–163
Laurens P, Zitt M, Bassecoulard E (2010) Delineation of the genomics field by hybrid citation-lexical methods: interaction with experts and validation process. Scientometrics 82(3):647–662
Martinez C (2010) Insight into different types of patent families. OECD Science, Technology and Industry Working Papers, 2010/02, OECD Publishing
Moody J (2000) SPAN: SAS programs for analyzing networks. University of North Carolina at Chapel Hill
Mowery DC, Oxley JE, Silverman BS (1998) Technological overlap and interfirm cooperation: implications for the resource-based view of the firm. Res Policy 27(5):507–523
Newman MEJ, Park J (2003) Why social networks are different from other types of networks. Phys Rev E 68(3)
Nooteboom B, Van Haverbeke W, Duysters G, Gilsing V, van den Oord A (2007) Optimal cognitive distance and absorptive capacity. Res Policy 36(7):1016–1034
OECD (2009) OECD patent statistics manual. http://www.oecdbookshop.org/oecd/display.asp?sf1=identifiers&st1=9789264056442
Ponds R, Van Oort F, Frenken K (2007) The geographical and institutional proximity of research collaboration. Pap Reg Sci 86(3):423–443
Rost K (2011) The strength of strong ties in the creation of innovation. Res Policy 40(4):588–604
Singh J (2005) Collaborative networks as determinants of knowledge diffusion patterns. Manag Sci 51(5):756–770
Sorenson O, Rivkin JW, Fleming L (2006) Complexity, networks and knowledge flows. Res Policy 35:994–1017
Ter Wal ALJ (2014) The dynamics of the inventor network in German biotechnology: geographic proximity versus triadic closure. J Econ Geogr 14(3):589–620
Tomz M (1999) Relogit (Stata ado file). http://www.stanford.edu/~tomz/software/software.shtml
Trajtenberg M (1990) A penny for your quotes: patent citations and the value of innovations. RAND J Econ 21(1):172–187
Trajtenberg M, Henderson R, Jaffe A (1997) University versus corporate patents: a window on the basicness of invention. Econ Innov New Technol 5(1):19–50
Wittington KB, Owen-Smith J, Powell WW (2009) Networks, propinquity, and innovation in knowledge-intensive industries. Adm Sci Q 54:90–122
Wuyts SHK, Colombo M, Dutta S, Nooteboom B (2005) Empirical tests of optimal cognitive distance. J Econ Behav Organ 58(2):277–302
Author information
Authors and Affiliations
Corresponding author
Electronic supplementary material
Below is the link to the electronic supplementary material.
Rights and permissions
About this article

Cite this article
Cassi, L., Plunket, A. Proximity, network formation and inventive performance: in search of the proximity paradox. Ann Reg Sci 53, 395–422 (2014). https://doi.org/10.1007/s00168-014-0612-6
Received:
Accepted:
Published:
Issue Date:
DOI: https://doi.org/10.1007/s00168-014-0612-6