
Abstract
Based on the multiple information collection technology for power grid disaster losses, remote real-time information interaction technology, and disaster information analysis and prediction technology, a prototype system for intelligent perception and emergency command of power grid disaster situations is developed.
You have full access to this open access chapter, Download chapter PDF
7.1 General Architecture
7.1.1 Technical Route
Based on the multiple information collection technology for power grid disaster losses, remote real-time information interaction technology, and disaster information analysis and prediction technology, a prototype system for intelligent perception and emergency command of power grid disaster situations is developed. The system is divided into terminal and main station service functions yes, the functional framework diagram is shown in Fig. 7.1.

Functional framework diagram of power grid disaster intelligent perception and emergency command prototype system
Key features include: (1) Intelligent equipment identification function, using the “UAV-based line disaster survey and identification technology” in Chap. 3, to achieve the use of deep learning technology to build a model identification library of power grid equipment, the use of UAV automatic detection system to identify the site of power disasters, to achieve automatic identification and survey of the disaster damage site. (2) on-site data collection function, using “Chapter 3 of the Internet of Things based on the typical electrical equipment disaster damage multiple information fast collection, automatic collection technology”, based on three-dimensional point cloud, two-dimensional images and radio frequency RFID-assisted comprehensive on-site power equipment intelligent identification collection, through integration with the back-end intranet PMS system, monitoring systems, etc., to achieve real-time pushing of data such as on-site equipment ledger, equipment drawings, historical maintenance and operation records, real-time load operation status, to assist field operators in the emergency site to carry out diagnostic analysis of damaged equipment. (3) Disaster loss information fusion analysis and prediction function, using “Chapter 4 of the power grid disaster loss information fusion analysis and prediction technology” to realize the information fusion and fuzzy dynamic power grid loss prediction of the comprehensive database of power grid emergency command and the disaster loss model database. (4) real-time multi-person information interaction technology, using the “Chapter 5 real-time information interaction technology between the emergency site and the command center” to achieve real-time interaction between the disaster damage site terminals and real-time multi-person interaction between the site and the remote command center, to build an efficient multi-type information reporting method, and to improve the ability to interact with information between various departments and locations for emergency response.
The technical route of the prototype system of intelligent perception of power grid disaster situation and emergency command is as follows:
Smart mobile devices use the Eclipse development platform, and the development uses HTML5, Java and other development languages for function can be developed. Use JSON structured data format to communicate with the background server for web service interface.
The main station system function adopts the eclipse development platform, and the development adopts C, Java and other development languages for the master server for the development of services, the external service interface adopts tomcat for unified service distribution, and the database adopts open source MySQL database technology, unstructured data using cstor distributed storage.
According to the needs of business functions, the architecture of the power grid disaster intelligent perception and emergency command prototype system is divided into four levels: data resource layer, business logic layer, presentation layer, and channel client, and each layer is interdependent.
The data resource layer includes the database, enterprise information system, file system, and directory service of the emergency command system to provide data support.
The business logic layer includes multiple information collection, power equipment identification, disaster information analysis, disaster information prediction, real-time information interaction, and public information display.
The presentation layer is the display and interactive operation layer of business functions, and the system adopts standard HTML/JS, Flex, artificial intelligence reasoning, workflow engine and other technologies to realize the rich client interaction capability of the presentation layer.
Channel clients include PC clients, tablets, phones, PDAs, smart terminals, and so on.
The research and development of power grid disaster intelligent perception and emergency command prototype system can be logically divided into user layer, application layer, service interface layer, and database service. (1) The user layer mainly includes hardware devices such as intelligent mobile devices, networking equipment, and intranet servers. (2) The application layer mainly includes business pages and platform presentation frameworks. Platform presentation layer used by various page modules to compose a business page. The business application module combines the business characteristics to customize the business logic at this layer. (3) The service interface layer includes the communication client running in the browser and the service access point running on the server side. The service interaction layer provides functions such as formatting, transmission, packet and unpacket, URL processing and distribution of user request data. The platform supports RESTful, BlazeDS, and the platform provides Web service support for integration between systems. Platform internal service call data is serialized in JSON format. The server uses the Dispatch Servlet in Spring MVC for request distribution. The business logic module of the business application system, the standard logic module provided by the platform, and the public service agent constitute the business logic layer. Platform services expose public service interfaces in the business system operating environment, which can be referenced by business logic or exposed to client calls through the service interaction layer (solving the cross domain problem of browser HTTP requests). (4) The database service layer adopts MySQL database to analyze and backup structured and unstructured data in a unified manner, and adopts CSTOR distributed storage for data management to ensure data efficiency and security.
7.1.2 Overall Architecture Design
-
(1)
Technical architecture
-
1)
Technical requirements
The construction of the power grid disaster intelligent perception and emergency command system should adopt international advanced and mature IT achievements to ensure that the system has a leading technical level in the corresponding fields in China. During system implementation, the following technical requirements should be observed:
-
a)
Progressiveness: the realization of the system should refer to the international benchmark and combine the current situation, adopt advanced and reliable equipment and technology, ensure the advanced and mature of the system, and ensure the effectiveness and continuity of investment.
-
b)
Safety and reliability: the system must meet enterprise-level security standards, provide good security and reliability strategies, support a variety of safety and reliability technical means, and formulate strict safety and reliability management measures.
-
c)
Openness: the system should be based on the open standards of the industry at home and abroad, carry out unified national planning, and lay the foundation for future business development.
-
d)
Scalability: the system should have flexible scalability, with the ability to easily adapt to changes in business needs and quickly support new services.
-
e)
Scalability: the system should have good scalability, and the system performance and concurrent processing capabilities should have smooth expansion capabilities for the host device to support the rapid development of business volume.
-
f)
Usability: the system should be easy to use and maintain, with a good user interface, userfriendly management tools and complete help information.
Under the guidance and constraints of the overall technical requirements, the core technology of system design and implementation is realized by component technology, considering the comprehensive balance between quality elements such as performance, reliability and ease of use to ensure the smooth realization of technical objectives.
-
2)
Technical architecture design
The system technical architecture defines the core technology roadmap of the target system, defines the hierarchical model used in the system, defines the role and bearing relationship of each level in the application system, and the correspondence between each level and the normative system.
-
a)
Service-oriented business component design
In the system standardization design, the specific functional applications of the power grid disaster intelligent perception and emergency command system business are divided into interface control components and business logic components for business logic encapsulation, and all business application functions are decomposed into basic processing units according to the degree of business coupling, and adapt to the dynamic changes and business expansion needs of the power grid disaster intelligent perception and emergency command system business through the combination and assembly of components.
Specific business components can provide standard service interfaces for other applications in the method of web services. Others the application system can obtain related component service information through standard services, including service call information and data the rules, etc., and the corresponding functions are implemented through the web service according to specific needs, and integrated into its applications.
-
b)
J2EE based technical implementation
According to the design of the application architecture and data architecture of the system, the business application of the power grid disaster intelligent perception and emergency command system adopts a J2EEbased multilayer technology architecture that meets the combination of technological advancement and maturity to improve the flexibility, scalability, security and concurrent processing capability of the system.
The multilayer architecture of power grid disaster intelligent perception and emergency command system business application technical support system adopts component technology to separate interface control, business logic and data mapping, realize loose coupling within the system, and respond flexibly and quickly to the requirements of the system for business changes. The system hierarchy is generally divided into presentation layer, integration service layer, business logic layer, data resource layer (including data mapping layer and data source layer), and infrastructure layer the bearer relationship of services between hierarchical system components to realize system functions as shown in Fig. 7.2.

System technical architecture
-
①
Presentation layer: it is the view layer of the platform, and all human–computer interaction activities will be implemented based on this layer. The entire presentation layer will be implemented based on the B/S pattern. Leaflet, Echart and other chart technologies are used to visualize meteorological information, typhoon information, heavy rain and flood, rain, snow and freezing, earthquake disasters, landslide disasters, emergency response, public information, etc.; It adopts the MVC application framework, which consists of interface controller components, interface operation components, JSP page components and service proxy units to realize data information maintenance and monitoring management functions.
-
②
Integrated service layer: integrate internal and external system business data information, configure and maintain business system users, permissions, etc., timely obtain meteorological information and disaster information such as typhoons, heavy rain, rain, snow and freezing, earthquakes, landslides, etc., and display data fusion with internal station system information to realize the integration and display of multiple data sources of business systems in the emergency command center.
-
③
Business logic layer: used to deploy business logic components, including application support technology components, service engines, protocol conversion, rule engines, big data analysis, permission services, service monitoring, log services, cache services, task scheduling, collection services, etc.
-
④
Data resource layer: composed of data sources and data access, data sources mainly include relational databases, nonrelational databases, etc., of which transaction data and statistical data are selected relational databases, meteorology, power grids, logs and other data are selected nonrelational databases, data sources specify the access and storage methods of platform data, and data access methods include JDBC adapter, ETL, WebService, sqoop, hive, etc.
-
⑤
Infrastructure layer: the basic software and hardware environment on which the platform design, development and operation depend. The whole platform will be compiled and deployed based on Windows operating system, data acquisition and data service part will be based on J2EE architecture technology development system, Java language development and implementation, data processing and product processing based on Java language, meteorological service product display based on Leaflet technology, power business data display based on Echart technology, mainly including network, server, storage, backup, software platform, etc.
-
(2)
Data Architecture
From the perspective of enterprise data asset management, we formulate strategies, models and processes for data collection, storage, movement and access in the whole data life cycle, adopt data sharing and exchange methods such as data replication, intermediate library/ETL, WebService service, external network data capture and resource penetration call based on service bus technology, realize integration with internal and external systems to complete the centralization of professional basic data and business data as the main data support in the process of emergency command, and improve the efficiency of data storage and sharing. This is shown in Fig. 7.3.

System data architecture
-
1)
Data architecture planning
The data architecture is designed based on the data model from two aspects, namely data technology classification, data deployment design, each of which addresses a key issue in one area, while supporting and complementing each other to form a unified and organic overall data architecture.
-
2)
Data model design
The data model of power grid disaster intelligence sensing and emergency command system is guided by the enterprise data model by analyzing and sorting out the important business concepts and data involved in emergency management, and considering the undertaking relationship with the enterprise data model. The data model of grid disaster awareness and emergency command system is established by analyzing and sorting out important business concepts and data involved in emergency management, and considering the undertaking relationship with enterprise data model.
The data model consists of two parts: the conceptual data model and the logical data model. The main goal of the conceptual data model is to define and present the core business concepts and relationships as a bridge between business personnel and technical personnel, and is the basis of the logical data model, whose inputs are business requirements and business specifications. The main goal of the logical data model is to further refine each business entity based on the framework designed by the conceptual data model and combined with business requirements, which mainly consists of entities, attributes and relationships.
The top-level conceptual model is first designed to delineate the data topic domains and define the relationships between them. Then the top-down design is carried out separately for each data subject area, and the design content is gradually refined to complete the conceptual model and detailed logical model design for each data subject area. The top-level conceptual model is the conceptual model of the data domain and the detailed logical model design. The top-level conceptual model is the highest guidance for the design of data domain conceptual model and data domain logical model. The top-level conceptual model is the highest guideline for the design of data domain conceptual model and data domain logical model.
-
(3)
Business architecture
-
1)
Business analysis
The grid disaster intelligence perception and emergency command system integrates early warning monitoring, typhoon monitoring, heavy rain and flood disaster warning, rain and snow freeze disaster warning, earthquake disaster warning, landslide disaster warning, emergency disposal function module, work exchange function module, public information function module, etc. to provide unified data interaction services, improve the accuracy and perception of various disaster warnings, take the power grid GIS platform as the basis, take Based on the grid GIS platform, with emergency command as the purpose and grid GIS as the data display carrier, it integrates grid environment, disaster prediction, disaster analysis and other resources with multiple calibers to complete real-time intelligent perception of grid disasters and emergency command of emergency repair.
The system integrates basic information such as power grid load, substations, transmission and distribution lines, distribution substations, towers, power users, early warning information, disaster express, disaster damage perception, weather, typhoon, earthquake, cloud map, radar, rainfall, landslide, etc., into GIS maps through data conversion and data analysis import. Through the integration of basic information of power grid with external environment information and emergency command information, it provides basic display data for real-time disaster awareness and emergency disposal.
The grid disaster intelligence perception and emergency command system includes two business scenarios: information maintenance and frontend display; different scenarios, providing different system interfaces and addressing the core issues of concern for different application scenarios. System Business Architecture The architecture of the system is shown in Fig. 7.4.

System business architecture diagram
Information maintenance: this scenario is applicable to system maintenance personnel for basic information maintenance. The characteristic of this scenario is that it requires an accurate, timely and detailed understanding of the basic information of the power grid, early warning and monitoring information, equipment and facilities outage and recovery, and emergency repair force input. For this scenario, the design is intended to be realized by means of tabular display.
Frontend display: This scenario is applicable to the disaster damage perception and emergency disposal work. The characteristics of this scenario is that it requires a holistic, accurate, and intuitive understanding of the basic information of the power grid, disaster damage prediction and real-time disaster damage perception, and emergency disposal. In response to this scenario, this design proposes to use various charts organically combined with the large screen of the emergency command center for comprehensive display.
-
2)
Business Model
By integrating various disaster prediction models, the power grid disaster perception and disaster damage prediction system provides support for emergency command and emergency disposal. Through the system, you can view early warning monitoring information, typhoon monitoring information, heavy rainfall and flooding information, snow and ice information, earthquake information, landslide information, emergency disposal, work exchange, public information and other modules. The system business model is shown in Fig. 7.5.

System business model diagram
7.1.3 System Non-functional Design
-
(1)
Performance
System response time: transaction processing business, simple business response time ≦5 s, complex business response time ≦8 s; query business, simple query response time ≦3 s, comprehensive query response time ≦5 s; statistical analysis business, the average response time of real-time statistical business shall not exceed 20 s; system business, 90% of the interface switching response time ≤3 s, the rest ≤5 s, receiving abnormal events, external process information response time The response time of receiving abnormal events and external process information is ≤5 s.
System throughput: transaction processing business, fast response class 1000 pcs/min, ordinary response class 600 pcs/min, batch processing class 200 pcs/min; query business, simple query class 1000 pcs/min, comprehensive query class 500 pcs/min; statistical analysis business, simple statistical analysis class 500 pcs/min, complex statistical analysis class 100 pcs/min; system class business, meet 300 pcs/min.
-
(2)
Reliability
The whole system should be able to work continuously for 7 × 24 h without interruption, and if there is a fault, it should be able to alarm in a timely manner; Under the condition of running continuously for 2 h with the maximum number of concurrent users, the system runs smoothly and the business failure rate does not exceed 0.1%. The average CPU occupancy rate is less than 60%, and the memory occupancy rate does not increase significantly and the memory recovers its initial value after one hour. The system runs smoothly and the business failure rate does not exceed 0.1% when the maximum number of concurrent users is 40 percent for 8 h. The system runs smoothly, the business failure rate does not exceed 0.1%, the average CPU occupancy rate is less than 60%, the memory occupancy rate does not increase significantly and the initial value is restored after 1 h. The system has the ability to compensate for transactions.
The system should have automatic or manual recovery measures so that it can quickly resume normal operation in case of errors. When the software system fails, the automatic recovery time is <10 min and the manual recovery time is <1 h; the user concurrency is too large When the number of concurrent users is too large, the system should be prevented from crashing by consuming too many system resources; the average failure free rate of the system is >99.96%; the success rate of automatic data processing of the system is >99.96%.
-
(3)
Scalability
The system adopts a modular design to achieve seamless integration of newly developed functional modules with existing functions and facilitate functional expansion. The system defines a unified process data interface, which facilitates access to existing information systems and information systems that may be accessed in the future. The system supports the scalability of data storage and can be extended with server clusters to achieve large scale data storage, query and analysis. The system supports scalability of data storage and can be extended with server clusters to realize largescale data storage, query and analysis.
7.2 Main Functions
7.2.1 System Function Development
Develop an intelligent perception and emergency command system for power grid disasters, to achieve grid disaster intelligence perception and emergency site information and visualization command in the absence of information, and effectively improve emergency command efficiency in disaster judgment and operation command. Realize intelligent mobile equipment, background equipment monitoring system, power emergency command system software and hardware integration, with onsite information collection, disaster management, and emergency command. It has the functions of onsite information collection, fusion analysis and prediction of disaster damage information, rapid information reporting, feature identification, remote real-time interactive command and so on. It provides technical support for emergency exercises, training and rescue operations.
The system allows you to view early warning and monitoring information, typhoon monitoring information, heavy rain and flooding information, rain and snow freezing information, earthquake information, landslide information, emergency disposal, work exchange, public information and other modules.
The weather warning information includes weather warning and internal warning, weather warning can be viewed by filtering conditions for 24, 48 and 72 h, and can also be viewed by filtering conditions for different levels of red warning, orange warning, yellow warning and blue warning, and can view the weather warning information of central weather station, provincial weather station, local city weather station and county weather station according to different issuance levels. You can view the weather warning information of central weather station, provincial weather station, local city weather station and county weather station according to different issuance levels; internal warning can view the warning information issued by different company levels, you can view the company headquarters warning, branch warning, provincial company warning, local city company warning and county company warning, you can also statistically display the number of different warning levels of all kinds of warnings, view the number of red warning, orange warning, yellow warning and blue warning of different levels of warnings.
Typhoon monitoring includes typhoon path, satellite cloud map, radar map, sitewide line, disaster express, disaster damage perception, where the typhoon path can view the current typhoon’s real-time path, predicted path, typhoon wind speed, pressure, moving speed and other information, satellite cloud map can view the current satellite cloud map information, superimposed display satellite cloud map to help judge the current typhoon development trend, radar map can view the current situation. The whole site line can display the GIS station line information of the power grid, and the affected situation of substations, lines and users in the station area can be analyzed through the typhoon path and the predicted path, and the disaster damage situation of the typhoon development path can be predicted. The disaster damage perception is divided into disaster damage perception statistics and disaster damage perception details, and the current equipment disaster damage situation is judged intelligently through the images taken by drones.
Storm flooding includes storm damage prediction, satellite cloud map, radar map, sitewide line, disaster express and disaster damage perception, among which storm damage prediction can view the current rainfall area, effective rainfall amount, rainfall disaster probability and other information, satellite cloud map can view the current situation of satellite cloud map information, superimposed display satellite cloud map to help judge the current rainfall development trend, radar map can view the current situation of radar. The whole site line can display the GIS station line information, and the rainfall range and predicted rainfall can analyze the affected situation of substations, lines and station area users. The disaster damage perception is divided into disaster damage perception statistics and disaster damage perception details, and the current equipment damage situation is judged intelligently through the images taken by drones.
Snow and ice includes snowfall damage prediction, satellite cloud map, radar map, full site line, disaster express, disaster damage The snowfall damage forecast can view the current snowfall area, ice thickness, total load rate per unit length The satellite cloud map can view the current situation of satellite cloud information, superimposed display satellite cloud map to assist in judging the current snowfall development trend, radar map. You can view the current snowfall development trend, radar map can view the current situation of the radar map information, superimposed display radar map The whole site line can display the grid GIS station line information, through the snowfall range and predicted snowfall can analyze the impact of substations, lines and station users, and the disaster damage express is divided into information express and danger express. The information report is mainly through the fixed information template to report the current disaster damage information, and the danger. The disaster damage perception is divided into disaster damage perception statistics and disaster damage perception details. The disaster damage perception is divided into disaster damage perception statistics and disaster damage perception details, through the images taken by drones, to intelligently determine the current equipment damage situation.
Earthquake information can be filtered to view the information of 3, 7 and 15 days, and can also be filtered to view the information of earthquakes below 4.0, 4.0 6.0 and above 6.0, and the earthquake express can view the current earthquake area (including latitude and longitude information), forecast equipment damage information (including substation and tower information), satellite cloud map can view the current satellite cloud map information and superimposed satellite cloud map to assist in judging the current weather conditions, and radar map can view the current satellite cloud map information and superimposed radar map to assist in judging the current weather conditions. Satellite cloud map can view the current satellite cloud map information, superimposed on the satellite cloud map to help determine the current weather conditions, radar map can view the current radar map information, superimposed on the radar map to help determine the current weather development trend, the whole site line can display the grid GIS station line information, through the earthquake information can The disaster damage express is divided into information express and danger express, information express is mainly through the fixed information template to report the current disaster damage information, danger express is mainly through the mobile terminal to achieve rapid reporting of onsite danger, disaster damage perception is divided into disaster damage perception statistics and disaster damage perception details, through the disaster damage perception is divided into disaster damage perception statistics and disaster damage perception details, and the current disaster damage of the equipment is judged intelligently by the images taken by the drone.
Landslide disaster includes landslide damage prediction, satellite cloud map, radar map, full site line, disaster express, disaster damage. The landslide damage prediction can view the current rainfall landslide area, landslide disaster probability and other information, and satellite cloud map can view the current satellite cloud map information. Satellite cloud map can view the current satellite cloud map information, superimpose the satellite cloud map to assist in judging the current rainfall development trend and analyze the possibility of landslide, radar map can view the radar map information under the current situation, and superimpose the radar map to help judge the current rainfall. The radar map can view the radar map information under the current situation, superimpose the radar map to assist in judging the current rainfall development trend, and assist in analyzing the landslide situation. The GIS station line information of the power grid can be displayed, and the landslide caused by rainfall can analyze the affected situation of substations, lines and station area users. The disaster damage express is divided into information express and danger express, information express is mainly through the fixed information template to report the current disaster damage information, danger express is divided into information express and danger express. The information report is mainly through the fixed information template to report the current disaster damage information, and the danger express is mainly through the mobile terminal to realize the rapid report of onsite danger. The disaster damage perception is divided into disaster damage perception statistics and disaster damage perception details, and through the images taken by drones, we can intelligently judge the current damage The damage perception is divided into damage perception statistics and damage perception details.
Emergency disposal starts emergency response, carries out emergency disposal, and the system pushes out the division of work of each department to clarify the responsibilities of each department, and be able to view the progress of emergency response, real-time tracking and display of information at various stages such as issuing warning, warning adjustment, starting response, response adjustment, etc. The system combines the “Emergency Response Work Rules for Electricity Emergencies” with the event scenario topic, and automatically pushes the emergency event command system and response flow chart. It makes the staff involved in emergency response have clear knowledge of the command system and response process to ensure that the emergency disposal work is carried out smoothly. For the disposal of emergency events, the system automatically generates the disposal process by combining the emergency plan and departmental disposal plan, automatically pushes the emergency disposal work tasks, and automatically marks the task status according to the completion situation to view the overall progress of the event and the completion of individual tasks.
Emergency communication list for work communication: Automatically create a special event emergency team working group based on the emergency plan, and view contact information. Work communication: Communicate with emergency response personnel at all levels in terms of graphics, text, audio and video work.
The public information module contains public information data sources, public information data classification preview, laws, regulations and rules, emergency related situations, emergency science related knowledge, etc.
7.2.2 System Function Display
Through the business composition of the power grid disaster intelligence perception and emergency command system, and the visualization model to understand the information of all aspects of the system, we design and develop the power grid disaster intelligence perception and emergency command system. Through the visualization model of the information, we design and develop the grid disaster awareness and emergency command system:
-
(1)
Unmanned Aerial Systems
An overview of the operating interface of the UAV backend system is shown in Fig. 7.6.

UAV background system operation interface
The functional architecture of the system is illustrated in Fig. 7.7.

Overall system architecture
A schematic of the system data architecture is shown in Fig. 7.8.

Data Architecture
-
1)
Main head view
It performs real-time monitoring of the current situation in the execution of the flight mission or handheld mobile terminal in the execution of line inspection, and the relevant coordinate positioning and view analysis of the relevant information.
The module realizes the functions of real-time collection of site information, monitoring the status of the UAV body and the site environment. Including flight data such as the altitude of the flight.
-
2)
Map view
The map application module supports distance and area calculation; the profile tool is set up to facilitate users to view the terrain in the field to facilitate the user to view the terrain in the field; to set the photo evidence function to record the latitude and longitude of the photo for the user to take photos in the field to facilitate users to record the walking route in the field and share it with others, we have set up a tool to record the walking track and draw a sketch with the map as the background.
The GPS and GIS geographic technology of transmission line intelligent inspection system includes space, ground and receiving end, with functions of omnipotence, global and all weather positioning, which can accurately locate towers and personnel, record the trajectory of inspection and provide accurate navigation information, while the differential data can also realize the spatial GIS geographic information display. It also provides accurate high-level data calculation and high precision differential data for UAV autonomous cruise. Mainly combined with GIS map data, the 3D location of the transmission line’s towers, ground attachments, and alignment can be edited by means of layers. The topography of the corridor, including the location information and direction of the power grid, as well as the location data such as personnel patrol trajectory and crossover, can be overlaid and presented in the It can also be used for measuring, editing and pointing on the GIS map. The platform monitors in real time the current flight task or handheld mobile terminal in the execution of. The platform can monitor the current flight task or handheld mobile terminal performing line inspection in real time, and perform coordinate positioning and view analysis on the relevant information.
-
3)
HUD control
Dashboard for drone control. Displays the flight parameters, attitude information, and navigation information of the UAV, projected onto the on the perspective mirror directly in front of the operator’s field of view, so that when the pilot maintains a level view, he can take into account the instrumentation in the same field of view parameters and the external visual reference in the same field of view.
-
4)
Flight control
The Fine Patrol module has three patrol types: manual mode, learning mode, and patrol mode. Select manual mode, the UAV is manually controlled by the aviator to shoot the inspection point.
When manual mode is selected, the aviator manually controls the drone to shoot the inspection point; when learning mode is selected, the system will automatically record the latitude and longitude of the shooting point and the gimbal angle after the aviator manually controls the drone to shoot the inspection, which will provide data support for the next automated inspection by the drone.
When selecting the learning mode, import the tower file onto the map, long press any tower icon, click on one button navigation, enter the altitude, and the drone will automatically take off above the selected tower. Click on Start Learning, and the system will start recording the drone’s photo position. After the learning is completed, click End Learning in the lower right corner, after successful learning, the icon of the tower will turn green.
When selecting the inspection mode, click on the one key navigation or automatic inspection after inputting the height, so that the drone automatically flies to the pole tower overhead, or by manually controlling the drone to fly over the tower after the automated inspection. In addition to single base tower automatic inspection, you can also select multiple towers that have been studied together for inspection.
By clicking on “Execute Mission”, the UAV will begin automated inspection operations, which are used in conjunction with RTK.
-
5)
UAV rudder volume information
Show the control information of specific drone rudder amount, including the rudder angle of front and back, left and right, and up and down, left and right rotation.
-
6)
UAV data
This includes information on the GEO safety system for the drone and the apron, as well as monitoring the power usage of the drone and showing the number of nearby satellites and magnetic field strength. Traditional drone inspection is limited by battery life, usually only about 20 min of flight, the drone’s flyer needs to follow the drone synchronized movement, affecting the flight efficiency. For this reason, we have conducted research in two directions, one is to modify the aircraft, mainly in the direction of battery life, and the other is to solve the limitations of relying on personnel. To this end, the “station-station” UAV operation mode was born. The so-called “station-station” refers to connecting the channels between two substations, allowing the drone to fly the entire route, recording the pause points in each route, that is, the GPS position of each tower, issuing instructions for the drone to automatically take photos, and then placing machine nests in the two substations, allowing the drone to automatically return to the nest for charging after flying, and the entire process is automatically completed. Through “station to station” automatic inspection, the constraints of operation and maintenance personnel on site have been liberated, greatly improving the flight efficiency of unmanned aerial vehicles.
-
7)
Background function module division
See Table 7.1 for a list of backend functional modules.
-
a)
Decision Analysis Desk
It display core basic and business data in the form of charts, statistics, summaries, icons, etc., real-time statistics of the number of aerial flights on the day, the number of handheld logins, the length of aerial flight lines, the number of registered towers in place, the mileage of special patrols, the machine patrol operations for the month including operators, the number of aerial flights, the length of lines, the mileage of aerial flights, as well as the number of tree barriers, channels, the number of defects found by fine patrols and the number of treatment; it shows the execution status of tree barriers, channels, human patrols City, human patrol three span, human patrol no-fly zone, temporary refinement patrol and other cycle patrol plan, and you can click to view the implementation of specific lines to complete the degree; it also includes different annual summary analysis of defects, special file statistics, bird’s nest thematic map.
-
b)
3D visualization
Mainly combined with GIS map data, can be edited by way of layers, the transmission line tower 3D location, ground attachment, corridor topography, including power grid location information, direction, and personnel inspection track, crossover and other location data overlay presentation, and can be measured on the GIS map, editing, point selection function, but also can open the flight monitoring and human patrol monitoring, platform real-time The platform monitors the current situation of executing flight tasks or handheld mobile terminals in executing line inspection, and performs coordinate positioning and view analysis of relevant information.
-
c)
Plan task management
Plan management is the source of promoting the whole operation and maintenance work, and the difference of the line condition determines the need to develop different plan strategies for the line. Plan task management requires flexible customization of various plan tasks, including periodic inspection tasks, detection tasks, special operation mode inspection tasks, and operation tasks during the power supply period. It can also track the execution of the entire plan, provide timely warnings and reminders, and manage the completion of inspection in detail, supervise the operation and maintenance control work of each team.
-
d)
Machine patrol results management
Management of all UAV data generated a series of results, including channel defects, refinement defects, tree barrier defects; panoramic map, 2D images, 3D images, tower gear distance profile and flight history browsing and other functional modules; uploaded 2D images and 3D images can be displayed in the 3D visualization, and the specific results can be converted into report data functions, as well as 2D and 3D image management and defect data sources formed.
-
e)
Man patrol result management
Collect all daily frontend data sources, including temporary notification, human patrol defect records, project data management, special file management of external breakage, crossover information update, inspection data management, personnel in place records, track management, online terminal situation and other information, and can facilitate managers to instantly view real-time data, statistical analysis of personnel work, results export and other functions.
-
f)
Defect management
Summarize all defect hidden danger records, confirm and grade defects based on defect standards. The defect level is classified into three categories: general, serious, and critical. The defect system support to achieve the front-end defects verification, modification, deletion, and other operations. At the same time, the defect library is available to satisfy the requirement of filtering, exportation, analyzation, and statistics according to certain filtering conditions.
-
g)
Grid resource management
Management of all line towers, conductors, insulators, fixtures, ancillary facilities, cables, crossover accounts, places of ownership, district power supply office, tower location, parameters, photos, history, grid resources should be easy to manage, timely synchronization, accurate visual characteristics. The grid resources should be easy to manage, timely synchronization, accurate visualization and other characteristics.
-
h)
Equipment management
Manage all drones and patrol terminals, intelligent devices, etc. in the transmission center, including the model, acquisition time, equipment management personnel, management team, positioning of the device, maintenance records, etc.
-
i)
Statistical Management
Customized export of various results and table data, allowing for free selection of filtering conditions and customized output of results, facilitating management personnel to view statistical analysis.
-
j)
Permission Management and System Management
This module is the configuration portal for all users, permissions, departments and roles, and also manages data dictionaries, system parameters, wire types, defect libraries, hidden danger libraries and cross libraries. system parameters, conductor type, defect library, hidden danger library, cross library, also can view login log, operation log, system exceptions, and monitor server resources.
-
(2)
UAV intelligent inspection system architecture
The UAV can carry specific equipment according to the different inspection tasks, and can also carry visible light, infrared thermal imager, ultraviolet imager, laser and electromagnetic detection equipment at the same time to conduct a comprehensive inspection of the substation. In the inspection process of the tower, you can choose to carry only video and photo equipment, and the drone with autonomous flight capability flies according to the automatically generated road force, during which it takes photos and records videos to obtain information about the surrounding environment and the power tower, and transmits pictures back to the ground station in real time, and then analyzes the pictures through manual recognition or machine learning methods to determine which components have safety hazards and dispatches and the staff will be dispatched in time to eliminate them. Multirotor drones are used in the inspection of towers and substations because of their flexible mobility and hovering. Among them, the schematic diagram of the intelligent inspection system of substation drones is shown in Fig. 7.9.

Substation UAV intelligent inspection system schematic diagram
With the deeper application of robotics in substations, more robots of different functional types will be involved in various tasks of substations. Multirobot collaboration can not only cope with complex and changing application scenarios, but also efficiently integrate existing resources, give full play to the advantages of various robots, reduce development costs, and shorten the time from R&D to application. In order to ensure that each robot can complete its own division of labor in an accurate and orderly manner, a unified multirobot joint management platform needs to be established. All robots are managed and data interacted with one statistical platform, so that robots involved in the same task use completely centralized motion planning, i.e., a centralized planner plans the motions of all robots so that the motions between them do not interfere with each other, and thus a deep learning-based architecture for intelligent inspection systems for drones can be established, as shown in Fig. 7.10.

Deep learning based UAV intelligent inspection system architecture
At present, the automatic inspection function of the drone has been completed, and the flight route waypoints can be marked on the GIS map. The UAV can carry out automatic inspection of transmission lines according to the preset routes and carry out rapid disaster damage identification, and has now achieved real-time image, video and drone parameters are transmitted back to the frontend page, and the drone can remotely carry out line inspection tasks. The gimbal control and visible light/infrared light lens switching can be carried out remotely for the drone carrying out inspection tasks, as shown in Fig. 7.11.

Automatic inspection by drone
-
(3)
UAV disaster damage detection intelligent analysis system architecture
The UAV inspection + AI intelligent processing program is a fully automated solution, providing one-stop service from the frontend UAV flying patrol to the backend AI identification. This solution combines artificial intelligence technology with power patrol business through conceptual innovation, and empowers traditional industry through AI to enhance new industrial dynamics; followed by technological innovation, which introduces migration learning into the algorithm framework and target identification framework for fault determination to improve accuracy, and through continuous implementation on the ground, the accumulation of image data from flying patrol, after cleaning and processing, forms effective data assets.
As the name suggests, transfer learning is to transfer the model parameters that have been learned and trained to the new model to help train the new model. Considering that most of the data or tasks are correlated, transfer learning can share the learned model parameters (which can also be interpreted as the knowledge learned by the model) to the new model in Ḁ a way to speed up and optimize the learning efficiency of the model without starting from scratch, as most networks do. (starting from scratch, tabula rasa).
Adopting B/S architecture to integrate the monitoring backend of spring cloud microservice system, which is in line with the development trend of information construction of national network and can be easily extended to the system. It is easy to expand the system to cope with the demand of big data and concurrency. The project is simple and lightweight to deploy, and can collect and analyze the disaster damage data of each provincial network quickly. It can provide powerful data support for disaster relief and anti-disaster Support.
In the field of UAV grid patrol, it can make full use of the massive data accumulated in other fields and the models already built to reduce the preliminary workload and difficulty. Firstly, AI modeling is carried out through massive source data (e.g., pictures of wire extraction on power lines), and the faster RCNN network is used to generate the original data model. The original data model is combined with the wire extraction characteristics of the power grid, and the target data model is generated by migration learning algorithm.as shown in Fig. 7.12.

Objective data model for automatic identification and detection of the drawing image of the wire to be detected
-
(4)
Early warning monitoring includes weather warning and internal warning
-
1)
Weather warning can view various kinds of weather warning information in different time periods of 24, 48, and 72 h by filtering conditions, and can also view different levels of red warning, orange warning, yellow warning, and blue warning by filtering conditions, and can view weather warning information of central weather station, provincial weather station, local city weather station, and county weather station according to different issuance levels. As shown in Fig. 7.13.
Fig. 7.13 
Systematic weather warning
-
2)
Internal warning can view the warning information issued by different company levels, and can view the company headquarters warning, branch warning, provincial company warning, municipal company warning, county company warning, etc. You can view the warning information issued by different company levels, including headquarters warning, branch warning, provincial company warning, local and municipal company warning, county company warning, and also can statistically display the number of different warning levels. The number of warnings of different levels can be displayed statistically, and the number of warnings of different levels of red, orange, yellow and blue warnings can be viewed. The number of warnings of different levels can be displayed. As shown in Fig. 7.14.
Fig. 7.14 
System internal warning


-
(5)
Typhoon monitoring includes typhoon path, satellite cloud map, radar map, full site line, disaster express, disaster damage perception.
-
1)
Typhoon path can view the real-time path and forecast path of the current typhoon, typhoon wind speed, pressure, moving speed and other information, satellite cloud map can view the current satellite cloud map information, radar map can view the current radar map information; as shown in Fig. 7.15.
Fig. 7.15 
Systematic typhoon path
-
2)
The whole website can display the GIS station line information of the power grid, and through the typhoon passing path and the predicted path can analyze the affected situation of substations, lines and station users, and can predict the disaster damage in the path of typhoon development; This is shown in Fig. 7.16.
Fig. 7.16 
Typhoon disaster full site line map
-
3)
Disaster Express is divided into Information Express and Danger Express, with Information Express mainly reporting current disaster information through fixed information templates and Danger Express mainly realizing rapid reporting of onsite danger through mobile terminal; as shown in Fig. 7.17.
Fig. 7.17 
Typhoon damage express simulation
-
4)
Disaster damage perception is divided into disaster damage perception statistics and disaster damage perception details, and through the images captured by drones, the current equipment’s disaster damage situation is intelligently judged. As shown in Fig. 7.18.
Fig. 7.18 
Typhoon damage perception
-
(6)
Storm flooding includes storm damage prediction, satellite cloud map, radar map, full site line, disaster express, and Disaster damage perception.
-
1)
Storm damage prediction can view the current rainfall area, effective rainfall amount, rainfall disaster probability and other information, satellite cloud map can view the satellite cloud map information in the current situation, and radar map can view the radar map information in the current situation; as shown in Fig. 7.19.
Fig. 7.19 
Systematic storm flooding map
-
2)
The whole site line can display the information of the grid GIS station line, and the affected situation of substations, lines and station area users can be analyzed by the rainfall range and predicted rainfall; as shown in Fig. 7.20.
Fig. 7.20 
Stormwater full site line map
-
3)
Information Express mainly reports current disaster damage information through a fixed information template, and Danger Express mainly through the mobile terminal to achieve rapid reporting of onsite danger, and disaster damage perception through the images taken by drones. The damage perception uses the images taken by the UAV to intelligently determine the current damage situation of the equipment. As shown in Fig. 7.21.
Fig. 7.21 
Stormwater information snapshot
-
(7)
Rain, snow and ice includes snowfall damage prediction, satellite cloud map, radar map, full site line, disaster express, and disaster damage perception.
-
1)
Snowfall damage prediction can view the current snowfall area, ice thickness, total load rate per unit length and other information. The satellite cloud map can view the current satellite cloud map information, and the radar map can view the current radar map information. The satellite cloud map can view the current situation of the satellite cloud map information, radar map can view the current situation of the radar map information; as shown in Fig. 7.22.
Fig. 7.22 
System rain, snow and ice map
-
2)
The entire site line can display GIS station line information of the power grid, and analyze the impact of substations, lines, and users in the substation area through the snowfall range and predicted snowfall conditions;; as shown in Fig. 7.23.
Fig. 7.23 
Rain and snow freeze full site line map
-
3)
Disaster Express is divided into Information Express and Danger Express. Information express mainly reports the current disaster damage information through fixed information templates. Dangerous situation express mainly realizes the rapid submission of on-site dangerous situations through mobile devices. Disaster damage perception is divided into disaster loss perception statistics and disaster loss perception details. Through the images captured by drones, the current equipment’s disaster damage situation is intelligently judged. As shown in Fig. 7.24.
Fig. 7.24 
Rain, snow and ice danger express
-
(8)
Earthquake information can be viewed by filtering conditions for 3 days, 7 days, 15 days, and 4.0, 4.0 6.0, 6.0 or above. The radar map can view the radar map information under the current situation, and overlay the radar map to assist in judging the current weather trend. The development trend is shown in Fig. 7.25.
Fig. 7.25 
System seismic information diagram


The whole website line can display the information of the power grid GIS station line, and the earthquake information can analyze the substation, line, and the disaster damage express is divided into information express and danger express. Information express mainly reports current disaster loss information through fixed information templates, and danger express mainly achieves rapid reporting of on-site danger through mobile devices. Disaster loss perception is divided into disaster loss perception statistics and disaster loss perception details, intelligent judgment of current equipment damage through drone captured images. As shown in Fig. 7.26.

Seismic hazard full site line map
-
(9)
Landslide hazards include landslide damage prediction, satellite cloud map, radar map, full site line, disaster situation express delivery, and disaster perception.
-
1)
Landslide damage prediction can view the current rainfall landslide area, landslide disaster probability and other information. Satellite cloud satellite cloud map can view the current satellite cloud map information, superimpose the satellite cloud map to help judge the current rainfall development. The satellite cloud map can view the information of satellite cloud map under the current situation, and superimpose the satellite cloud map to help judge the current rainfall development trend and analyze the possibility of landslide. The radar map can view the radar map information under the current situation, superimpose the radar map to assist in judging the current rainfall development trend, and assist in analyzing the landslide situation; as shown in Fig. 7.27.
Fig. 7.27 
Systematic landslide hazard map
-
2)
The whole site line can display the information of the GIS station line of the power grid, and analyze the impact of landslides caused by rainfall on substations, lines, and users in the substation area. Disaster loss delivery is divided into information express and dangerous situation express. Information express mainly submits current disaster loss information through fixed information templates, and dangerous situation express mainly achieves rapid on-site reporting of dangerous situations through mobile devices. The disaster damage perception is divided into disaster damage perception statistics and disaster damage perception details, and the current disaster damage of the equipment is judged intelligently by the images taken by the UAV. As shown in Fig. 7.28.
Fig. 7.28 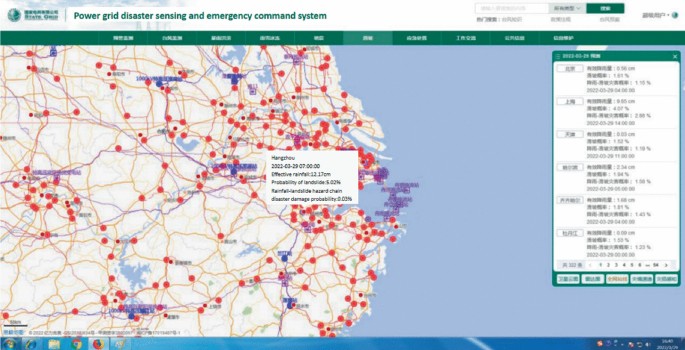
Landslide hazard sitewide map simulation


-
(10)
Emergency response is initiated, emergency response is carried out, and the system pushes the work division of each department to clarify their responsibilities.
-
1)
View the progress of the emergency response, the release of early warning, warning adjustment, start response, response adjustment and other stages. The information is tracked in real time. As shown in Fig. 7.29.
Fig. 7.29 
System emergency response diagram
-
2)
By combining map display, it is possible to view the emergency response situation of relevant key units and areas, as well as real-time information on personnel positions, to ensure the smooth progress of emergency response work. As shown in Fig. 7.30.
Fig. 7.30 
Emergency response map display
-
3)
By combining map display, you can view the location and affiliated unit information of the emergency warehouse, and view various emergency resource related information through the emergency warehouse. As shown in Fig. 7.31.
Fig. 7.31 
Emergency warehouse map display
-
4)
Through the emergency team data access, you can view the location information, personnel and professional information of the emergency team in real time through the system. information, professional information, etc., to conduct the deployment and command of emergency teams and assist in emergency disposal work. As shown in Fig. 7.32.
Fig. 7.32 
Emergency team map display
-
5)
Through the emergency vehicle data access, you can view the location information, license plate number information, vehicle type information and unit information of the emergency vehicles in real time through the system, and conduct the deployment command of the emergency vehicles to assist the emergency response. As shown in Fig. 7.33.
Fig. 7.33 
Emergency vehicle map display
-
6)
Through the system’s disaster damage statistics function, you can view the disaster damage situation of each unit of the power grid facilities. The system’s disaster damage statistics function allows you to view the disaster damage situation of each unit, either by unit or by category, in the form of pie charts or bar charts for visual display. The pie chart or bar chart can be used to visualize the damage situation. This is shown in Fig. 7.34.
Fig. 7.34 
Disaster damage statistics chart display
-
7)
Disposal measures are recommended, and the system combines the loss of equipment and facilities caused by current disasters and future disasters development trend, predict disaster loss, and give suggestions on response plans, and demand for emergency resource allocation and preset the disposal plan to assist the emergency command work. This is shown in Fig. 7.35.
Fig. 7.35 
Disposal measures proposed display


-
(11)
Work exchange emergency communication: automatically create special event emergency team work groups according to the emergency plan and view contact information. Work communication: communicate with relevant personnel at all levels of emergency response with graphic work. As shown in Fig. 7.36.
Fig. 7.36 
System working communication diagram
-
(12)
Internal and external information collection and integration. The system integrates GIS data information of power grid, completes data and information collection through mobile terminals such as drones, uses special data interface to import public warning information, and obtains laws, regulations and rules, emergencies and emergency science related knowledge from public network information, collects and integrates internal and external information, and completes disaster damage prediction and auxiliary plan generation of power grid facilities.
-
1)
Integrate internal grid GIS data information to view substation and line information of each voltage level to lay the foundation for disaster loss prediction of power grid facilities, as shown in Fig. 7.37.
Fig. 7.37 
Grid GIS sitewide map
-
2)
UAV collection data access, the use of drones for disaster damage data collection, the collection of data into the system. Through the footage captured by the drone, the current disaster damage of the equipment is intelligently determined. As shown in Fig. 7.38.
Fig. 7.38 
UAV acquisition data access
-
3)
Public information access, public information module contains public information data sources, public information data classification preview, laws, regulations and rules, emergency related situations and emergency science and technology related knowledge, etc. Through public information access, the auxiliary decision-making function is realized. As shown in Fig. 7.39.
Fig. 7.39 
System public information diagram


7.3 System Application Examples
After the development of the basic functions of the system is completed, various types of data are accessed and the pilot application of the system functions is carried out in the trial environment. A typical typhoon disaster is selected for the pilot application of the system functions, taking Typhoon No. 6 of 2021, the fireworks, as an example, for the trial example of the grid disaster intelligence sensing and emergency command system. Firstly, it is the preliminary preparation stage, which mainly involves the follow-up and early warning release of typhoon disasters by the system during the period from typhoon generation to typhoon landing. The second stage is the disaster damage perception stage, which uses drones to quickly collect and analyze the damage caused by typhoon disasters, achieving rapid and intelligent perception of power grid disasters, and preparing for emergency command. The third stage is the emergency command stage, where various disaster damage information collected and analyzed by drones is combined with the special emergency plan and on-site disposal plan for typhoon disasters to carry out emergency response work, providing auxiliary support for the emergency response of the power grid against typhoon.
-
(1)
Preliminary preparation stage
A tropical cyclone was generated in the Pacific Ocean on July 18, 2021, and was named “Fireworks” after it intensified into a tropical storm, with the number 202106. The information of the current active typhoon, satellite cloud map, radar map and weather forecast are monitored in real time. The results are shown in Figs. 7.40 and 7.41.

Typhoon information display

Typhoon satellite cloud map
The system continuously tracks typhoon information and issues internal warnings according to the warning issuance rules. After the internal warnings are issued, it will combine with the typhoon special emergency plan to guide the warning action, and the system effect is shown in Figs. 7.42 and 7.43.

Internal alert release

Early warning action guidance
-
(2)
Damage perception stage
According to the predicted path of typhoon and the real path, by docking the GIS station line information, the disaster damage of typhoon passing through the path can be predicted, as well as the real disaster damage information can quickly realize the intelligent perception of the disaster situation of the power grid. The analysis of the impact of typhoon fireworks on the station line is shown in Fig. 7.44.

Typhoon impact station line map
When the disaster occurs, the rapid reporting of onsite disaster damage information can be carried out through the disaster damage express function of the system, and the rapid collection and online analysis of disaster damage can also be carried out through UAV, the information express report submits the current disaster damage information through the fixed information template, and the rapid reporting of the onsite danger through the mobile terminal. This is shown in Fig. 7.45.

Typhoon damage express application
The system’s disaster awareness analysis is mainly disaster awareness statistics and disaster awareness details, and the current equipment's disaster damage is intelligently judged by the images taken by the UAV. As shown in Fig. 7.46.

Typhoon damage perception analysis
-
(3)
Emergency command stage
After completing the disaster prediction analysis and real-time perception of disaster damage through the system, the work related to emergency disposal needs to be carried out. In the emergency response stage, according to the company’s response initiation rules, the system can automatically generate the command system and response flow chart related to typhoon disaster emergency disposal, and the work responsibilities of each process of each department in the command system can be clearly viewed according to the relevant regulations, and the system functions are shown in Fig. 7.47.

Typhoon emergency command system diagram
In the emergency command stage, combined with the typhoon disaster special emergency plan and onsite disposal plan, the work tasks related to the digital plan can be generated, in different stages of different links, according to the special emergency plan and onsite disposal plan, the relevant emergency disposal measures can be accurately pushed to the relevant personnel in real time, and the staff of each department can carry out emergency disposal related work according to the action instructions, the system effect The effect of the system is shown in Fig. 7.48.

Typhoon emergency response
In the process of emergency response, it is necessary to continuously gather all kinds of public information and professional information, and make work communication and work adjustment through analysis and judgment. The public information mainly includes laws, regulations and rules, emergency situation and knowledge about emergency science and technology as shown in Fig. 7.49; the system interface of each staff for work communication is shown in Fig. 7.50.

Comprehensive information display for emergency response

Emergency response work communication
Author information
Authors and Affiliations
Corresponding author
Rights and permissions
Open Access This chapter is licensed under the terms of the Creative Commons Attribution 4.0 International License (http://creativecommons.org/licenses/by/4.0/), which permits use, sharing, adaptation, distribution and reproduction in any medium or format, as long as you give appropriate credit to the original author(s) and the source, provide a link to the Creative Commons license and indicate if changes were made.
The images or other third party material in this chapter are included in the chapter's Creative Commons license, unless indicated otherwise in a credit line to the material. If material is not included in the chapter's Creative Commons license and your intended use is not permitted by statutory regulation or exceeds the permitted use, you will need to obtain permission directly from the copyright holder.
Copyright information
© 2024 The Author(s)
About this chapter

Cite this chapter
Yu, Z., Feng, J., Tang, S., Liu, Z., Yan, Y., Luo, N. (2024). Intelligent Sensing and Emergency Command System for Power Grid Disasters. In: Disaster Intelligent Perception and Emergency Command of Power Grid. Springer, Singapore. https://doi.org/10.1007/978-981-99-7236-4_7
Download citation
DOI: https://doi.org/10.1007/978-981-99-7236-4_7
Published:
Publisher Name: Springer, Singapore
Print ISBN: 978-981-99-7235-7
Online ISBN: 978-981-99-7236-4
eBook Packages: EnergyEnergy (R0)