
Abstract
In recent years, a large number of users continuously suffer from DDoS attacks. DDoS attack volume is on the rise and the scale of botnets is also getting larger. Many security organizations began to use data-driven approaches to investigate gangs and groups beneath DDoS attack behaviors, trying to unveil the facts and intentions of DDoS gangs. In this paper, DDoSAGD - a DDoS Attack Group Discovery framework is proposed to help gang recognition and situation awareness. A heterogeneous graph is constructed from botnet control message and relative threat intelligence data, and a meta path-based similarity measurement is set up to calculate relevance between C2 servers. Then two graph mining measures are combined to build up our hierarchical attack group discovery workflow, which can output attack groups with both behavior-based similarity and evidence-based relevance. Finally, the experimental results demonstrate that the designed models are promising in terms of recognition of attack groups, and evolution process of different attack groups is also illustrated.
You have full access to this open access chapter, Download conference paper PDF
Keywords
1 Introduction
Among many network attack methods, DDoS (Distributed Denial of Service) has always been regarded as the effective weapon of hacker attacks due to its low attack threshold and high damage. Compared with other attack methods, the technical requirements and cost in launching an attack of DDoS are very low. In the past three years, the situation of DDoS attacks is still grim. In late February 2018, the world-renowned open source project hosting site GitHub suffered a DDoS attack with a peak value of 1.35 Tbps, which has reached a record high, marking the official entry of the DDoS attacks into Tb level. Super-large DDoS attacks have been increasing steadily year by year after a sharp increase in 2018. The ultra-large-scale attacks above 300 Gbps in 2019 increased by more than 200 times as compared with 2018 [1]. Botnets and Internet of Things are hot words for DDoS attacks in recent years. The active botnet family is further concentrated on the IoT platform, which mainly includes Gafgyt and Mirai. DDoS attacks have also become one of the important methods for attackers to use IoT devices.
At the same time, with the rise of big data technology and threat intelligence, many security agencies began to use data-driven methods to mine the gang behaviors behind DDoS attacks. NSFOCUS has found 60 DDoS gangs in 2019, and up to 15 gangs have attack resources of greater than 1000, and the largest attack gang contains 88,000. The highest proportion of IoT devices in a single gang of DDoS gangs reaches 31% [1]. An in-depth analysis on gang behaviors in network security data is also made in 2018 Active DDoS Attack Gang Analysis Report [2] and 2018 Website Attack Situation and “Attack Gang” Mining Analysis Report [3] released in 2018 by Cncert. The gang analysis behind DDoS can help regulators and security researchers understand the attack trends and the overall situation.
In this article, DDoS gangs are analyzed based on control instruction propagation logs and threat intelligence data of a botnet. Articles with similar goal of this article include Zhu Tian’s group analysis of DDoS based on network attack accompanying behavior [5], and Application of community algorithm based on malicious code propagation log by Wang Qinqin [6], and IP Chain-Gang analysis by NSFOCUS based on DDoS logs [4, 7]. Existing DDOS gang analysis mostly focuses on the behaviors of attacking resources, searching for communities in big data. Gang analysis based on the behaviors of attacking resources has two disadvantages. The first is the detection accuracy of the attack behavior data. DDoS is always accompanied by normal user behaviors with high traffic, while some of them are very hard to be distinguished. The second is the problem of unity of data. The gang analysis based on the behavior of attacking resources usually originates from large-scale behavior similarities and community structure of attacking resources, lacking the correlation of small scale but strong evidences. Therefore, for the purpose of uncovering attack gangs, it is necessary to not only perform clustering at the behavior level, but also combine the control messages of the attack resources and related samples/domain names.
This article presents a DDoS attack group discovery framework based on complex graphs. Entities and relations are extracted from botnet control messages and threat intelligence data of a botnet, and the constructed underlying heterogeneous graph contains a DDoS behavior relationship and an intelligence association relationship. Then the control end is taken as the key entity, to set a series of meta paths, establish the similarity relationship between the control ends, and form a homomorphic graph with the control end as the node and the similarity as the relationship. Finally, the DDoS gang is calculated through the hierarchical community algorithm.
The main contributions of this article are as follows:
-
This paper proposed a heterogeneous graph construction method based on control instruction logs and threat intelligence data of a botnet, fused behavioral relations and intelligence association relations, and constructed the underlying graph.
-
This article proposed a meta path-based similarity graph construction method with the control end as the core. At the same time, the hierarchical similarity interval can ensure that the subsequent group discovery can distinguish the scale similarity from the evidence/intelligence similarity.
-
This article proposed a hierarchical DDoS attack gang discovery method, and in combination with the advantage of Louvain algorithm for mining community structure and the advantage of Connected Component for mining strong evidence relationship, this article obtained a more complete gang structure, and retained the results of hierarchical community analysis to assist in security operations.
The structure of this article is as follows: Sect. 1 is the introduction, introducing related work and main research ideas; Sect. 2 is a technical route and data background, introducing workflow and data overview; Sect. 3 is a detailed elaboration of the DDoS attack group discovery framework; and Sect. 4 is the experimental results, introducing research results and cases.
2 Methodology and Background
The dataset of this paper is the botnet control message logs from January 2018 to December 2019. The botnet control message logs contain a C2 (Command & Control) server, a C2 family, a bot list, attack target information and attack time. Botnet refers to the use of one or more propagation methods to infect a large number of hosts with bot virus, thus forming a one-to-many control network between the controller and infected hosts. Botnets rely on large-scale DDoS attacks or bitcoin mining for profit. This paper only focuses on DDoS attacks in botnets.
The preparation of the dataset consists of three modules, including data import, threat intelligence correlation and data storage/calculation.
Data Import:
The dataset used in this paper originates from the evaluation dataset provided by the National Computer Network Emergency Technology Processing and Coordination Center (CNCERT/CC).
Threat Intelligence Correlation:
In this step, network entities are extracted from botnet control messages, and related intelligence information, including related domain names and related samples, is queried from various external intelligence sources and data sources.
Data Storage/Calculation:
Hadoop is used to store the large-scale sample data, and Spark is used for calculation.
Data Overview:
The test dataset contains 3005888 botnet controlling messages of 5225 C2 servers. The monthly trend of botnet controlling messages is shown in Fig. 1 and the distribution of active months among C2 servers is shown in Table 1. C2 servers cover 34 botnet families. The top three botnet families are DDoS.Linux.Gafgyt, DDoS.Linux.BillGates and DDoS.Linux.Xorddos. The active period of C2 servers can reach a maximum of 20 months and a minimum of less than 1 month, with an average active time of 1.4 months.

Monthly trend of botnet control messages
3 DDoSAGD – DDoS Attack Group Discovery Framework
In this paper, the DDoS Attack Group Discovery (DDoSAGD) Framework is developed to unveil DDoS attack groups with behavior-based similarity and evidence-based relevance from DDoS attack logs and threat intelligence data. The DDoSAGD framework provides principles and practices for attack group discovery, including three phases: heterogeneous graph data modeling, relevance measurement, and community detection.
3.1 Basic Concepts and Fundamental Graph Initialization
In this section, the construction details of the graph model are introduced and the relevant definitions are clarified.
Definition 1 DDoS Attack Group:
The core of a DDoS attack group is C2 servers. Bots and other attack resources are related to C2 servers. The C2 server set is the most critical part of a DDoS attack group.
Graphs are used to represent the interactions among different entities in the real world. In this paper, we regard the network entities, such as C2 servers, victim IP addresses, bots in DDoS attacks as nodes in the graph. Those nodes are extracted from the behavior logs or related intelligence. We assign each node/entity with a globally unique identifier (ID) and attach attributes to them. Moreover, we divide the entities into the following two categories.
Definition 2 Critical Entity:
Critical entities are core members in an attack scenario. Specifically, the critical entities in the DDoS attack scenario are C2 servers.
Definition 3 Associated Entity:
Associated entities are related to critical entities. In the DDoS scenario, C2 servers are critical entities while bots, victim targets and related domains are all associated entities.
Table 2 lists entities involved in the DDoS scenario. To be specific, the ‘EVENT’ entities are extracted according to attack targets and time characteristics. Within an empirical attack cycle, which is usually no longer than 24 h, an ‘event’ refers to a DDoS attack launched by a bunch of Internet resources aiming at a certain victim. It is noted that, if that victim is attacked by the same cluster of resources after more than 24 h from the last attack, it will be regarded as another event.
We extract three different types of relations among these entities, namely, behavioral relations, associated relations and correlated relations.
Definition 4 Behavioral Relation:
Behavioral relations are extracted from behavior logs or alerts and can represent the attacks or communications between entities.
Definition 5 Associated Relation:
Associated relations are extracted from external intelligence or knowledge base and can represent the affiliation or usage relations between entities. Such relations are often related to knowledge, rather than behaviors.
The two relations above construct a heterogeneous graph in DDoS attack scenario. For further analysis on similarity, correlated relations are defined to calculate the similarity among entities of the same type.
Definition 6 Correlated Relation:
Correlated relations depict the relevance of a pair of entities with the same type. Relevance measurement comes from comparative analysis on behavioral relations, association relations and attributes between a pair of entities with the same type.
3.2 Meta Path-Based Similarity Framework
The main task of DDoS attack group discovery is to cluster the critical entities based on correlated relations. Specifically, the correlated relation between two entities is calculated through meta path-based similarity in the heterogeneous graph. Table 3 lists the heterogeneous relations, including behavioral relations and associated relations in the heterogeneous graph model constructed for the DDoS attack scenario.
Correlated Relations Based on Meta Path (C2-C2@SIM[Associated Entity]).
Considering the multi-hop similarity theory, a certain entity can have 1-hop neighbors, 2-hop neighbors and even n-hop neighbors in a graph. Figure 2 shows an example of k-hop neighbors. In this figure, the orange circle represents an entity, the green ones represents the 1-hop neighbors, the blue ones represent the 2-hop neighbors and the purple ones represent the 3-hop neighbors. This theory can be applied to the DDoS attack scenario to extract multidimensional correlated relations between C2 servers.

Multi-hop in graph (Color figure online)
The correlated relations are illuminated in Fig. 3 and Table 4. For example, C2-C2@SIM[DOMAIN] represents the correlated relation between a C2 server and its 2-hop neighbors based on the associated domains while C2-C2@SIM[MD5] represents the correlated relation between a C2 server and its 3-hop neighbors, which is based on the similarity of the associated MD5 samples. Finally, C2-C2@SIM[PDB] represents the correlated relation between a C2 server and its 4-hop neighbors. This relation is based on two types of associated relations, that is, malware samples associated to C2 servers and the PDB paths associated to MD5 samples.

Multi-hop in DDoS attack
We determine whether two critical entities belong to the same attack group according to these nine correlated relations. Specifically, given two C2 servers C2_1 and C2_2 with a kind of associated entity A, A_set1 and A_set2 are subsets of A, which contain all the associated Class A entities of C2_1 and C2_2 respectively. As shown in Eq. 1, suppose that a correlated relation exists between C2_1 and C2_2 based on Class A entity if the number of Class A entities related to both C2 servers is greater than \( n \), or the Jaccard similarity is greater than t. It is noted that C2-C2@SIM[A] is a Boolean variable, where the true value represents that the two C2 servers are relevant while the false value represents that they are irrelevant.
Similarity of C2s(C2-C2@SIM).
We utilize the attention mechanism to aggregate the multi-dimensional correlated relations, since different types of relations are not equally important when the similarity between C2 servers is calculated. According to Eq. 3, \( \omega_{\text{e}} \) is weight of \( C2 \text{-} C2@SIM\left[ {A_{\text{e}} } \right] \), and a homogeneous graph can be constructed for the following community detection and DDoS attack group discovery. Figure 4 shows the process of similarity construction.

Similarity calculation of C2s
Considering that more relations may exist beyond those listed in Table 3 and Table 4, our following group discovery framework is designed to be extensible, so that users can add or remove relations to customize the system.
3.3 Hierarchical Community Discovery
Considering the goal of DDoS attack graph discovery, we aim to find groups with several characteristics:
-
Behavior-based similarity: Attackers in a specific group should have similarity in their large-scale attack behaviors, for instance, in a certain time period, bots should be controlled by the same set of C2 servers, bots or C2 servers should participate in the same set of attack events. Behavioral similarity is adopted to measure whether the entities in a specific group may have the same temporary goal beneath their attacks. Only entities with behavioral similarities above threshold will be considered into the same group.
-
Evidence-based relevance: Unlike behavior-based similarity from large-scale attacks or connections, evidence-based relevance is built to extract relevance from small-scale relations with high confidence. For example, in a certain time period, two C2 servers are both resolved by the same domain names, or both have network connections from the same malware samples or malware samples with a high similarity. Evidence-based relevance may appear in small scales, but they should not be neglected in our grouping strategy, due to the fact that they are strong evidence of same attack resources and attacking methods.
Fig. 5. 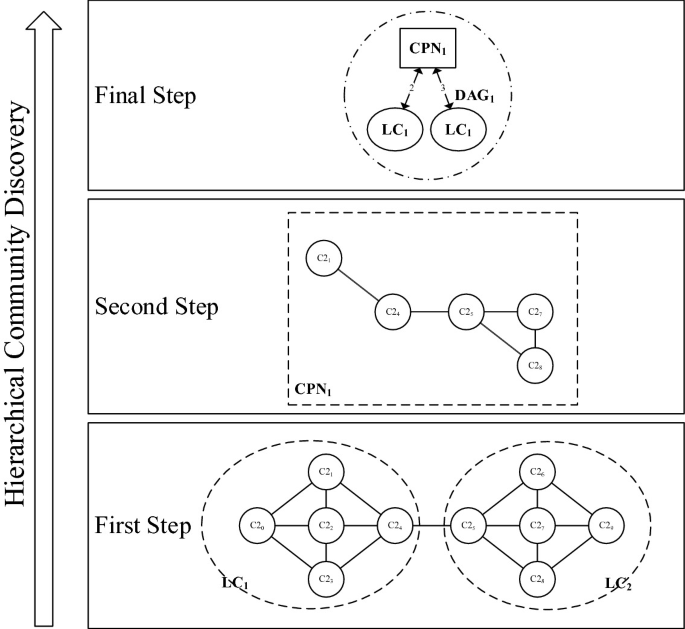
Hierarchical community discovery workflow.

Hence, we need to establish a community detection workflow to capture closeness from behavior and evidence. Meanwhile, similarity connections between C2 servers build up a large weighted correlated graph, and time-efficiency should be taken into good consideration. Various unsupervised learning techniques are available for community detection, but none of them can capture large-scale behavior closeness and small-scale strong relevance at the same time. A 3-step workflow is set up to accomplish our attack group discovery, as shown in Fig. 5.
First, we choose to use the Louvain method to discover groups in C2 servers from their behavior similarity, considering Louvain’s efficient handling of large networks. In this step, Louvain [9] will output community results with the best modularity.
Second, we run Connected Component Algorithm [10] on the super graph of C2 vertices connected by strong evidence. As a result, the super graph will be spitted in to several components, in which any two vertices are connected to each other by paths, and which is connected to no additional vertices in the super graph.
Last, we merge overlapping Louvain’s communities and Connected Component’s component result. A community and a component will be merged into a DAG group if they both have the same C2 vertices. Each final DAG group consists of a set of C2 vertices.
This workflow will be illustrated in detail below:
First Step: Louvain.
The Louvain algorithm was proposed in 2008, which is one of the fastest modularity-based algorithms and works well with large graphs. Modularity is defined as follows:
Modularity Q [9] has a value between −1 and 1, which measures the quality of relation density within communities. \( A_{ij} \) represents the weight of the edge between \( i \) and \( j \), \( k_{i} = \mathop \sum \nolimits_{j} A_{ij} \) is the sum of the weights of the edges attached to vertex \( i \), \( c_{i} \) is the community to which vertex \( i \) is assigned, the \( \delta \)-function \( \delta \left( {u,v} \right) \) is 1 if \( u = v \) and 0 otherwise and \( m = \frac{1}{2}\mathop \sum \nolimits_{ij} A_{ij} \).
The method consists of repeated applications of two steps. At the beginning, each node of the graph is considered as a community. The first phase is a repeated and sequential assignment of nodes to their neighbor communities, favoring local optimizations of modularity score, until no further improvement can be achieved. The second phase is the definition of a new coarse-grained network based on the communities found in the first phase. These two phases are repeated until no further modularity-increasing reassignments of communities are possible.
At the end of the Louvain process, we can derive communities of C2 vertices (\( {\text{LC}}_{i} ,i = \left[ {1,l} \right] \), \( l \) is the number of communities) with the best global modularity.
Second Step: Connected Component.
Connected Component is a simple algorithm with time efficiency of \( {\text{O}}\left( {n\log n} \right) \), \( n \) is the number of nodes in the graph. Nodes in a component are connected by paths while different components have no overlapping nodes. It works well in large-scale networks. Hence, we can extract subgraphs of C2 vertices connected by strong evidence from fundamental graph into a super graph \( {\text{EG}} \) (evidence graph). Running Connected Component on \( {\text{EG}} \) will help us find out the components (\( {\text{CPN}}_{i} ,i = \left[ {1,p} \right] \), \( p \) is the number of components) within which all possible evidence paths are considered.
Final Step: Merging Communities and Components.
In this Step, components from the second step and communities from the first step are taken as nodes, links will be established if any two components and communities have the common C2 vertices. We simply run Connected Components algorithm on this graph, which results in several subgraphs. After correlating subgraphs with former community-related C2 and component-related C2, we can obtain our final DDoS attack groups DAG. Each attack group consists of a set of C2 vertices.
4 Evaluation
The evaluation process is illustrated as follows. Firstly, we extract entities and events from input data sources, then we are able to grasp the trend of active entities/events and construct our fundamental graph and similarity graph. Secondly, we run hierarchical community discovery on graphs and evaluate the effectiveness of DDoS attack groups. Finally, we conduct an in-depth analysis on several typical DDoS attack groups.
4.1 Statistics of Input Data and Graphs
According to our extraction strategy and attack event definition, we are able to know the scale of entities participating in attack events and resources attackers used, as well as the trend from different perspectives.
Monthly Trend.
After we extract entities and attack events, we can derive the statistics of active entities and activities in each month.

Monthly trend of active entities in DDoS attacks
Figure 6 shows us the number of active C2 servers and bots in each month. Though the trend of each month is moving up and down, the overall trend is upwards in the scale of C2 servers and bots. Meanwhile, the control ability of botnets is enhanced a lot in 2019 than in 2018. In May 2019, 392 C2 servers control botnets of over 0.65 million bots.
Figure 7 illustrates the trend of targeting activities in DDoS attacks. An interesting fact is that targeting activities reach a peak of each year in August in both 2018 and 2019. In August 2019, active botnets conduct over 30K attack events targeting 21K destination. On average, each target suffers from DDoS attacks for approximately a day and a half.

Monthly trend of targeting activities in DDoS attacks
Graph Construction.
Table 5 and Table 6 show the scale of a fundamental graph built from entities and relations from behavior data and threat intelligence data. Vertices of types C2, BOT, TARGET origin from botnet communication logs, while types DOMAIN, SHA256, PDB origin from passive DNS data and threat intelligence data.
Table 7 shows scale of the graph we construct from meta path-based similarity between C2 servers. The following DDoS attack group discovery is based on this graph.
4.2 Situation Awareness of DDoS Attack Groups
After DDoSAGD framework’s process, we get the result of 282 DDoS attack groups. Each DDoS attack group contains more than one C2 server. DDoS attack groups’ characteristics vary a lot in lifecycle length and scale of attack resources.

Monthly emerging and fading trend of DDoS attack groups
Lifecycle of DDoS Attack Groups.
Analysis results reveal the fact that most DDoS attack groups stay active for a relatively short time period, only 19 groups remain active after three months. Meanwhile, attackers can utilize only no more than 10 C2 servers to gain possession of over 27K vulnerable machines or devices to be their botnet army in a very short time.
Figure 8 tells the fact that DDoS attack groups keep emerging and fading in every month. Figure 9 shows active month distribution among all DDoS attack groups. Most attack groups disappear in less than 3 months and the largest group remains active for 23 months.

Active month distribution of DDoS attack groups
Statistics of Top 10 DDoS Attack Groups:
In Table 8, we display the top 10 DDoS attack groups by ranking bots in possession by each one of them.
Typical DDoS Attack Group Analysis.
The largest DDoS attack group G769 we discover is found to be related to multiple DDoS attack groups unveiled by different security organizations, such as SSHPsychos or Group 93 [11] from Cisco Talos Group, Loligang [12] from Tencent Threat Intelligence Center and malicious IPs (related to *atat456.com domains) referred to by many security researchers [13].

Subgraphs related to DDoS attack group uncovered by external security researchers

Monthly trend of emerging/fading C2 servers of DDoS Attack group G769
Figure 10 depicts the relations between C2 servers, in which the red frames are subgraphs related to attack groups recognized by external security researchers in different times. Our approach can construct behavior similarity and threat intelligence relevance for C2 servers, hence be able to correlate them in the same DDoS attack group, confronting the fact that real world attackers keep switching C2 servers to evade detection. Figure 11 supports this point of view by showing the monthly trend of emerging and fading C2 servers of G769.
5 Conclusion
In this paper, a practical attack group framework DDoSAGD is proposed to unveil the facts beneath DDoS attack behaviors. DDoSAGD takes the advantage of a graph theory, and adopts dual community detection methods to discover groups in DDoS attacks. DDoSAGD overcomes the difficulty in discovering attack groups in a long period. Through an in-depth analysis on and comparison with external uncovered attack groups, results verify that our approach is both applicable and efficient in the real world.
References
NSFOCUS. DDoS Attack Landscape, pp. 3–6. NSFOCUS, Beijing (2019). https://nsfocusglobal.com/2019-ddos-attack-landscape-report
CNCERT/CC. Analysis report of active DDoS attack gang in 2018, p. 3. CNCERT/CC, Guangzhou (2019). https://www.cert.org.cn/publish/main/upload/File/20190131.pdf
CNCERT/CC. Analysis report on website attack situation and “attack Gang” mining in 2018, pp. 21–38. CNCERT/CC, Guangzhou (2019). https://www.cert.org.cn/publish/main/upload/File/2018threats.pdf
Yang, H., Sun, X., Zhao, R.: Behavior Analysis of IP Chain-Gangs, pp. 7–22. NSFOCUS, Beijing (2018). https://nti.nsfocusglobal.com/pdf/Behavior_Analysis_of_IP_Chain_Gangs.pdf
Zhu, T., Yan, H., Zhu, L.: DDoS attack gang analysis method based on network attack accompanying behavior: China, cn108173884a (2018)
Wang, Q., Zhou, H., Yan, H., Mei, R., Han, Z.: Network security situation analysis based on malicious code propagation log. J. Inf. Secur. 4(05), 14–24 (2019)
Zhao, T., Qiu, X.: Detection of IP Gangs: Strategically Organized Bots. Springer, New York (2018)
Santanna, J.J., De Schmidt, R.O., Tuncer, D., et al.: Booter blacklist: unveiling DDoS-for-hire websites. In: 2016 12th International Conference on Network and Service Management (CNSM), Montreal, QC, pp. 144–152 (2016)
Blondel, V.D., et al.: Fast unfolding of communities in large networks. J. Stat. Mech.: Theory Exp. 10(2008), P10008 (2008)
Shapiro, L.G.: Connected component labeling and adjacency graph construction. Mach. Intell. Pattern Recogn. 19(19), 1–30 (1996)
https://blog.malwaremustdie.org/2015/07/mmd-0037-2015-bad-shellshock.html
Acknowledgements
This work was supported in part by National Key R&D Program of China under Grant No. 2017YFB0803005.
Author information
Authors and Affiliations
Corresponding author
Editor information
Editors and Affiliations
Rights and permissions
Open Access This chapter is licensed under the terms of the Creative Commons Attribution 4.0 International License (http://creativecommons.org/licenses/by/4.0/), which permits use, sharing, adaptation, distribution and reproduction in any medium or format, as long as you give appropriate credit to the original author(s) and the source, provide a link to the Creative Commons license and indicate if changes were made.
The images or other third party material in this chapter are included in the chapter's Creative Commons license, unless indicated otherwise in a credit line to the material. If material is not included in the chapter's Creative Commons license and your intended use is not permitted by statutory regulation or exceeds the permitted use, you will need to obtain permission directly from the copyright holder.
Copyright information
© 2020 The Author(s)
About this paper

Cite this paper
Rao, Y., Liu, W., Zhu, T., Yan, H., Zhou, H., Bai, J. (2020). Practical DDoS Attack Group Discovery and Tracking with Complex Graph-Based Network. In: Lu, W., et al. Cyber Security. CNCERT 2020. Communications in Computer and Information Science, vol 1299. Springer, Singapore. https://doi.org/10.1007/978-981-33-4922-3_8
Download citation
DOI: https://doi.org/10.1007/978-981-33-4922-3_8
Published:
Publisher Name: Springer, Singapore
Print ISBN: 978-981-33-4921-6
Online ISBN: 978-981-33-4922-3
eBook Packages: Computer ScienceComputer Science (R0)