
Abstract
In many actual nonlinear systems, especially near the equilibrium point, linearity is the primary feature and nonlinearity is the secondary feature. For the system that deviates from the equilibrium point, the secondary nonlinearity or local structure feature can also be regarded as the small uncertainty part, just as the nonlinearity can be used to represent the uncertainty of a system (Wang et al. 2019). So this chapter also focuses on how to deal with the nonlinearity in PLS series method, but starts from an different view, i.e., robust PLS. Here the system nonlinearity is considered as uncertainty and a new robust \(\mathrm{L}_1\)-PLS is proposed.
You have full access to this open access chapter, Download chapter PDF
In many actual nonlinear systems, especially near the equilibrium point, linearity is the primary feature and nonlinearity is the secondary feature. For the system that deviates from the equilibrium point, the secondary nonlinearity or local structure feature can also be regarded as the small uncertainty part, just as the nonlinearity can be used to represent the uncertainty of a system (Wang et al. 2019). So this chapter also focuses on how to deal with the nonlinearity in PLS series method, but starts from an different view, i.e., robust PLS. Here the system nonlinearity is considered as uncertainty and a new robust \(\mathrm{L}_1\)-PLS is proposed.
The traditional PLS and its nonlinear improvement methods are usually to maximize the covariance between the input and output data, i.e., the square of \(\mathrm{L}_2\) norm. \(\mathrm{L}_2\) norm has the feature of clear physical meaning and convenient calculation, and its solution are unique unbiased and dense. While it is powerless for systems with rich local features such as nonlinear systems or uncertain systems. The proposed robust \(\mathrm{L}_1\)-PLS aims at the robustness of the feature extraction and the regression coefficients. This method maintains the signal relative size during the feature extraction. Moreover, it guarantees the features are robust to outliers in the global statistical view and sensitive to the local structure information.
12.1 Motivation of Robust \(\mathrm{L}_1\)-PLS
Many robust PLS methods have been developed to increase the robustness of traditional PLS method recently. Branden (2004) and Hubert (2008) replaced the empirical variance-covariance matrix in PLS by a robust covariance estimator, and used the minimum covariance determinant (MCD) estimator and the reweighted MCD estimator (RMCD) for low-dimensional data sets. Turkmen (2013) proposed the influence function analysis for the robust PLS estimator. Currently, the existing robust PLS methods use robust covariance estimation techniques with the identification of multivariate outliers to maintain robustness (Fortuna et al. 2007; Filzmoser 2016). These methods actually perform with a potential assumption that the signal is subject to Gaussian distribution, which is not satisfied for many industrial processes. Usually the industrial data are full of lots of outliers and follow either heavy-tailed distribution (Doman’ski 2019) or multipeak distribution (Wang 2000). In other words, the statistical properties of this kind of data cannot be described by the robust covariance matrix estimation. Furthermore, outliers may contain very important information, so the outliers cannot be simply deleted or replaced (Liu et al. 2018). The data also have some nondominant local structure features besides the outliers. Robust covariance estimation methods also do not handle the small uncertainty correctly.
Recently, a robust PCA (RPCA) (Kwak 2008) and a robust sparse PCA (RSPCA) (Meng et al. 2012) were proposed, which the two methods maximized the \(\mathrm{L}_1\) norm rather than the square of \(\mathrm{L_2}\) norm of the input data. Experiments showed that they are efficient and robust for the data with inherent uncertainty and outliers. However, the two improved RPCA methods do not obtain any useful information from the output quality variables, so it is difficult to directly apply them to quality-relevant process monitoring and fault diagnosis (Zhou et al. 2018). The monitoring system will automatically alarm if a fault is detected whether it affects the product quality or not. Many alarms do not make sense for the final production quality.
It is known that the least absolute deviation (LAD) regression is often better than the least squares (LS) regression for non-Gaussian signals, especially those with a heavy-tailed distribution. While LAD regression is immune to outliers. Moreover, the solution of LAD regression is not unique, and it is necessary to introduce the optimal technique to obtain an optimal solution. So the LAD regression of high-dimensional system is a time-consuming task. To improve the efficiency of the LAD algorithm, the idea of partial least squares (PLS) regression is used to extend the conventional LAD regression to partial LAD regression. The PLS-based monitoring method decomposes the process space through the correlation between the quality and the process variables, which can reflect the quality-relevant product changes in the process variables (Wang et al. 2017; Zhou et al. 2018).
In order to enhance the robustness of the PLS method in a new way, this chapter proposes a novel dual robustness projection to latent structure regression method based on the \(\mathrm{L}_1\) norm, \(\mathrm{L}_1\)-PLS. The optimization objective during the principle components extraction in the PLS method is a square of \(\mathrm{L}_2\) norm, i.e., the least squares regression problem. \(\mathrm{L}_1\)-PLS use the \(\mathrm{L}_1\) norm maximization to replace the square of the \(\mathrm{L_2}\) norm maximization in the traditional PLS methods. The \(\mathrm{L}_1\) norm penalty terms are added to the direction vectors in the latent structure construction. Moreover, the partial LAD regression is used to obtain the regression coefficients. Therefore, the \(\mathrm{L}_1\)-PLS regression method achieves dual robust capabilities including robust principle components and regression coefficients. On the other hand, the \(\mathrm{L}_1\) norm optimization target also has the certain capability of local structural feature retention, compared with the \(\mathrm{L_2}\) norm optimization goal.
\(\mathrm{L}_1\)-PLS is distinguished from other existing robust PLS methods in several respects:
-
(1)
The noises, outliers, and local structure features generally enter the system through the direction vectors, and the \(\mathrm L_1\) norm can maintain the relative size of the original signal; its direction vectors are robust to outliers and contain more local structure features even if there is no preprocessing of outliers. This facilitates the \(\mathrm L_1\) norm to obtain the global and local features of the system at the same time without destroying the integrity of the samples;
-
(2)
The \(\mathrm{L}_1\)-PLS method with the \(\mathrm{L}_1\) norm penalty term to the direction vectors can obtain the sparse principle components, and filter out the disturbance variables or those sparse PCs that are robust to disturbance variables;
-
(3)
The regression coefficients are obtained by the partial LAD regression. The corresponding regression model is also robust to outliers or uncertainties, and the model has better predictive performance.
12.2 Introduction to RSPCA Method
Consider the input data \(\boldsymbol{X}\mathrm{{ = }}\left[ {\boldsymbol{x}(1)}, \cdots {\boldsymbol{x}(n)} \right] \in {R^{m \times n}}\), where \(\boldsymbol{x}=\left[ {x_i}, \cdots {x_m} \right] \); m and n are the dimensionality of the input data and the size of the input matrix. The traditional PCA method aims to find the \( d(d < m) \) dimensional linear subspace with the largest input data variance. The objective function is as follows:
where \(\boldsymbol{W} = \left[ {\boldsymbol{w}_1^\mathrm {T}},\ldots ,{\boldsymbol{w}_d^\mathrm {T}}\right] ^\mathrm {T}\in {R^{m \times d}}\) is weight matrix. \({\left\| . \right\| _2}\) represents the \({L_2}\) norm of a matrix or vector.
However, the principal components based on the PCA are usually a linear combination of the original variables usually with the non-zero weights. The non-zero weight results in that many irrelevant variables are included in the final model and cause unnecessary interference. Therefore, the spare PCA (SPCA) method was proposed to achieve the sparse expression of the principal components as much as possible (Liu 2014). Its objective function is
where \({\left\| . \right\| _1}\) is the \(\mathrm{L}_1\) norm of a matrix or vector. It is introduced as constraint or penalty term to enhance the sparsity of the principal components. s is the number of non-zero weights. The \(\mathrm{L}_1\) norm penalty term \(\left( {{{\left\| \boldsymbol{W} \right\| }_1} < s} \right) \) realizes the sparse expression of the direction vector.
Figure 12.1 shows the amplifying effect curve of L\(_1\) norm and L\(_2\) norm on noise. The blue dotted line is the square of the \(\mathrm{L}_2\) norm (for one-dimensional data, it is equivalent to the \(\mathrm{L}_2\) norm), and the red line is the \(\mathrm{L}_1\) norm. Obviously, the L\(_2\) norm has an inhibitory effect on the data in \(\left| x \right| \le 1\) and has an enlarged effect on the data in \(\left| x \right| > 1\). The \(\mathrm{L}_1\) norm maintains the relative size of the original data and has a relatively small expansion effect on all data. In order to further improve the robustness of SPCA, the RSPCA method is proposed to reduce the sensitivity of the principal components to outliers. The L\(_2\) norm in the objective function is substituted by \(\mathrm{L}_1\) norm (Zou et al. 2006). The optimization function of RSPCA is given as follows:

The expanding effects of the L\(_1\) norm and L\(_2\) norm curve
Here the optimization problem is a form of L\(_1\) norm maximization with an \(\mathrm{L}_1\) norm penalty term simultaneously. In order to obtain the principal components of the RSPCA method, the optimal direction vector \(w* \) is calculated by Algorithm 3.
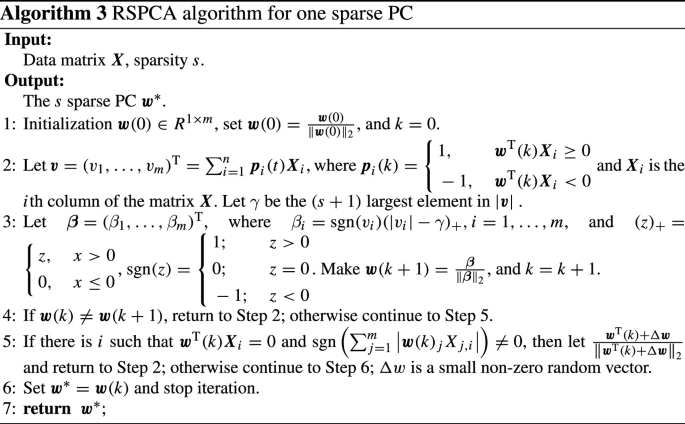
The convergence of Algorithm 3 and the rationality of the obtained sparse direction vectors have been theoretically verified (Zou et al. 2006). However, Algorithm 3 indicates that the sparseness of the data needs to be given in prior during the calculation of the sparse direction vector. Generally speaking, the sparsity of input data is unknown and it contains uncertainty. More importantly, the RSPCA method cannot be directly applied to quality-related process monitoring. Therefore, this chapter introduces the \(\mathrm{L}_1\) norm into the PLS method.
12.3 Basic Principle of \(\mathrm{L}_1\)-PLS
The double robust projection to latent structure (\(\mathrm{L}_1\)-PLS) method is given based on the \(\mathrm{L}_1\) norm, aiming at improving the robustness of the traditional PLS method. The PLS method extracts principal components from the input space and output space, and the principal components should satisfy the following conditions: carry the maximum variation information (representation) of their respective variable spaces as much as possible, and the degree of correlation between different variable spaces is as large as possible (correlation). Take the extraction of the first principal component as an example. The PLS method is expressed as follows:
where \({\boldsymbol{w}_1}\) and \({\boldsymbol{c}_1}\) are the direction vector of the principle components \({\boldsymbol{t}_1}\) and \({\boldsymbol{u}_1}\). The optimization problem (12.4) is transformed into finding the unit direction vectors \({\boldsymbol{w}_1}\) and \({\boldsymbol{c}_1}\) corresponding to the maximum eigenvalue \({\theta ^2}\) of matrices \(\boldsymbol{E}_0^{\mathrm {T}}{\boldsymbol{F}_0}\boldsymbol{F}_0^{\mathrm {T}}{\boldsymbol{E}_0}\) and \(\boldsymbol{F}_0^{\mathrm {T}}{\boldsymbol{E}_0}\boldsymbol{E}_0^{\mathrm {T}}{\boldsymbol{F}_0}\), respectively. It can be seen that the solution of (12.4) satisfies the requirements about the representation and correlation in PLS method.
Then, multiply both sides of the equation (12.4) by \(\boldsymbol{w}_1^{\mathrm {T}}\) and \(\boldsymbol{c}_{_1}^{\mathrm {T}}\), respectively, and obtain
To simplify further, we can get
The optimal problem of the traditional PLS (12.4) is expressed as \(\mathrm{L}_2\) norm optimization in (12.6). \(\boldsymbol{w}_1^*\) and \(\boldsymbol{c}_{_1}^*\) are the optimal direction vectors.
It is known that the noise is flowed into the regression model through the direction vector ( \({\boldsymbol{w}_1}\) and \({\boldsymbol{c}_1}\) ) in most cases, which affects the estimation of the regression parameters in the PLS method. Similar as the idea of equation (12.3), we replace the maximization of the \({L_2}\) norm in the objective function (12.6) with the maximization of \(\mathrm{L}_1\) norm. Moreover, the \(\mathrm{L}_1\) norm penalty term is added to the direction vector. Therefore, the objective function of the \(\mathrm{L}_1\)-PLS method based on the \(\mathrm{L}_1\) norm is given as follows:
where \({s_1}\) and \({s_2}\) are the sparsity of input spatial data and output spatial data, respectively.
According to the above analysis, although the direction vectors (\({\boldsymbol{w}_1}\) and \({\boldsymbol{c}_1}\)) in (12.4) contains the correlation between the input data \({\boldsymbol{E}_0}\) and the output data \({\boldsymbol{F}_0}\), fortunately, they can be solved separately in (12.7). Therefore, Algorithm 3 also is suitable for the solution of (12.7) by replacing the corresponding input data matrix \(\boldsymbol{X} \) with \(\boldsymbol{E}_0^{\mathrm {T}}{\boldsymbol{F}_0}\) and \(\boldsymbol{F}_0^{\mathrm {T}}{\boldsymbol{E}_0}\), respectively. It is noted that the solution of \({\boldsymbol{w}_1}\) and \({\boldsymbol{c}_1}\) are independent but not jointed by Algorithm 3.
Once the optimal direction vectors \({\boldsymbol{w}_1}\) and \({\boldsymbol{c}_1}\) are obtained, the score vectors in the latent space, i.e., the first principle component pair, \({\boldsymbol{t}_1}\) and \({\boldsymbol{u}_1}\) can be calculated
Next, the regression coefficients (loading vectors) of \({\boldsymbol{F}_0}\) and \({\boldsymbol{E}_0}\) to \({\boldsymbol{t}_1}\) will be established. In the traditional PLS model, the regression coefficients \({\boldsymbol{p}_1}\) and \({\boldsymbol{q}_1}\) are estimated by least squares, namely,
Similarly, least squares estimation is also susceptible to outliers, and the least absolute deviation (LAD) method is introduced to deal with this problem. Therefore, in order to further improve the robustness, LAD regression is used to solve the regression coefficients in the \(\mathrm{L}_1\)-PLS algorithm, namely,
where \({\boldsymbol{p}_1^*}\) and \({\boldsymbol{q}_{_1}^*}\) are the optimal loading vectors of (12.10).
Obviously, the essence of (12.10) is also the form of \(\mathrm{L}_1\) norm. When there are few outliers, it is not necessary to use the norm to solve the regression coefficient. Due to the direction vector has been solved by maximizing the \(\mathrm{L}_1\) norm, the influence of the outlier has been reduced, and as can be seen from Fig. 12.1. When the outlier is small, the \(\mathrm{L}_2\) norm and the \(\mathrm{L}_1\) norm have the same effect.
Calculate the residual matrix \({\boldsymbol{E}_1}\) and \({\boldsymbol{F}_1}\):
Similar as the extraction of the first principal components pair, the other principal components are calculated iteratively by decomposing the residuals \({\boldsymbol{E}_i}\) and \({\boldsymbol{F}_i}\) \(\left( {i = 1,\ldots ,d - 1} \right) \). The extraction of principal components is stopped until the model determined by the extracted principal components satisfies the desired requirements.
The dual robustness of the \(\mathrm{L}_1\)-PLS algorithm is reflected in the following two aspects:
-
1.
Different from the PLS algorithm, Algorithm 3 is used to calculate the direction vector each time. By maximizing the \(\mathrm{L}_1\) norm in the objective function, and adding the \(\mathrm{L}_1\) norm penalty term to the direction vector, the robustness of the \(\mathrm{L}_1\)-PLS algorithm is improved. This achieves the robustness of principal component extraction.
-
2.
In the case of many outliers, the regression coefficients can be calculated using least absolute estimation, which can overcome the shortcomings of least squares estimation that is easily affected by outliers, and further enhance the robustness of the \(\mathrm{L}_1\)-PLS algorithm.
12.4 \(\mathrm{L}_1\)-PLS-Based Process Monitoring
It is found that only the calculation process of the direction vector \({\boldsymbol{w}_1}\) and \({\boldsymbol{c}_1}\) (12.7) or the regression coefficient \({\boldsymbol{p}_1}\) and \({\boldsymbol{q}_1}\) (12.10) is improved in the \(\mathrm{L}_1\)-PLS method, and other steps are not affected. Therefore, the monitoring process based on the \(\mathrm{L}_1\)-PLS method is the same as the PLS method. In the process monitoring based on the \(\mathrm{L}_1\)-PLS method, the \({\mathrm{T}^2}\) and \(\mathrm{T}_e^2\) statistics are still used to monitor the principal component subspace and the remaining subspace. Then, the \(\mathrm{L}_1\)-PLS-based monitoring is described in detail in Algorithm 4 (offline process training) and Algorithm 5 (online process monitoring). The corresponding flowchart is shown in Fig. 12.2.

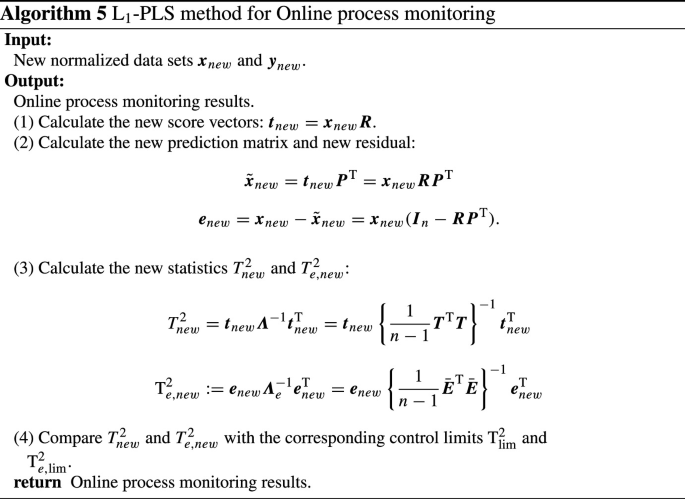
In Algorithms 4 and 5, \(\boldsymbol{\varLambda }\) and \({\boldsymbol{\varLambda }_e}\) represent the sample covariance matrix. The non-parametric kernel density estimation (KDE) method (1.33) is used to estimate the corresponding control limits of \({\mathrm{T}^2}\) and \(\mathrm{T}_e^2\).
There is still a key problem in the implementation of Algorithm 4: the sparsity degree \({s_1}\) and \({s_2}\) need to be given in prior. There are two common strategies to determine \({s_1}\) and \({s_2}\). (1) The first one is the variable importance in prediction (VIP) method (Farrés et al. 2015). It judges whether the variable is an irrelevant variable based on the VIP score of the jth predicted value of the response variable. Usually, the “greater than \(\epsilon \)” criterion is used as the selection criterion. More precisely, the threshold \(\epsilon \) should be adjusted based on the distribution of the overall data in different situations. (2) The second strategy is the selectivity ratio method (Branden and Hubert 2004). The variable selection ratio is calculated according to the ratio of the interpretation of the \(\boldsymbol{X} \) variable on the \( \boldsymbol{Y}\) target projection component to the residual variance. Then F test is performed to define the boundary between important variables and irrelevant variables. Since the VIP method is simple and easy to implement, the VIP method is selected to determine the sparsity \({s_1}\) and \({s_2}\) here.
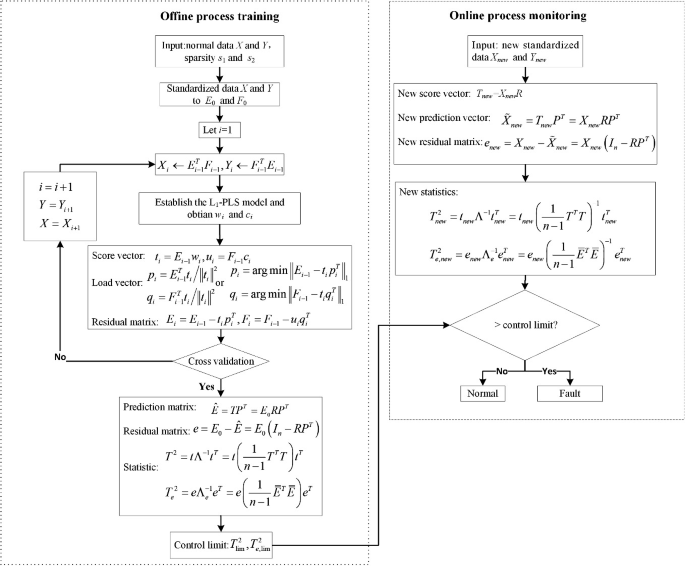
The Flow chart of Algorithms 4 and 5
It is worth noting that the role of sparsity is to achieve variable selection. If the established system model contains many irrelevant variables, giving the sparsity is helpful to limit the number of irrelevant variables, so as to realize \(\mathrm{L}_1\)-sparse-PLS. However, if the sparsity of the input data is uncertain, the sparsity degree \({s_1}\) and \({s_2}\) can be set equal to the variable number in the input and output space, respectively, to eliminate the uncertainty caused by the sparsification. In this view, the proposed \(\mathrm{L}_1\)-PLS method is uniformly called as \(\mathrm{L}_1\)-(S)PLS method based on the different sparsity.
12.5 TE Simulation Analysis
In this simulation, the input variable X is composed of 31 variables [XMEAS(1:22)] and [XMV(1:11) (except XMV(5) and XMV(9))]. The output variable Y consists of the quality components G (XMEAS(35)) and H (XMEAS(36)). Two simulation examples are used to verify the effectiveness of the \(\mathrm{L}_1\)-PLS method for fault detection.
12.5.1 Robustness of Principal Components
The robustness of the \(\mathrm{L}_1\)-PLS method is mainly implemented on the direction vectors, which directly reflects the robustness of the PCs. The variation of the PC structure caused by outliers therefore is the focus of robustness analysis. Here results of PLS and RPLS methods are given for comparison. The input and output data (\(\boldsymbol{X} \in {R^{960 \times 31}},\boldsymbol{Y} = \in {R^{960 \times 2}}\)) are sampled from the TE process under the normal operation for training data. In order to test further the proposed \(\mathrm{L}_1\)-PLS, the outliers are added in the input space in the following form:
where \(X^*(k)\) is the kth normal sample (\(k=1,2,\ldots ,960\)) \(\boldsymbol{\varXi }_j\) is the j-th randomly generated outlier that obey Gaussian distribution \({\boldsymbol{\varXi }_j} \sim N(0,2000)\). For ease of verification, three kinds of repeatable outliers that are generated using a specific random seed are added to the training set,
Outlier \(\varXi _1(12)\) means that only the 14, 15, 16, and 17th variables at the 12th sample time X(12) are abnormal, and the other variables at other sample times are still normal. The other two outliers have similar meanings.
The sparsity \({s_1}\) and \({s_2}\) in the \(\mathrm{L}_1\)-PLS method are set to 31 and 2. The sparsity is equal to the variable number of input and output space, respective. In other words, the \(\mathrm{L}_1\)-PLS method can reflect the changes in all variables. The components numbers d are determined using cross-validation. They are 6, 6, and 2 for PLS, RPLS, and \(\mathrm{L}_1\)-PLS methods, respectively. The principle components are \(t_i=\sum _{j=1}^n \boldsymbol{w}_{ij}x_j, i = 1,\ldots ,d\), in which \(\boldsymbol{w}_{ij}\) is the jth element of \(r_i\). The coefficients \(\boldsymbol{w}_{ij}\) are used to reflect whether the outliers affect the principle components. The relative rates of change (RRC) indices are defined as follows:
where \(\boldsymbol{w}_{i,normal}=[w_{ij}]_{normal}\) and \(\boldsymbol{w}_{i,outliers}=[w_{ij}]_{outliers}\) are the normalized coefficient vectors with normal samples and adding outliers samples for the \(i_{th}\) PC, respectively.
\(RRC_1\) represents the maximum absolute deviation of the two coefficient sets, which indicates the worst changes of the normalized \(\boldsymbol{w}_{ij}\). \(RRC_2\) represents the sum of the absolute deviations of the two coefficient sets, which indicates the overall change of the normalized \(\boldsymbol{w}_{ij}\).
The normalized coefficient \(\boldsymbol{w}_{ij}\) values of the first two PCs (\({t_1}\) and \({t_2}\)) of the PLS, RPLS and \(\mathrm{L}_1\)-PLS methods are shown in Figs. 12.3 and 12.4. The corresponding indices \(RRC_i,i=1,2\) are given in Table 12.1 (a smaller value is better).

The relative change rates of \(\boldsymbol{t}_1\) using PLS and \(\mathrm{L}_1\)-PLS

The relative change rates of \(\boldsymbol{t}_2\) using PLS and \(\mathrm{L}_1\)-PLS
It can be seen from Figs. 12.3–12.4 and Table 12.1 that no matter which method is used, the outliers will always affect the structure of the PCs to some extent. In general, the outliers have a large adverse effect on the PCs extraction of the PLS method, and thus results in the largest change in its PC structures. With the robust covariance estimation method, the outliers have little effect on the PCs extraction of the RPLS method. \(\mathrm{L}_1\)-PLS method only uses the \(\mathrm{L}_1\) norm to be insensitive to outliers, without any outliers processing. Outliers that cause changes in the structure of its two PCs are nearly identical and within an acceptable range, whether in the \(RRC_1\) or \(RRC_2\). The samples considered to be outliers may be a true reflection of the system state when the data set follows a heavy-tailed distribution (Doman’ski 2019). It is more important to retain all the samples to extract the PCs, although the outliers have a certain influence on the direction vectors.
By further analyzing the structure of \(t_1\) and \(t_2\), it can be easily found that the extracted PCs by those methods are quite different. In order to better explain the structural differences of \(t_1\) and \(t_2\) in different methods, IDV(14) is taken as an example for in-depth analysis. The typical process variable monitoring results of IDV(14) are given in Fig. 12.5, in which, \(x_9\), \(x_{21}\) and \(x_{30}\) have similar monitoring results. Among the \(t_1\) and \(t_2\), the sum of the absolute weights for \(x_9\), \(x_{21}\) and \(x_{30}\) of the PLS method (0.062) is more than twice that of the \(\mathrm{L}_1\)-PLS method (0.025).
These weight differences do not significantly affect the output prediction and the monitoring performance in the normal operation. But these differences are amplified in the fault modes. For example, consider the monitoring under the fault modes IDV(14) and IDV(17). The role of \(x_{21}\) and \(x_{30}\) (especially \(x_{30}\)) in the PLS method is exaggerated, leading to incorrect predictions and quality-relevant monitoring results (see Figs. 12.6 and 12.7). Correspondingly, the \(\mathrm{L}_1\) norm can better maintain the relative size of those variables, therefore, the role of \(x_{21}\) and \(x_{30}\) in the extracted PCs is not exaggerated. In other words, the extracted PCs by the \(\mathrm{L}_1\) norm better capture the relationship between the input space and output space.
Typical process variable monitoring results of IDV(14)
12.5.2 Robustness of Prediction and Monitoring Performance
The robustness of the principal components of the \(\mathrm{L}_1\)-PLS method is discussed in the previous section. But the number of principal components of the three methods is different, which only reflects one aspect of the robustness. Now, the robustness of prediction performance and monitoring is analyzed further, especially the prediction performance directly reflects the quality of the model. There are 21 types of faults in the TE process. The fault IDV(21) is a fault that the output drifts slowly, caused by the constant change of the steam valve position. So it does not reflect the robustness of the model. Therefore, the first 20 faults are analyzed in this simulation experiment. In this simulation, the sparsity in the \(\mathrm{L}_1\)-SPLS model is determined by the VIP method: input space \({s_1} = 14\), output space \({s_2} = 2\).
Experiment 1: Prediction Performance Analysis
In this experiment, the \(\mathrm{L}_1\)-PLS model shows good output prediction results for the 20 fault data sets. \(\mathrm{L}_1\)-PLS(outliers) and PLS(outliers) mean that the two models are trained by the normal operation data with adding outliers, described in previous Sect. 12.5.1. In order to illustrate the above conclusions more clearly, four faults IDV(7), IDV(14), IDV(17), and IDV(18) are selected to compare the prediction performance of the PLS model and the \(\mathrm{L}_1\)-PLS model. The output prediction results are good for all fault modes, but the four faults come from four different fault types, and the results of the \(\mathrm{L}_1\)-PLS model and the PLS model are quite different. Figures 12.6 and 12.7 give the output prediction results of the fault IDV(7), IDV(14), IDV(17), and IDV(18). The horizontal axis represents data samples, and the vertical axis represents output values. The blue dashed line is the actual output value, and the green is the predicted output value.

Output predicted values for IDV(7), IDV(14), IDV(17), and IDV(18) using PLS(outliers)

Output predicted values for IDV(7), IDV(14), IDV(17), and IDV(18) using \(\mathrm{L}_1\)-PLS(outliers)
In these prediction and monitoring diagrams, the first 160 samples are normal data, and the last 800 samples are data under different fault modes. The output prediction of fault IDV(7) shows a consistent conclusion under the step-change fault. The feedback controller or cascade controller reduces the impact of faults and abnormal values on product quality. For the other three types of fault IDV(14), IDV(17), and IDV(18), there are some differences in their output prediction results. When the system is under the normal operation, the PLS and \(\mathrm{L}_1\)-PLS models have the same good prediction results. However, after adding outliers, the PLS method cannot accurately predict the output (Fig. 12.6), while the \(\mathrm{L}_1\)-PLS method still quickly detects the output changes and makes correct predictions (Fig. 12.7). In particular, for faults IDV(17) and IDV(18), the PLS method gives a serious wrong predictions. Experiments show that the prediction performance of the \(\mathrm{L}_1\)-PLS method is better than PLS. Even if the data is contaminated by outliers, \(\mathrm{L}_1\)-PLS can still predict the output accurately. In other words, the \(\mathrm{L}_1\)-PLS model has stronger robust prediction performance.
Experiment 2: Monitoring Performance Analysis
The robustness of monitoring performance is mainly verified by the accuracy of fault detection. The detection indices are FDR and FAR (4.1), the control limit is calculated with the confidence level \(99.75\%\) for both PLS and \(\mathrm{L}_1\)-PLS methods. The FAR results of the two models are basically same, this indicates that the proposed \(\mathrm{L}_1\)-PLS method does not increase the risk of false alarms, so it is not analyzed in this section. Table 12.2 lists the FDR results of the first 20 faults without adding outliers, corresponding to the models PLS, \(\mathrm{L}_1\)-PLS and \(\mathrm{L}_1\)-SPLS respectively. Table 12.3 shows the FDR results of 20 faults after adding outliers, corresponding to the models PLS (outliers), \(\mathrm{L}_1\)-PLS (outliers), and \(\mathrm{L}_1\)-SPLS (outliers).
For serious quality-related faults IDV(2), IDV(6), IDV(8), IDV(12), IDV(13), and IDV(18), the six models give consistent results. Therefore, these faults are not analyzed in this chapter. For other types of faults, their results are very different, including the quality-irrelevant faults, the quality-recoverable faults, and slight quality-related faults. The detailed analysis of the three situations is given below. In the monitoring figures of this section, the blue line represents the value of the statistic, where the upper curve is \({\mathrm{T}}^2 \), and the lower is \(\mathrm{T}_{e}^2\). The system alarms if the blue line exceeds the red control limit.
Case 1: Quality Irrelevant Fault
It can be found from Table 12.2 that very low alarm values are given for faults IDV(3), IDV(9), IDV(15), and IDV(19). However, the alarm values of the \(\mathrm{L}_1\)-PLS and \(\mathrm{L}_1\)-SPLS models are lower, which indicates that fewer false alarms will occur during the monitoring. It can also be seen from the corresponding Figs. 12.8, 12.9, 12.10, 12.11, and 12.12, the alarm points of the latter two models are much less. For faults IDV(4), IDV(11), and IDV(14), they are all related to the reactor cooling water and hardly affect the quality of output products. The PLS model gives a higher alarm value, which may lead to serious false alarms, while the \(\mathrm{L}_1\)-PLS model effectively avoids these alarms and reduces the number of false alarms. In addition, the \(\mathrm{L}_1\)-PLS model eliminates most of the false alarms in the monitoring Figs. 12.8, 12.9, 12.10, and the L1-SPLS model almost eliminates all false alarms.

PLS, \(\mathrm{L}_1\)-PLS and \(\mathrm{L}_1\)-SPLS monitoring results for IDV(4)

PLS, \(\mathrm{L}_1\)-PLS and \(\mathrm{L}_1\)-SPLS monitoring results for IDV(11)

PLS, \(\mathrm{L}_1\)-PLS and \(\mathrm{L}_1\)-SPLS monitoring results for IDV(14)

PLS, \(\mathrm{L}_1\)-PLS and \(\mathrm{L}_1\)-SPLS monitoring results for IDV(15)

PLS, \(\mathrm{L}_1\)-PLS and \(\mathrm{L}_1\)-SPLS monitoring results for IDV(19)
When adding outliers, the PLS model provides the same wrong results for quality-irrelevant faults. The specific FDR values are shown in Table 12.3. However, the monitoring effect of the \(\mathrm{L}_1\)-PLS model is still very good, for fault IDV(9), IDV(14), and IDV(19). The detection rate has been reduced to 0, which means that false alarms are completely eliminated in these cases. Therefore, the \(\mathrm{L}_1\)-(S)PLS model will not interfere with the fault monitoring results after adding outliers. It should be noted that the monitoring performance of the \(\mathrm{L}_1\)-PLS model after adding outliers (Table 12.3) is better than the normal conditions (Table 12.2). The possible reason is outliers, and the total noise in the input data becomes larger. The \(\mathrm{L}_1\)-PLS method can filter out noise more effectively during the modeling. Therefore, the established model is more accurate and the monitoring performance is improved.
Case 2: Quality-Recoverable Fault
Faults IDV(1), IDV(5), and IDV(7) are quality-recoverable faults. The prediction value should tend to return to normal, but the statistic should be kept at a higher value. Figure 12.13 shows the monitoring results of the three models on the fault IDV(1). It can be seen that both the \(\mathrm{L}_1\)-PLS and \(\mathrm{L}_1\)-SPLS model methods give the correct alarm results. In the PLS model, the value of the statistic exceeds the control limit, so a false alarm is generated in the process monitoring. For the fault IDV(5), it is also a process-related fault. It can be seen from Tables 12.2 and 12.3 that the fault detection rates of the \(\mathrm{L}_1\)-PLS and \(\mathrm{L}_1\)-SPLS models are lower than the PLS model, which means that the monitoring results are more accurate. Figures 12.14 and 12.16, respectively, show the monitoring diagrams of the three models for the fault IDV(5) in the normal case (without adding outliers) and with adding outliers. For fault IDV(7), the corresponding monitoring results are shown in Fig. 12.15. The PLS model gives completely wrong result, while the results of the other two models are more accurate.

PLS, \(\mathrm{L}_1\)-PLS and \(\mathrm{L}_1\)-SPLS monitoring results for IDV(1)

PLS, \(\mathrm{L}_1\)-PLS and \(\mathrm{L}_1\)-SPLS monitoring results for IDV(5)

PLS, \(\mathrm{L}_1\)-PLS and \(\mathrm{L}_1\)-SPLS monitoring results for IDV(7)

PLS(outliers), \(\mathrm{L}_1\)-PLS(outliers) and \(\mathrm{L}_1\)-SPLS(outliers) monitoring results for IDV(5)
The detection result for fault IDV(1) obtained by the \(\mathrm{L}_1\)-PLS (outliers) model seems to be better than the \(\mathrm{L}_1\)-PLS model, and the monitoring results are more reasonable. In addition, for the fault IDV (5), although the monitoring results of the \(\mathrm{L}_1\)-PLS and \(\mathrm{L}_1\)-SPLS (outliers) models may not be ideal, as shown in Fig. 12.14. The \(\mathrm{T}_e^2\) statistics of the \(\mathrm{L}_1\)-PLS and \(\mathrm{L}_1\)-SPLS models can detect the input space process-related faults. But the PLS (outliers), \(\mathrm{L}_1\)-PLS (outliers) and \(\mathrm{L}_1\)-SPLS (outliers) models gave wrong results (Fig. 12.16).
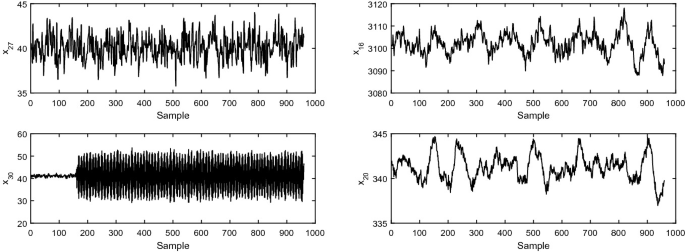
There are two possible reasons for this phenomenon. Firstly, the outliers were added directly without being regulated by the dynamic system, so its influence on the extraction of the principal components cannot be determined directly. Secondly, the typical process dynamics corresponding to fault IDV(5) is shown in Fig. 12.17. Only the variable 31 is a step change in all the monitored variables, and the rest gradually returns to the normal under the action of controller. In terms of the composition of the principal components, the contribution of variable 31 to the principal components is small. Therefore, its role is more in the residual space in the normal case (without adding outliers). After the outlier is added, its contribution to the principal component increases, which means its role in the residual space is weakened. It in turn causes the monitoring indicators in the residual space to return back to normal. On the other hand, the percentage of its contribution to the principal component is still small, so the monitoring indicators on the principal metric space also do not significantly reflect its characteristics.
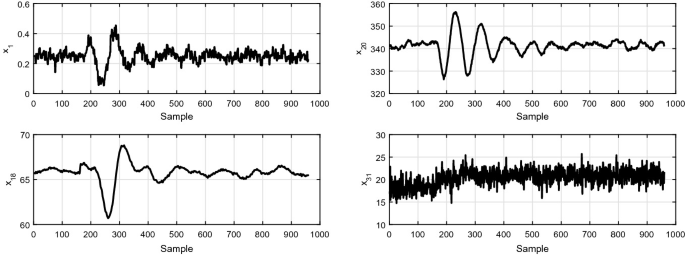
Typical process variable monitoring results of IDV(5)

PLS(outliers), \(\mathrm{L}_1\)-PLS(outliers), and \(\mathrm{L}_1\)-SPLS(outliers) monitoring results for IDV(17)
Case 2: Slight Quality Related Fault
Fault IDV (16) and IDV (17) have a slight impact on quality, which means that they have almost no impact on output quality. Figure 12.18 shows the monitoring results of the three models after adding outliers. The fault monitoring results of PLS (outliers) model is very bad, there have been many false positives. The \(\mathrm{L}_1\)-PLS (outliers) model and \(\mathrm{L}_1\)-SPLS (outliers) model effectively reduce these false alarms. It can also be seen from the corresponding FDR that the monitoring results of the \(\mathrm{L}_1\)-PLS (outliers) model and the \(\mathrm{L}_1\)-SPLS (outliers) model are more reasonable.
It can be seen from the above comparison results that even if outliers are added to the input data, the monitoring results of the \(\mathrm{L}_1\)-(S)PLS model have also been greatly improved. In other words, the \(\mathrm{L}_1\)-(S)PLS model improves the robustness performance and fault detection performance.
12.6 Conclusions
This chapter proposes a quality-related statistical monitoring method of double robust projection to latent structure (\(\mathrm{L}_1\)-PLS), which enhances the robustness of the PLS algorithm from two aspects. On the one hand, the \(\mathrm{L}_1\)-PLS method replaces the \({L_2}\) norm in the objective function with the \(\mathrm{L}_1\) norm, and adds the \(\mathrm{L}_1\) norm penalty term to the direction vector; On the other hand, the regression coefficient of the \(\mathrm{L}_1\)-PLS algorithm can also be obtained by the \(\mathrm{L}_1\) norm. Therefore, the \(\mathrm{L}_1\)-PLS algorithm has double robustness. Then a monitoring model based on the \(\mathrm{L}_1\)-PLS method is established, the robust performance and monitoring performance are verified on the TE process simulation platform. The results show that the \(\mathrm{L}_1\)-PLS method has better robustness and better performance in process monitoring and fault diagnosis.
References
Branden KV, Hubert M (2004) Robustness properties of a robust partial least squares regression method. Anal Chim Acta 515:229–241
Doman’ski PD (2019) Control quality assessment using fractal persistence measures. ISA Transactions
Farrés M, Platikanov S, Tsakovski S, Tauler R (2015) Comparison of the variable importance in projection (VIP) and of the selectivity ratio (SR) methods for variable selection and interpretation. J Chemom 29(10):528–536
Filzmoser P (2016) Identification of multivariate outliers: a performance study. Austrian J Stat 34:127–138
Fortuna L, Graziani S, Rizzo A, Xibilia MG (2007) Soft sensors for monitoring and control of industrial processes. Springer, London
Hubert M, Rousseeuw PJ, Van AS (2008) High-breakdown robust multivariate methods. Stat Sci 23:92–119
Kwak N (2008) Principal component analysis based on l1-norm maximization. IEEE Trans Pattern Anal Mach Intell 30(9):1672–1680
Liu JL (2014) Developing a soft sensor based on sparse partial least squares withvariable selection. J Process Control 24:1046–1056
Liu K, Chen YQ, Domański PD, Zhang X (2018) A novel method for control performance assessment with fractional order signal processing and its application to semiconductor manufacturing. Algorithms 11(7)
Meng D, Zhao Q, Xu Z (2012) Improve robustness of sparse PCA by \({L}_1\)-norm maximization. Pattern Recogn 45:487–497
Turkmen AS, Billor N (2013) Influence function analysis for the robust partial least squares (RoPLS) estimator. Commun Stat-Theory Methods 42:2818–2836
Wang H (2000) Bounded dynamic stochastic systems: modeling and control. Springer, London
Wang J, Zhong B, Zhou J (2017) Quality-relevant fault monitoring based on locality preserving partial least squares statistical models. Ind Eng Chem Res 56:7009–7020
Wang Y, Karimi HR, Shen H, Fang Z, Liu M (2019) Fuzzy-model-based sliding mode control of nonlinear descriptor systems. IEEE Trans Cybern 49(9):3409–3419
Zhou JL, Zhang SL, Zhang H, Wang J (2018) A quality-related statistical process monitoring method based on global plus local projection to latent structures. Ind Eng Chem Res 57:5323–5337
Zou H, Hastie T, Tibshirani R (2006) Sparse principal component analysis. J Comput Graph Stat 15:265–286
Author information
Authors and Affiliations
Corresponding author
Rights and permissions
Open Access This chapter is licensed under the terms of the Creative Commons Attribution 4.0 International License (http://creativecommons.org/licenses/by/4.0/), which permits use, sharing, adaptation, distribution and reproduction in any medium or format, as long as you give appropriate credit to the original author(s) and the source, provide a link to the Creative Commons license and indicate if changes were made.
The images or other third party material in this chapter are included in the chapter's Creative Commons license, unless indicated otherwise in a credit line to the material. If material is not included in the chapter's Creative Commons license and your intended use is not permitted by statutory regulation or exceeds the permitted use, you will need to obtain permission directly from the copyright holder.
Copyright information
© 2022 The Author(s)
About this chapter

Cite this chapter
Wang, J., Zhou, J., Chen, X. (2022). New Robust Projection to Latent Structure. In: Data-Driven Fault Detection and Reasoning for Industrial Monitoring. Intelligent Control and Learning Systems, vol 3. Springer, Singapore. https://doi.org/10.1007/978-981-16-8044-1_12
Download citation
DOI: https://doi.org/10.1007/978-981-16-8044-1_12
Published:
Publisher Name: Springer, Singapore
Print ISBN: 978-981-16-8043-4
Online ISBN: 978-981-16-8044-1
eBook Packages: EngineeringEngineering (R0)