
Abstract
In this chapter, we present an advanced machine learning strategy to detect objects and characterize traffic dynamics in complex urban areas by airborne LiDAR. Both static and dynamical properties of large-scale urban areas can be characterized in a highly automatic way. First, LiDAR point clouds are colorized by co-registration with images if available. After that, all data points are grid-fitted into the raster format in order to facilitate acquiring spatial context information per-pixel or per-point. Then, various spatial-statistical and spectral features can be extracted using a cuboid volumetric neighborhood. The most important features highlighted by the feature-relevance assessment, such as LiDAR intensity, NDVI, and planarity or covariance-based features, are selected to span the feature space for the AdaBoost classifier. Classification results as labeled points or pixels are acquired based on pre-selected training data for the objects of building, tree, vehicle, and natural ground. Based on the urban classification results, traffic-related vehicle motion can further be indicated and determined by analyzing and inverting the motion artifact model pertinent to airborne LiDAR. The performance of the developed strategy towards detecting various urban objects is extensively evaluated using both public ISPRS benchmarks and peculiar experimental datasets, which were acquired across European and Canadian downtown areas. Both semantic and geometric criteria are used to assess the experimental results at both per-pixel and per-object levels. In the datasets of typical city areas requiring co-registration of imagery and LiDAR point clouds a priori, the AdaBoost classifier achieves a detection accuracy of up to 90% for buildings, up to 72% for trees, and up to 80% for natural ground, while a low and robust false-positive rate is observed for all the test sites regardless of object class to be evaluated. Both theoretical and simulated studies for performance analysis show that the velocity estimation of fast-moving vehicles is promising and accurate, whereas slow-moving ones are hard to distinguish and yet estimated with acceptable velocity accuracy. Moreover, the point density of ALS data tends to be related to system performance. The velocity can be estimated with high accuracy for nearly all possible observation geometries except for those vehicles moving in or (quasi-)along the track. By comparative performance analysis of the test sites, the performance and consistent reliability of the developed strategy for the detection and characterization of urban objects and traffic dynamics from airborne LiDAR data based on selected features was validated and achieved.
You have full access to this open access chapter, Download chapter PDF
1 Introduction
Urban scene classification and object detection are important topics in the field of remote sensing. Recently, point cloud data generated by LiDAR sensors and multispectral aerial imagery have become two important data sources for urban scene analysis. While multispectral aerial imagery with fine resolution provides detailed spectral texture information about the surface, point cloud data is more capable of presenting the geometrical characteristics of objects.
LiDAR has become a common active surveying method to directly realize the digital 3D representation of targets through a laser ranging, positioning, and orientation system (POS). Based on different platforms, LiDAR technology can cover terrestrial, mobile, airborne, and spaceborne applications. This chapter focuses on airborne applications. Airborne LiDAR (ALS) has attracted plenty of research attention for more than two decades. The ALS technique has been widely applied in diverse fields such as forest mapping (Næsset and Gobakken 2008; Reitberger et al. 2008; Zhao et al. 2018), coast monitoring (Earlie et al. 2015; Bazzichetto et al. 2016), smart urban applications (Garnett and Adams 2018) and so on. As it can directly derive accurate and highly detailed 3D surface information, and because more than one half of the population resides in urban areas, ALS was able to achieve significant applications in urban areas such as urban modeling (Zhou and Neumann 2008; Lafarge and Mallet 2012; Chen et al. 2019), land cover and land use classification (Azadbakht et al. 2018; Balado et al. 2018; Wang et al. 2019), environment monitoring and tree mapping (Liu et al. 2017; Degerickx et al. 2018; Lafortezza and Giannico 2019), urban population estimation (Tomás et al. 2016), energy conservation (Jochem et al. 2009; Dawood et al. 2017) and so on. Urban modeling with ALS data includes the 3D reconstruction of buildings (Bonczak and Kontokosta 2019; Li et al. 2019), roads (Chen and Lo 2009), bridges (Cheng et al. 2014), powerlines (Wang et al. 2017) and so on. Very recently, ALS data are also helpful to improve accuracy for urban mapping and land cover classification. Degerickx et al. (2019) applied ALS data as an additional data source to enhance the performance of multiple endmember spectral mixture analysis for urban land-cover classification using hyperspectral and multispectral images, and found that implementing height distribution information from ALS data as a basis for additional fraction constraints at the pixel level could significantly reduce spectral confusion between spectrally similar, but structurally different land-cover classes. Accurate and highly detailed height information from ALS data is also used to enhance urban mapping accuracy based on the 3D rational polynomial coefficient model (Rizeei and Pradhan 2019).
Besides the above-mentioned applications, ALS can also be used to detect and monitor dynamic objects. Compared to traditional optical imagery, airborne LiDAR data are characterized by involving not only rich spatial but also temporal information. It is theoretically possible to extract vehicles from single-pass airborne LiDAR data, to identify the vehicle motion, and to derive the vehicle’s velocity and direction based on the motion artifacts effect. Thus, besides common applications of airborne LiDAR, it should also be regarded as a demonstrator for traffic monitoring from the air.
Urban scene analysis can be categorized by different object types, different data sources, and also algorithms. During the past decades, more work referring to urban scene analysis has concentrated on the classification or detection of specified objects. Much marvelous research (Clode et al. 2007; Fauvel 2007; Sohn and Dowman 2007; Yao and Stilla 2010; Guo et al. 2011; Xiao et al. 2012) has been done in extracting objects like buildings and roads, while trees and vehicles are also interesting objects for intelligent monitoring of natural resources and traffic in urban areas (Höfle and Hollaus 2010; Yao et al. 2011). However, detection and modeling of diverse urban objects may involve more complicated situations due to the various characteristics and appearances of the objects. As ALS data became widely available for the task of creating 3D city models, there was an increasing amount of research on developing automatic approaches to object detection from images and LiDAR data, which showed the great potential of 3D target modeling and surface characterization in urban areas (Schenk and Csatho 2007; Mastin et al. 2009). In this chapter, we focus on analyzing airborne LiDAR data by the adaptive boosting (AdaBoost) classification technique for urban object detection based on selected spatial and radiometric features. In this chapter, we will develop and validate a robust classification strategy for urban object detection through fusing LiDAR point clouds and imagery.
As mentioned above, ALS data have become an important source for object extraction and reconstruction for various applications such as urban and vegetation analysis. However, traffic monitoring remains one of the few fields which are still not intensively analyzed in the LiDAR community. There are several motivations driving us to perform traffic analysis using airborne LiDAR in urban areas:
-
The penetration ability of laser rays towards volume-scattering objects (e.g., trees) can improve vehicle detection;
-
The motion artifacts generated by the linear scanning mechanism of airborne LiDAR can determine object motion;
-
The explicit extraction of vehicles can refine the results of operations such as DTM filtering and road detection where vehicles are regarded as stubborn disturbances.
The task of detecting moving vehicles with ALS has been addressed in several scientific publications. The research most relevant to our work came from Toth and Grejner-Brzezinska (2006). In this chapter, an airborne laser scanner coupled with a digital frame camera was adopted to analyze transportation corridors and acquire traffic flow information. However, the testing of this system was limited to a motorway; the same problem needs to be investigated in more challenging regions using the system equipped solely with LiDAR. In the contribution from Yao et al. (2010a), a context-guided approach based on gridded ALS data was used to delineate single instances of vehicle objects and results demonstrated the feasibility of extracting vehicles for motion analysis. A vehicle extraction method was presented, running directly on LiDAR point clouds that integrate height, edge, and point shape information in a segmentation step to improve the vehicle extraction through object-based classification (Yao et al. 2011). Based on the extracted vehicles, Yao et al. (2010b) proposed a complete procedure to distinguish vehicle motion states and to estimate the velocity of moving vehicles by parameterizing, classifying, and inverting shape deformation features. In contrast to applications monitoring military traffic, civilian applications include more constraints regarding the objects to be detected. We can assume that vehicles are bound to roads on a known road network, which might not be true in military applications. Such knowledge provides a priori information for motion estimation.
This chapter concerns the detection of selected urban objects and the characterization of traffic dynamics with ALS data. In Sect. 22.2, a robust and efficient supervised learning method for detecting urban objects is proposed, and the analysis of urban traffic dynamics is performed in Sect. 22.3. Section 22.4 presents the experiment and results of detecting urban objects and their dynamics. Finally, conclusions are drawn in Sect. 22.5.
2 Detection of Urban Objects with ALS and Co-registered Imagery
2.1 General Strategy
The workflow of the entire strategy for detecting three urban object classes (buildings, trees, and natural ground) with ALS data and co-registered images is depicted in Fig. 22.1.
Overview of the entire strategy
2.2 Feature Derivation
In this chapter, we combine point clouds and image data, while multispectral and LiDAR intensity information is also available. In total 13 features are defined (Wei et al. 2012).
2.2.1 Basic Features
The so-called basic features contain the features that can be directly retrieved from the point cloud and image data, respectively:
-
R, G, B: The three color channels of the digital image. As two data sets are used for experiments and one of them (named data set Vaihingen) provides color-infrared images, features R, G, B stand for infrared, red, and green spectra, But in the other data set (Toronto), the features R, G, and B are normal bands of Red, Green, and Blue. To avoid confusion, we always use the symbols R, G, B to indicate the three color channels of the image in order.
-
NDVI: Normalized Difference Vegetation Index, defined as:
$${\it{NDVI}} = \frac{{({\it{NIR}} - {\it{VIS}})}}{{({\it{NIR}} + {\it{VIS}})}}$$(22.1)NDVI can assess whether the target being observed contains green vegetation or not. This feature is specified for data set Vaihingen because it provides color-infrared imagery.
-
Z: The vertical coordinate of each point in the LiDAR data, as the topography of datasets used here, is assumed to be flat.
-
I: Pulse intensity, which is provided by the LiDAR system for each point.
2.2.2 Spatial Context Features
Based on the basic features, we intend to extract more features. Therefore, a 3D cuboid neighborhood is defined with the help of a 2D square with radius of 1.25 m in horizontal dimension as shown in Fig. 22.2. All points located within the cell volume will be counted as the neighbors; the value 1.25 m is chosen empirically.

The 3D cuboid neighborhood used to acquire spatial context features
-
∆Z: Height difference between the highest and lowest points within the cuboid neighborhood.
-
σZ: standard deviation of height of points within the cuboid neighborhood.
-
∆I: Intensity difference between points having the highest and lowest intensities within the cuboid neighborhood.
-
σI: Standard deviation of intensity of points within the cuboid neighborhood.
-
E: Entropy, here being different from the normal entropy of images, we measure the entropy using LiDAR intensities Ik of the points within the cuboid neighborhood by Eq. 22.2 with K being the number of neighbors:
$$E = \sum\limits_{k = 1}^{K} {\left[ {\left( { - I_{k} } \right) \cdot \log_{2}^{{I_{k} }} } \right]}$$(22.2)
The following two features O and P are based on the three eigenvalues of the covariance matrix from the xyz coordinates of points within the cuboid neighborhood. The three eigenvalues \(\lambda_{1}\), \(\lambda_{2}\), and \(\lambda_{3}\) are arranged in descending order, and they can present the local tridimensional structure. This allows us to distinguish between a linear, a planar, or a volumetric distribution of the points.
-
O: Omnivariance, which indicates the distribution of points in the cuboid neighborhood. It is defined as:
$$O = \sqrt[3]{{\prod\limits_{i = 1}^{3} {\lambda_{i} } }}$$(22.3) -
P: Planarity, defined as:
$$P = \left( {\lambda_{2} - \lambda_{3} } \right)/\lambda_{1}$$(22.4)
\(P\) has high value for roofs and ground, but low values for vegetation.
2.3 AdaBoost Classification
AdaBoost is an abbreviation for adaptive boosting (Freund and Schapire 1999), which is an improved version of boosting. AdaBoost is an attractive and powerful supervised learning algorithm of machine learning and it has been successfully applied in both classification and regression cases. For classification cases, AdaBoost is adapted to take full advantage of the weak learners and solves the problem of combining a bundle of weak classifiers to create a strong classifier which is arbitrarily well correlated with the true classification. It consists of iteratively learning weak classifiers with respect to a distribution and adding them to a final strong classifier. Once a weak learner is added, the data are reweighted according to the weak classifier’s accuracy; misclassified samples gain weight and correctly classified samples reduce weight. No other requirement is essential for the weak learners used in the AdaBoost except that their classification accuracy is better than the random classification, which means that the weak learners only need to achieve a classification accuracy better than 50%. In this chapter, we use an open-source AdaBoost toolbox with one tree weak learner CART (classification and regression tree), more details of which can be found in the reference (Freund and Schapire 1999).
Like other supervised learning algorithms, AdaBoost contains two phases as well: training and prediction. In the training phase, it repeatedly trains T weak classifiers through T rounds. In this chapter we implemented the multiclass classification task through iterating corresponding binary classifiers, as shown in the following pseudocode for the binary classification:
The T weak classifiers are combined and output-weighted as follows:
where the sgn function is defined as:
In the above, pseudocode \(\left( {x_{i} ,y_{i} } \right)\) represents the \(i{\text{th}}\) training sample with \(x_{i}\) standing for its feature vector and \(y_{i}\) for its class type; \(m\) represents the amount of training data; \(W_{t}^{i}\) is a weight for the \(i{\text{th}}\) training sample being selected to train the \(t{\text{th}}\) classifier \(h^{t}\) and \(W_{t}\) is a vector of \(W_{t}^{i}\); \(\varepsilon_{t}\) is the weighted prediction error of \(h^{t}\); \(\alpha_{t}\) is the weight coefficient for updating the sample distribution; the value of \(I\left( {h_{t}^{i} (x_{i} ) \ne y_{i} } \right)\) is 1 if \(h_{t}^{i} (x_{i} ) \ne y_{i}\), else it equals 0; \(Z_{t}\) is a normalization factor. At beginning, each sample is assigned an equal weight equal to \(W_{1}^{i} = 1/m\), which means that each training sample is selected with the same probability to train \(h^{{1}}\). In the \(t{\text{th}}\) training round, the AdaBoost algorithm updates \(W_{t + 1}^{i}\) as follows: training samples correctly identified by classifier \(h_{t}\) are weighted less while those incorrectly identified are weighted more. Then when training \(h^{t + 1}\), the algorithm tends to select samples wrongly classified by previous classifiers with higher probability. After T rounds of training, T-weak classifiers are trained and finally combined into a weighted classifier \(H\left( x \right)\) as the training phase’s output, which has better prediction performance.
The prediction phase uses the combined classifier for classification. Compared to boosting, AdaBoost two advantages for learning a more accurate classifier. First, for each weak classifier’s training, boosting randomly chooses training samples, while AdaBoost chooses samples misclassified in the previous training rounds with greater probability. Thus, AdaBoost can better train the classifier. Second, AdaBoost determines each sample’s classification label through weighting each classifier’s output, which makes an accurate classifier contribute more to the final classification result.
3 Detection of Urban Traffic Dynamics with ALS Data
In this section, we give a brief review of deriving the theory for detecting object dynamics in ALS. We refer to the dimension perpendicular to the sensor heading synonymously as across-track. The dimension along the sensor path will be denoted by a along-track.
3.1 Artifacts Effect of Vehicle Motion in ALS Data
In order to assess the feasibility of extracting information on traffic dynamics from airborne LiDAR sensors installed on the airborne platform, the main characteristics of the sensor, including the data formation method, should be considered first. In most airborne LiDAR scanning processes, exclusive of flash LiDAR which are predominantly based on mechanical scanning, a rotating laser pointer rapidly scans the Earth’s surface with continuous scan angles during flight. While the sensor is moving it transmits laser pulses at constant intervals given by the pulse repetition frequency (PRF) and receives the echoes. With respect to moving objects, the fundamental difference between scanning and the frame camera model is the presence of motion artifacts in the scanner data. Due to short sampling time (camera exposure), the imagery preserves the shape of moving objects; if the relative speed between the sensor and the object is significant then increased motion blurring may occur. In contrast, scanning will always produce motion artifacts, since the distance between sensor and target is usually calculated based on the stationary-world assumption; fast-moving objects violate this assumption and therefore image the target incorrectly depending on the relative motion between the sensor and the object. The dependency can be seen by adding the temporal component into the range equation of the LiDAR sensor. Here, it is assumed that the sampling rate is consistent among all the vehicles independent of the scan angle. That is to say that all the vehicles are scanned with enough points to represent their shape artifacts.
In Fig. 22.3a the geometry of data acquisition is shown. The sensor is flying at a certain altitude along the dotted arrow. An example of shape artifacts generated by moving objects is also depicted in Fig. 22.3b, where the black dotted box indicates the vehicle shape obtained in the scanning process of airborne LiDAR while the original vehicle is depicted as a rectangle nearby. It can be perceived that the moving vehicle is imaged as a stretched parallelogram. Let \(\theta_{v}\) be the intersection angle between the moving directions of sensor and vehicle where \(\theta_{v} \in \left[ {0^{ \circ } ,360^{ \circ } } \right]\), vL and v the velocity of aircraft and vehicle respectively, ls and lv the sensed and original lengths of the vehicle, respectively; and \(\theta_{SA}\) the shearing angle that accounts for the deformation of the vehicle as a parallelogram. The analytic relations between shape artifacts and object-movement parameters can be derived as:

Moving objects undergo the scanning of airborne LiDAR. Copyright © 2010 IEEE, reproduced by permission
where \(\theta_{SA} \in \left( {0^{ \circ } \,180^{ \circ } } \right)\) and is found as the left-bottom angle of the observed vehicle.
For the sake of full understanding of the appearance of moving objects in the airborne LiDAR data, object motions are to be divided into the following different components and investigated for their respective influences on the data artifacts generated.
First, the target is assumed to move with constant velocity \(v_{a}\) following the along-track direction, which leads to the stretching effect of the object shape depending on the relative velocity between target and sensor as illustrated in Fig. 22.4.

Along-track object motion. Copyright © 2010 IEEE, reproduced by permission
The analytic relation between the object velocity in along-track direction \(v_{a}\) and the observed stretched length \(l_{s}\) thus can be summarized in Eq. 22.9. The relation in Eq. 22.9 is further modified to Eq. 22.10 which explicitly connects \(v_{a}\) with the variation in the aspect ratio of vehicle shape in a mathematical way, thereby making motion detection and velocity estimation more feasible and reliable:
where \(Ar_{s}\) is the sensed aspect ratio of the vehicle in ALS data while \(Ar\) is the original aspect ratio of the vehicle and wv is the width of the vehicle.
Secondly, the target is assumed to move in the across-track direction with a constant velocity \(v_{c}\). This results in a scanline-wise linear shift of laser footprints that hit upon the target in the direction of movement when the sensor is sweeping over so that the observed vehicle shape in ALS data is deformed (sheared) to a certain extent as illustrated in Fig. 22.5.

Across-track object motion. Copyright © 2010 IEEE, reproduced by permission
Let \(v_{c}\) be the across-track motion component of the object velocity. Since \(v_{c} = v \cdot \sin \left( {\theta_{v} } \right)\), Eq. 22.8 can be rewritten as Eq. 22.11 for describing the analytic relation between the object velocity \(v_{c}\) and the observed shearing angle \(\theta_{SA}\) through the sensor velocity \(v_{L}\) and the intersection angle \(\theta_{v}\):
3.2 Detection of Moving Vehicles
All of the effects of moving objects described above can be exploited to not only detect vehicles’ movement but also measure their velocity. Our scheme for vehicle motion detection relies on a strategy consisting of two basic modules successively executed: (1) vehicle extraction; and (2) determination of the motion state.
For vehicle extraction, we used a hybrid strategy (Fig. 22.6) that integrates a 3D segmentation-based classification method with a context-guided approach. For a detailed analysis of vehicle detection, we refer the readers to Yao et al. (2010a, 2011).

Workflow for vehicle extraction
To determine the motion state, a support vector machine (SVM) classification-based method is adopted. A set of vehicle points can be geometrically described as a spoke model with control parameters, whose configuration can be formulated as
where k denotes the number of spokes in the model. It can be seen that the vehicle shape variability can be represented as a two-dimensional feature space (if the number of spokes k = 1). Thus, the similarity between vehicle instances of different motion states needs to be measured by a nonlinear metric. The SVM has advantages in nonlinear recognition problems and finds an optimal linear hyperplane in a higher dimensional feature space that is nonlinear in the original input space. The trick of using a kernel avoids direct evaluation in the feature space of higher dimension by computing it through the kernel function with feature vectors in the input space. The SVM classifier can be used here again to perform binary classification on those vehicles which still remain after excluding the ones of uncertain state obtained by the shape parameterization step. In addition, the classification framework for distinguishing 3D shape categories (Fletcher et al. 2003) can be adapted to the motion classification schema based on exploiting the vehicle shape features.
3.3 Concept for Vehicle Velocity Estimation with ALS Data
The estimation of the velocity of detected moving vehicles can be done based on all motion artifacts effects in a single pass of ALS data by inverting the motion artifacts model to relate the velocity with other observed and known parameters. Thus, different measurements and derivations might be used to estimate the velocity. The estimation scheme can be initially divided into two main categories, depending on whether the moving direction of vehicles is known or not:
First, given the intersection angle which can be further separated into the following three situations using respective observations to estimate the velocity:
-
(a)
The measure for shearing angle of the detected moving vehicles from their original orthogonal shape of rectangles;
-
(b)
The measure for the stretching effect of detected moving vehicles from their original size; and
-
(c)
The combination of the along-track and across-track velocity components which are estimated based on the above-mentioned effects, respectively.
Second, if the intersection angle is not given:
-
(a)
The solution to a system of bivariate equations constructed by uniting the two formulas.
The three methods in the first category assume that the moving directions of vehicles are given beforehand, whereas the last one from the second category does not. To estimate the velocity, the first three methods either utilize the shape stretching or shearing effect or combine them together when applicable. For the last case, the moving direction of vehicles can be estimated along with the velocity by uniting the variable of velocity with the variable of the intersection angle to build a system of bivariate equations and solving it, thereby giving the motion estimation great flexibility to deal with many arduous cases encountered in real-life scenarios. That means that not only the quantity but also the direction of vehicles’ motion can be derived. All possible approaches have their advantages and disadvantages and differ in the accuracy of their results, which are to be analyzed and evaluated in the following subsections, respectively.
3.3.1 Velocity Estimation Based on the Across-Track Deformation Effect
The shearing angle of moving vehicles caused by the across-track deformation allows for direct access to the velocity only if the moving direction is known a priori and input as an observation. Still, information about the orientation of the road axis relative to the vehicle motion is needed to derive the real velocity of vehicles. The velocity estimate v of the vehicle based on the shearing effect of its shape is derived by inverting Eq. 22.8 as
The value of the intersection angle \(\theta_{{v}}\) can be determined based on principal axis measurements of vehicle points as the flight direction of the airborne LiDAR sensor can always be assumed to be known thanks to sustained navigation systems. Given Eq. 22.13 which shows that the accuracy of the velocity estimate based on the across-track deformation effect \(\sigma^{c}_{v}\) is a function of the quality of the moving vehicle’s heading angle relative to the sensor flight path \(\theta_{v}\) and the accuracy of the shearing angle measurement \(\theta_{SA}\), the standard deviation of the velocity estimate is calculated using the error propagation law (Wolf and Ghilani 1997) and derived as
with \(v_{L}\) being the instantaneous flying velocity of the sensor system.
3.3.2 Velocity Estimation Based on Along-Track Stretching Effect
Besides the above mentioned approach, the velocity of a moving vehicle can be derived by measuring its along-track stretching effect from its original vehicle size. The functional relation is given by:
where \(Ar_{s}\) = \(l_{s} /w_{v}\) is the sensed aspect ratio of the moving vehicle, while Ar is the original aspect ratio and assumed to be constant. The accuracy of the velocity estimate based on the along-track stretching effect \(\sigma_{v}^{a}\) is a function of the quality of the aspect ratio measurement for detected moving vehicles and the accuracy of the vehicle’s heading relative to the sensor flight path. \(\sigma_{v}^{a}\) can be calculated by the error propagation law as follows:
3.3.3 Velocity Estimation Based on Combining Two Velocity Components
Both estimation methods presented above might fail to give a reliable velocity estimate if vehicles are moving in such a direction that generated deformation effects for the vehicle shape are not dominated by either one of what the two moving components account for (e.g., a moving vehicle with intersection angle \(\theta_{v}\) = 35° and velocity v = 40 km/h). To fill this gap and enable a velocity estimate in an arbitrary traffic environment, it is proposed to use both shape deformation effects for estimating velocities. The functional dependence of the velocity estimate can be given by the sum of squares of the two motion components, which are derived based on two the shape deformation parameters Ars and \(\theta_{SA}\), respectively:
and where va and vc are along and across-track motion components. The accuracy of the velocity estimate based on combining the two components \(\sigma_{v}^{a + c}\) is a function of the quality of the along-track and across-track motion measurements for the detected moving vehicle and \(\sigma_{v}^{a + c}\) can be first calculated with respect to these two motion components by the error propagation law as:
where \(\sigma_{{v_{a} }}\) and \(\sigma_{{v_{c} }}\) are the standard deviations of along- and across-track motion derivations, respectively. They can be further decomposed into the accuracy with respect to the three observations concerning the vehicle shape and motion parameters based on Eq. 22.18. Using the error propagation law, \(\sigma_{{v_{a} }}\) and \(\sigma_{{v_{c} }}\) are inferred as:
Finally, after substituting Eqs. 22.20 and 22.21 into Eq. 22.19, the error propagation relation for the velocity estimate is based on combining the two velocity components with respect to the three variables Ars, \(\theta_{SA}\), and \(\theta_{v}\) is derived.
3.3.4 Joint Estimation of Vehicle Velocity and Direction by Solving Simultaneous Equations
So far, all of the estimation methods are not able to give velocity estimates if they are moving in an unknown direction or their moving detections cannot be accurately determined in advance. To solve this problem, we propose to jointly consider velocities and the intersection angle \({\theta_{v} }\) as unknown parameters simultaneously, with the variables describing the deformation effects caused by the motion components as observations. Actually, two analytic formulas for the motion artifacts model can be directly viewed as an equation system to which the velocity and the intersection angle are formulated as a set of solutions. This system of bivariate equations relating unknown parameters to observations is given by:
The system is to be solved using the substitution method. First, transform the second sub-equation of Eq. 22.22 into
and substitute it into the first sub-equation of Eq. 22.22, which has been converted into a more solution-friendly expression in advance:
After substitution, the expression of Eq. 22.24 can be rewritten as:
Further, we transform to facilitate the solution and get:
Finally, substitute the second sub-equation in Eq. 22.26 into Eq. 22.23 again and the velocity estimate of the moving vehicle v can be derived as follows:
It can be seen that the velocity of a moving vehicle can be directly estimated based on the shape deformation parameters without the need to know the intersection angle \(\theta_{v}\) a priori. \(\theta_{v}\) can be estimated as an intermediate variable solely based on two shape deformation parameters Ars, and \(\theta_{SA}\) and is independent of the sensor flight velocity vL. For accuracy analysis, two accuracy measures can be estimated, namely the moving direction and the velocity. The accuracies of the intersection angle \(\sigma_{{\theta_{v} }}\) and the velocity estimate \(\sigma_{v}\) can be derived as functions of the quality of the along-track stretching and across-track shearing measures. Equivalently, \(\sigma_{{\theta_{v} }}\) and \(\sigma_{v}\) can be calculated with respect to the two deformation parameters by the error propagation law as:
The empirical error values for two observations \(\sigma_{Ars}\) and \(\sigma _{{\theta_{{SA}} }}\) was also assessed to the same values as used in the preceding methods. The accuracies of intersection angle \(\sigma_{{\theta_{v} }}\) and velocity estimates \(\sigma_{v}\) based on the joint estimation of moving velocity and direction are derived by inserting the empirical errors for the observations into Eqs. 22.28 and 22.29. The error of intersection angle \(\sigma_{{\theta_{v} }}\) is shown in Fig. 22.7a as a function of vehicle velocity and relative angle between vehicle heading and the sensor flying path; the relative error is indicated in Fig. 22.7b. The (relative) velocity errors \(\sigma_{v}\) and \(\sigma_{v} /v\) are shown in Fig. 22.8 as a function of vehicle velocity v and intersection angle \(\theta_{v}\). It can be seen from the plots that most of the vehicles on road sections of urban areas could not allow for high accuracy of moving direction estimation (\(\sigma_{{\theta_{v} }} /\theta_{v}\) < 25%) unless they move a little bit faster (>70 km/h). The high accuracy of velocity estimates could be only guaranteed for vehicles that obviously don’t travel in an across-track direction (\(\theta_{v}\) < 75%). The overall accuracy of velocity estimation derived in this way is slightly degraded compared to other solutions where the moving direction is given beforehand.

a Relative error of the intersection angle \(\sigma_{\theta v} /\theta_{v}\) of intersection angles obtained based on the joint estimation of velocity and heading as a function of target velocity v and the intersection angle \(\theta_{v}\), \(\sigma_{\theta v} /\theta_{v}\) is given in %; b Vehicle velocity v (given in km/h) as a function of \(\sigma_{\theta v} /\theta_{v}\) and \(\theta_{v}\)

a Relative velocity error \(\sigma_{v} /v\) of vehicle velocities obtained based on the joint estimation of velocity and heading as a function of target velocity v and the intersection angle \(\theta_{v}\), \(\sigma_{v} /v\) is given in %; b Vehicle velocity v (given in km/h) as a function of \(\sigma_{v} /v\) and \(\theta_{v}\).
4 Experiments and Results
4.1 Detection of Urban Objects with ALS Data Associated with Aerial Imagery
4.1.1 Experimental Data for Urban Objects Detection
Two datasets were used in this chapter for an urban scene object detection test, which both include aerial images and airborne LiDAR data. The first dataset (yellow areas in Fig. 22.9) was captured over Vaihingen in Germany and is a subset of the data used for the test of digital aerial cameras carried out by the German Association of Photogrammetry and Remote Sensing (DGPF; Cramer 2010). The other dataset covers an area of about 1.45 km2 in the central area of the City of Toronto in Canada (red areas in Fig. 22.10).

Three test sites in Vaihingen: a Area 1; b Area 2; c Area 3

Two test sites in Toronto: a Area 4; b Area 5
4.1.2 Experimental Design for Urban Objects Detection
The following steps are considered in this experiment:
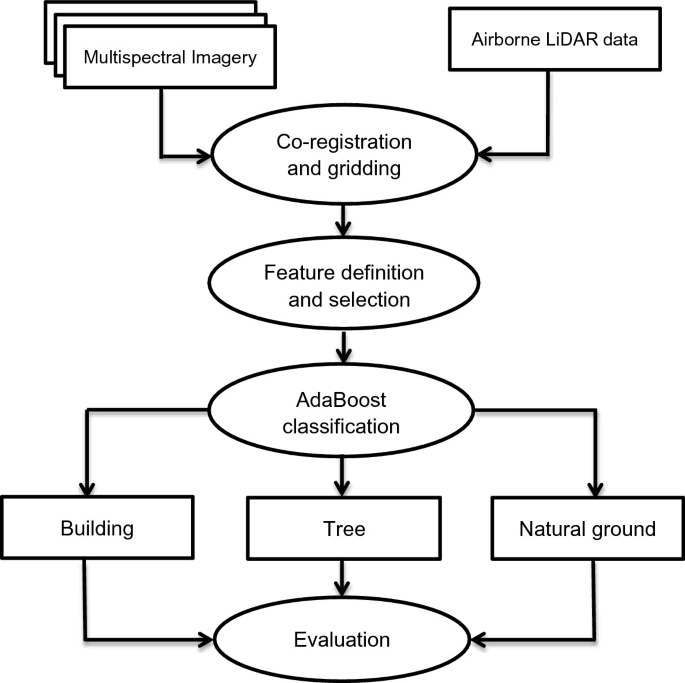
Data preprocessing. For both datasets, the aerial images and airborne LiDAR data were acquired at different times. Thus, they are co-registered by geometrical back-projecting the point cloud into the image domain with available orientation parameters. After that, all data points are grid-fitted into the raster format in order to facilitate acquiring spatial context information per-pixel or point. We apply grid-fitting using an interval of 0.5 m on the ground, ensuring that each resampled pixel can be allocated at least with one LiDAR point.
Feature selection. For Dataset 1, as color-infrared images, point cloud data including intensity information are available. All 13 features (R, G, B, NDVI, Z, I, ∆Z, σZ, ∆I, σI, E, O, and P) introduced in Sect. 2.2 are extracted and used for the object detection test. For Dataset 2, there is no infrared band image and thus 12 features are used in the experiment only, without NDVI.
Training samples’ selection. Since training samples are essential and important for supervised learning classification, it is necessary to adopt a suitable approach to derive valid samples considering the characteristics of the used classifier. In this chapter, AdaBoost using the one tree weak learner (CART) is adopted as the final strong classifier (Freund and Schapire 1999), which chooses training samples randomly to some extent. Therefore, for each test site, we first classify the whole test area manually and then randomly choose 10% of the whole test area’s corresponding labeled samples as input training samples for the AdaBoost classifier.
Classifier control and classification procedure. This chapter uses the binary AdaBoost classifier to detect buildings, natural ground, and trees from the urban scene. To do so, the binary AdaBoost classifier is iteratively generated and applied: (1) the classifier for detecting building is generated by training the randomly chosen building samples and non-building samples corresponding to 10% of the whole data amount, and applied to classify the building from the urban scene; (2) 10% natural and non-natural ground samples are randomly selected to train and generate the classifier for natural ground detection, which is then used to separate the natural ground from the complex urban scene; (3) tree detection proceeds by using the binary AdaBoost classifier which is trained on the randomly selected 10% tree and non-tree samples. To test and validate the methods, several areas are chosen for the object detection test according to the actual urban scene. For the building detection, all the five test areas (three in Vaihingen and two in downtown Toronto) are used, whereas Areas 1–4 are used to test the detection of natural ground. And finally, Areas 1–3 in Dataset 1 are used for the detection of trees. The implementation code of the AdaBoost classifier used in this chapter was adapted from that published by Vezhnevets (2005).
Evaluation methods. The evaluation of object detection results is obtained from the ISPRS Test Project on Urban Classification and 3D Building Reconstruction, which conducts the evaluation based on the method described by Rutzinger et al. (2009) and Rottensteiner et al. (2005). The software used for evaluation reads in the reference and the object detection results, converts them into a label image, and then carries out the evaluation as described by Rottensteiner et al. (2013). Since the output of binary AdaBoost classifiers consists of samples labeled by class but not segmented objects, the topological clarification for detected objects described by Rutzinger et al. (2009) is applied to perform the object-based evaluation, which was automatically implemented by the evaluation software. The evaluation output consists of a text file containing the evaluation results and a few images that visualize these results, which include many accuracy indexes such as geometric accuracy, pixel-based completeness, and correctness, object-based completeness, and correctness, balanced completeness and correctness, etc., and the middle evaluation includes attributes like an evaluation on a per-object level as a function of the object area, etc.
This chapter applies the binary AdaBoost classifier by fusing the image and LiDAR features to detect buildings, natural ground, and trees in several different complex urban scenes. The detection accuracies of buildings, natural ground, and trees are presented in Tables 22.1, 22.2, and 22.3, respectively. In these tables pixel-based evaluation accuracy (Compl area [%], Corr area [%], Pix-Quality [%]), object-based evaluation accuracy (Compl obj [%], Corr obj [%], obj-Quality [%]), balanced evaluation accuracy (Compl obj 50 [%], Corr obj 50 [%], obj-Quality 50 [%]), and detected objects’ geometric accuracy (RMS [m]) are listed for evaluating the detection result of buildings in Areas 1–5, natural ground in Areas 1–4, and trees in Areas 1–3, respectively.
4.1.3 Results of Urban Objects Detection
As stated in Sect. 22.2, this chapter applies the binary AdaBoost classifier by fusing the image and LiDAR features to detect buildings, natural ground, and trees in several different complex urban scenes. The detection accuracy of buildings, natural ground, and trees are presented in Table 22.1, Table 22.2, and Table 22.3 respectively. In Tables 22.1, 22.2 and 22.3, pixel-based evaluation accuracy (Compl area [%],Corr area [%], Pix-Quality [%]), object-based evaluation accuracy(Compl obj [%],Corr obj [%], obj-Quality [%]), balanced evaluation accuracy (Compl obj 50 [%], Corr obj 50 [%], obj-Quality 50 [%]) and detected objects’ geometric accuracy (RMS [m]) are listed for evaluating the detection result of buildings in Areas 1–5, natural ground in Areas 1–4, and trees in Areas 1–3, respectively.
Building detection result. It can be noticed from Table 22.1 that all the five test sites obtain 85% or higher pixel-based completeness, while the object-based completeness is lower due to the area of overlap of objects, especially for Test Sites 2 and 3 with object-based completeness of less than 80%. With regard to correctness, the three test sites in Dataset 1 perform better than the two test sites in Dataset 2 with respect to all evaluation aspects: evaluation methods of pixel-based, object-based, and pixel-object balanced. Thus, it can conclude that the building detection of Dataset 1 is more robust than that of Dataset 2. Concerning the geometric aspect, Test Area 2 obtained the best geometric accuracy of RMS 0.9 m, followed by Area 3 with RMS 1.0 m, and Area 1 with RMS 1.2 m, while both test sites in Dataset 2 obtain the worst geometric accuracy with RMS 1.6 m. Among the five test sites, Area 2 achieved the best overall building detection accuracy completeness of 92.5%, correctness of 93.9%, detection quality of 87.2% using pixel-based evaluation, completeness of 100%, correctness of 100%, and detection quality of 100% based on evaluation balanced between pixels and objects, correctness of 100% based on object-based evaluation, and geometric accuracy of RMS 0.9 m. Due to the small number of buildings, three false negatives on detected objects gave Test Site 2 lower completeness than Test Sites 1, 4, and 5 based on object-based evaluation, even though there are more false negatives.
Natural Ground Detection Result. The results of Dataset 1 are better than those of Dataset 2 on all indexes. Concerning the pixel-based evaluation result, the detection completeness is lower than the correctness for all the test sites, while it is the same for the object-based evaluation result except for Test Site 4. For this test site, the object-based correctness is very low compared to the pixel-based correctness, which shows that the natural ground of Test Site 4 is fragmented and cannot be detected well at the object level. Regarding the geometric aspect, Areas 2 and 3 obtain the best geometric accuracy of RMS 1.1 m, followed by Area 1 with RMS 1.3 m, while test site 4 in Dataset 2 obtains the worst geometric accuracy with RMS 1.7 m. Among the four test sites, Site 2 achieves the best overall natural ground detection accuracy with completeness of 80.5%, correctness of 85.7%, detection quality of 71.0% based on pixel-based evaluation, completeness of 83.3%, correctness of 100%, detection quality of 83.3% based on a balanced evaluation of pixels and objects, and geometric accuracy of RMS 1.1 m. Due to the larger number of small-sized natural ground objects and fewer larger ones, Test Site 2 obtains lower detection accuracy using object-based evaluation.
Tree-detection result. Only Dataset 1 was tested. From Table 22.3, it can be noticed that the tree-detection accuracy is lower than 80%, being lower than that of building detection in the same test site. Although the accuracy indexes obtained based on both pixel-based and object-based evaluation are not so good, this is related to the definition of trees in the reference data since the balanced accuracy is good. On the geometric aspect, Area 3 obtains the best geometric accuracy of RMS 1.3 m, followed by Area 1 and 2 with RMS 1.4 m. The geometric accuracy for tree detection is worse than that of both buildings and natural ground, due to the more complex shape of trees in 2D and 3D. Among the three test sites, Area 2 achieves the best overall tree-detection accuracy with the completeness of 72.0%, correctness of 78.5% based on pixel-based evaluation, completeness of 63.0%, correctness of 82.4% based on object-based evaluation, completeness of 89.3%, and correctness of 98.6% using the balanced evaluation of pixels and objects, and geometric accuracy of RMS 1.4 m.
The detection results presented above show that the proposed AdaBoost-based strategy can detect objects very well in complex urban areas based on relevant spatial and spectral features that have been obtained by combining point clouds and image data. First, most detected objects only suffer from errors in boundary regions, especially with respect to buildings in Test Sites 1–3, which means that the proposed method can successfully separate desirable objects from the background using the combined spatial-spectral features. Second, the trees and natural ground can be discriminated efficiently in Dataset 1 in spite of similar spectral features, which demonstrates that the method can take full use of the advantages of fusing features and an ensemble classifier. Third, the detection achieves the best geometric accuracy for buildings, with RMS 0.9 m, partly biased by data co-registration error, which demonstrates the proposed high accuracy of the method. Fourth, larger-sized objects achieve better detection completeness and correctness; for example, all the buildings with area larger than 87.5 m2 are detected correctly for Test Sites 1–3, while some smaller buildings are omitted due to being classified as false positives, which justifies the reliability of the AdaBoost-based strategy for urban objects detection.
4.2 Accuracy Prediction for Vehicle Velocity Estimation Using ALS Aata
To demonstrate the quality of the velocity estimation for real-life scenarios and to deliver quantitative guidance on the planning of LiDAR flight campaigns for traffic analysis, real road networks in urban areas will be used in an experiment to simulate the prediction of velocity and estimate its accuracy. This will be useful for exploiting boundary conditions in applying the proposed strategy in real airborne LiDAR campaigns for traffic analysis. Generally, it can be stated that this simulation has been designed by considering the following points:
-
Validate the feasibility and repeatability of velocity estimation results;
-
Verify the velocity estimation scheme, which provides rational results with sufficient accuracy in a wide range of datasets acquired over urban areas; and
-
Demonstrate the potential of velocity-accuracy analysis to provide valuable guidance on optimizing flight planning for traffic monitoring.
The accuracy of the estimated velocity \(\sigma_{v}\) is simulated for two road network sections north of Munich which represent the most typical scenarios in urban areas. In this area, several main roads and large express roads are situated and are highly frequented during rush hours. For each test site, two general schemes are assumed to exist, where the four different velocity estimators presented above are applied: First, the moving direction of a vehicle relative to the sensor flight path is known (here the moving direction is derived based on the road orientation); and second, the moving direction of the vehicle relative to the sensor flight path is unknown.
As three methods within the first scheme complement each other concerning performance, we finally combined the estimators depending on the relative orientation between the vehicle heading and the sensor flight path to get optimal results. For every relative orientation the estimator that provides the best results is chosen. That means that the maximum of estimated velocity accuracies is assumed to be selected as the accuracy value for a velocity estimate at that road location. Parameters of real flying using the Riegl LMSQ560 sensor have been used in this simulation and an average speed of 120 km/h was assumed (concrete configurations can be found in Table 22.4). The average velocity of moving vehicles on the roads is set to 60 km/h. The error measures for the shearing angle and intersection angle of moving vehicles can be assessed empirically from shape parameterization: for our case, \(\sigma_{Ars}\) = 0.4, \(\sigma_{\theta_{SA}}\) = 2°, and \(\sigma_{\theta_{v}}\) = 2°. The orientation of the roads relative to the planned flying path and the resulting \(\sigma_{v}\) values obtained by combining the estimators in the first scheme are shown in Fig. 22.11a, c, while the resulting values of \(\sigma_{v}\) using second scheme for the same sites are shown in Fig. 22.11b, d. \(\sigma_{v}\) is given in % of the absolute velocity. With the algorithm described earlier, velocities can be estimated with an accuracy better than 10% for about 80% of the investigated road networks. Figure 22.12 indicates which estimator is chosen in which parts of the road network. It shows that the across-track shearing-based estimator (Method 1) provides the best results for large parts of the road network. The along-track stretching-based (Method 2) and combined (Method 3) estimators outperform the across-track shearing-based approach only in areas where the road is extended roughly in the along-track direction (i.e., \(\forall \,\theta _{v} \le 25^{ \circ }\)). For example, in the second test site (Fig. 22.12b), Dachauer Street (in the bottom-left part) requires Method 3 to be used for velocity estimation, whereas one part of Ackermann Street (curved, in the top-left part) requires Method 2 to be used. Moreover, in most parts of the road network, the accuracy of velocity estimation using the first scheme is generally higher than that obtained using the second scheme, especially when vehicles move along a direction that is close to across-track. This is due to the fact that the joint estimation of velocity and moving direction angle can incorporate additional error sources caused by the unknown moving direction of vehicles relative to the sensor flight path, leading to an accumulative error for final velocity estimates.

Simulation of σv for two road networks north of Munich using the velocity estimation schemes: a The estimation accuracy for the first road network in % of the absolute velocity using the second scheme; b The estimation accuracy for the first road network in % of the absolute velocity using the first scheme; c The estimation accuracy for the second road network in % of the absolute velocity using the first scheme; d The estimation accuracy for the second road network in % of the absolute velocity using the second scheme

Indication of velocity estimation methods used for the two road networks under the first scheme for velocity estimation (moving direction relative to sensor flight is known): a Indicating which estimation method is chosen in which parts of the first road network; b Indicating which estimation method is chosen in which parts of the second road network
5 Summary
This chapter is concerned with detecting urban objects and traffic dynamics from ALS data. Urban object detection in complex scenes is still a challenging problem for the communities of both photogrammetry and computer vision. Since LiDAR data and image data are complementary for information extraction, relevant spatial-spectral features extracted from ALS point clouds and image data can be jointly applied to detect urban objects like buildings, natural ground objects, and trees in complex urban environments. To obtain good object detection results, an AdaBoost-based strategy was presented in this chapter. It includes: First, co-registering LiDAR point clouds with images by back-projection with available orientation parameters; Second, grid-fitting of data points into the raster format to facilitate acquiring spatial context information; Third, extracting various spatial-statistical and radiometric features using a cuboid neighborhood; and Fourth, detecting objects including buildings, trees, and natural ground by the trained AdaBoost classifier whose output consists of labeled grids.
The performance of the developed strategy towards detecting buildings, natural ground, and trees in urban areas was comprehensively evaluated using the benchmark datasets provided by ISPRS WGIII/4. Both semantic and geometric criteria were used to assess the experimental results. From the detection results, it can be concluded that the AdaBoost-based classification strategy can detect urban objects reliably and accurately, achieving the best detection accuracy for buildings with completeness of 92.5% and correctness of 93.9%, for natural ground with completeness of 80.5% and correctness of 85.7%, and for tree detection with completeness of 72.5% and correctness of 78.5% based on per-pixel evaluation. The quality indexes for the detection of tree and natural ground, evaluated on per-object level, seem not to be as high as for buildings. Nevertheless, the overall accuracy is high for such complex urban scenes, as can be concluded from the balanced evaluation of pixels and objects. With further research, the detection results might be refined with graph-based optimization, which is expected to improve the detection accuracy by accounting for label smoothness both locally and globally. Moreover, in order to further ensure the reliability of object detection, we still need to refine the co-registration accuracy of multimodal data via hierarchical feature matching and optimize alterable parameters through sensitivity analysis.
For characterizing urban traffic dynamics, a method to identify vehicle movement from airborne LiDAR data and to estimate respective velocities has been developed. Besides a description of the developed methods, theoretical and simulation studies for performance analysis were shown in detail. The detection and velocity estimation of fast-moving vehicles seems to be promising and accurate, whereas slow-moving vehicles are harder to distinguish from non-moving ones and it is harder to obtain estimates with acceptable accuracy. Moreover, the point density of LiDAR datasets tends to be directly proportional to the performance of motion detection. The estimation of the velocity of detected vehicles can be done with high accuracy for nearly all possible observation geometries except for those ones which are moving in the (quasi-)along-track direction while sensors are sweeping over instantaneously.
Although the results shown in this chapter cannot directly be compared with those of induction loops or bridge sensors, they show nonetheless great potential to support traffic monitoring applications. The big advantages of ALS data are their large coverage and certain penetrability through trees, and thus, the possibility to derive traffic data throughout an extended road network that may be occluded by trees on the roadsides. Evidently, this complements the accurate but sparsely sampled measurements of fixed mounted sensors. A natural extension of the presented approach would be an integration of the accurate, sparsely sampled traffic information with the less accurate but area-wide data collected from space or air-borne sensors. Existing traffic flow models would provide a framework to do this.
References
Azadbakht M, Fraser CS, Khoshelham K (2018) Synergy of sampling techniques and ensemble classifiers for classification of urban environments using full-waveform LiDAR data. Int J Appl Earth Obs Geoinf 73:277–291
Balado J, Díaz-Vilariño L, Arias P, González-Desantos LM (2018) Automatic LOD0 classification of airborne LiDAR data in urban and non-urban areas. Eur J Remote Sens 51(1):978–990
Bazzichetto M, Malavasi M, Acosta ATR, Carranza ML (2016) How does dune morphology shape coastal EC habitats occurrence? A remote sensing approach using airborne LiDAR on the Mediterranean coast. Ecol Ind 71:618–626
Bonczak B, Kontokosta CE (2019) Large-scale parameterization of 3D building morphology in complex urban landscapes using aerial LiDAR and city administrative data. Comput Environ Urban Syst 73:126–142
Chen LC, Lo CY (2009) 3D road modeling via the integration of large-scale topomaps and airborne LIDAR data. J Chin Inst Eng 32(6):811–823
Chen Z, Liu C, Wu H (2019) A higher-order tensor voting-based approach for road junction detection and delineation from airborne LiDAR data. ISPRS J Photogr Remote Sens 150:91–114
Cheng L, Wu Y, Wang Y, Zhong L, Chen Y, Li M (2014) Three-dimensional reconstruction of large multilayer interchange bridge using airborne LiDAR data. IEEE J Sel Topics Appl Earth Obs Remote Sens 8(2):691–708
Clode S, Rottensteiner F, Kootsookos P, Zelniker E (2007) Detection and vectorization of roads from LiDAR data. Photogr Eng Remote Sens 73(5):517–535
Cramer M (2010) The DGPF test on digital aerial camera evaluation—overview and test design. Photogrammetrie – Fernerkundung – Geoinformation 2(2010):73–82
Dawood N, Dawood H, Rodriguez-Trejo S, Crilly M (2017) Visualising urban energy use: the use of LiDAR and remote sensing data in urban energy planning. Vis Eng 5(1):22
Degerickx J, Roberts DA, McFadden JP, Hermy M, Somers B (2018) Urban tree health assessment using airborne hyperspectral and LiDAR imagery. Int J Appl Earth Obs Geoinf 73:26–38
Degerickx J, Roberts DA, Somers B (2019) Enhancing the performance of Multiple Endmember Spectral Mixture Analysis (MESMA) for urban land cover mapping using airborne LiDAR data and band selection. Remote Sens Environ 221:260–273
Earlie CS, Masselink G, Russell PE, Shail RK (2015) Application of airborne LiDAR to investigate rates of recession in rocky coast environments. J Coastal Conser 19(6):831–845
Fauvel M (2007) Spectral and spatial methods for the classification of urban remote sensing data. Ph.D. thesis, Grenoble Institute of Technology, France, and University of Iceland, Iceland
Fletcher PT, Lu C, Joshi S (2003) Statistics of shape via principal geodesic analysis on Lie groups. In: IEEE computer society conference on computer vision and pattern recognition, Madison, Wisconsin, 16–22 June 2003
Freund Y, Schapire R, Abe N (1999) A short introduction to boosting. J Jpn Soc Artif Intell 14(5):771–780
Garnett R, Adams M (2018) LiDAR—A technology to assist with smart cities and climate change resilience: a case study in an urban metropolis. ISPRS Int J Geo-Inf 7(5):161
Guo L, Chehata N, Mallet C, Boukir S (2011) Relevance of airborne LiDAR and multispectral image data for urban scene classification using Random Forests. ISPRS J Photogr Remote Sens 66(1):56–66
Höfle B, Hollaus M (2010) Urban vegetation detection using high density fullwaveform airborne LiDAR data—combination of object-based image and point cloud analysis. Int Arch Photogr Remote Sens Spatial Inf Sci 38(B7):281–286
Jochem A, Höfle B, Rutzinger M, Pfeifer N (2009) Automatic roof plane detection and analysis in airborne LiDAR point clouds for solar potential assessment. Sensors 9(7):5241–5262
Lafarge F, Mallet C (2012) Creating large-scale city models from 3D-point clouds: a robust approach with hybrid representation. Int J Comput Vision 99(1):69–85
Lafortezza R, Giannico V (2019) Combining high-resolution images and LiDAR data to model ecosystem services perception in compact urban systems. Ecol Ind 96:87–98
Li M, Rottensteiner F, Heipke C (2019) Modelling of buildings from aerial LiDAR point clouds using TINs and label maps. ISPRS J Photogr Remote Sens 154:127–138
Liu L, Coops NC, Aven NW, Pang Y (2017) Mapping urban tree species using integrated airborne hyperspectral and LiDAR remote sensing data. Remote Sens Environ 200:170–182
Mastin A, Kepner J, Fisher J (2009) Automatic registration of LIDAR and optical images of urban scenes. In: EEE conference on computer vision and pattern recognition, Miami Beach, FL, 22–24 June 2009
Næsset E, Gobakken T (2008) Estimation of above-and below-ground biomass across regions of the boreal forest zone using airborne laser. Remote Sens Environ 112(6):3079–3090
Reitberger J, Krzystek P, Stilla U (2008) Analysis of full waveform LiDAR data for the classification of deciduous and coniferous trees. Int J Remote Sens 29(5):1407–1431
Rizeei HM, Pradhan B (2019) Urban mapping accuracy enhancement in high-rise built-up areas deployed by 3D-orthorectification correction from WorldView-3 and LiDAR imageries. Remote Sens 11(6):692
Rottensteiner F, Trinder J, Clode S, Kubik K (2005) Using the Dempster-Shafer method for the fusion of LiDAR data and multi-spectral images for building detection. Inf Fusion 6(4):283–300
Rottensteiner F, Sohn G, Gerke M (2013) ISPRS test project on urban classification and 3D building reconstruction. https://www2.isprs.org/tl_files/isprs/wg34/docs/ComplexScenes_revision_may13.pdf. Accessed 12 June 2013
Rutzinger M, Rottensteiner F, Pfeifer N (2009) A comparison of evaluation techniques for building extraction from airborne laser scanning. IEEE J Sel Topics Appl Earth Observ Remote Sens 2(1):11–20
Schenk T, Csathó B (2007) Fusing imagery and 3D point clouds for reconstructing visible surfaces of urban scenes. In: Urban remote sensing joint event, Paris, France, 11–13 April
Sohn G, Dowman I (2007) Data fusion of high-resolution satellite imagery and LiDAR data for automatic building extraction. ISPRS J Photogr Remote Sens 62(1):43–46
Tomás L, Fonseca L, Almeida C, Leonardi F, Pereira M (2016) Urban population estimation based on residential buildings volume using IKONOS-2 images and LiDAR data. Int J Remote Sens 37(sup1):1–28
Toth CK, Grejner-Brzezinska D (2006) Extracting dynamic spatial data from airborne imaging sensors to support traffic flow estimation. ISPRS J Photogr Remote Sens 61(3–4):137–140
Vezhnevets A (2005) GML AdaBoost Matlab Toolbox. https://graphics.cs.msu.ru/en/science/research/machinelearning/adaboosttoolbox. Accessed 20 June 2013
Wang Y, Chen Q, Liu L, Zheng D, Li C, Li K (2017) Supervised classification of power lines from airborne LiDAR data in urban areas. Remote Sens 9(8):771
Wang C, Shu Q, Wang X et al (2019) A random forest classifier based on pixel comparison features for urban LiDAR data. ISPRS J Photogr Remote Sens 148:75–86
Wei Y, Yao W, Wu J, Schmitt M, Stilla U (2012) Adaboost-based feature relevance assessment in fusing LiDAR and image data for classification of trees and vehicles in urban scenes. ISPRS Ann Photogr Remote Sens Spatial Inf Sci 1(7):323–328
Wolf RP, Ghilani DC (1997) Adjustment computations: statistics and least squares in surveying and GIS, 3rd edn. Wiley , New York
Xiao J, Gerke M, Vosselman G (2012) Building extraction from oblique airborne imagery based on robust façade detection. ISPRS J Photogr Remote Sens 68:56–68
Yao W, Hinz S, Stilla U (2010a) Automatic vehicle extraction from airborne LiDAR data of urban areas using morphological reconstruction. Pattern Recogn Lett 31(10):1100–1108
Yao W, Hinz S, Stilla U (2010b) Airborne analysis and assessment of urban traffic scenes from LiDAR data—theory and experiments. In: Proceedings of workshops of IEEE conference on computer vision and pattern recognition, San Francisco, CA, USA, 13–18 June
Yao W, Hinz S, Stilla U (2011) Extraction and motion estimation of vehicles in single-pass airborne LiDAR data towards urban traffic analysis. ISPRS J Photogr Remote Sens 66(3):260–271
Yao W, Stilla U (2010) Mutual enhancement of weak laser pulses for point cloud enrichment based on full-waveform analysis. IEEE Trans Geosci Remote Sens 48(9):3571–3579
Zhao K, Suarez JC, Garcia M, Hu T, Wang C, Londo A (2018) Utility of multitemporal LiDAR for forest and carbon monitoring: tree growth, biomass dynamics, and carbon flux. Remote Sens Environ 204:883–897
Zhou QY, Neumann U (2008) Fast and extensible building modeling from airborne LiDAR data. In: Proceedings of the 16th ACM SIGSPATIAL international conference on advances in geographic information systems, Irvine, USA, Nov 5–7
Acknowledgements
This was partially supported by The Hong Kong Polytechnic University grants 1- ZE8E and 1-YBZ9, by PhD research excellence grant of Elite Network of Bavaria, and partially supported by the National Key Research and Development Program of China (No. 2016YFF0103503) and NSFC (No. 41771485). The experimental data set over Vaihingen for urban objects detection was provided by the German Society for Photogrammetry, Remote Sensing, and Geoinformation (DGPF) (Cramer 2010): https://www.ifp.uni-stuttgart.de/dgpf/DKEP-Allg.html.
Author information
Authors and Affiliations
Corresponding author
Editor information
Editors and Affiliations
Rights and permissions
Open Access This chapter is licensed under the terms of the Creative Commons Attribution 4.0 International License (http://creativecommons.org/licenses/by/4.0/), which permits use, sharing, adaptation, distribution and reproduction in any medium or format, as long as you give appropriate credit to the original author(s) and the source, provide a link to the Creative Commons license and indicate if changes were made.
The images or other third party material in this chapter are included in the chapter's Creative Commons license, unless indicated otherwise in a credit line to the material. If material is not included in the chapter's Creative Commons license and your intended use is not permitted by statutory regulation or exceeds the permitted use, you will need to obtain permission directly from the copyright holder.
Copyright information
© 2021 The Author(s)
About this chapter

Cite this chapter
Yao, W., Wu, J. (2021). Airborne LiDAR for Detection and Characterization of Urban Objects and Traffic Dynamics. In: Shi, W., Goodchild, M.F., Batty, M., Kwan, MP., Zhang, A. (eds) Urban Informatics. The Urban Book Series. Springer, Singapore. https://doi.org/10.1007/978-981-15-8983-6_22
Download citation
DOI: https://doi.org/10.1007/978-981-15-8983-6_22
Published:
Publisher Name: Springer, Singapore
Print ISBN: 978-981-15-8982-9
Online ISBN: 978-981-15-8983-6
eBook Packages: Social SciencesSocial Sciences (R0)