
Abstract
To achieve Net Zero, natural gas, gasoline, diesel, and fuel oils must be replaced with another source. However, most of the current low-carbon energy sources will also need to be replaced as almost none have more than about 25 years remaining of useful life. The pace and scale of the needed change is unprecedented: almost the whole of the world’s primary energy supply must be replaced. The (re)development of the entire energy system is inherently a sovereign risk and it can only be governments who set national energy policy. There is no doubt that markets will continue to play a part in future energy systems, but at the top level, the pace and scale of change to achieve Net Zero is simply far too fast for markets to adapt properly. This chapter is a call to action to the national policy makers and presents this challenge as an opportunity for creating higher-quality jobs and potentially highly attractive and long-dated investment options. The chapter also outlines some risks, including political indecisiveness and policy volatility as potential impediments to making the most of this opportunity and achieving the Net Zero.
You have full access to this open access chapter, Download chapter PDF
Keywords
- Net zero
- Low-carbon energy sources
- Climate change
- Primary energy consumption
- Wind energy
- Solar energy
- Fossil fuels
- Hydropower
- Nuclear energy
- Energy market
- Clean power
- Modular reactors
- Energy transition
6.1 The Challenge of Climate Change and Transformation of Primary Energy
To achieve Net Zero, on any timescale, almost the whole of the world’s primary energy supply must be replaced. Virtually all of it. Clearly, all the fossil fuels must be replaced. That is a simple and obvious statement and not only must natural gas, gasoline, diesel, fuel oils be replaced with another source or vector of primary energy, but most of the current low-carbon energy sources will also need to be replaced. The sheer pace and scale of what’s needed is unprecedented with even war-time efforts being the closest the world has seen before. That said, it also represents the most powerful opportunity for employment in higher-quality jobs as well as potentially highly attractive and long-dated investment opportunities but where the biggest risks may well be from political indecisiveness and policy volatility. In other words, the trust and confidence in governments—or lack of it.
To go with this is the reality that this pace and scale of change cannot be achieved by markets alone. In Sect. 6.11 the basis of energy markets is examined in more detail, but the fundamental conclusion is simple. In its totality, energy is one of the largest cases of nationally significant infrastructure. The (re)development of the entire energy system is inherently a sovereign risk. To put it another way, any government ‘owns failure’ in nationally significant infrastructure. It can only be governments who set national energy policy. The history of the last 40 years with markets adapting—relatively slowly in terms of the current challenge—to engineering developments has been highly effective and there is no doubt that markets will continue to play a part in future energy systems. But at the top level, the pace and scale of change to achieve Net Zero is simply far too fast for markets to adapt properly.
The other top-level constraint is, of course, that of physical deliverability. This is not simply about the length of time to build large primary energy sources such as hydropower and GW-scale nuclear reactors. It is about how to develop and grow entire supply chains to support the installation (note, not just construction) at a national level of many GWs of capacity each year. And for supply chains, it is not just about pumps, valves, gearboxes and other components. The supply chain for people will be just as important.
6.2 Primary Energy
Meanwhile, in a low-carbon world, there are only four sources of primary energy. Sources of primary energy must be distinguished from energy vectors or ways of transporting energy from its source to a user. In no particular order these sources of primary energy are:
-
Wind and solar electricity;
-
Nuclear energy—currently only from fission but ultimately from fusion as well;
-
Hydropower—including tidal and wave energy;
-
Energy from fossil sources with effective carbon capture and sequestration.
Gases such as hydrogen and ammonia are not themselves sources of primary energy but merely ways of transporting the energy—energy vectors.
With the complete rebuilding of national energy systems, one fundamental aspect of global economies is changing. The 21st century is increasingly reliant on energy for day to day living and the cost of that energy is becoming an increasing determinant of economic competitiveness. The new energy systems will have a profound impact on national economic competitiveness and well-being for many generations to come—for our grandchildren and beyond. Meanwhile, it is essential to recognize that current energy systems were designed for a different era. As an example, the United Kingdom’s (UK) energy system was largely designed after the Second World War and initially designed to move energy from coal fields to manufacturing centres, as well as for domestic use. Neither of those major design points apply now. Energy today comes from gas fired power stations, large nuclear power stations situated around the coasts and increasingly from renewable sources with an ever greater move into deep waters offshore. The population distribution has changed significantly from the 1950s to now, manufacturing centres are smaller and often in different locations, and energy transmission infrastructure has been regulated based on reducing the cost to consumers over five year periods.
The biggest challenge of all is the need for a proper systems approach given that the Darwinian market models simply cannot conceivably react quickly enough. Newer technologies have been heavily promoted over the past decade to drive their adoption—but that drive has been about cost reduction, not based on any sense of what a reasonable outcome—or alternative outcomes—might be. There has been no thorough analysis of what a new system could look like or how to get there.
Darwinian evolution at the heart of good markets is about a generate, test, selection and failure mechanism, and the high-tech, start-up approach of ‘fail fast’ does not work in the primary energy sphere. The evolution of primary energy creation systems and different approaches to the underpinning infrastructure is simply too slow. In a UK context, by the date of the 2021 United Nations Climate Change Conference (COP26), the UK will have lost almost 7.5% of the time between the original announcement by the Prime Minister, Theresa May, of the legally binding requirement for the UK to achieve Net Zero by 2050—with virtually nothing to show for it.
There is now no time to waste—if, indeed, there is even enough time to achieve Net Zero by 2050.
6.3 Current Energy Consumption
Global energy consumption, on a substitution basisFootnote 1 is shown in Fig. 6.1. The sheer scale of the decarbonization challenge is best shown on this substitution basis. Comparison of the scale of the four traditional energy sources—biomass, coal, oil and gas—with the remaining lower-carbon primary energy sources shows that daunting scale of the challenge.

Sourcehttps://ourworldindata.org/energy-production-consumption (Accessed 14 July 2021)
Global primary energy consumption by source. Note Primary energy is calculated based on the ‘substitution method’ which takes account of the inefficiencies in fossil fuel production by converting non-fossil energy into the energy inputs required if they had the same conversion losses as fossil fuels.
Similar charts for the United States of America (USA), Japan, China, the UK, Germany and Sweden are included in this chapter. It is also instructive to consider the carbon intensity maps produced regularly by Grant ChalmersFootnote 2—see Figs. 6.2 and 6.3.

Carbon intensity of electricity consumption 2017–2021. Source @GrantChalmers

Carbon intensity of electricity consumption 2020–2021. Source @GrantChalmers
It is clear from the plots in Figs. 6.2 and 6.3 that countries such as Sweden, blessed with natural resources of hydropower and/or those who have also historically built significant nuclear capacity, will have a far, far easier route to Net Zero than others. France, the Province of Ontario and IcelandFootnote 3 all fall into that category. It is equally clear that despite the heavy focus on renewables in countries such as Germany, the dependence on fossil energy remains and even in countries such as Denmark there is an inescapable reliance on imported energy from other countries such as via the Nordic Grid or from fossil power. Queensland appears here at the more extreme end of fossil dependency and will appear elsewhere (Fig. 6.19) as an example of a badly (at least weirdly) performing energy market.
Interestingly, in terms of CO2 emissions, in the UK, the overall carbon saving since the opening of Calder Hall in 1957 is 2.3 billion tonnes CO2 eq (which is equivalent to all UK emissions from 2015 through to 2020).
The continuous theme for the graphs in Figs. 6.4, 6.5, 6.6, 6.7, 6.8 and 6.9 is the huge amount of primary energy from fossil fuels which must be entirely replaced.

Energy consumption by source—USA. ‘Other renewables’ includes geothermal, biomass and waste energy. Note Primary energy consumption is measured in terawatt-hours (TWh). Here an inefficiency factor (the ‘substitution’ method) has been applied for fossil fuels, meaning the shares by each energy source give a better approximation of final energy consumption. Sourcehttps://ourworldindata.org/energy-mix?country= (Accessed 14 July 2021)

Energy consumption by source—Japan. ‘Other renewables’ includes geothermal, biomass and waste energy. Note Primary energy consumption is measured in terawatt-hours (TWh). Here an inefficiency factor (the ‘substitution’ method) has been applied for fossil fuels, meaning the shares by each energy source give a better approximation of final energy consumption. Sourcehttps://ourworldindata.org/energy-mix?country= (Accessed 14 July 2021)

Energy consumption by source—China. ‘Other renewables’ includes geothermal, biomass and waste energy. Note Primary energy consumption is measured in terawatt-hours (TWh). Here an inefficiency factor (the ‘substitution’ method) has been applied for fossil fuels, meaning the shares by each energy source give a better approximation of final energy consumption. Sourcehttps://ourworldindata.org/energy-mix?country= (Accessed 14 July 2021)

Energy consumption by source—UK. ‘Other renewables’ includes geothermal, biomass and waste energy. Note Primary energy consumption is measured in terawatt-hours (TWh). Here an inefficiency factor (the ‘substitution’ method) has been applied for fossil fuels, meaning the shares by each energy source give a better approximation of final energy consumption. Sourcehttps://ourworldindata.org/energy-mix?country= (Accessed 14 July 2021)

Energy consumption by source—Germany. ‘Other renewables’ includes geothermal, biomass and waste energy. Note Primary energy consumption is measured in terawatt-hours (TWh). Here an inefficiency factor (the ‘substitution’ method) has been applied for fossil fuels, meaning the shares by each energy source give a better approximation of final energy consumption. Sourcehttps://ourworldindata.org/energy-mix?country= (Accessed 14 July 2021)

Energy consumption by source—Sweden. ‘Other renewables’ includes geothermal, biomass and waste energy. Note Primary energy consumption is measured in terawatt-hours (TWh). Here an inefficiency factor (the ‘substitution’ method) has been applied for fossil fuels, meaning the shares by each energy source give a better approximation of final energy consumption. Sourcehttps://ourworldindata.org/energy-mix?country= (Accessed 14 July 2021)
The UK story is largely now one of driving out coal as a source of primary energy coupled with a very large series of investments in wind and solar energy supported by the very favourable electricity market reform of the early 2010s which ‘socialized’ the costs and consequences of intermittency and had the effect of paying for renewable energy whether it was needed or not. The same period included the approval of one new nuclear power station despite the foundation legislation for low-carbon energy in the UK including a strong signal that fleets of more than one design of GW-scale nuclear plants were intended. That intention became weaker with the 2010 coalition government in which the Liberal Democrats, historically an anti-nuclear political party, were given ministerial control of the Department of Energy and Climate Change. The relative power of the renewables teams of civil servants increased significantly over that period while the Office for Nuclear Development became less influential from 2014 onwards. The UK has gone from leading the ‘nuclear renaissance’ in the 2008–2014 period to, at best, playing catchup. While the Prime Minister produced a visionary 10 Point Plan for a Green Industrial RevolutionFootnote 4 in 2020, the subsequent White Paper was relatively weak in terms of practical ambitions for nuclear.
The politics of Germany, particularly driven by the prominence of Green, anti-nuclear politics in the state elections in Baden-Württemberg in the immediate aftermath of the Fukushima tragedy at the Daiichi nuclear power plant, is famous. The subsequent energy policy ‘Energiewende’ has failed to reduce CO2 emissions significantly. A study found that if Germany had postponed the nuclear phase out and phased out coal first it could have saved 1100 lives and US $12 billion in social costs per year. An article by Environmental ProgressFootnote 5 claims that Germany could have already phased out fossil fuels if it had chosen to invest in nuclear instead of renewable energy.Footnote 6 The deep antipathy to nuclear power in Germany can, it has been suggested, be traced back to the original investments in nuclear power in Germany in the 1970s.Footnote 7 According to Marx,Footnote 8 much of the original support for nuclear power in Germany came from industry—notably BASF and Hoechst—and was not the primary result of Federal or State Government Policy. In the 1960s there had been majority societal support for nuclear power, but neither Federal nor State governments made any significant attempt to sell the policy to the German people. Social licence for nuclear power in Germany became progressively diluted as the larger corporates promoted nuclear power, with added emphasis following the 1973 oil crisis. Ultimately, a large part of the country’s electric utilities’ expansion was based on nuclear energy but the industrial companies that originally championed nuclear ultimately moved to support coal, coal-to-liquid and lignite industries.
The graphs speak volumes about the scale of the build challenge. It has been clear since the drive to install wind and solar energy generation that the useful life of each is significantly less than other conventional sources of primary energy.Footnote 9 That alone should galvanize energy policy makers and governments. There has been a wonderful development of renewable energy over the last decade and a half but, as is so often the case in nationally significant infrastructure, the lifetimes and investment cycles are generally ignored until a relevant crisis appears. The UK may have experienced an ‘appropriate’ crisis in September 2021 as this is being written. Weather conditions reducing renewables generation to very low proportions (2.78% right now) with very high gas prices have forced the restart of the one operable coal plant and energy prices have escalated dramatically, causing a large number of retail organizations to fail. The vital takeaway is that virtually none of the currently operating renewable sources of primary energy will still be operating by 2050. In addition to the massive decarbonization system plans yet to be developed, there must be an ongoing replacement and re-powering plan to keep renewable energy production online and durable.
One important message is that in rebuilding a nation’s energy system, there is unlikely to be a silver bullet. A modern, resilient energy system with a robust level of energy security will be one with a balance of energy creation sources, one that has sufficient capacity in its constituent parts to cope with even very low probability scenarios. The optimal solution must factor in possible rates of construction, likely all-powerful (read strongly binding from an optimization perspective) constraints of a physical nature (how much land/sea area is needed? Can you create a large enough workforce? Where will the steel come from? reducing embedded carbon, etc.) to minimize the cost of the system at the level of the national economy.
6.4 Attributes/Superlatives of Nuclear Energy
Before delving into further detail of some of the practical issues, it is worth revisiting the reasons why nuclear power can, and in many cases should, be a powerful and critical component of a 21st century energy system.
6.4.1 Most ‘Energy Dense’—Most of the Virtues Flow from This
Energy density data are quite revealing:
-
Uranium enriched to 3.5% used in a light water reactor has about 3900 GJ/kg;
-
Uranium as fuel in a fast neutron reactor has about 28,000 GJ/kg;
-
Hard black coal has about 24–25 MJ/kg (note MJ not GJ);
-
Hydrogen has about 120–142 MJ/kg;
-
Natural gas has about 42–55 MJ/kg.
Hence uranium has about 156,000 times the energy of coal in a conventional light water reactor, but if burnt in a fast neutron reactor (see Sect. 6.9.2) that figure rises to about 1.12 million times the energy of coal.
Because of the exceptionally large energy density of nuclear fuel, nuclear power has the least land requirement of any. Table 6.1 sets out a recent analysis of lifecycle land use.Footnote 10
In terms of land area used for actual generation, the figures are a little different and could be a very different basis of selection (although nuclear is always the most effective use of land mass by far, however the analysis is performed).
To pick a simple example from the UK, take Torness, a 1988 power plant of 1.36 GW output that would generate four times the power of East Anglia One, UK’s largest windfarm, which is currently being built: it has 102 turbines and needs 300 km2. Torness occupies, in total, about 130 ha (about 1.3 km2)—the nuclear island itself very considerably less than that.
To replace Torness you would need 400 wind turbines, taking about 1200 km2. The entire global nuclear fleet could easily fit within that several times over.
6.4.2 Creates the Most Skilled Jobs
Fig. 6.10 shows the earnings map across the UK with the example of the Copeland constituency. This includes the Sellafield and related nuclear industrial sites.

Sourcehttps://www.ons.gov.uk/visualisations/nesscontent/dvc126. (Accessed 14 July 2021)
Average earnings map for the UK.
In general, the nuclear industry provides better paid jobs than in most other areas with large numbers of professional services jobs. Other than the Copeland area (which is dominated by the nuclear industry), the red areas on the map are in and around London. The figures for all the red patches on the map are set out in Table 6.2.
There are some other helpful statistics to add here too. At the Hartlepool power station, the average wage is over £50,000, more than twice town average. In the UK, 90% of nuclear jobs are outside London and the Southeast. Nuclear contributes around £12.4 billion to the national economy (when taken with multipliers). Overall, in the UK there is a £2.8 billion Exchequer tax receipt from nuclear jobs and industries.
And it helps keep the lights on reliably.
6.4.3 Only Technology Can Produce Clean Heat and Clean Power
Nuclear energy stems from the production of low-carbon heat. It is, with wind, solar and hydropower, one of the few sources of primary energy. Wind and solar convert energy from the climate to electrical energy and hydropower converts climate driven rainfall and gravity into electrical energy. Nuclear power comes from a fundamental physical process which releases energy contained within any element in the periodic table with a larger atomic number than iron.Footnote 11 The energy released by any nuclear reaction—fission or fusion—is captured as heat and all the subsequent energy use is from that low-carbon heat. Conventionally, the heat is used to boil water and use the steam to spin turbines and generators. Increasingly though, heat is now a major issue for both industry and other methods of electricity generation such as high temperature electrolysis (see Sect. 6.6.1.1) but also for the production of hydrogen—likely to be a critical part of any future energy system in many countries—by thermochemical (catalytic) systems.
Conventional nuclear power is also a Flexible Base Power, i.e. large scale reactors turning out electricity, and capable of load following to balance with much less flexible and intermittent renewables. Figure 6.11, taken from the OECD/NEA document entitled ‘Technical and economic aspects of load following with nuclear power plants’Footnote 12 shows an example of that load following in action in the EDF French fleet where around three quarters of their electricity came from nuclear power.

Source OECD/NEA 2011, image courtesy of Électricité de France
Example of nuclear power station load following.
The economics of load following for a nuclear reactor are interesting and complex—while the cost of fuel saved is small, incremental costs (such as the additional use of ion-exchange resins in pressurized water reactors (PWRs)) can more than outweigh those savings. But load following by nuclear power stations can and does happen regularly.
6.5 Nuclear Off the Assembly Line—Modular Reactors
Conventionally, most nuclear power stations have been built entirely on-site with little prefabrication or major manufacturing off-site. This is not the case for the some of the earliest regular uses of nuclear power in submarines but until the second decade of the 21st century, so-called ‘stick build’ was the normal approach. In the first years of this century interest began to increase in the potential for swapping stick build for a manufacturing process where parallelism of manufacture could reduce the time taken for the whole project (which is part of the reason why nuclear electricity prices are so sensitive to the weighted average cost of capital (WACC) as discussed in Sect. 6.10.1). A manufacturing process within factory conditions should also give rise to higher and more consistent quality of all the elements of the build process and elimination of rework on a construction site.
6.5.1 AP1000 Style and Passive Safety
Nuclear power has a history dominated by engineering always seeking to tweak and change, no real attempt to design for manufacture, no real focus on the delivery of new projects in terms of GW/year and too little on the fundamental reliability of cost and schedule on construction.
Nuclear industry has had a major drawback that there was no clear product. The industry has been selling components to utilities that would historically integrate them in a relatively bespoke process—other than in the Republic of Korea and China where a more industrial process has been historically the case. There has been no design for manufacture, no focus on GW/year and too little focus on the reliability of cost and schedule. The second generation of reactors in the UK—advanced gas cooled reactors (AGRs)—are all different despite the intent that they would be a fleet of a common design. There was a clear attempt to drive fleet build in the UK 2008 White Paper and the Generic Design Assessment was created at the time as part of the “Facilitative Actions” intended to do as much as possible for a new fleet of reactors up front, once and to make it hard to change en-route other than on a fleet basis. Despite the vision and aspiration of the time, at the time of writing, the UK has only approved one new nuclear power project and the Sunday Times newspaper recently described nuclear policy in the UK after 2010 as having been “ossified”.Footnote 13
In the UK, following the Magnox reactor build programme, the successor programme to build AGRs was originally intended to be a fleet build with all the consequential learning and efficiency gains. In practice, the AGRs are all different with different construction groups and too little focus on consistency with the first of a kind having been thoroughly and completely designed. Similarly, in the USA there had been a common PWR reactor design, the Standardized Nuclear Unit Power Plant System (SNUPPS) design produced by Westinghouse in the 1970s. The design was developed for four US utilities, and plants were built at Callaway and Wolf Creek. The UK plant at Sizewell B was also based on SNUPPS—but as is too often the case, with significant modifications.
In the 1990s, a number of reactor vendors decided to produce new designs as part of a drive for ever greater safety levels. Westinghouse first produced the AP600 design, which received NRC certification in 1999, as their first attempt at a simpler, safer modern reactor design with a core damage frequency around 1000 times better than the regulatory requirement. This design, ultimately upgraded to the AP1000, was first built in Sanmen in China with following construction at Vogtle for the Southern Company of the USA.
A single unit of the AP1000 has 149 structural modules of five types and 198 mechanical modules of four types: equipment, piping and valve, commodity, and standard service modules. These comprise one-third of all construction and can be built off-site in parallel with the on-site construction. It is interesting to compare the AP1000 with the previous Westinghouse unit built in the UK at Sizewell B, as set out in Table 6.3.
The history of these plants as a first-of-a-kind construction is mixed with problems and delays. The Wall Street Journal in December 2016Footnote 14 reported that “construction at Sanmen was moving ahead faster than the company was completing its engineering work, a decision Westinghouse now concedes was a mistake. Several times, Westinghouse had to rip out equipment that had already been installed and start again or undertake lengthy re-examinations of engineering work.” The build at Vogtle was eventually rescued when the company brought in Bechtel to take over the project management and complete the project which, not unlike the experience in Sanmen, was slipping. The Sanmen project went online on 28 June 2018 and as of July 2021, the Vogtle unit 3 construction was approximately 98% complete, with the total Vogtle 3 and 4 expansion project approximately 92% complete.Footnote 15 It is now expected that the lessons learned on the AP1000 completion at Vogtle will provide the basis for a much faster, more predictable build of future AP1000 reactors at costs which should be economically attractive compared to renewable electricity. At the time of writing, Bechtel, Westinghouse and Southern Company (the owners of the Vogtle plants) are discussing building AP1000 reactors on the Wylfa site on which Hitachi had been developing their own Horizon project, until it finally ceased development on 31 March 2021. The Bechtel/Westinghouse/Southern Company proposal, should the UK Government decide to take it forward, is planned to be available well before the end of the highly challenging Sixth Carbon Budget for the UK, which was published by the Climate Change Committee in December 2020.Footnote 16
In parallel, Hitachi and Toshiba in Japan had designed boiling water reactors (known as ABWR) which were heavily modular in design with novel approaches to construction on-site. The first four of these units have been reportedlyFootnote 17 built in 39–43 months on a single shift basis—that may in part reflect the highly disciplined approach to construction in Japan as a professional discipline backed up by strong cultural reinforcement.
6.5.2 The Nuclear Product—A Modular Power Station
The challenges of GW-scale reactor projects (the scale of capital cost which puts the projects firmly into the ‘sovereign risk’ territory), the challenges in many countries with delivering very large projects to time and cost (irrespective of technology, power or transport, for example) and the logical conclusion of the modularization approach for GW-scale reactors was to contemplate smaller, highly modular designs.
A number of these are now well into development with the NuScale project for Utah Associated Municipal Power Systems (UAMPS) the furthest along at the time of writing. The project is based on a design for up to 12 NuScale Power Modules, each of which is designed to be entirely factory built and capable of being shipped to site by river or road. Other component systems will be similarly handled in modular fashion. Turbine-generators, chemical control processes and other modular systems will be assembled off-site, skid mounted, and shipped to the plant site. The current cost estimate of US $6.1 billion includes the NuScale overnight capital cost, owners’ costs, escalation, contingency, fees, warranty and capitalized interest, with a planned power output of 77 MW per module giving a potential total of 924 MW.
The project is currently stated to be on track for the first module to go online in 2029 and in their 2019 article, which examined the cost structure of the NuScale power module, Black et al.Footnote 18 suggested that, overall, “the substantially lower estimated expenditures for direct and indirect capital costs will likely lead to LCOE measures that are significantly lower than conventional nuclear plants and more in line with other energy technologies.”
Following the progress shown by NuScale, others have approached small modular reactor designs increasingly, attracting capital investment in the designs and significant interest from countries around the world—the USA, Canada and many European countries now expressing clear interest in the technologies. World Nuclear News lists the following designs, set out in Table 6.4, as being well advanced and ready for near-term deployment.Footnote 19
6.5.2.1 What Is the Fastest Way to Build?
If Japan and the Republic of Korea can achieve construction times apparently so very low (as shown in Sect. 6.12.2), the question is now being asked about just what could be done with massively parallel factory build of the whole power station. Then how rapidly could, say, a 300 MW unit be assembled on-site from the point that a standard base—such as Arup have proposed for UKSMR—has been installed? Why could the assembly of modularly build units not be brought down to less than two years with smart inter-module interfaces?
This is the challenge for the nuclear industry in 2021.
6.5.2.2 UKSMR Approach
The UKSMR consortium, founded by the Rolls-Royce defence and aerospace company, building on their extensive experience of building all of the UK’s nuclear submarine reactors, has developed their SMR design to the point where it is now expected to enter the UK’s Generic Design Assessment in Autumn 2021. Over the last few years, the concept of modularization of the reactor manufacturing which Rolls-Royce had been developing for a number of years, has now moved towards a bigger vision of a modular power station.Footnote 20 This, of course, reflects the reality that no operator or investor will be interested in a reactor on its own—it is an entire power station which is the source of practical energy and revenue stream and the more that can be done to streamline, de-risk and reduce the costs of the power stations are all potentially valuable additions to the case for SMRs. With the challenge now in attempting to achieve Net Zero, the critical issue for new build is GW/year within an electricity price cap/constraint. The more that SMRs can be created as rapid delivery products, the more attractive they will become on top of the much lower capital cost and thus have only a very short term need for any governmental support. Of course, the challenge will remain to ensure that SMR designs are actually implemented on a fleet build basis and that the lessons from the AGRs are never repeated.
In Rolls-Royce’s view, the current, outdated model of nuclear new build as a major, one-off infrastructure project is not fit for purpose in a world that needs new nuclear power stations delivered quickly and affordably to a wide variety of global locations.
They say that their approach means that approximately 90% of the plant will be factory fabricated and delivered by road or rail as modules alongside the remaining components to the prepared site where the plant will be assembled and commissioned by the Rolls-Royce SMR team under a turnkey Engineering, Manufacture, Assembly (EMA) contract.
They have a clear view that offering a nuclear power station as a manufactured product should deliver the cost and risk reductions and quality improvements associated with factory fabrication whilst simultaneously removing the expense, lead-time and risk associated with developing a new, inexperienced supply chain and EPC contractor team for each new plant constructed.
According to the project team, the Rolls-Royce SMR has been designed from the outset with end user requirement at the heart of the design focusing on:
-
(a)
Lower capital cost per MW-installed by design to:
-
•
Maximize power for small physical size;
-
•
Make use of a commercially available suite of products—simplified and standardized equipment that is used in other applications and avoidance of ‘one-off’ components;
-
•
Avoid high and heavy parts with only a few global manufacturers;
-
•
Radically reduce construction-based activities: modularization of whole plant, not just nuclear island;
-
•
Focus modularization on standardization, commoditization, factory repeatability and a production line approach;
-
•
Avoid very large one-off modules that must be disassembled for transport and/or require expensive facilities to build;
-
•
Avoid redesign for each site with an aseismic bearing to prevent the need for site-to-site redesign.
-
•
-
(b)
Reduced build time through:
-
•
Modules factory fabricated and functionally tested off-site;
-
•
Road transportable modules removes requirement for new transportation infrastructure (e.g. ports);
-
•
Expedited module assembly on-site using site factory;
-
•
Simultaneous module lift and assembly using site factory;
-
•
Utilizing in-built knowledge transfer across units through repeatable factory product.
-
•
-
(c)
Lower risk/increased certainty:
-
•
Low licensing risk: proven PWR technology and standard uranium fuel;
-
•
Lower environmental impact: reduced site footprint, lower site disruption and boron free design;
-
•
Site canopy provides controlled site environment for assembly;
-
•
Aseismic bearing removes need for site-to-site redesign and eases licensing between sites.
-
•
The Rolls-Royce team believe that their approach will deliver:
-
£1.8 billion capital price underpinned by existing equipment pricing and extensive manufacturing experience;
-
Repeatable cost driven by 90% factory product;
-
Clean electricity at scale at a price competitive with intermittent renewables;
-
Fast deployment—four year construction for a fleet unit;
-
No need for complex EPC contractual interfaces—lower risk single entity delivery model using an Engineering, Manufacture, Assembly (EMA) turnkey delivery contract;
-
Minimized site disruption during construction (average of 500 people on-site negates needs for extensive worker infrastructure);
-
Highly scalable through innovative production methodology;
-
Can fit within existing infrastructure (grid, transport);
-
Compact footprint increases site flexibility and maximizes potential plant locations (including replacement for existing coal or gas fired plants);
-
Indirect cooling option increases siting flexibility;
-
Long term job creation, sustainable in factories and supply chain avoiding the boom and bust cycle associated with large one-off infrastructure projects;
-
Multi-use electricity and/or heat output adaptable to on- and off-grid applications;
-
Lower capital, risk, build time enables investment by commercial entities on a standard debt and equity basis;
-
Repeatable low cost, factory product rather than large one-off infrastructure project;
-
Low completion risk given standardized manufactured nature of product and repeatable EMA turnkey plant delivery.
At the time of writing, it is rumoured that Rolls-Royce has raised over £200 million of private capital to match the funding from the UK Government announced in November 2020.Footnote 21 An announcement is expected around the time of COP26.
6.5.2.3 GE BWRX-300 Approach
GE have also taken their ESBWR design, which was licensed by the NRC in 2014—although never built—and developed a 300 MW boiling water reactor (BWRX300). GE have developed this design in partnership with Dominion PowerFootnote 22 and others. GE are currently working with Ontario Power GenerationFootnote 23 to progress options for the potential deployment of small modular reactors in Ontario. There is a well supported SMR roadmap for CanadaFootnote 24 which could be argued to be the nation currently at the forefront of SMR enthusiasm. Senior government officials, most notably federal Natural Resources Minister Seamus O’Regan, regard SMRs as indispensable tools for meeting Canada’s greenhouse gas emissions targets, by replacing coal fired plants and by electrifying mining and oil and gas facilities.
Like the UKSMR design, the BWRX300 is taking a modular approach to the whole power station where GE has an advantage through having its own turbine designs. Because of the ancestry of the GE SMR and that many of the components in it have already been licensed, there is a clear argument that as a well understood type of design with the licensing date from the ESBWR, the licensing process for the GE SMR could be relatively quick. It will be interesting to see how this turns out in practice.
The BWRX-300 builds on the success and lessons learned from over 60 years of BWR operating history. The top-level features of the BWRX-300 include:
-
Tenth generation Boiling Water Reactor;
-
Evolved design from US NRC licensed ESBWR;
-
Design-to-cost approach;
-
Significant capital cost reduction per MW;
-
World class safety;
-
Capable of load following;
-
Being ideal for electricity generation and industrial applications, including hydrogen production;
-
Constructability integrated into design;
-
Reduced on-site staff and security;
-
Licensing initiated in the USA and Canada;
-
Operational by 2028.
The BWRX-300 optimizes innovation with technology readiness. It relies on proven fuel, material and manufacturing techniques while incorporating breakthrough passive and simple design concepts. The result is a cost effective, advanced reactor design with world-class safety and economic performance that can be licensed and constructed in the near term. It offers low risk in comparison to historical large light-water reactor (LWR) projects in the USA and promises to be highly competitive in the worldwide energy market.
The key simplifications of the BWRX-300 are the use of RPV isolation valves that mitigate the impacts of loss of coolant accidents and large capacity isolation condensers that provide over pressure protection without the need for safety relieve valves. A cutaway drawing of the design is shown in Fig. 6.12 (reproduced here by kind permission of, and copyright GE Hitachi Nuclear Energy).

Source GE Hitachi Nuclear Energy Americas LLC
GE BWRX-300 cutaway reactor and containment design.
6.5.3 Or Shipyard Building?
Meanwhile, there is a school of thought that taking small modular designs one stage further and use modern shipyard manufacturing techniques could make a significant difference again in the speed and quality of manufacturing of SMRs. The experience of modular construction in, for example, the research ship, Sir David Attenborough and the new UK aircraft carriers have raised the profile of what can be achieved.Footnote 25 There are now increasing numbers of shipbuilding projects in defence, such as the Babcock Group’s recent proposal for new warships for the Greek navy using a modular build approach based on the UK’s successful Type 31 frigate.
In the nuclear powered shipping world, while nuclear powered submarines were the first, with the Mark 1 prototype reactor first starting up in Idaho in 1953, the USS Nautilus was launched in 1954 after the keel was laid in June 1952. More recent work in Russian icebreaker construction has not been anything like as rapid, with the Arktika beginning construction in November 2013 and ready for sea trials under nuclear power in June 2020, missing the original completion date of December 2017. The Ukraine crisis undoubtedly played a material part in the delay.
Another interesting development was the construction and operation of the nuclear power barge, Akademik Lomonosov. The keel was laid in April 2007 with a planned completion date of May 2010. However, after a second keel laying at a different shipyard, the vessel was launched at the end of June 2010, the reactors were installed in October 2013 and nuclear fuel loaded in April 2018, with operation starting in December 2019 supplying both electricity and heat to Pevek, a Russian town inside the Arctic Circle.
Much work has been done to see how modern shipbuilding in countries such as the Republic of Korea and Singapore could be used to build not just power barges but nuclear powered ships and floating hydrogen factories. CorePowerFootnote 26 is one such organization led by experienced shipping professionals which has built sufficient confidence in its approach that it is entirely privately funded from investors in the shipping and finance industries.
Similarly, the Gigafactory proposed by LucidCatalyst, shown in Fig. 6.13, in which there would be a dedicated manufacturing facility where the high temperature heat sources, and associated equipment, are fabricated and installed on-site. Hydrogen production facilities would also be manufactured, installed, commissioned, and operated on-site. The whole approach they take is building on modern shipyard practices.

Source LucidCatalyst 2020
LucidCatalyst’s Hydrogen Gigafactory Concept.
LucidCatalyst states that “[t]he main advantage of shipyard manufacturing comes from high productivity, which leads to lower costs and faster projects. Shipyard productivity is among the highest in the world. Labor costs constitute only 10–15% of the final assembly and delivery cost. By contrast, labor constitutes up to 35% of the costs in best-in-class conventional construction. The most productive shipyards in the Republic of Korea and Japan have been able to sustain 10–15% per year improvements in productivity over multiple years.”Footnote 27
The Gigafactory proposed by LucidCatalyst would use multiple heat sources (600 MWt) connected to a heat exchanger unit that transfers the heat to a molten salt heat supply network for a thermochemical hydrogen plant. Manufacturing facilities would be built with rail and port access, allowing the manufacturing plant to ship high value components that are not necessarily used at the facility when the construction of the plant is complete.
LucidCatalyst believe that Hydrogen Gigafactories can be sited on refinery-scale brownfield sites, such as large existing coastal oil and gas refineries, with large scale interconnection points to the gas grid. This avoids the need to interconnect multiple scattered hydrogen projects to the main gas grid. It may also be favourable to co-locate ammonia production facilities or other synthetic fuel conversion plants using hydrogen as a feedstock, which benefit from low cost electricity and hydrogen.
Other organizations such as ThorconFootnote 28 and SeaborgFootnote 29 are currently examining the possibility of shipyard manufacture of power barges and hydrogen production.
The Core Power team are currently working on designs for nuclear powered ships which, if the designs prove workable, would revolutionize large shipping and remove one of the largest single sources of CO2 emissions in 2050—estimatedFootnote 30 by then to be around 17% of global emissions. The Cape Class ships being designed to be nuclear powered would have roughly 2.5 million miles of operation at full cruising speed between refuelling, with a cruising speed in excess of 30 knots that would transform not only the Trans-Pacific trade opportunities but also avoid the need to use the Suez Canal. Following the severe logistical problems caused by the Evergiven incident in the Suez Canal in 2021, the ability to avoid the need to use the canal could be transformative for Asia/Europe trade as well.
6.6 Nuclear as an Alternate Fuel Provider
Students of high school science are very familiar with the creation of hydrogen and oxygen from water by the application of electricity. Conventional electrolysis is not a particularly economical method of production of hydrogen and most hydrogen used in the chemistry industry is produced by Steam Reforming of Methane where the reaction ultimately produces four molecules of hydrogen and one molecule of CO2 from one molecule of methane and two molecules of water (as steam). This process is currently extensively promoted for the creation of a near term hydrogen economy. Modern electrolysis uses more sophisticated techniques such as Polymer Electrolyte Membrane (PEM) cells which work at high current densities and can produce large volumes of hydrogen.
However, like most chemical reactions, at progressively higher temperatures, the efficiency increases and high temperature electrolysis using solid oxide cells can work at temperatures from 100 to 850 °C. The efficiency rises from around 41% at 100 °C to around 64% at 850 °C.
At high temperatures, it is also possible to convert CO2 and steam to a hydrogen/carbon monoxide mix—syngas. That can further be reacted to create hydrocarbon fuels and other chemicals.Footnote 31
6.6.1 Hydrogen: Thermochemical Processes (AMRs/Gen IV)
Two routes exist here: direct thermochemical catalytic processes and high temperature steam electrolysis. Both need temperatures above 500 °C and at higher temperatures nearer 1000 °C potentially more powerful techniques could come into play.
6.6.1.1 High Temperature Steam Electrolysis
These processes typically use solid oxide fuel cells (SOFCs) operating in reverse.Footnote 32 Ceres Power, a developer of SOFCs, is now examining the use of its cells to make hydrogenFootnote 33 which are likely to operate at higher temperatures nearer 1000 °C. Recent work at the USA’s Idaho National Labs reports progress with a modern SOFC at the lower temperatures of around 600 °C.Footnote 34 Given the likely demand for hydrogen to replace natural gas in heating and as an alternative fuel for transport, high efficiencies of production are rapidly becoming important. Lucid Catalyst suggest that the economics of hydrogen production ultimately favour high temperature nuclear (see Fig. 6.14). One issue will be relative efficiencies of the thermochemical processes, which avoids the inefficiencies of creating electricity versus the complexities of the catalytic processes which use heat alone.

Source LucidCatalyst 2020
Cost of hydrogen production from different energy technologies in the real world now and in 2030.
In their analysis, LucidCatalyst believe that light water reactors built with shipyard efficiencies should be the cheapest method of creating hydrogen in the long run. Either way, their work suggests it is a close run between that and hydrogen created by a high temperature gas reactor (HTGR), of which the Japanese HTGR is arguably the most mature design although the Chinese HTR-PMFootnote 35 was due to be loading fuel in early 2021.Footnote 36
6.6.1.2 Thermochemical Catalysis
With the availability of high temperature heat from advanced reactor designs, there are two (amongst many) thermochemical catalytic processes which become potentially very interesting. These are the copper-chlorine (Cu-Cl) cycle and the sulphur-iodine (S-I) cycle. Both these cycles are described in a comprehensive review by Funk.Footnote 37 Both of these operate at around 45–50% overall efficiency so may compete well with conventional electrolysis using the SOFCs. The Cu-Cl cycle could be well suited to the range of temperatures produced by the high temperature reactor designed by Urenco, the uBatteryFootnote 38, which is designed to produce heat up to 710 °C. The S-I cycle would fit better with high temperature designs such as the JAEA HTGR because of need for higher temperatures for one particular step in the cycle. The Japanese HTGRFootnote 39, which first went critical in 1998 and has many years of development behind it, recently restarted operations following the blanket shutdown of all nuclear facilities in Japan following the Fukushima tragedy.
The chemistry of the two catalytic cycles is shown below. First, the copper-chlorine cycle:
Secondly the sulphur(sic)-iodine cycle:
Overall:
6.7 Nuclear as a Battery
6.7.1 Natrium
Nuclear power has been traditionally lauded for its 24/7 baseload operations with high capacity factors. However, in an era when the inherent intermittency of other low-carbon electricity sources creates significant problems of despatching and load following, that always-on, firm power aspect of nuclear is sometimes criticized by proponents of renewable (as opposed to the real outcome needed, low-carbon) power. One recent design could change that perception and, at the same time, produce economically priced electricity, especially when financed at appropriately low cost of capital. The Natrium design, from TerraPower, which is the nuclear technology company founded by Bill Gates (a strong proponent of nuclear power to address Net Zero and climate change), takes a different approach to the problems of despatching and load following. The design couples a sodium cooled fast reactor (see also Sect. 6.9.2) with a sizeable storage capacity using molten salts. It is the molten salt store which provides heat for steam production for the turbines. When demand is low, the reactor’s heat is stored in the molten salt; when demand is high, the heat in the molten salt is used while the reactor continues to provide heat. The designers refer to the approach as a reactor and integrated energy storage device. At the time of writing, four Wyoming communities are in the running to play host to a new nuclear reactor coming to the state. The next generation plant will replace an existing coal fired plant. It is clear from the project’s backers that the design has attracted serious interest. Backers include PacifiCorp (a subsidiary of Berkshire Hathaway, for whom the plant will be built), Bechtel Corporation, GE Hitachi Nuclear Energy Americas, Energy Northwest, Duke Energy Carolinas (another experienced nuclear operating utility) and several US National Laboratories (Argonne, Idaho, Los Alamos, Oak Ridge and Pacific Northwest). Aspects of the design are shown in the single site layout graphic in Fig. 6.15 (reproduced here by kind permission of TerraPower LLC).

Source TerraPower LLC
Natrium single unit site layout.
The ability to ramp up and down the electrical output is shown diagrammatically in Fig. 6.16.

Source TerraPower
Natrium flexible power output diagram. Storage moves nuclear out of a solely baseload role, allowing greater utilization of renewables.
It is clear that the Natrium approach offers a potentially powerful solution, at a scale which does not test a nation state’s risk tolerance, to a world where nuclear and intermittent renewables will need to coexist efficiently. Solving the intermittency problems with endless batteries is beyond sledgehammer and nut analogies. Any rational system design, with access to technologies such as Natrium, is highly unlikely to prefer a battery solution unless utterly unavoidable. Clearly, with hydrogen production will come the desire for vast capacities of storage unless the hydrogen can, within a day or two, be created entirely to demand. The transitional technology of steam reformed methane will clearly help but with a primary energy system that is inherently controllable and predictable by combining technologies such as Natrium with renewables could well turn out to be the lowest cost solution. The developments in Wyoming deserve very careful observation both because of the ingenious technology but also the strong backing of Bill Gates and a hand-picked, professional team.
6.8 Nuclear as an Industrial Decarboniser
6.8.1 SMRs and Process Heat
In the race to decarbonize industry, private businesses in Poland are starting to set an example. There, three billionaires are working together to build nuclear reactors to provide process heat and power for their industrial processes. Sebastian Kulczyk’s company, Ciech, signed a letter of intent with Michał Sołowow’s company, Synthos. Recently, Zygmunt Solorz-Żak has also joined forces with Sołowow. Ciech and Synthos are cooperating in the development of small and micro-modular reactors. The cooperation of Ciech, a representative of energy intensive business of great importance for the Polish economy, with Synthos Green Energy may result both in accelerating the process of decarbonizing the domestic industry, but also in strengthening its position on the global market. Synthos has become a strategic and exclusive partner of GE-Hitachi Nuclear Energy Americas LLC in the implementation of SMR technology in the form of the BWRX-300 reactor. There will be many more in practice and there are a large number of discussions underway at the time of writing.
6.8.2 AMRs and Off-Grid Use (Mining, Other Remote Industrial Use)
The best examples here come from Canada where remote energy needs are a major challenge. There are many comminates where the energy is provided by diesel generation and in the worst cases, the diesel is flown in. There has been an impressive policy drive by Federal and Provincial governments to build trust and confidence in the nuclear prospects in Canada which not only includes exploiting the country’s national laboratory in an impressive and creative way but also the drive by Ontario Power Group who are currently down-selecting from three SMR opportunities—GE’s BWRX300, Terrestrial’s IMSR and the X-Energy reactor.
But for off-grid use, reactors such as uBattery are ideally placed either for community use or industrial/mining power. The Canadian Government has produced a number of clear policy documents, against which they continue to deliver. The Canadian Nuclear Association’s 2018 RoadmapFootnote 40 is a clear reference point and strongly supported by the government. Following that, the Federal Government launched an action plan in December 2020Footnote 41 and the momentum continues.
6.8.3 AMRs and Marine Decarbonization
As noted elsewhere (see Sects. 6.2 and 6.11), there is interest in ammonia as a fuel for shipping. However, this would come with major infrastructure requirements at all ports and dealing with a much nastier and riskier substance than conventional marine fuel. A group of Scandinavian shipping experts have created an organization by the name of Core PowerFootnote 42 with operations in London and Singapore and they are working on designs for nuclear powered ships working together with TerraPower and others. One of the fundamental differences between conventionally powered large container ships and nuclear powered ones is that fuel consumption is largely irrelevant (by comparison) and nuclear powered ships could be fuelled for 15–20 years. It is also possible, given the large amount of power available from nuclear sources, that large container ships can be designed to cruise at 30+ knots. Should that turn out to be practical, it will transform bulk shipping—the trans-Pacific trade will be very different and far more practical, and the Suez Canal will be less necessary as at 30 knots, travelling round Southern Africa will be entirely within clients’ timescales.
This is one of the intriguing developments happening largely under the radar.
6.9 Burning Our Legacy: New Reactor Design to Use up Waste
6.9.1 Closed Fuel Cycle
The nuclear power industry has forever had an Achilles heel in the minds of the public rising from the issue of nuclear waste. Waste is almost always the first or second question or objection raised when nuclear power is discussed publicly. A huge amount of work has been done on deep geological disposal in Finland (Onkalo—started construction in May 2021), the USA (Yucca Mountain and the operational site at WIPP in New Mexico) and in the UK where the work of the Radioactive Waste Management organization inherited decades of work by NIREX. In the UK, communities are now vying for the opportunity to have the deep geological disposal facility with Allerdale and Copeland (both near Sellafield) already in discussions. There are suggestions that other communities may come forward in due course.
The topic is sufficiently sensitive that in the UK’s 2008 White Paper, the policies were based on the assumption of a once-through fuel cycle (i.e. no more reprocessing) and a requirement that before permitting any nuclear build project, the Secretary of State had to be satisfied that “the Government will need to be satisfied that effective arrangements exist or will exist to manage and dispose of the waste they will produce”.
Deep geological disposal is not, however, the only option. In China and the Russian Federation there is continuing interest in a ‘closed fuel cycle’. When uranium is burnt in conventional reactors, only a small amount of the uranium is consumed (the235U). The vast bulk of the uranium (typically 97%) remains unburned. However, any element with a higher atomic number than 56 (iron) can, in theory, be split in a fission reaction to release energy. Broadly speaking, the higher the atomic number, the greater the amount of energy that can be released from the fission of each atom. The physics behind this can be found in many textbooks, the key concept being the ‘binding energy per nucleon’ (see Fig. 6.17)—that is, how much energy binds each proton and neutron together in the nucleus of the atom.

Source Ling et al. 2016
Binding energy per nucleon.
In principle, every atom of uranium could be split to release energy with the right sort of technology. Conventional nuclear reactors are designed to enable a fission chain reaction using slow neutrons—the function of the moderator in each reactor is to slow down the neutrons emitted in the nuclear chain reaction so that they, crudely, have more time to react with another uranium atom as the neutron travels around the reactor core. These slow neutrons are often referred to as ‘thermal neutrons’ as their speed is about the same as would be expected from molecules at normal operating temperatures whereas when the neutron is emitted from the fission process, its initial speed is much nearer to the speed of light. This can be observed in practice in the fuel ponds of nuclear reactors where spent fuel is stored and glows with a blue light. This is known as Cherenkov radiation and is produced when beta-particles (electrons) are slowed down from the (almost) speed of light in the uranium fuel to the (lower) speed of light in the water.Footnote 43
6.9.2 Fast Neutron Reactor
A different type of reactor can be designed which will use the fast neutrons directly without the need to slow them down. These are referred to as fast reactors and have been known since the earliest days of nuclear power—the reactors EBR-1 and its successor EBR-2, which first operated in December 1951 and July 1964, respectively. Crudely, fast reactors can be thought of as the neutrons hitting uranium atoms extremely hard and forcing the neutrons to split apart where to do so would release energy. On this basis, if uranium fuel were to be run for a long time (60 years is often cited as the sort of timescale necessary) the only elements that would be left would be much smaller (i.e. lower atomic numbers) and, again in general, radioactive mid-periodic table elements have much shorter half-lives than the high atomic number elements which are produced on the decay of uranium atoms in light water and other thermal neutron type reactors.
Hence the idea of a closed fuel cycleFootnote 44 is to start with uranium ores, enrich (or not), process in a sequence of reactors—slow and fast—and cause fission to happen for as long as possible. Then take the resultant waste with a relatively short half-life, store it as safely as possibly for a few hundred years and then take the remaining waste with, by then, a low level of radioactivity and return it to the mines from which the uranium was originally mined. China, India and the Russian FederationFootnote 45 have investigated these processes, as has France and the UK. In the 1970s, there was a clear view within the CEGB that a closed fuel cycle could work well in the UK given the experience in reprocessing (a necessary part of the fuel recycling process) and the work on the sodium cooled fast reactors at Dounreay that was part of the early work in that direction. Two fast power reactors have been built at Dounreay. First the Dounreay Fast Reactor (DFR) with an electric power of 15 MW, which began operation in 1960 and in 1962 became the first fast reactor power plant to supply electricity to a national grid. The DFR was closed in 1977. In 1975 the second fast reactor, the Prototype Fast Reactor (PFR) was connected to the grid. It had an electric power of 250 MW. It was closed in 1994. Like so much of the forward thinking from the CEGB, once State support for future energy development became unfashionable and entirely devolved to ‘markets’, the UK has lost leadership in many aspects of nuclear technology to other countries.
Work on a closed fuel cycle continues in a number of countries and ‘spent’ nuclear fuel is often referred to be some in the nuclear industry as ‘once-used’ fuel.
6.10 Nuclear as Low Cost Primary Energy
6.10.1 Powerful Impact of Cost of Capital
Nuclear power has a material advantage in that the operational lives of reactors built in the 21st century are now often 60 years as the initial design life but the designs themselves are such that 20 or maybe even 40 year life extensions are very likely. This, when taken with a sensible, low cost of capital, enables nuclear power to be competitive with renewables, even before the system costs of intermittency are considered. The current forecast by EdF Energy for the electricity price for the Sizewell C project, as shown in the work by David Newbery at the University of Cambridge,Footnote 46 along with nuclear costs more widely, demonstrate this clearly as shown in Fig. 6.18 (reproduced here by kind permission of the original author). Newbery concludes that “Nuclear power, whose costs are not predicted to fall over the next 30 years, is still cheaper than renewables (when including intermittency costs) over a wide range of WACCs when using the NIC (2020b) data, and even with Sizewell C cost assumptions, would be cheaper at WACCs below 4%.” There are many in the nuclear industry who would, at the time of writing, take a different view to Newbery on the future costs of nuclear and in the report being finalized at the time of writing from the UK’s Nuclear Industry Council—Nuclear 2050Footnote 47—the industry has set out that it can and will reduce costs by at least 30% with continuing new build and next of a kind (NOAK) learning. This NOAK learning has been seen in the fleet roll-out of wind and solar and is reputedly true in the Chinese fleet deployment of nuclear power.

Source Newbery 2020
Electricity cost sensitivity to WACC. Average costs per running hour in £/MWh. Note Low and high gas costs include low and high CO2 price projections from FES 2020.
As yet, there is too little recognition of the impact of the WACC on the electricity price of different forms of primary energy production. For a GW-scale project in the UK, the approximate sensitivities are about £8/MWh change for every £1 billion change in the capital cost of the plant. However, the figure is around £13/MWh change for each one percentage point change in the cost of capital. Reducing the cost of capital for a project financed plant from 9% WACC to 8% WACC reduces the electricity price by around £13 for every MWh generated. The figure for wind, according to Carbon BriefFootnote 48 is around £2.50/MWh for each percentage point change in WACC. It is important when considering economic models to be clear-eyed about the variations in sensitivity to WACC when (as many models do) making standard assumptions about WACC in a model.
It is worth considering the moral consequences of differences in cost of capital. First, the definition of WACC is simply the blended financing cost of a project or business considering all the sources of capital it employs and making adjustment for the different tax consequences of each form of finance—particularly that debt interest is tax deductible. For more details, see the Corporate Finance Institute’s resources.Footnote 49 In its simple form, the formula for WACC is
Where:
E = market value of the firm’s equity (market cap)Footnote 50
D = market value of the firm’s debt
V = total value of capital (equity plus debt)
E/V = percentage of capital that is equity
D/V = percentage of capital that is debt
Re = cost of equity (required rate of return)Footnote 51
Rd = cost of debt (yield to maturity on existing debt)
T = tax rate
6.10.2 Financing Should Not Be Harder Than Physics
It is well understood that in any country, the lowest cost of capital comes from simple borrowing by the government. This is in part because there is no real recognition of ‘equity’ in government financing—for conventional government financed projects there is no equity to perish in the event of major cost overruns, only the government debt appears to suffer. In practice, there is no penalty to the project and any losses are made up in practice either by cuts elsewhere in government expenditure or by budget increases (tax rises).
6.10.2.1 Project Finance—Limitations
In the approach used to finance conventional projects, a mixture of equity and debt is used. The cost of the debt and equity depends on the perceived risk of the projects but the cost of both is significantly higher than government borrowing. Until the second decade of the 21st century it was normal to see projects financed with WACCs in the high single digit percentages (not much under 10%) up into double digits—some of the early renewable projects were privately said to attract equity returns over 30% and WACCs nearer to 20%.Footnote 52
In the many, many PFI/PPP projects around the world, private capital was employed and in the good PFI/PPP deals there was a trade-off for the use of the more expensive private capital when compared to cheaper government debt. The trade-off was apparent when considering the whole life cost of a project. For certain types of project, roads, hospitals, certain types of defence contract, the propensity for optimism bias and bad project management within the public sector was believed to lead to higher than necessary whole life costs. In the PFI/PPP deals, the whole life cost was reduced with a trade-off between a higher cost of capital against the ability of the private sector to design, manage and operate the projects more efficiently, resulting in lower whole-life costs. This trade-off flows from the construct where the private owner and operator takes on many of the risks of the project which it then manages better than the public sector could or would; the traditional mantra being that risks are allocated to the party best able to manage and control each risk. In some cases, there is no doubt this approach has worked well but in reality, much depends on the quality of the design of the commercial arrangements and, as ever, the inherent wisdom of both those creating the deals and those operating them.
However, in larger nuclear projects, where the capital cost is in the £13 billion–>£20 billion range this sort of trade-off is not possible at least for the early projects in a fleet delivery. At this scale of project, the scale of potential risk is so large that no rational company would take it on. This has been proved, very painfully, by Hitachi’s purchase of the Horizon nuclear power project from E.ON and RWE in 2012 for which they reportedly paid close to £800 million. In 2019, after extended struggles to raise the finance for the project failed, despite both the British and Japanese governments being intimately involved, Hitachi wrote off US $2.75 billion from the equity in the project. In normal circumstances, the management and often the board of a firm reporting such a large write-off would be ignominiously sacked. However, on the leak of the announcement in the Japanese press, Hitachi’s share price rose.Footnote 53 In a private communication to the author, there was a suggestion that the actual share price recovery on the back of the announcement that Hitachi were stopping further work on the project actually created more value in the Hitachi enterprise than the value of the write-off, such was the deep concern by investors in the future of the project.
The reality is that for nationally significant projects such as high-speed rail, major underground tunnelling projects and large scale energy projects (whether the creation of primary energy or a large scale rebuilding of transmission or distribution systems), there is no escaping the fact that ‘governments own failure’. The early, first of a kind (FOAK) GW-scale nuclear projects (and perhaps even SMR projects) are ultimately sovereign risks. This is simply demonstrated by the fact that no private company will ever again take on a FOAK nuclear project in the UK on a traditional project finance basis. The L in PLC contains some of the logic—PLC stands for Public Limited Company and the risks the company can absorb are limited by its equity capital.
So, with the absence of a trade-off for higher costs of capital in conventional project finance, coupled with the great sensitivity of the electricity price to the cost of capital seen in Fig. 6.18, it is immediately obvious that nuclear power, probably irrespective of the scale of the project, ought to be financed by the lowest cost of capital possible. Not to do so simply creates an artificial tax on the cost of energy to a national economy where the proceeds of that ‘tax’—needlessly high interest rates or equity returns—flows not to a national exchequer but to investors who may well not be domiciled in the country of the project.
6.10.2.2 Regulated Asset Base Financing
The focus in the UK in 2021 is now around the use of regulated asset base (RAB) finance in financing new nuclear—and potentially other energy—projects. Following earlier consultationsFootnote 54 in the UK’s Energy White PaperFootnote 55 published in December 2020, there is now a recognition that the form of finance used since early privatizations in the UK could be applied to large new energy projects. To see the difference, the UK Regulators’ Network publication in September 2019Footnote 56 is instructive. There, the progress of the WACC used in regulated energy, telecoms and water is shown. After the appeals to the Competition and Markets Authority in 2020, the final WACC determinations for the water companies are around 2.3% real on a conventional RPI basis or 3.3% real on a CPI basis. If nuclear were to achieve something in the 4–4.5% region, the impact on nuclear electricity prices would be extremely significant, as Newbery has shown.
Given that the need to achieve Net Zero means the replacement of virtually all the primary energy production in most countries, the consequences of the way the new energy projects are financed will ultimately drive the energy competitiveness of the nation and through that, national economic competitiveness itself. Decisions taken in the earliest decades of the 21st century on the future energy systems and their financing will define national economic competitiveness in the 2050s and beyond. There will be material winners and losers here at a national level and it appears at the time of writing that few countries have yet fully understood the long term legacy nature of their energy policies, let alone the physical challenges referred to in Sect. 6.11.6.
6.11 Energy Markets
6.11.1 Markets in a Low-Carbon Era
Much of the logic and structure of electricity markets globally flows from the era of the privatization of largely complete electricity systems and the break-up of the monopolistic State structures that created them. Later we will look at some physical aspects of this but to start out with a background thought, consider this: in electricity markets, almost all the sources of low-carbon electricity are from sources with zero or virtually zero marginal costs. Wind, solar, nuclear and hydropower all have that one common attribute. Should there ever be a world in which hydrogen were to be the fuel for gas turbines then that condition could be broken.
But a market where marginal costs are near enough zero is clearly weird. Imagine that in any other real world market in operation.
For now, it is important to stand back and consider if any of the current—highly sophisticated—market models and mechanisms are fit for a low-carbon electricity world where the entire system is being rebuilt. Certainly, with a large enough hammer, existing markets can be forced to deal with such a world,
But now is the time for wise people to think about electricity markets in a low-carbon world from the very beginning. With this pace and scale of change, and the physical constraints which are obvious and referred to in Sect. 6.11.6, a re-examination of what a market is for, what society wants a market to deliver and how best to deliver that needs a complete review. Continuing with current market models, endlessly bending them into new and exotic shapes neatly fits the phrase “just because you can, doesn’t mean you should”.
6.11.2 When Do Markets Work Well?
There are two contexts within which to consider whether markets may, or may not, be applicable. First, the applicability of markets to the construction of nationally significant infrastructure or large scale infrastructure systems. This has been a well recognized issue in the context of PFI and PPP. Table 6.5 sets out conditions for an effective market and whether each condition applies to the construction of nationally significant infrastructure or large scale infrastructure systems. It is clear from this analysis that simple markets do not and cannot work well for such projects and enterprises.
But the other context in which markets are the standard mode of operation is for energy pricing and here the story is a little more mixed. Much of the creativity around energy markets arose post-privatization in the UK when economic theory became the servant of tough efficiency drives. A valuable resource to examine electricity markets globally is Harris’s book, ‘Electricity Markets—Pricing, Structures and Economics’.Footnote 57 Chapter 4 of the book covers the history of the liberalization of electricity markets. Rather than repeat the history here, suffice it to say that the story is long, complex and of almost filigree construction. The origins of much of the UK’s adoption of a market approach to energy goes back to the then Energy Minister, Nigel Lawson. Lawson stated at a BIEE conference in 1982: “I do not see the government’s task as being to try and plan the future shape of energy production and consumption. It is not even primarily to try to balance UK demand and supply for energy. Our task is rather to set a framework which will ensure that the market operates in the energy sector with a minimum of distortion and energy is produced and consumed efficiently.”Footnote 58
What is clear, is that there have been some significant problems in the almost experimental way liberalization was implemented, resulting in some unhelpful enduring problems in the 21st century and the energy system which now operates in different parts of the world. Some examples of those problems include:
-
A regulatory system in the UK focused on reducing the cost to consumers over a five year period, while the entire system is being designed with multi-generational consequences.
-
That regulatory system penalizing resilience and driving down capacity margins to the point where system balancing has become a major trading opportunity.
-
Major market price excursions in the independent gridFootnote 59 in Texas in February 2021 resulting from problems caused by extreme weather. Real-time wholesale market prices on the power grid operated by the Electric Reliability Council of Texas (ERCOT) were more than $9000/MWh late Monday morning, compared with pre-storm prices of less than $50/MWh, according to ERCOT data.Footnote 60
-
The electricity market in Australia: Problems have been compounded by many individual issues but a good example of system design flaws has been the successful introduction of large volumes of rooftop solar to a system where the distribution charges are simply based on kWh usage as opposed to buying the ultimate capacity needed by a user; as the usage falls, the very long wires in Australia become uneconomic without significant change in the pricing mechanism; SimshauserFootnote 61 states that “missing policies relating to climate change, natural gas and plant exit has recently produced results that have tested political tolerances.”
-
Negative pricing in both the UK and Australian markets are increasingly a consequence of the growth of intermittent generation and examples can be seen in Fig. 6.19. In early December 2019, Storm Atiyah hit the UK with wind speeds post-landfall of around 70 mph. The resulting electricity prices went to £-88/MWh, which was described by a renewables commentator as a “great early Christmas present” (see Fig. 6.20).
Fig. 6.19 
Zero or negative five-minute dispatch prices for May, Australian NEM 2011–2021. Source @GrantChalmers
Fig. 6.20 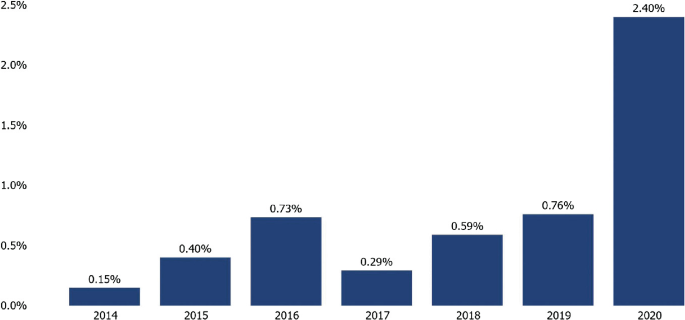
Source Elexon, see https://www.elexon.co.uk/article/elexon-insight-negative-system-prices-during-covid-19 (Accessed 14 July 2021) Elexon is to be recognized as the source of this material
Percentage of settlement periods with a negative system price in the UK since 2014. Note Low and high gas costs include low and high CO2 price projections from FES 2020 2020 is not a full year—includes 1 January 2010 to 31 May 2020.


These examples of distortionary elements of what are increasingly looking like inherently unstable energy systems flow from the UK’s electricity reforms of the early part of the second decade of this century. These reforms introduced Contracts for Difference (CfDs) to protect renewable generators from wholesale market price volatility by providing a guaranteed price relative to the day-ahead market price. This was part of the incentives for the renewable sector to continue to build apace and to socialize the inherent and inevitably rising costs of intermittency such that the wider market pays for those costs. Payments under the CfD regime are only available if the generator has sold its output into the day-ahead market, which of course then becomes rational and standard behaviour. If in practice on the day, the generator produces more than it had contracted for—a windfarm might generate more than expected if the weather is windier than forecast—the generator would then be subject to imbalanced costs. From the cost of balancing, there is no disincentive to over-produce since if the system operator requires the generator to reduce output, it will receive a curtailment payment—the generator is actually rewarded by adding unexpected problems onto the electricity market. This creates a material market distortion and the increase in zero-marginal cost sources of production will depress wholesale power prices, lowering returns for non-renewable generators and zero-marginal cost generation that has been built either without a subsidy, or with one of the other subsidy schemes.
As the inexorable rise of system balancing problems and opportunities continue, one engineering group with a systems level view of the problem has described “demand side response is the other side of supply side failure”.Footnote 62
6.11.3 What Is the Purpose of a Market?
Historically, markets have been powerful mechanisms in support of a Darwinian approach to evolutionary changes in energy production. They have worked well to provide signals to potential investors about which technologies turn out to be more efficient (read, produce greater or more stable financial returns). That has allowed evolution in gas turbine generation, for example, where the cost of a generating unit and the relative predictability of energy prices was within the risk appetite of normal commercial organizations.
Fundamentally, the market mechanisms have responded well to relatively slow and small pace and scale of change at any time from a technological perspective. However, disruptions in the regulatory systems such as the introduction of New Electricity Trading Arrangements (NETA) in the UK have caused some dramatic financial failures such as:
-
The bankruptcy of British Energy.
-
Driving out “excess” capacity to the point of seriously damaging resilience.
-
The announcement, in October 2002, from PowerGen, the German-owned group once seen in the city as a paragon, indicating a shutdown of a quarter of its generating capacity and bluntly telling ministers that the sector as a whole was “bust”.
-
TXU Europe, with more than 5 million customers in the UK, heading for insolvency, cut adrift by its struggling American parent which refused to invest £450 million to help it meet long term contracts with other producers and has put it up for sale. TXU said it had decided to take “dramatic action” to protect its US financial position and credit rating. Its shares had dropped sharply on Wall Street in early October 2002. They then fell another 39% in early trading to $11.50. “There were only two options: to protect TXU Europe or TXU Corporation,” a spokesperson said. “That’s not a difficult choice.” An inevitable market reaction—the question of whether it was right for UK citizens in the long run—is a different matter.
This whole section (Sect. 6.11) on energy markets makes clear the scale of the challenge in redesigning energy markets as a whole given the pace and scale of change necessary to replace virtually all the sources of primary energy in most countries over merely 30 years. The complexities of the electricity market in the UK post-privatization cannot be repeated as market solutions will not deliver the necessary primary energy production in time. There is too little trust and confidence, at the time of writing, for that even to be a pipe dream.
6.11.4 Markets as Darwinian Evolution
Before completing this section, it is worth considering markets as a Darwinian process.Footnote 63 For markets to be successful, the process is essentially a ‘generate and test’ approach to finding progressively better solutions to a problem. Biologically, this happens naturally through genetic mutations which can potentially occur with each cell division and each reproductive cycle. Industrially too, small product tweaks can happen on the production line.
Another way of considering evolution, is one approach to finding a minimum in a multi-dimensional surface such as the simple one in Fig. 6.21.

Source Gaortizg 2012
Simple optimization surface.
The real world solution to a systems design will have to cope with a multi-dimensional surface of far greater complexity with many local minima, and even if a global minimum exists, the process to move around the surface in search of the truly optimal minimum will take many iterations.
The process must create examples to test and a testing process which can weed out failures rapidly. Again, biologically this enables viruses such as the flu and common cold viruses to evolve continually and require rapid adaptation of any potential treatment regimen. For something as vast as the energy system where single elements such as a transmission or distribution system take many years to build, market driven evolution cannot work. At the margins, the practical operation of a system design can be finely tuned within the local minimum in which it inevitably sits. But any evolutionary approach to a good (let alone perfect!) energy system will fail without a very, very accurate guide in the form of a systems design which can point the way to small evolutionary refinements to a carefully thought-out plan.
6.11.5 An Example of a Systems Approach
One of the earliest attempts at a systems model was within the original DECC2050 calculatorFootnote 64 devised by the late Sir David MacKay who at the time was the Chief Scientific Adviser to DECC and the author of arguably the best book on low-carbon energy, Sustainable Energy—Without The Hot Air.Footnote 65 The calculator was the first device to enable policy makers to examine the potential impacts of policy ideas in the round and produced some very surprising results. It is worth examining the examples in that model to see the complexity of interaction of various carbon-reduction pathways. It is particularly interesting, and was a very unwelcome example at the time, to see exactly what the ‘Low Cost’ pathway suggested. The reader is encouraged to experiment with that model to gain some sense of just how complex and unintuitive the world of carbon reduction can be. The model itself was rapidly copied (the code itself was made freely available) by other countries and more than 25 similar models were created in other countries.Footnote 66
One of the latest attempts at a whole systems approach to modelling the sources of primary energy in a 2050 world was undertaken by the UK’s National Nuclear Laboratory together with the technology-neutral Energy Systems Catapult.Footnote 67 The work, published in June 2021Footnote 68 used a systems model developed by the Energy Systems Catapult known as “ESME”.Footnote 69 This is in distinct contrast to the work undertaken by the UK’s Department of Business, Energy and Industrial Strategy in the 2020 Energy White PaperFootnote 70 which was based on a dynamic dispatch model originally created for the Department by Lane, Clark and Peacock in 2012.Footnote 71 Nonetheless, while a whole systems approach is the only rational way to consider the redesign of the entire energy system for a nation, far too little of that sort of work has been completed to date and is not yet widely used in policy determination. There are other models of course—University College London has a wide range of modelling approachesFootnote 72—but there is yet to be a consistent approach to systems modelling at the national level, importantly with assumptions which are currently valid. As an example, at the time of writing, none of the modelling considers the potential impact of lower costs of capital from a RAB regime which would dramatically alter all the economic analyses.
6.11.6 Physical Challenges as Constraints in the Systems Approach
One of the biggest challenges in modelling a future systems approach is not just a reasonable assessment of the economics of the whole system, but the physical constraints and practicalities of replacing many GW/year of primary energy production from now to 2050. Two different types of constraint are particularly important—the actual construction constraints and the mechanisms by which energy is finally delivered to end users, domestic or commercial and industrial.
6.11.6.1 Primary Energy Creation—Physical Construction
An example of physical constraints around the choices of how primary energy might be produced is to consider the scenarios in the UK’s 2020 Energy White Paper modelling referred to in Sect. 6.11.5. In this report, Fig. 6.22 provides scenarios which include 5–40 GW of nuclear, 65–180 GW of wind and 15–120 GW of solar power.

Source Department for Business, Energy and Industrial Strategy 2020b
Low-cost energy scenarios.
First, consider the wind generation figures. There is, in 2021, about 24.5 GW of installed wind capacity, onshore and offshore. Incremental wind capacity is likely to be largely offshore given both the politics of the UK and where the big wind resource exists. At the time of writing, the largest wind turbine available is a 14 MW unit from GE (the Haliade-X). A marvel of engineering, this turbine is as tall as the Eiffel Tower in operation. The modelling suggests that the UK would need to build about 40–155 GW of new deployed wind capacity by 2050. Assuming this would all be supplied by turbines of 20 MW each, to allow for technological advances, that would imply building around 2000–7500 floating platforms on which to base these turbines, in deeper waters. Over the period from 2025 to 2050 that is a construction rate of between 80 and 300 floating platforms a year, every single year. Even achieving 80 per year will be very challenging. Separately, the area may also be an issue. The Dogger Bank wind project is currently expected to use 190 turbines each of 13 MW. The project will occupy two separate plots, one of 199 mi2, the other of about 231 mi2. On that basis, 2000 turbines would need about 4500 mi2, and 7500 turbines would need almost 17,000 mi2.
For solar power, the issue is not dissimilar. Figures for the land use requirements for solar are unclear but in the UK, the densest project is the one planned at Cleve Hill which is for up to 350 MWFootnote 73 and would cover around 1.89 mi2.Footnote 74 On that basis, 120 GW of solar would take around 650 mi2 of UK landmass.
These sorts of practicalities—rate of build of platforms, areas needed on land and at sea and the political effort involved in persuading the citizens of a country of the practicalities of these—remain very significant challenges which much modelling, at best, appears to gloss over.
6.11.6.2 Delivery of Energy to the End User
The second aspect of practicality that will need to be considered in the redesign of an energy system is the method of delivery of energy—whether primary or a derived vector such as hydrogen—to the end user. In the UK, as an example, about 17% of final energy is delivered to users as electricity, through the transmission and distribution system. The remaining ~80% is delivered as gases or liquids, as shown in Fig. 6.23.

Source Nuclear Industry Association
UK energy delivery channels.
Replacing the 76% of energy delivered as petroleum products or gas to a different delivery channel is an immense challenge. All the current plans for decarbonization of energy systems pretty much anywhere in the world will require a major increase in electricity production. In the UK, suggestions of as much as four times current electricity have been mooted. However large the scale, the wholesale rebuilding of transmission and distribution systems seems unavoidable. Given the historical basis of design as set out in Sect. 6.2, a wholesale rebuilding is almost certainly justified but will need to be approached based on a final system design treated as a programme of many projects. The practical sensitivities of rebuilding the distribution systems and at least reinforcing the last mile—let alone the upgrading of domestic connections with potentially replacing major wiring within houses—will need buy-in by citizens which itself will take strong leadership by politicians. Hence, it may help if the 29% of energy currently delivered by natural gas could be replaced by the same amount of energy delivered by a different vector—hydrogen is currently the favoured route in many countries. Issues such as steel embrittlement of piping systems, and the profound ability of hydrogen to leak and its lower energy density, present challenges that are now thought to be tractable. Hydrogen has about one third of the energy per unit volume as natural gas, although it is believed that the higher compressibility of hydrogen should make delivery of about three times the current volumes of natural gas potentially practicable.
Replacing the energy delivered by liquids, not just gasoline but Avgas and all the other liquid petroleum fuels, again becomes an issue of physical practicalities. While hydrogen is enthusiastically supported by many as a major alternative energy vector, ammonia is increasingly gathering interest as a possible marine fuel—while it has too low a flame velocity to work as a fuel alone in the large engines in ships, the addition of a small amount of methane, hydrogen or diesel to the ammonia reportedly may solve that problem. Both MAN in Germany and Samsung in the Republic of Korea are reportedly working on such engines and are predicting an ammonia-powered tanker to be in operation by around 2024.
6.12 Our Options and Approach
6.12.1 How Might We Approach a Solution?
6.12.1.1 Bravery, Leadership and Decisions
First, given the short remaining time until 2050, achieving the pace and scale of change necessary will require big, bold political decisions and leadership. It will take a focus on maximizing GW/year of new low-carbon primary energy subject to a price cap rather than minimizing £/MWh. It will also need the measure of price to be in terms of price to the national economy, not at the point of connection from the source and an end to the misleading practices of ‘socializing’ externalities such as the cost of intermittency.
Secondly, this leadership will produce legacies. Different countries will have different solutions of course, but here the history books will be the judge of the effectiveness of the leadership. Like it or not, the decisions taken over the early to mid-2020s will define energy costs for generations to come and with that national economic competitiveness. The resulting legacies will be on a scale of the introduction of the Welfare State in the late 1940s in the UK if not greater. The global competitive landscape is likely to be materially changed by the energy policies of nations as they adapt to Net Zero. The challenge for the politicians now is that of bravery. About forgetting the temptation of pursuit of perfection and minimizing costs to levels of spurious accuracy. Creating a system that is lower/lowest cost to the national economy will inevitably imperfect, and recognizing that in taking big decisions soon will inevitably be the lowest risk route. Technological changes will undoubtedly continue to occur but the time during which any technology can reach a technological readiness level (TRL) capable of mass deployment in time to make any difference to the outcomes of 2050 is very likely to be too long to make a practical difference.
All the technologies which work well today or are at high TRLs should be built as fast as possible now in combinations which will great speed of delivery with low system cost. Clearly any planning needs to deal with off-ramps should material technological developments materialize but to bet on some silver bullet appearing will be at best a fool’s errand and at worst damaging to a nation’s prospects.
6.12.2 Low Regrets—Use Technology Deployable Now, Focus Investment There
So, what is deployable now at scale. Clearly, offshore wind has developed well and with the giant 14 MW GE Haliade-X turbines offshore wind is deployable at GW scale in the UK. Solar is not deployable at the same scale in countries like the UK. Steam reformed methane with CCUS may well be deployable at reasonable scale but only after the creation of a proven carbon capture and sequestration technology. This could deliver hydrogen at scale. Whether it will be cheaper than high temperature electrolysis or hydrogen from high temperature heat from advanced reactors remains to be seen. GW-scale nuclear reactors can be delivered at speed where the project management disciplines, coupled with a developed supply chain and experienced contractors are all in place and properly financed and governed. The speed of deployment of nuclear reactors can be seen clearly in Fig. 6.24.

Reactor construction times. Source @GrantChalmers
The answer to the question “What are the low-regrets options?” depends entirely on the country of choice. Apart from the scale of renewable resource, the ability to construct the new system on time is probably the largest single determinant. In the nuclear world, it is important to consider exactly why the time to build nuclear reactors varies so dramatically between Japan and the Republic of Korea versus the USA and the UK. It is clear that a robust and consistent approach to project management is an important part of that difference and the useful Nuclear Cost Drivers study by the UK’s Energy Technology InstituteFootnote 75 particularly highlights this factor. Key findings from the study are set out in Table 6.6.
The reality, of course, is that nuclear power projects are large, complex projects of the scale and complexity which the fossil industry has mastered for many years. Those examples of nuclear projects which badly slip in time and cost are often not issues driven by unknown or misunderstood technology. They are generally classic example of problems in any large project. As part of any approach to a new energy system design in a country, there should be a proper examination of which technologies a country could build at pace and scale, taking into account the factors listed in Table 6.6. It is very instructive to consider how the United Arab Emirates managed to build its first reactor faster than the median time taken in either the UK or the USA although in a country which had no nuclear pedigree whatever. Clearly, there was a huge advantage in constructing a very close replica of a design which had been built repeatedly elsewhere, using the same teams to build it as before, accepting country-of-origin certification for the design while establishing an extremely experienced nuclear safety regulator which would have approval control of commissioning and operation. But the other factor which undoubtedly made a material difference was the quality of the thinking and preparation which took place before any construction began. The hiring of an experienced and proven project director, the development of a robust and thorough construction plan, the use of experienced contractors and the degree of completeness of the engineering design also helped. But the whole approach of building the project’s reputation from the very outset was probably one of the other pivotal factors. A wise expert in reputation management sat next door to the chief executive from the very earliest days of the project and the focus of the chief executive on the importance of the project’s reputation was crystal clear. There is no doubt that the ENEC project in Abu Dhabi has set an example for others to follow.
The ENEC project, whilst first in country was the nth of a kind in that the exact same reactors had been previously built and operated in the Republic of Korea. The ENEC reactors were indeed new to the country but by using precisely the same design as had been built in the Republic of Korea, the ENEC reactors had many of the attributes of the nth of a kind when considering success factors for building on time and on budget. And indeed, fleet build of a small number of reactor designs was at the heart of the restart of nuclear power construction as set out in the 2008 White Paper which triggered the UK’s first major legislative move towards a low-carbon energy system. It will be interesting to see if the UK manages to achieve a fleet build of any nuclear technology—at the time of writing, Hinkley Point C is under construction and the second plant in the series, Sizewell C, is under consideration. But little else is clear. This is a major contrast with the attitudes now in Canada, China, increasingly in the USA and now many countries in Europe. Last time the UK built a new nuclear power station, Sizewell B, it was intended to be one of a larger fleet of up to ten units. Political will evaporated during the first unit even though that unit is probably the only currently operating source of low-carbon primary energy which will still be in operation in 2050 (assuming, of course, that it obtains a 20-year life extension).
Many other countries are watching the UK as a potentially important market for nuclear power but doing so with a degree of scepticism which will only be overcome by a strong injection of political leadership, will and true commitment. Without those, why would investors take on the financing (whether debt or equity) of a nuclear power station even when operational, let alone during construction even under RAB terms? Why would the supply chain invest even more ahead of time to build capability, capacity and resilience in their businesses in the UK? The Japanese stock market has already spoken its view through their refusal to support Hitachi’s UK venture with Horizon. Investors are now far too scarred by political damage in energy markets—the memories of the Spanish government’s about-face on the renewables market from 2010, culminating in the slashing of contractually binding feed-in-tariffs for operational projects, have not been forgotten.
The addition over recent years of investors’ requirements for only Environmental, Social and Governance (ESG) qualified investments has further added to potential political risk. Pressures applied by major investors such as BlackRockFootnote 76 have intensified to squeeze out non-ESG investments. This has created a large battlefield for anti-nuclear sentiment from many sources. Governmental taxonomies in Europe and elsewhereFootnote 77 rarely start out as technology neutral—that was the case with the European taxonomy and despite the work of a technical expert groupFootnote 78 concluding that “The analyses did not reveal any science-based evidence that nuclear energy does more harm to human health or to the environment than other electricity production technologies already included in the Taxonomy as activities supporting climate change mitigation.” Unless nuclear is properly recognized as a low-carbon, sustainable source of primary energy, it will be at risk of failing to attract a significant class of investors.
6.13 Final Thoughts
A US military leader, commenting on a reflection of the reactions of the USA to 9/11, said “When emotions are high, rationality’s low, and poor decisions are made.” Nuclear is, and continues to be, beset by emotions in many discussions about its possible use in a rational, balanced, secure and resilient energy system. Very poor decisions have been and continue to be made. The word ‘nuclear’ produces intellectual paralysis in too many policy makers and politicians because of the aggressive and rightly hated weapons connotations.
But society can deal with such cognitive contradictions elsewhere. Nitroglycerine (UK spelling) is in the mind of many of the public, the safe-cracker’s explosive of choice—at least it is in the movies. For a smaller group of the population, it is also the substance which makes dynamite, and which made a young Alfred Nobel extremely rich and enabled him to endow the eponymous prize. But to a very small few, when taken into the emergency room with heart problems, when they are treated with a drug with names like “Nitrocot” or “Nitrostat”, it is that same nitroglycerine—but in a non-explosive formulation. It is how the science is used, not the science itself which matters. Similarly, with radiation, if you sit out in the midday sun in Abu Dhabi in July for a couple of hours, you will be very badly sunburned. Sitting out in the moonlight that same evening will be entirely harmless (at least from the perspective of sunburn). It is exactly the same radiation—photons of the same (give or take) wavelengths, just different amounts. With ionizing radiation, the United Nations Scientific Committee on the Effects of Atomic Radiation (UNSCEAR) is clear that for doses under 100 mSv, there is no evidence of increasing risk of cancer. That does not stop people panicking when told they have had a dose of one or two millisieverts—the ionizing radiation equivalent of moonlight. And while they panic about a millisievert or two, their friend receiving radiotherapy for cancer may well be receiving 20 sieverts—20,000 times more—designed to make their friend well. It is how the science is used, not the science itself.
For the public, politicians need to provide leadership. Not by the equivalent of eating hamburgers during the CJD epidemic but by discussion and using the skills which politicians are selected for—to convince voters that their leaders will overall make the voters’ world a better place. And to create trust and confidence. If future energy policy is driven by emotion, bad decisions will result. The result will be a much poorer country for our grandchildren, and many may well end up moving abroad to a country which made the better decisions in the 2020s.
One thing is now clear. The world is out of time and must act now, flat out, maximizing the building of GW/year of new low-carbon capacity of primary energy production. In making the decisions around energy policy, legacies of the scale of the creation of the UK welfare state in 1948 will be made—huge legacies, by which names will be remembered including (for UK readers) Winston Churchill, Rab Butler, William Beveridge and Nye Bevin. But that is only for those politicians who have the bravery, insight, and willingness to learn and act following science, engineering and fact. For those who barge along dreaming of some whizzy new technology arriving next year to save them from making a decision today, or for those whose modus operandi is NIMTO—not in my term of office—their legacies will be millstones around the necks of their children, grandchildren and onwards and their names will be reviled in the history books.
Our leaders have a choice.
Notes
- 1.
The ‘substitution method’—in comparison to the ‘direct method’—attempts to correct for the inefficiencies (energy wasted as heat during combustion) in fossil fuel and biomass conversion. It does this by correcting nuclear and modern renewable technologies to their ‘primary input equivalents’ if the same quantity of energy were to be produced from fossil fuels.
- 2.
- 3.
Iceland, with a major geothermal resource, regularly has carbon emissions around 50 gCO2 eq/kWh. See as an example https://twitter.com/GrantChalmers/status/1404713459091066880?s=20. Accessed 14 July 2021.
- 4.
HM Government 2020 (Nuclear power is the third section after offshore wind and low-carbon hydrogen).
- 5.
https://grist.org/energy/the-cost-of-germany-going-off-nuclear-power-thousands-of-lives. Accessed 14 July 2021; https://www.nber.org/papers/w26598. Accessed 14 July 2021; https://www.welt.de/wirtschaft/plus204786230/Atomausstieg-Was-die-Energiewende-wirklich-kostet.html. Accessed 14 July 2021.
- 6.
- 7.
https://www.dw.com/en/nuclear-power-in-germany-a-chronology/a-2306337 (A brief history of nuclear power in Germany). Accessed 14 July 2021.
- 8.
Marx 2014.
- 9.
See as an example Fuchs et al. 2021.
- 10.
Chivers et al. 2017.
- 11.
See as an example Ling et al. 2016.
- 12.
OECD/NEA 2011.
- 13.
https://www.thetimes.co.uk/article/were-pivoting-to-nuclear-but-are-ministers-too-late-vjrmhltb2. Accessed 17 October 2021.
- 14.
- 15.
https://www.southerncompany.com/innovation/vogtle-3-and-4.html. Accessed 14 July 2021.
- 16.
UK Climate Change Committee 2020.
- 17.
World Nuclear Association 2021a.
- 18.
Black et al. 2019.
- 19.
World Nuclear Association 2021b.
- 20.
Personal communication.
- 21.
https://www.ukri.org/news/uk-government-invests-215-million-into-small-nuclear-reactors. Accessed 14 July 2021.
- 22.
https://nuclear.gepower.com/build-a-plant/products/nuclear-power-plants-overview/bwrx-300. Accessed 14 July 2021.
- 23.
- 24.
https://smrroadmap.ca. Accessed 14 July 2021.
- 25.
- 26.
https://corepower.energy. Accessed 14 July 2021.
- 27.
LucidCatalyst 2020.
- 28.
https://thorconpower.com. Accessed 14 July 2021.
- 29.
- 30.
- 31.
Elder et al. 2015.
- 32.
SOFCs were originally designed to generate electricity from hydrogen and oxygen but can be reversed to produce the elements by high temperature electrolysis of steam; Keçebaşa et al. 2019.
- 33.
- 34.
https://inl.gov/article/new-technology-improves-hydrogen-manufacturing. Accessed 14 July 2021.
- 35.
The CNNC HTR-PM is a pebble-bed type reactor which has been under development since about 2012 and uses spherical, accident-tolerant fuels. Its initial use is for electricity production.
- 36.
https://www.neimagazine.com/news/newsfirst-fuel-shipped-to-chinas-htr-pm-project-8453226. Accessed 14 July 2021.
- 37.
Funk 2001.
- 38.
https://www.u-battery.com. Accessed 14 July 2021.
- 39.
Nishihara et al. 2018 (Description of the Japanese HTGR).
- 40.
https://smrroadmap.ca. Accessed 14 July 2021.
- 41.
- 42.
https://corepower.energy. Accessed 14 July 2021.
- 43.
https://www.radioactivity.eu.com/site/pages/Cherenkov_Effect.htm. Accessed 14 July 2021.
- 44.
IAEA 2011.
- 45.
https://www.world-nuclear-news.org/Articles/Russia-proposes-new-closed-fuel-cycle. Accessed 14 July 2021.
- 46.
Newbery 2020.
- 47.
Report in progress at time of writing and to be made available at: https://www.niauk.org (forthcoming).
- 48.
https://www.carbonbrief.org/wind-and-solar-are-30-50-cheaper-than-thought-admits-uk-government. Accessed 14 July 2021.
- 49.
See as an example https://corporatefinanceinstitute.com/resources/knowledge/finance/what-is-wacc-formula. Accessed 14 July 2021.
- 50.
https://corporatefinanceinstitute.com/resources/knowledge/finance/what-is-market-capitalization. Accessed 14 July 2021.
- 51.
- 52.
Private communication to the author from the manager of a major investor in early renewable projects.
- 53.
- 54.
Department for Business, Energy and Industrial Strategy 2020a.
- 55.
Secretary of State for Business, Energy and Industrial Strategy 2020.
- 56.
UKRN 2019.
- 57.
Harris 2006.
- 58.
This was subsequently quoted in UK parliamentary report on The Price of Power: Reforming the Electricity: Market Contents: https://publications.parliament.uk/pa/ld201617/ldselect/ldeconaf/113/11305.htm. Accessed 14 July 2021.
- 59.
Texas, Hawaii, and Alaska have independent grids.
- 60.
https://www.reuters.com/article/us-electricity-texas-prices-idUSKBN2AF19A. Accessed 14 July 2021.
- 61.
Simshauser 2019.
- 62.
Private communication triggered by articles predicting that IoT creativity ‘behind the meter’ could solve many of the problems of intermittency in a renewables-heavy electricity grid.
- 63.
See as an example Rajagopal 2015.
- 64.
http://classic.2050.org.uk. Accessed 14 July 2021.
- 65.
MacKay 2009. In the author’s opinion this should be mandatory reading for anyone interested in the achievement of Net Zero.
- 66.
https://www.gov.uk/guidance/international-outreach-work-of-the-2050-calculator. Accessed 14 July 2021.
- 67.
https://es.catapult.org.uk. Accessed 14 July 2021.
- 68.
UK National Nuclear Laboratory 2021.
- 69.
https://es.catapult.org.uk/capabilities/modelling/national-energy-system-modelling. Accessed 14 July 2021.
- 70.
Department for Business, Energy and Industrial Strategy 2020b.
- 71.
Department of Energy and Climate Change 2011.
- 72.
https://www.ucl.ac.uk/energy-models/models. Accessed 14 July 2021.
- 73.
https://www.clevehillsolar.com. Accessed 14 July 2021.
- 74.
https://www.kentwildlifetrust.org.uk/campaigns/planning-and-development/cleve-hill-solar-park. Accessed 14 July 2021.
- 75.
Energy Technologies Institute 2018.
- 76.
https://www.blackrock.com/corporate/investor-relations/larry-fink-ceo-letter. Accessed 14 July 2021 (Letter to clients).
- 77.
- 78.
European Commission 2021.
References
Black G, Aydogan F, Koerner C (2019) Economic Viability of Light Water Small Modular Nuclear Reactors: General Methodology and Vendor Data. Renewable and Sustainable Energy Reviews 103:248–258
Cheng V, Hammond G (2017) Life-Cycle Energy Densities and Land-Take Requirements of Various Power Generators: A UK Perspective. Journal of the Energy Institute 90:201–213
Chivers J, Foxon T, Galloway S, Hammond G, Infield D, Leach M, Pearson P, Strachan N, Strbac G, Thomson M (2017) Realising Transition Pathways for a More Electric, Low-Carbon Energy System in the United Kingdom: Challenges, Insights and Opportunities. Proceedings of the Institution of Mechanical Engineers, Part A: Journal of Power and Energy 231:440–477
Climate Change Committee (2020) Sixth Carbon Budget https://www.theccc.org.uk/publication/sixth-carbon-budget. Accessed 14 July 2021
Department for Business, Energy and Industrial Strategy (2020a) RAB Model for Nuclear https://assets.publishing.service.gov.uk/government/uploads/system/uploads/attachment_data/file/943762/Nuclear_RAB_Consultation_Government_Response-.pdf. Accessed 14 July 2021
Department for Business, Energy and Industrial Strategy (2020b) Modelling 2050: Electricity System Analysis
https://assets.publishing.service.gov.uk/government/uploads/system/uploads/attachment_data/file/943714/Modelling-2050-Electricity-System-Analysis.pdf. Accessed 14 July 2021
Department of Energy and Climate Change (2011) DECC Dynamic Dispatch Model (DDM)
https://assets.publishing.service.gov.uk/government/uploads/system/uploads/attachment_data/file/65709/5425-decc-dynamic-dispatch-model-ddm.pdf. Accessed 14 July 2021
Elder R, Cumming D, Mongensen M (2015) High Temperature Electrolysis. In: Styring P, Quadrelli E A, Armstrong K (eds) Carbon Dioxide Utilisation: Closing the Carbon Cycle. Elsevier, pp 183–209
Energy Technologies Institute (2018) The ETI Nuclear Cost Drivers Project: Summary Report
https://d2umxnkyjne36n.cloudfront.net/documents/D7.3-ETI-Nuclear-Cost-Drivers-Summary-Report_April-20.pdf?mtime=20180426151016. Accessed 14 July 2021
European Commission (2021) Technical Assessment of Nuclear Energy with Respect to the ‘Do No Significant Harm’ Criteria of Regulation (EU) 2020/852 (‘Taxonomy Regulation’), JRC124193.
https://ec.europa.eu/info/sites/default/files/business_economy_euro/banking_and_finance/documents/210329-jrc-report-nuclear-energy-assessment_en.pdf. Accessed 14 July 2021
Fuchs C, Poehls A, Skau K, Kasten J (2021) Economics of Battery Use in Agriculture: Economic Viability of Renewable Energy Complemented with Batteries in Agriculture. Energies 14:2430
Funk J (2001) Thermochemical hydrogen production: past and present. International Journal of Hydrogen Energy 26:185–190
Gagnon L, Belanger C, Uchiyama Y (2002) Life-cycle assessment of electricity generation options: The status of research in year 2001. Energy Policy 30:267–1278.
Harris C (2006) Electricity Markets: Pricing, Structures and Economics. Wiley, Hoboken, NJ
HM Government (2020) The Ten Point Plan for a Green Industrial Revolution. https://www.gov.uk/government/publications/the-ten-point-plan-for-a-green-industrial-revolution. Accessed 14 July 2021
International Atomic Energy Agency (IAEA) (2011) The Nuclear Fuel Cycle. https://www.iaea.org/sites/default/files/nfc0811.pdf. Accessed 14 July 2021
Keçebaşa A, Muhammet K, Mutlucan B (2019) Electrochemical hydrogen generation. In: Calise F, Dentice D’Accadia M, Santarelli M, Lanzini A, Ferrero D (eds) Solar Hydrogen Production. Academic Press, pp 299–317
Ling S, Sanny J, Moebs W (2016) Nuclear Binding Energy. In: Ling S, Sanny J, Moebs W (eds) University Physics Volume 3. OpenStax, Texas
LucidCatalyst (2020) Missing Link to a Livable Climate: How Hydrogen-Enabled Synthetic Fuels Can Help Deliver the Paris Goals. https://www.lucidcatalyst.com/hydrogen-report. Accessed 14 July 2021.
MacKay D (2009) Sustainable Energy—Without The Hot Air. UIT, Cambridge
Marx C (2014) Failed Solutions to the Energy Crises: Nuclear Power, Coal Conversion, and the Chemical Industry in West Germany since the 1960s. Historical Social Research / Historische Sozialforschung 39:251– 271
National Nuclear Laboratory (2021) UK Energy System Modelling: Net Zero 2050
https://www.nnl.co.uk/wp-content/uploads/2021/06/NNL-UK-Energy-System-Modelling-for-Net-Zero.pdf. Accessed 14 July 2021
Newbery (2020) Net Zero and Future Energy Scenarios: A Response to the National Infrastructure Commission’s Report on Future Power Systems. EPRG. https://www.eprg.group.cam.ac.uk/wp-content/uploads/2020/03/D.-Newbery_Comment_26March2020.pdf. Accessed 14 July 2021
Nishihara T, Yan X, Tachibana Y, Shibata T, Ohashi H, Kubo S, Inaba Y, Nakagawa S, Goto M, Ueta S, Hirota N, Inagaki Y, Iigaki K, Hamamoto S, Kunitomi K (2018) Excellent Feature of Japanese HTGR Technologies. Japan Atomic Energy Agency, Ibaraki
OECD Nuclear Energy Agency (OECD/NEA) (2011) Technical and Economic Aspects of Load Following with Nuclear Power Plants. https://www.oecd-nea.org/ndd/reports/2011/load-following-npp.pdf. Accessed 14 July 2021.
Rajagopal (2015) The Butterfly Effect in Competitive Markets. Palgrave Macmillan, London
Secretary of State for Business, Energy and Industrial Strategy (2020) Energy White Paper: Powering Our Net Zero Future. https://assets.publishing.service.gov.uk/government/uploads/system/uploads/attachment_data/file/945899/201216_BEIS_EWP_Command_Paper_Accessible.pdf. Accessed 14 July 2021
Simshauser P (2019) Lessons from Australia’s National Electricity Market 1998–2018: The Strengths and Weaknesses of the Reform Experience. https://www.eprg.group.cam.ac.uk/wp-content/uploads/2019/08/1927-Text.pdf. Accessed 14 July 2021
UKRN (2019) Cost of Capital—Annual Update Report. https://www.ukrn.org.uk/wp-content/uploads/2019/09/2019-UKRN-Annual-Cost-of-Capital-Report-Final-1.pdf. Accessed 14 July 2021
World Nuclear Association (2021a) Advanced Nuclear Power Reactors. https://world-nuclear.org/information-library/nuclear-fuel-cycle/nuclear-power-reactors/advanced-nuclear-power-reactors.aspx. Accessed 14 July 2021
World Nuclear Association (2021b) Small Nuclear Power Reactors. https://www.world-nuclear.org/information-library/nuclear-fuel-cycle/nuclear-power-reactors/small-nuclear-power-reactors.aspx. Accessed 14 July 2021
Author information
Authors and Affiliations
Corresponding author
Editor information
Editors and Affiliations
Rights and permissions
The opinions expressed in this chapter are those of the author(s) and do not necessarily reflect the views of the [NameOfOrganization], its Board of Directors, or the countries they represent
Open Access This chapter is licensed under the terms of the Creative Commons Attribution 3.0 IGO license (http://creativecommons.org/licenses/by/3.0/igo/), which permits use, sharing, adaptation, distribution and reproduction in any medium or format, as long as you give appropriate credit to the [NameOfOrganization], provide a link to the Creative Commons license and indicate if changes were made.
Any dispute related to the use of the works of the [NameOfOrganization] that cannot be settled amicably shall be submitted to arbitration pursuant to the UNCITRAL rules. The use of the [NameOfOrganization]’s name for any purpose other than for attribution, and the use of the [NameOfOrganization]’s logo, shall be subject to a separate written license agreement between the [NameOfOrganization] and the user and is not authorized as part of this CC-IGO license. Note that the link provided above includes additional terms and conditions of the license.
The images or other third party material in this chapter are included in the chapter’s Creative Commons license, unless indicated otherwise in a credit line to the material. If material is not included in the chapter’s Creative Commons license and your intended use is not permitted by statutory regulation or exceeds the permitted use, you will need to obtain permission directly from the copyright holder.
Copyright information
© 2022 International Atomic Energy Agency, Vienna
About this chapter

Cite this chapter
Stone, T. (2022). The Challenge of Climate Change—Complete Energy Systems Transformation: No Nuclear, No Net Zero. In: Nuclear Law. T.M.C. Asser Press, The Hague. https://doi.org/10.1007/978-94-6265-495-2_6
Download citation
DOI: https://doi.org/10.1007/978-94-6265-495-2_6
Published:
Publisher Name: T.M.C. Asser Press, The Hague
Print ISBN: 978-94-6265-494-5
Online ISBN: 978-94-6265-495-2
eBook Packages: Law and CriminologyLaw and Criminology (R0)