
Abstract
Choosing appropriate measurement sites for further investigation is one of the crucial points in determining the UHI intensity. To obtain comparable values among different cities we should use measurements obtained in similar circumstances. In the context of the deployment of an urban climate network, this guideline contains recommendations for meteorological measurement and data processing for data users who are not professionals in the field of climate measurement in urban environments. This paper presents a classification of urban measuring sites, lists steps for choosing representative stations, and provides standardized methods developed for urban climate stations and network design. Finally, these standardized approaches and guidelines are useful for making recommendations for the future deployment of urban climate networks. The final parts include the new communication and data transmission techniques for urban observation networks.
The original version of this chapter was revised. An erratum to this chapter can be found at http://dx.doi.org/10.1007/978-3-319-10425-6_15
You have full access to this open access chapter, Download chapter PDF
Keywords
- Urban climate observation
- Local Climate Zone
- Urban site location
- Exposure of instruments
- Metadata
- Data management
1 Introduction
Before any type of standard recommended by standardization committees is employed in practice, the following points should be emphasized:
-
The application of standards is not compulsory.
-
Obeying standards is usually voluntary.
-
These statements are supplied as recommendations and suggestions during the investigation and studying of urban climate.
The original aims in elaborating these guidelines were:
-
to review the current status of urban observations and the establishment of urban meteorological networks;
-
to identify sampling infrastructures to be developed in urban areas;
-
to provide a reference system for cities which lack a monitoring network but intend to deploy one;
-
to demonstrate a prototype for a new monitoring system that is already operational.
Any city operating measurement sites for UHI detection is strongly encouraged to adopt the recommendations of the Gold Standard to its measurement and evaluation systems in order to obtain better coverage of UHI phenomena over the city.
Finally, these standardized approaches and guidelines are useful for making recommendations for the future deployment of urban climate networks. The final chapter includes the new communication and data transmission techniques for urban observation networks.
In this era, environmental observations are not the sole privilege of hydrological and meteorological institutions. There are several examples of different networks working together, with the output of each supplementing the others. It remains true that reliable data are needed; networks and measuring systems need to meet various requirements (for example ISO 2009:2008). Complying with these regulations and laws can make the operation of such measuring systems more expensive.
The description presented below shows that any kind of observation requires a significant financial effort, technical background, and maintenance capacity for any agency, municipality, or national institution undertaking this activity. New in-situ observatories based on citizens’ personal devices reduce investment in and running costs of in-situ observations and monitoring applications. One method called “Citizen Observatories” is based on devices such as smart phones, tablets, laptops, and social media, and it can strengthen environmental monitoring capabilities.
2 Concepts
The heterogeneous natural and artificial surfaces of urban environments imply that atmospheric observations require a dense measuring network to resolve the local climate adequately. In this document, the current state of urban meteorological sites and networks is shown. Afterward, this document presents suggestions for better descriptions and representations of the surroundings of stations, and it also outlines better documentation of network characteristics, standardized approaches, and recommended guidelines for urban observations to follow.
Before the deployment of a meteorological station, logistics and plans are needed. The establishment a new urban climate network requires a huge financial commitment from the developer; underscoring the need for forward-looking planning. Prior to implementation, the investigator should make efforts to find suitable meteorological sites and instruments; determine their measurement programs; and describe the frequency of maintenance and calibration procedures required by quality assurance and quality control (QA/QC) systems for any kind of measurement.
The observation of urban climate can proceed through mobile measurements and stationary sites. Because of the relatively high cost and difficulty in siting equipment for fixed meteorological monitoring stations, their deployment and maintenance ultimately results in sparse data coverage for urban areas. In this document, recommendations are made for the operation of fixed meteorological stations and networks, which are the only way to gain sufficient, detailed information from urban regions. These observation methods can be complemented by remote sensing techniques used for interpolation, but even these do not allow for the appropriate spatial and temporal resolution or a sufficiently wide range of observed variables.
Traditionally, meteorological measurements have not been taken in urban areas but in open areas representing larger regions, as the WMO (2008) prescribed in siting synoptic measuring stations, and as it was also presented in Chapter 5 of the UHI Assessment Manual. However, on many occasions it is impossible or makes no sense to conform to these guidelines. This document recommends some principles that will help in such circumstances, even though it is not possible to anticipate all eventualities. The recommendations presented here remain in agreement with general objectives set out by the WMO (see the chapter “Exposure of instruments”). Many urban stations have been placed over short grass in open locations (parks, playing fields), and as a result they are actually monitoring an environment of the type modified rural. In many respects, the generally accepted standards for the exposure of meteorological instruments set out in WMO (2008) applies to urban sites. All details, including deviations from guidelines, should be logged thorough “metadata” (additional information about the whole network), which is essential in order to provide a data end-user with the information required to process and use the network’s data adequately.
This paper aims to provide instruction on how to obtain integrated and harmonized measurement data in relation to UHI phenomenon, by standardizing and unifying urban microclimate data. Toward these ends, the following items will be discussed:
-
Defining urban climate zones
-
Site placement
-
Network design
-
Instrumentation
-
Operational definition
-
Reporting of data.
Complex, morphologically heterogeneous urban environments must be studied in fine detail, so it as necessary to obtain a better understanding of weather and climate interactions and impacts in these areas. Robust planning, design, field documentation, installation, management, quality assurance (QA), and maintenance are essential parts of any successful network of sensors.
Prior to the establishment of a new monitoring network in an urban environment, the following logistical steps should be undertaken:
-
1.
Collect information and consult with experts about the climate observations and surveying or measuring activities in advance.
-
2.
In the planning phase, write a detailed task list. Determine the aims and tasks of the measurement program.
-
3.
List the measurement climate elements (see the UHI Assessment Manual, Chapter 6) and define the technical requirements of measurement as range, reported resolution, required measurement uncertainty, sensor time constant, output averaging time, and achievable measurement uncertainty (see the UHI Assessment Manual, Chapter 7, for a detailed description).
-
4.
Process orders to obtain the most appropriate equipment.
-
5.
Choose the sites and install the equipment.
-
6.
Prepare sensors and data logging and metadata files (see the UHI Assessment Manual, Chapter 8, for a description of metadata).
-
7.
Record the calibration and maintenance requirements of the climate network. These steps are summarized in Fig. 2.1. After their implementation, reliable climate data will be available for the further evaluation and statistical analysis of climate signals in a given urban area.
The original aims in elaborating these guidelines were
-
to review the current status of urban observations and the establishment of urban meteorological networks;
-
to identify sampling infrastructures to be developed in urban areas;
-
to provide a reference system for cities which lack a monitoring network but intend to deploy one;
-
to demonstrate a prototype for a new monitoring system that is already operational.


Process chain for measurement project planning, management and service
Any city operating measurement sites for UHI detection is strongly encouraged to adopt these recommendations to its measurement and evaluation systems in order to obtain better coverage of UHI phenomena over the city.
3 Planning a Representative Urban Climate Station Network
The simple classification of measuring sites contains categories for urban, downtown, suburban, and rural sites. For correct and precise heat island evaluation, far more detailed descriptions of urban areas are necessary, as Stewart and Oke’s method (2012) suggests applying. Local Climate Zones were introduced for characterizing the building and vegetation structures of a compact urban region.
Stewart and Oke formally defined Local Climate Zones (LCZs) as regions of uniform surface cover, structure, material, and human activity that span hundreds of meters to several kilometers in the horizontal scale. The LCZ system comprises 17 zone types at the local scale (100–1000 m). Each type is unique in its combination of surface structure, cover, and human activity. Classification can be made on the basis of built-up area (10 classes) and types of land cover (7 classes). Classification of sites into appropriate LCZs requires basic metadata and surface characterization. The zone definitions provide a standard framework for reporting and comparing field sites and their climate observations.
LCZs are a widely used classification system (Unger et al. 2011). It provides useful information for
-
defining UHI magnitude,
-
establishing comparable values originating from different sites,
-
modeling climate and analyzing temperature,
-
detecting features that influence microclimates.
-
Determination of LCZs means defining urban areas characterized by the same structure, a similar built-up ratio, and relatively similar building heights (Balázs et al. 2009). Bordering is essential for finding ideal and representative sites for urban climate observation(Unger et al. 2011). Typically, a “three-step process” is suggested by Stewart and Oke (2012) “to users when classifying field sites into LCZs” (p. 1889):
-
“Step 1: Collect site metadata. Users must collect appropriate site metadata to quantify the surface properties of the source area (as defined in Step 2) for a temperature sensor. This is best done by a visit to the field sites in person to survey and assess the local horizon, building geometry, land cover, surface wetness, surface relief, traffic flow, and population density […]. If a field visit is not possible, secondary sources of site metadata include aerial photographs, land cover/land use maps, satellite images (e.g., Google Earth©), and published tables of property values (e.g., Davenport terrain roughness lengths)” (Stewart and Oke, 2012, pp. 1889–1890).
-
“Step 2: Define the thermal source area. The thermal source area for a temperature measurement is the total surface area «seen» by the sensor […].” (Stewart and Oke, 2012, p. 1890) “Sources will include upwind buildings, the walls and floor of an upwind street, and perhaps a branching network of more distant street canyons” (p. 1890).
“Quantifying the surface properties for field sites and source areas located on or near the border of two (or more) zones is problematic. If the location of the sensor can be moved, it should be placed where it samples from a single LCZ. […]. If the location of the sensor cannot be moved, temperature data retrieved from that site should be stratified first according to wind direction, then to LCZ. […] A site with a split classification is less ideal for heat island studies because changes in airflow and stability conditions interfere confuse the relation between surface form/cover and air temperature. It is recommended that transitional areas be avoided when siting meteorological instruments” (Stewart and Oke, 2012, p. 1891).
-
“Step 3: Select the local climate zone. Metadata collected in Step 1 should lead users to the best, not necessarily exact, match of their field sites with LCZ classes. Metadata are unlikely to match perfectly with the surface property values of one LCZ class. If the measured or estimated values align poorly with those in the LCZ datasheets, the process of selecting a best-fit class becomes one of interpolation rather than straight matching. Users should first look to the surface cover fractions of the site to guide this process. If a suitable match still cannot be found, users should acknowledge this fact and highlight the main difference(s) between their site and its nearest equivalent LCZ” (Stewart and Oke, 2012, p. 1891).
Stewart and Oke (2012) note that “updating LCZ designations is crucial for all sites, particularly those used in long-term temperature studies” (p. 1893). They add that “sites located on the edges of cities where urban growth and environmental change are rapid, or in the cores of cities where land redevelopment and large-scale greening projects are taking place, should be surveyed and classified annually. For sites used in mobile or short-term stationary surveys, the frequency of updates is dictated largely by day-to-day variations in weather and soil moisture […]” (p. 1893).
4 Exposure of Instruments
There are numerous possibilities for setting up urban climate stations, such as screen level, on a roof, in a street canyon, which vary depending on the LCZs where they are situated.
A primary survey of study area can document the presence of obstacles close to the measurement site. The main discrepancies are caused by unnatural surfaces and shading:
-
(a)
Obstacles around the screen influence the irradiative balance of the screen. A screen close to a vertical obstacle may be shaded from the solar radiation, “protected” against the night radiative cooling of the air by receiving the warmer infrared radiation from this obstacle, or otherwise influenced by reflected radiation.
-
(b)
Neighboring artificial surfaces may heat the air. Reflective surfaces (e. g., buildings, concrete surfaces, car parks) and water sources (e. g., ponds, lakes, irrigated areas) should be avoided.
Each climate parameter being measured at a site carries its own considerations. The following requirements represent a good urban observation station, acceptable for air temperature and humidity measurements (Fig. 2.2):


Suitable location of air temperature and humidity sensors in urban environments (Based on WMO Guide, 2008)
-
(a)
measurement point situated at least 10 m from artificial heat sources and reflective sources (buildings, concrete surfaces, car parks, etc.) or expanses of water (unless indicative of the region) occupying
-
(i)
less than 50 % of the surface within a circular area of 10 m around the screen,
-
(ii)
less than 30 % of the surface within a circular area of 3 m around the screen.
-
(i)
-
(b)
station away from all projected shade when the sun is higher than 20°.
-
(c)
station within ground covered with natural and low vegetation (<25 cm) representative of the region.
Within these guidelines, the recorded temperature and humidity data contain additional uncertainty of up to 2 °C compared to a station placed on flat, horizontal land surrounded by open space.
The choice of a site for representative precipitation measurement in an urban area should fulfill the following minimum requirements (Fig. 2.3):
-
(a)
The land is surrounded by an urban area, on a slope of less than 30°.
-
(b)
Possible obstacles must be situated at a distance greater than one half the height of the obstacle. An obstacle represents an object with an angular width of 10° or more.
By following these guidelines, uncertainty of precipitation measurements remains within a 25 % deviation from standard observations taken in a flat and open area.
-
(c)
Where numerous obstacles (buildings, trees, etc.) are present, it is recommended that sensors be placed above the average height of the obstacles to minimize the influence of adjacent obstacles. A measuring mast can serve as a reliable location (Fig. 2.4).
-
(d)
The mast should be placed away from obstacles, at a distance of at least 2.5 times the height of surrounding obstacles;
-
(e)
No obstacle with an angular width greater than 60° and a height greater than 10 m should be within 40 m of the mast. Single obstacles lower than 6 m can only be ignored for measurements taken at 10 m or above.


Representative precipitation measurement in an urban area (Based on WMO Guide, 2008)


Reliable location for measuring mast (Based on WMO Guide, 2008)
In the case of measurements of global, diffuse, and direct radiation, the general rule is that close obstacles should be avoided. An obstacle is considered to be reflecting if its albedo is greater than 0.5. The reference position for elevation angles is the sensitive element of the instrument. It is recommended that shade be allowed to project into the sensor during no more than 30 % of daylight hours for any day of the year (Fig. 2.5).


Recommendation for representative solar radiation observation (Based on WMO Guide, 2008)
If the site does not meet all the requirements above, the specific environment or application should be recorded in a metadata file. The general template of a station metadata file is presented in Sect. 2.6.
4.1 Temperature
In different LCZs, the following suggestions should be considered in finding suitable locations for air temperature measurement:
-
The sensor should be relatively far from warm surfaces, walls, roads, or vehicles with hot engines, and it might receive reflected heat from glassed surfaces.
-
In very densely built-up LCZs (such as LCZ 1, LCZ 2, LCZ 4, and LCZ 5) sensors should be set up 5–10 m from buildings of height 20–30 m, as shown in Fig. 2.6.
-
Sometimes in slightly greater source areas, sensor damage can be prevented by placing the sensor away from the path of vehicles, thereby avoiding exhaust heat and dust contamination. Measurement heights of 3 m or 5 m are accepted as a standard.
-
There is no simple, general scheme for extrapolating air temperature horizontally inside the Urban Canopy Layer (UCL).
The following recommendations are made for choosing the most reliable height for a thermometer:
-
The recommended screen height is between 1.25 m and 2 m above ground level for urban sites (similar to non-urban stations), but it is better to allow a greater height in densely built-up areas (such as LCZ 1, LCZ 2, LCZ 4, and LCZ 5).
-
In the Urban Canopy Layer there is little variation in temperature with height, while there is a discontinuity near roof level both horizontally and vertically. Consequently, if a meaningful spatial average is sought, sensors should be well above mean roof level. The recommended height is >1.5zH (where zH is mean height of the roughness elements), so that the mixing of roof and canyon air is accomplished (see Fig. 2.7).
-
For an urban environment, there is currently no standard method for extrapolating air temperature data down towards screen level (2 m in height).


Thermal and humidity measures on the horizontal scale in a densely built-up area


The height scale of thermal measurements in a densely built-up area
Other facts to consider during the placement of a thermometer in urban environments:
-
Careful attention to radiation shielding and ventilation is highly recommended.
-
Use of the same sensor assemblies (with/without shields and ventilation) inside a network is strongly advised in order to avoid inter-site differences.
Surface temperature is not commonly measured at urban stations; its measurement is only possible using infrared remote sensing or a downward-facing pyrgeometer, or by employing one or more radiation thermometers for which the combined field of view covers a representative sample of the urban district.
4.2 Humidity
The instruments normally used for measuring humidity can be used in urban areas. The siting and exposure of air temperature sensors presented in the previous chapter apply equally to humidity sensors in the Urban Canopy Layer and above the Roughness Sublayer (see Figs. 2.6 and 2.7). For humidity measurement, the same sensor is used as in temperature sampling. Because urban environments are far dirtier than rural sites (in terms of dust, oils, and pollutants), thermometers and hygrometers require increased maintenance and frequent service. Yearly changing and calibration are strongly advised. The provision of shielding from extraneous sources of solar and long-wave radiation is also recommended.
4.3 Wind Speed and Direction
Wind speed and direction are very sensitive to flow distortion by obstacles including
-
effects of local relief due to hills, valleys, and cliffs,
-
sharp changes in roughness or in the effective surface elevation (zd: zero-plane displacement length),
-
perturbation of flow around clumps of trees and buildings,
-
obstacles in the form of individual trees and buildings (Fig. 2.8),
Fig. 2.8 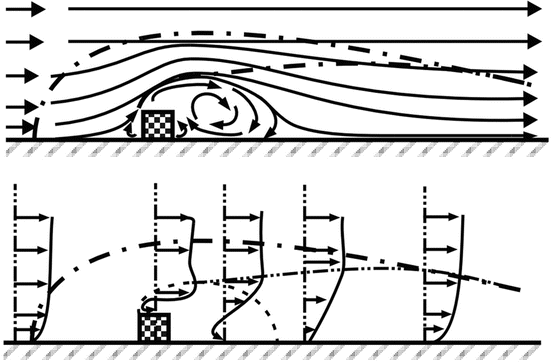
Typical two-dimensional airflow and a vertical wind structure around a building (Figures after Halitsky 1963)
-
disturbances induced by the physical bulk of the tower or mounting arm to which the instrument is attached.


In choosing the height for wind measurement, some basic principles should be considered.
-
The standard height for rural wind observations is 10 m above ground, at a horizontal distance from obstructions of at least 10 times the height of the obstacle. Following this guideline is difficult in typical urban districts; where a patch of at least 100 m radius would be required around 10 m-high buildings and trees.
-
In a densely built-up area where the effects of individual roughness elements persist, the top of roughness sublayer is about 1.5zH, meaning that the recommended anemometer height is at least 15 m if the closest buildings are 10 m high.
Problems of turbulence and vortex flow, resulting from inappropriately placing anemometers behind a building, can be avoided by mounting the sensors, as shown in Fig. 2.8. The recommended height for airflow detection in urban environments is summarized below, with distinctions among different LCZs:
-
In urban districts with low element height and density (such as LCZ 6, LCZ 7, LCZ 8, and LCZ 9), it may be possible to use a site where the “open country” standard exposure guidelines can be met. To use the 10 m height, the closest obstacles should be at least 10 times their height from the anemometer and no more than about 6 m high on average.
-
In more densely built-up districts (such as LCZ 1 and LCZ 2) with relatively uniform element height and density (buildings and trees), wind speed and direction measurements should be taken with the anemometer mounted on a mast of open construction at a minimum height of 1.5 times the mean height of the elements.
-
In urban districts (such as LCZ 4 and LCZ 5) with scattered tall buildings, the recommendations are as in previous point, but with special attention toward avoiding the wake zone of the tall structures.
According to Harman I.N., 2003, setting up an urban climate station in a street canyon requires consideration of different airflows, depending on canyon sizes. Horizontal air currents above the roof level create eddies, caused by flow blockage from buildings. If the street canyon is wide enough, the current system within the street canyon consists of two parts: one part that has closed circulation, and another part which is blown through. The ratio of these two, easily discernible parts depends on the buildings and the width of the street.
If the width of the street is at least three times the height of the buildings (Fig. 2.9a), then the eddying air currents have no effect whatsoever on the neighboring building, and the street canyon has free airflow.


Typical air flow in a street canyon (a) H/W ratio is 1/3 (b) H/W ratio around 1/2 (c) a narrow street
If the width of the street is gradually decreased within the model, then the closed eddy will dominate the entire width of the street, resulting in the characteristic feature that the direction of the prevailing wind blowing at street level is the opposite of the direction of the currents at roof level (Fig. 2.9b).
If the width of the street is narrowed further, so that the ratio of the height of the buildings and the width of the street exceeds 2/3 (Fig. 2.9c), then the entire street canyon will be characterized by a closed eddy that prevents airing through, causing hot air to become trapped and allowing air pollutants produced by motor vehicles to accumulate.
4.4 Precipitation
In urban areas, instruments and methods for the measurement of precipitation are the same as an open site. The measurement of precipitation (such as rain or snow) is very susceptible to changes in airflow in the vicinity of the measurement.
In urban environments, measurement errors are associated with the following main causes:
-
the interception of precipitation during its trajectory to the ground by nearby collecting surfaces, such as tress and buildings,
-
hard surfaces near the gauge which may cause splash-in into the gauge, and over-hanging objects which may drip precipitation into the gauge,
-
the spatial complexity of the wind field around obstacles in the LCZ, causing significant localized concentration or absence of rain- or snow-bearing airflow,
-
the gustiness of the wind in combination with the physical presence of the gauge itself, causing anomalous turbulence around it and leading to under- or over-catch.
In open country, standard exposure requires that obstacles should be no closer than two times their height. In some ways, this guideline is less restrictive than for temperature, humidity, or wind measurements. However, in the UCL the turbulent activity created by flow around sharp-edged buildings is more severe than that around natural obstacles, and it may persist for greater distances in their wake. Again, the highly variable wind speed and direction encountered on the roof of a building make rooftops sites to be avoided.
With regard to precipitation gauges in urban areas, the following guidelines are recommended:
-
Gauges should be located in open sites within the city, where the standard exposure criteria can be met (for example, playing fields, open parkland with a low density of trees, urban airports).
-
Gauges should be located in conjunction with wind instruments if a representative exposure for them is found.
-
Gauges should not be located on the roofs of buildings unless they are exposed at a sufficient height to avoid the wind envelope of the building.
-
The measurement of snowfall depth should be taken at an open site or, if made at developed sites, a large spatial sample should be obtained to account for the inevitable drifting around obstacles. Such sampling should include streets oriented in different directions.
-
Dew, ice, and fog precipitation also occurs in cities and can be of significance to the water budget, especially for certain surfaces. These forms of precipitation may also be relevant to applications such as plant diseases, insect activity, road safety, and finding supplementary sources for water resources.
4.5 Solar Radiation
Solar radiation data are very useful inputs for several climate variables, such as atmospheric stability; daytime cloud activity; turbulence statistics; the fluxes of momentum, heat, and water vapor; determination of mixing height; and pollutant dispersion and models. The data can also be used to represent daylight levels in buildings and pedestrian comfort. Adding solar radiation measurements to an automatic station is very simple, relatively inexpensive, and highly recommended.
Solar radiation measurement sites are often located in rural or remote locations specifically to avoid the aerosol and gaseous pollutants of cities that “contaminate” their records. For stations located in built-up areas, only incoming solar (global) radiation is likely to be measured; neither incoming long wave nor any fluxes with outgoing components are monitored. All short- and long-wave fluxes are affected by the spatial properties of the atmosphere and the surface of cities, and the same is true for the net all-wave radiation balance that effectively drives the urban energy balance.
The placement of solar radiation sensors on the top of high building is a widely used and preferable practice that avoids horizon obstructions.
The principal exposure requirement for monitoring direct solar radiation is freedom from obstructions to the solar beam at all times and seasons of the year. Furthermore, the site should be chosen so that the incidence of fog, smoke, and airborne pollution is as typical as possible for the surrounding area.
On the one hand, incoming solar radiation is a fundamental forcing variable of urban climate, so its measurement has a high priority in the establishment of an urban automatic station, where its assessment is quite simple and relatively inexpensive. The instruments for measuring incoming radiation fluxes are listed in Table 2.1. The following recommendations should be observed when pyranometers and other incoming flux sensors might be installed:
-
Mount the sensor at some height.
-
Choose a site free of vibration, such as a stable platform or the roof of a tall building (often ideal).
-
Make sure that the site is free from any obstructions (buildings, hills, towers, trees).
-
Avoid excessive reflection from very light-colored walls above the local horizon.
-
In polluted environments, upper domes should be cleaned on a daily basis.
On the other hand, the reflection of solar radiation, the emission and reflection of long-wave radiation from the underlying surface, and the net results of short-, long- and all-wave radiant fluxes are seldom and poorly observed in urban environments. Difficulties in measuring include finding a representative area of urban surface. In cases of standard exposure, the sensor height is 2 m over a short grass surface. Over an urban area, greater height is necessary to be representative for the given LCZ. Consider a radiometer at a height of 20 m (at the top of a 10 m mast mounted on a 10 m- high building) in a densely developed district (such as LCZ 1, LCZ 2, LCZ4, or LCZ 5). The radiometer faces downward toward the surface. In this case, the 90 % source area has a diameter of 120 m at ground level, which might be sufficient to detect surface structures involving roofs, walls, roads, and ground surface that are in the sun or in shade. It is generally recommended that downward-facing radiometers be placed at least height of 2zH, and preferably higher. The radiative properties of the immediate surroundings of the radiation mast should be representative of the urban district of interest.
The backs of inverted sensors are exposed to solar heating, which can be prevented by shielding and insulation. In finding a suitable height for a measuring mast, the maintenance and cleaning of instrument domes should be taken into account to avoid any difficulties.
5 Measurement Programs in Urban Environments
The meteorological elements to be measured, in order of priority, are:
-
Air temperature
-
Surface temperature (natural, artificial)
-
Soil temperature (optionally)
-
Air humidity
-
Wind speed and direction, mean wind profile
-
Precipitation
-
Radiation, incoming fluxes, outgoing and net fluxes, sunshine duration
-
Visibility, meteorological optical range (MOR)
-
Evaporation (optionally)
-
Soil moisture (optionally)
-
Atmospheric pressure (if there is no synoptic station in the vicinity)
-
Cloud cover
-
Present weather.
Operational measurement uncertainty requirements and instrument performance for standard near surface meteorological measurements are summarized in WMO Guidance, 2008. Among the technical parameters, it is highly advisable to study the accuracy requirements for the following parameters before planning a new meteorological site: range, reported resolution, mode of measurement/observation, required measurement uncertainty, sensor time constant, output averaging time, and achievable measurement uncertainty. In the case of meteorological elements, the technical requirements recommended for urban climate meteorological observations are listed in Table 2.2. In any case, a description of measurement techniques, sensors characteristics, sampling procedures, calibration, and maintenance requirements are published in the user’s guide or manual of each sensor to be set up. Figure 2.10 depicts a well-equipped urban meteorological and air quality station.


Example of an urban monitoring station; meteorological sensors: wind (1), temperature (2), global solar radiation (3), precipitation (4), air quality (5 – gas and aerosol samplers)
6 Site Description for METADATA
Station metadata should contain the following aspects of instrument exposure:
-
(a)
height of the instruments above the surface,
-
(b)
type of sheltering and degree of ventilation for temperature and humidity,
-
(c)
degree of interference from other instruments or objects (masts, ventilators),
-
(d)
microscale and toposcale surroundings of the instrument, in particular
-
(i)
the state of the enclosure’s surface, influencing temperature and humidity,
-
(ii)
nearby major obstacles (buildings, fences, trees) and their size,
-
(iii)
the degree of horizon obstruction for radiation observations,
-
(iv)
surrounding terrain roughness and major vegetation, influencing the wind,
-
(v)
all toposcale terrain features, such as small slopes, pavements, or water surfaces,
-
(vi)
Major mesoscale terrain features, such as coasts, mountains, or urbanization.
-
(i)
The survey of each site should be reviewed periodically, as environmental circumstances can change over a period of time. A systematic yearly visual check is recommended: If some aspects of the environment have changed, a new site description document should be included in the metadata file. A complete update of the site should be undertaken at least every five years.
The natural relief of the landscape can be disregarded if it is sufficiently distant (>1 km). A method of judging if the relief is representative of the surrounding area is to consider whether a move of the station by 500 m changes the LCZ obtained. If the answer is no, the relief is a natural characteristic of the area and is not taken into account.
One general requirement that cannot be kept at many urban sites is the distance from obstacles, namely that the site should be located well away from trees, buildings, walls, or other obstructions. Instead, it is recommended that the urban station be centered in an open space where the surrounding aspect ratio (zH/W) is approximately representative of the locality (see the aspect ratio of an LCZ from the datasheets of the given area).
The full and accurate documentation of station metadata is essential for the evaluation of measurements. Using Google Earth or ESRI ArcView to map the locations of meteorological stations is one of the most frequently used options. Metadata could include maps, sketches, aerial photos, compass surveys, or screens with a fisheye lens for describing the geographical features of a station, if they are available. An example of a documentary file for one of the UHI monitoring stations in Warsaw (at the city centre – Twarda) is given in Table 2.3. An example of visualization files of the surroundings of the Twarda observation site is presented in Fig. 2.11.


Example of visualization documentary materials for the surroundings of an urban station located at Twarda Street in downtown Warsaw
7 Data Transmission and Data Management
Communication, an essential component of any network, consists of the data flow from the sensor to initial analysis, data management, data display, and usage, jointly termed the “cyberinfrastructure” (Hart and Martinez 2006). This infrastructure consists of computer systems, instrumentation, data acquisition, data storage systems and repositories, visualization systems, management services, and technicians, all linked by software and communication networks (Estrin et al. 2003; Brunt et al. 2007). The communication urban climatological monitoring network consists of four main segments: data collection, data management, data display. and data usage.
The majority of weather installations work on a “star” network, relaying information back to the central host server over the Internet via a wired Ethernet connection.
Urban areas are particularly well placed to utilize wireless technology, as there is an increasing number of municipal wireless access points in urban areas, allowing almost complete coverage in most towns and cities. Hence, with the appropriate permissions granted, these existing municipal wireless networks (open access or subscription wireless access points) can be utilized to relay data from sensors to the host server.
Recently developments in the miniaturization of electronics have produced advances in communications and computing power, with environmental sensors becoming more innovative, reliable, compact, and inexpensive as a result. These advances provide increased potential for urban networks of meteorological sensors, which may now be more numerous and densely spaced, with vastly improved temporal collection and rapid data transmission (Muller et al. 2013). The new generation of atmospheric observation networks will permit new insights into urban atmospheric processes.
The options available for powering sensor networks depend on the location of the sensors, the specific power requirements, and the nature of equipment involved. All short- and long-wave fluxes are affected by the special properties of the atmosphere and the surfaces of cities, and the same is true for the net all-wave radiation balance that effectively drives the urban energy balance (Oke 1988). All of the instruments of radiation measurements, their calibration, the data correction, and most of the field methods are the same for urban environments as for open country sites.
The calibration of equipment and instruments during intercomparison periods is essential to ensure the quality of the data. Sensor networks frequently contain low-cost, nonstandard sensors, and as such all equipment needs to be tested against a traceable “standard” instrument. Ideally, equipment should be calibrated at a national standards and calibration lab, ensuring the reliability of results and allowing for comparisons with other equipment calibrated to the same standard. Documented quality assurance and quality control (QA/QC) procedures must be used in order to provide end-users with high-quality data. Consideration also needs to be given as to where the data are initially stored and processed (including procedures for ensuring that servers are secure and backed-up), archived long-term, and accessed by end-users.
Communication via informal methods such as websites is important for providing information to a variety of stakeholders. Many urban sensor networks have websites through which data can be visualized and downloaded on request.
Calibration processes in a laboratory imply that, under the same circumstances, parallel measurements result between sensors and reference tools. Sensor calibration should help meet the requirements described above in discussing the data quality issues facing institutions that are considering operating an automated surface weather station network. Calibration and maintenance processes should be declared in quality assurance documents for the network.
Data from urban observations should be recorded a well-defined file format, where the header of file contains the station name, observing period, observing element, and units and frequency of observations. The end-data users (researchers, general public, schools) are able to use these records for their own purposes.
8 The Central-European Urban Heat Island Atlas
The Central-European Urban Heat Island Atlas (UHI Atlas) is a tool for a presentation and exploration of different factors influencing urban heat island phenomena in the Central European area. It can be used to limit the temperature increase in cities by establishing proper short-term and long-term mitigation, risk prevention and management activities (Komac and Ciglič 2014; Ciglič and Komac 2015).
Different influencing factors are presented, such as the altitude, vegetation, land use/cover, and settlement density.
The general goal of this chapter is to present the structure and characteristics of the atlas.
8.1 UHI Atlas and its database
The database for atlas of urban heat island consists of different data:
-
Digital elevation model (DEM),
-
Normalized difference vegetation index (NDVI),
-
Land surface temperature data (LST),
-
Data on land use (Corine Land Cover and Urban Atlas data),
-
Night scene image,
-
Air temperature at 2 m,
-
The data collected from project partners.
The database was elaborated in GIS environment using ArcGIS Desktop and published online using ArcGIS Server programme.
The atlas (Figs. 2.12 and 2.13) is published on-line at: http://gismo.zrc-sazu.si/flexviewers/UHIAtlas or http://zalozba.zrc-sazu.si/p/1352.


Print screen of UHI atlas


Print screen of UHI atlas. Its user friendly interface enables users to select between different layers, and to make profiles across April (as below) and August temperatures in Central Europe
8.2 High Resolution (<0.5 km) Raster Data and Vector Data
8.2.1 Corine Land Cover
-
Format: Available in raster data (100 m) and vector data
-
Temporal coverage: 2006
-
Spatial coverage in UHI atlas: Central Europe
-
Short description of Corine Land Cover
CORINE (Coordination of information on the environment) provides land use data layers. Two kinds of satellite imagery were used for the CORINE project:
-
French SPOT-4 & 5 (60 km swath width, 20 m pixels; VIS, NIR and SWIR bands), and
-
Indian IRS P6 (141 km swath width, 23 m pixels; VIS, NIR and SWIR bands).
-
Where to find the data layers: http://www.eea.europa.eu
8.2.2 Land Cover/Land Use for Cities Included in Project (Urban Atlas)
-
Format: vector data (1 : 10.000)
-
Temporal coverage: 2005–2007
-
Spatial coverage in UHI atlas: Budapest, Vienna, Ljubljana, Prague, Stuttgart, Venice, Warszawa
-
Short description of Urban Atlas
The European Urban Atlas provides reliable, inter-comparable, high-resolution land use maps for 305 Large Urban Zones and their surroundings (more than 100.000 inhabitants as defined by the Urban Audit) for the reference year 2006.
-
Where to find the data layers: http://www.eea.europa.eu
-
Format: raster data (120 m, resampled to 60 m)
-
Temporal coverage: different examples for spring, summer and autumn seasons
-
Spatial coverage: Budapest, Vienna, Ljubljana, Prague, Stuttgart, Venice, Warszawa
-
Short description of Landsat images
Landsat images of reflectance can show us differences among different areas (urban areas, green areas etc.). With some methods and field work measurements it is possible to define land surface temperature and air.
-
Where to find it: http://earthexplorer.usgs.gov/or other image browsers
8.2.3 Digital Elevation Data SRTM
-
Format: raster data (3 arc sec)
-
Temporal coverage: 2008
-
Spatial coverage in UHI atlas: Central Europe
-
Short description of Digital elevation data SRTM
The SRTM (Shuttle radar topography mission; Jarvis et al. 2008) digital elevation data, produced by NASA originally, has a resolution of 90 m at the equator and is available for over 80 % of the globe.
-
Where to find the data layers: http://srtm.csi.cgiar.org
9 Raster Data with Low Resolution (≥0.5 km)
9.1 MODIS NDVI Images
-
Format : raster data (1 km)
-
Temporal coverage: different examples for spring, summer and autumn (16-day average)
-
Spatial coverage in UHI atlas: Central Europe
Short Description of MODIS NDVI Images
Some of MODIS (Moderate resolution imaging spectroradiometer) products provide information on vegetation. One of them is NDVI (Normalized difference vegetation index). Vegetation indices are used for global monitoring of vegetation conditions and are used in products displaying land cover and land cover changes.
MODIS NDVI data (product codes MYD13A2 and MOD13A2) are provided every 16 days at 1-km spatial resolution.
-
Where to find the data layers: http://earthexplorer.usgs.gov
9.2 MODIS LST Images
-
Format: raster data (1 km)
-
Temporal coverage: different examples for spring, summer and autumn (8-day average)
-
Spatial coverage in UHI atlas: Central Europe
Short Description of MODIS LST Images
The MODIS global Land Surface Temperature (LST) and Emissivity 8-day data are composed of the daily 1-km LST product (MOD11A1&MYD11A1) as the average values of clear-sky LSTs during an 8-day period.
MOD11A2 & MYD11A2 are comprised of daytime and nighttime LSTs, quality assessment, observation times, view angles, bits of clear sky days and nights, and emissivities estimated from land cover types.
-
Where to find the data layers: http://earthexplorer.usgs.gov
9.3 VIIRS Night Scene Images
-
Format: raster data (750 m)
-
Temporal coverage: 2012
-
Spatial coverage in UHI atlas: Central Europe
Short Description of VIIRS
VIIRS (Visible Infrared Imaging Radiometer Suite), a scanning radiometer, collects visible and infrared imagery and radiometric measurements of the land, atmosphere, cryosphere, and oceans. Its data is used to measure cloud and aerosol properties, ocean color, sea and land surface temperature, ice motion and temperature, fires, and Earth’s albedo.
-
Where to find the data layers: http://earthobservatory.nasa.gov
-
Credit: NASA’s Earth Observatory, NASA
9.4 Air Temperature (2 m Above the Ground)
-
Format: raster data (0.0056°)
-
Temporal coverage: selected periods for various seasons in 2011
-
Spatial coverage in UHI atlas: Central Europe
Short Description of Air Temperature Data
Air temperature was calculated on the basis of MODIS Land Surface Temperature (LST) by dr. Klemen Zakšek and dr. Krištof Oštir from Research Centre of the Slovenian Academy of Sciences and Arts (ZRC SAZU). Calculation method is presented in the paper Estimaton of dailiy mean air temperature from MODIS LST in Alpine areas written by Colombi et al. (2007).
-
Where to find the data layers: UHI atlas (http://zalozba.zrc-sazu.si/p/1352)
10 The Data from the Partners
The data provided by the partners of the UHI project consist of different data layers and present several aspects of urban heat island phenomena and urban heat island influencing factors.
The Case of Bologna and Modena
-
Meterological stations in the Bologna and Modena area,
-
Air quality monitoring system in the Bologna and Modena area,
-
Buildings in the municipality of Bologna and Modena,
-
Border of the municipalities Bologna and Modena,
-
Pilot area in Modena
The Case of Stuttgart
-
Physiological equivalent temperature (PET) for different areas in Stuttgart,
The Case of Warszaw
-
Border of the municipality of Warsaw,
-
IGSO measurement points,
-
UHI index,
-
Universal Thermal Climate Index for Warsaw and various health resorts,
-
Global solar radiation on the ground level (Mazovian Lowland),
-
Reflected solar radiaton (Mazovian Lowland),
-
Air temperature (Mazovian Lowland),
-
Wind velocity (Mazovian Lowland),
-
Subjective Temperature Index (STI) (Mazovian Lowland).
The Case of Prague
-
Various climate data for precipitation and temperature.
The Case of Budapest
-
Various climate data for precipitation, temperature, and global radiation.
For each UHI Project partner there is a location marked on the map and important links provided.
11 Summary
In accordance the aims of the authors, this Manual for UHI assessment helps in selecting measurement locations as well as in identifying sampling infrastructures to be developed in the single urban areas. First of all, it is very important to determine the purpose of the station clearly: (i) to monitor the greatest impact of the city; (ii) to collect data for a more representative or typical district; (iii) to characterize a particular site, where climate problems are perceived to be or where future development is planned. In choosing a location and site for urban stations, there are three scales of interest in urban area studies: macro, local, and micro on horizontal scales. Horizontal and vertical representativeness of the stations should be also specified. After that, the next essential step in selecting an urban station site is to evaluate the physical nature of the urban surroundings and urban terrain (structure, cover, fabric, metabolism).
It is also very important to measure not only UHI components and indicators, i.e. urban and rural temperatures. For a better understanding of UHI phenomena, the measurements of solar radiation, air humidity, wind speed, and precipitation can be very useful. A wide range of technical parameters (such as time resolution, accuracy, range, uncertainty, and calibration requirements) of these meteorological measurements must be also mentioned in the development of UHI observation techniques and evaluation processes.
For a given urban zone, the complexity of the urban environment sets special requirements for siting observation equipment to provide representative values that are little affected by nearby buildings or pollution sources. The interpretation of atmospheric conditions between measuring sites requires detailed information about surface characteristics and the use of urban scale numerical models. For a proper selection of appropriate sites for UHI monitoring we can use also geographic information system. UHI atlas is one example for presentation ofurban heat island phenomena and influencing factors.
References
Balázs, B., Unger, J., Gál, T., Sümeghy, Z., Geiger, J., & Szegedi, S. (2009). Simulation of the mean urban heat island using 2D surface parameters: Empirical modelling, verification and extension. Meteorological Applications, 16(3), 275–287.
Brunt J., Benson, B., Vande Castle, J., Henshaw, D., & Porter, J. (2007). LTER network cyberinfrastructure strategic plan, Version 4. Retrieved October 28, 2011. Available at http://intranet2.lternet.edu/sites/intranet2.lternet.edu/files/documents/LTER_History/Planning_Documents/LTER_CI_Strategic_Plan_.pdf
Ciglič, R., & Komac, B. (2015). Central-European urban heat island atlas. Ljubljana: ZRC SAZU. http://gismo.zrc-sazu.si/flexviewers/UHIAtlas/.
Colombi, A., Pepe, M., & Rampini, A. (2007). Estimation of daily mean air temperature from MODIS LST in Alpine areas. Rotterdam: New Developments and Challenges in Remote Sensing.
Estrin, D., Michener, W., & Bonito, G. (2003). Environmental cyberinfrastructure needs for distributed sensor networks: A report from a National Science Foundation sponsored workshop. La Jolla: Scripps.
Halitsky, J. (1963). Gas diffusion near buildings. Transactions – American Society of Heating, Refrigerating and Air-Conditioning Engineers, 69, 464–485.
Harman, I. N. (2003). The energy balance of urban areas. PhD thesis. University of Reading.
Hart, J. K., & Martinez, K. (2006). Environmental sensor networks: A revolution in the earth system science? Earth-Science Reviews, 78, 177–191.
Jarvis, A., Reuter, H. I., Nelson, A., Guevara, E. (2008). Hole-filled seamless SRTM data V4. International Centre for Tropical Agriculture (CIAT). Available from http://srtm.csi.cgiar.org.
Komac, B., & Ciglič, R. (2014). Urban heat island atlas: A web tool for the determination and mitigation of urban heat island effects. Geographia Polonica, 87, 595–595. Warszawa.
Muller, C. L., Chapman, L., Grimmond, C. S. B., Young, D. T., & Cai, X. (2013). Sensors and the city: A review of urban meteorological networks. International Journal of Climatology, 33(7), 1585–1600.
Oke, T. R. (1988). Street design and urban canopy layer climate. Energy and Buildings, 11, 103–113.
Stewart, I. D., & Oke, T. (2009). A new classification system for urban climate sites. Bulletin of the American Meteorological Society, 90, 922–923.
Stewart, I. D., & Oke, T. (2012). “Local Climate Zones” for urban temperature studies. Bulletin of the American Meteorological Society, 93, 1879–1900.
Unger, J., Savić, S., & Gál, T., (2011). Modelling of the annual mean urban heat island pattern for planning of representative urban climate station network, Advances in Meteorology, Paper 398613. 9 p.
WMO. (2008). Guide to meteorological instruments and methods of observation, 7th edn. WMO-No. 8.
Author information
Authors and Affiliations
Corresponding author
Editor information
Editors and Affiliations
Rights and permissions
This chapter is distributed under the terms of the Creative Commons Attribution 4.0 International License (http://creativecommons.org/licenses/by/4.0/), which permits use, duplication, adaptation, distribution and reproduction in any medium or format, as long as you give appropriate credit to the original author(s) and the source, a link is provided to the Creative Commons license and any changes made are indicated.
The images or other third party material in this chapter are included in the work's Creative Commons license, unless indicated otherwise in the credit line; if such material is not included in the work's Creative Commons license and the respective action is not permitted by statutory regulation, users will need to obtain permission from the license holder to duplicate, adapt or reproduce the material.
Copyright information
© 2016 The Author(s)
About this chapter
Cite this chapter
Baranka, G., Bozó, L., Ciglič, R., Komac, B. (2016). Urban Heat Island Gold Standard and Urban Heat Island Atlas. In: Musco, F. (eds) Counteracting Urban Heat Island Effects in a Global Climate Change Scenario. Springer, Cham. https://doi.org/10.1007/978-3-319-10425-6_2
Download citation
DOI: https://doi.org/10.1007/978-3-319-10425-6_2
Publisher Name: Springer, Cham
Print ISBN: 978-3-319-10424-9
Online ISBN: 978-3-319-10425-6
eBook Packages: Earth and Environmental ScienceEarth and Environmental Science (R0)