
Abstract
The detailed chemical characterization of gas and particle phase species is essential for interpreting the results of atmospheric simulation chamber experiments. Although the application of online techniques has advanced significantly over the last two decades, offline analytical methods such as GC–MS and LC–MS are still frequently used. In this chapter, the approaches commonly employed for gas and particle sampling prior to subsequent offline analysis are described in detail. Methods involving the use of cartridges, canisters, bags and sorbent tubes for gas sampling are described with the support of examples reported in the literature. Technical descriptions related to the application of different types of filters, inertial classifiers and particle-into-liquid samplers for the collection of particles are also provided.
You have full access to this open access chapter, Download chapter PDF
Although online techniques to characterize gas and particle phase chemical composition from chamber experiments have advanced significantly over the last two decades, offline analytical methods are still frequently used.
One main reason for the continued use of offline chemical analysis for characterizing gas and particle composition is the possibility to use a wide range of techniques and instruments which are not suitable for continuous-flow sample analysis. Chromatography and mass spectrometry methods are frequently used to analyse the particle and gas composition in chamber experiments with unprecedented molecular detail and accuracy. While methods typically require non-continuous samples, fast chromatographic methods are available to perform analysis cycles with a few minutes of time resolution, which is often enough to capture important time trends in chamber experiments. On the other hand, a number of powerful analytical techniques such as NMR (nuclear magnetic resonance) spectroscopy or ESR (electron spin resonance) spectroscopy can only be used with offline samples.
In addition to the greater choice of analytical techniques available for offline analysis, they are often also less expensive compared to online techniques either due to the exclusive use of many online instruments for atmospheric analysis applications or the possibility to share offline techniques with other users.
New analytical methods for particle or gas-phase characterization are often established as offline techniques to assess their suitability and sensitivity in chamber experiments, before online instruments are developed. One example is the methods to quantify the oxidative potential of particles, which were originally developed using offline analysis, but have recently been adapted to create dedicated online instruments (e.g. Wragg et al. 2016; Puthussery et al. 2018).
This chapter contains detailed descriptions of procedures commonly used for gas and particle sampling prior to subsequent offline analysis.
6.1 Gas-Phase Sampling
Gas-phase sampling is routinely performed for offline analysis of volatile organic compounds (VOCs). The choice of air sampling method depends on the volatility and polarity range of the target VOCs (Woolfenden 2010a, b). During sampling, it is very important to know the airflow rate as it enables the exact volume of air collected to be determined. The flow rate must be kept constant in order to obtain reliable measurements. There are different ways of doing this, with the most common methods involving a critical orifice (a restrictor placed in the sampling line that is equivalent to a certain flow rate) or the use of a mass flow controller.
Another issue that has to be considered when an offline sample is collected is the tubing material (Deming et al. 2019). Deming and co-workers have studied different tubing materials, classified as absorbent (such as PFA, FEP Teflon and PTFE among others) or adsorbent (such as electropolished steel, glass or silonite among others). In studies of the absorbent materials, PEEK, PTFE and conductive PTFE demonstrated a higher retention capability (longer delays) than PFA and FEP Teflon probably because both materials have shorter polymer chain lengths and increased chain entanglements compared with PTFE. Therefore, Deming et al. (2019) recommend the use of PFA or FEP Teflon for collecting air samples of VOCs. On the other hand, measurements made using adsorptive, metal-like, tubing materials were strongly affected by humidity, with the longest measured delay times found for aluminium tubing and aluminium tubing treated with hexavalent chromate. Besides humidity, the measured tubing delay also depends on the VOC concentration and researchers are advised to condition the sampling lines in order to reduce memory effects and delays. If adsorbent tubing must be used, it is recommended that the relative humidity is maintained above 20%. The best tubing adsorbent materials are conductive PFA tubing and Silonite. However, even though it was not studied, Deming et al. (2019) recommended the use of conductive FEP Teflon instead of conductive PFA since it can combine good gas and particle transmission at nearly half the price. It should be noted that further studies are needed to improve our knowledge of the role of different tubing materials for different types of functionalized organic compounds, concentration and other parameters (temperature and relative humidity) during air sampling.
6.1.1 Cartridge Sampling
A range of different cartridges containing solid sorbents are used to collect VOCs in simulation chamber experiments and used for subsequent analysis in LC, LC–MS, GC and GC–MS. Cartridge sampling is an active sampling technique and it is important that the airflow rate and sampling duration are known. In order to prevent breakthrough, an estimation of the expected concentration of target compounds is recommended. In some cases, two cartridges or solid sorbents can be connected in series to determine the extent of breakthrough.
DNPH-silica cartridges
DNPH-silica cartridges trap aldehydes and ketones in air by allowing them to react with 2,4-dinitrophenylhydrazine (DNPH) in the cartridge to form stable hydrazone derivatives. The methodology is based on US EPA Methods TO-11A and TO-5 (US EPA 2022) which have been updated in order to analyse samples by LC–MS. The derivatization reaction (Fig. 6.1) takes place during sample collection. The derivatives are later eluted and analysed.

Derivatization of carbonyl compounds by reaction with 2,4-dinitrophenylhydrazine (DNPH) to form stable hydrazones (DNPH-derivatives)
The US EPA recommends using pre-coated silica DNPH cartridges. However, users can coat the cartridges themselves following the instructions detailed in Method TO-11A. Among the advantages of using pre-coated DNPH cartridges is the lower and more consistent background concentration of carbonyls. The main disadvantage of the pre-coated cartridges is the price and the fact that they are discarded after use. C18 cartridges coated with acidic DNPH solution can also be utilized. However, there are very few references using this sampling methodology.
The main manufacturers of DNPH-Silica coated cartridges are Waters and Sigma-Aldrich. Both cartridges are very similar, Fig. 6.2 (Tejada 1986; Winberry et al. 1990; Sirju and Shepson 1995).

© EUPHORE
DNPH silica coated cartridges: a LpDNPH S10L from Sigma-Aldrich; b Sep-Pak DNPH-silica cartridge from Waters; c a photograph of a DNPH cartridge.
Ozone has been shown to interfere with the analysis of carbonyl compounds in air samples that have been drawn through cartridges containing silica coated with 2,4-dinitrophenylhydrazine (Tejada 1986, Arnts 1989). Ozone Scrubber cartridges are designed to remove this ozone interference, while scrubber stainless steel coils filled with KI can be used too. These disposable devices are intended for use in series with the DNPH-Silica cartridges. Each Ozone Scrubber cartridge contains granular potassium iodide. When air containing ozone is drawn through this packed bed, iodide is oxidized to iodine, consuming the ozone. The purity of acetonitrile used for eluting the samples is very important since it can affect the carbonyl background level in the cartridge.
C18 cartridges
C18 is an octadecylsilane-bonded silica sorbent with the surface passivated by non-polar paraffinic groups which make it hydrophobic and relatively inert. Due to these properties, C18 is regularly used as an adsorbent trap for trace organics in environmental samples. C18 cartridges can be used for a wider group of compounds, although tests have to be made before (Fig. 6.3).

© EUPHORE
C18 cartridge,
Sampling procedure for DNPH-silica and C18 cartridges
-
Measurement of the sampling airflow at the beginning and the end of the sampling period. Flow rate should be between 1 and 2 L/min.
-
Connection of the cartridge in the Teflon sampling line with the thinner end in the upper position (most of the cartridges are bidirectional, however, read the instructions from the manufacturer).
-
Connection of the Luer end at the pump using silicone tubing.
-
Usually, 30 min of sampling at 1 L/min is sufficient when working at ppb level. If the expected concentrations are lower, the sampling time could be longer.
-
When using DNPH-silica cartridges, if the ozone concentration is 70 ppb or higher, an ozone scrubber has to be connected to prevent artefacts.
-
When sampling is completed, the cartridge has to be removed, capped, labelled and stored at 4 °C in dark conditions. Samples have to be analysed as soon as possible (storage time is set by the manufacturer).
-
To quantify both carbonyl and VOC compounds, external calibrations must be performed.
Examples of applications in the literature
Small DNPH-coated C18 cartridges have been successfully used for the sampling of carbonyls in air since the 1990s (Druzik et al. 1990; Sirju and Shepson 1995). The recovery of carbonyls by cartridge elution is typically over 95% efficient and analysis has generally been performed using liquid chromatography. This technique has been widely used in the fields of atmospheric chemistry, indoor and outdoor air quality research.
Application of the cartridge sampling technique to a simulation chamber study was demonstrated by Brombacher et al. (2001), who collected air samples during experiments on the OH radical-initiated oxidation of cis-3-acetyl-2,2-dimethylcyclobutylethanal (pinonal) and cis-3-acetyl-2,2-dimethylcyclobutylcarbaldehyde (nor-pinonal). High-performance liquid chromatography combined with ion trap mass spectrometry (online HPLC-MSn) was used to identify carbonyl oxidation products at the picogram level.
6.1.2 Canister Sampling
Canisters can be used to collect gaseous compounds during chamber studies for subsequent offline analysis by GC or GC–MS. This approach is most appropriate for highly volatile, non-polar compounds (Cardin and Noad 2018) and typically involves the use of evacuated stainless steel canisters with electro-polished inner surfaces, called SUMMA canisters. These canisters are widely used for sampling VOCs in ambient air (US EPA Methods TO-14A and TO-15, US EPA 2022) and have been tested on a range of volatile species, including aliphatic and aromatic hydrocarbons, as well as chlorinated compounds (Sin et al. 2001). Canisters offer the following advantages; a sampling pump is not needed, problems associated with collection efficiency and analyte recovery when using sorbents and filters are avoided, repeat injections or dilutions can be made during analysis.
Samples are collected by opening an evacuated stainless steel canister to the air. Prior to analysis, the canisters are pressurized using nitrogen and aliquots of the air sample are withdrawn, cryofocused and analysed. The canister volume can vary from 400 mL to several litres. Most compounds are stable in canister samples for around 30 days and in some cases up to 4 months (Sin et al. 2001). Canisters can be re-used after a cleaning process.
Air samples are collected through a sampling orifice which can either be a simple open/close set-up or pressure regulated to allow for sampling times of a few minutes at a desired flow rate.
Sampling begins immediately, and is completed when the pressure inside the canister is equal to the atmospheric pressure on the outside, or when the sampling orifice is detached from the canister. In some cases, a sampling orifice with regulator is attached to the inlet of the canister, and a length of inert tubing leading from the chamber is connected to the inlet of the orifice. A flow controller can also be connected to the canister. Small samples can be collected by attaching a sampling orifice to the inlet of a MiniCan.
Canisters are recommended for sampling VOCs up to approximately C12 and permanent gases. As explained above, air may be collected as grab samples (instantaneous fill) or time-integrated samples (using a flow controller or a critical orifice assembly). Canisters exposed to high vapour concentrations can require extensive cleaning post-analysis, particularly if the contaminants are polar or have a higher boiling point than toluene. Canister cleaning typically involves a sequence of evacuations and air purges, often at elevated temperatures, followed by an analysis of zero air from the cleaned canister to confirm that all contamination has been removed.
Procedure for canister sampling
-
Choose the canister (6 L canister, 2 L canister or MiniCans) appropriate for the desired application.
-
Holding the canister, slide back the knurled collar, remove the protective end cap and connect the canister tip to the sampling regulator (flow controller, critical orifice assembly…).
-
Insert the canister tip into the sampling regulator and release the knurled collar.
-
Sampling begins immediately, write down the initial time.
-
When sampling is complete, reverse the above steps to disengage the canister from the regulator and separate canister.
-
Put the protective end cap onto the canister and seal it. Label the canister with the information needed to identify the sample.
-
Write down the end time.
-
If the canisters are assured to be cleaned at the outset of sampling, no blank is needed.
-
In the laboratory, the canister is pressurized with nitrogen, and the contents are analysed by gas chromatography/mass spectrometry.
-
To be applicable, it is critical that the canisters are cleaned and tested to assure inertness. Be careful with the canister valves, do not over-tighten them. Label all the samples taken.
-
As a prerequisite, it is useful to have a rough idea about the expected concentrations in order to calculate the sampling time and volume.
-
Depending on the type of canister, a wrench might be needed, together with a flow controller.
Examples of applications in the literature
Spicer et al. (1994) studied the composition and photochemical reactivity of a turbine engine exhaust to establish the environmental impact of the organic compounds emitted from aircraft turbine engines. Authors wanted to identify and quantify the VOCs present in gaseous emissions from jet engines and to study the photochemical reactivity of those compounds. For studying the photochemical reactivity, exhaust fumes were introduced into two 8.5 m3 outdoor Teflon simulation chambers. Among all the compounds sampled and quantified, there were carbonyls (using DNPH derivatization reaction), sorbent tubes filled with XAD-2 and canisters. Specially passivated aluminium cylinders were used for collecting air samples that were analysed by GC and also by GC–MS.
Some decades after, Miracolo et al. (2011) studied the secondary organic aerosol (SOA) formation from photochemicalageing of aircraft exhaust in a smaller Teflon chamber (7 m3). Despite the fact that the objective of the study was SOA formation, gas-phase VOCs were also collected using SUMMA canisters and analysed using GC–MS. In total, 94 volatile organic gases were identified and quantified.
Wang et al. (2012) carried out a study on environmental tobacco smoke generated by adding smoke from different brands of cigarettes to a simulation chamber. The identified and quantified pollutants were both inorganic compounds and organic compounds. The test chamber was an 18.26 m3 stainless steel chamber with temperature and RH maintained at 23 °C and 50%, respectively, to simulate the typical indoor air conditions. Air samples were collected through a sampling port to different samplers or analysers connected in series. Carbonyl compounds were sampled using DNPH-coated cartridges and VOC samples were collected using SUMMA canisters at 4.0–6.0 L/min, using mass flow controllers. Chemical analysis was performed by GC using procedures based on the US EPA Method TO-14 (US EPA 2022).
6.1.3 Bag Sampling
Bag sampling is a convenient and accurate means of collecting gases and vapours when concentrations are expected to be higher than the detection limits of common analytical instruments. Sampling bags are typically made of Tedlar®, FEP Teflon foil or other inert materials (SamplePro FlexFilm, FlexFoil). They are inexpensive, simple to use and available in a range of sizes, from around 0.5 L–100 L in volume. The bags can be reused after several cycles of cleaning with pure air or nitrogen and evacuating using a pump. The main disadvantage of sampling bags is that some of the collected chemical species may not remain stable for more than 1–3 days (Wang and Austin 2006; Kumar and Víden 2007; Ras et al. 2009).
Tedlar® is the most popular material used for sampling bags because it retains the quality of the collected air sample and also provides the best options for storage and transport. Tedlar bags are generally made from polyvinyl fluoride (PVF) film, which has the following beneficial properties:
-
High level of inertness to a wide range of chemicals,
-
Resistant to corrosion,
-
High tensile strength and abrasion-free,
-
Low absorption rate,
-
High resistance to gas permeability and
-
High resistance to increases in temperature.
The sampling bag has a valve fitting, which can be made of polypropylene (PP), polytetrafluoroethylene (PTFE or Teflon) or Stainless Steel (SS). The fittings connect easily to a tube for air sampling and many of them are also fitted with a silicone septum to allow syringe samples to be injected into the bag directly. This is a strong and reliable fitting system as the silicone septum acts as a barrier between the two parts of the bag and can also be easily detached if required.
Procedure for bag sampling
Usually, air sample bags are only used for short periods of time. Some of them can be re-used, while others are designed for single-use only. In the case of re-usable bags, it is very important to ensure the bag is properly cleaned to avoid contamination. Although taking air samples using Tedlar bags is a quite efficient and straightforward procedure, the following points need to be considered:
-
Do not fill the Tedlar bag completely. Only fill to about half of the bag’s total capacity. This helps to ensure that the container maintains an ideal temperature even with a change in ambient air pressure, such as while being transported in an airplane.
-
Although Tedlar bags are highly durable, unforeseen circumstances may result in leakage. The use of two bags to collect the same sample provides adequate back-up.
-
Ensure prompt shipping arrangements as the Tedlar bags can only hold air samples effectively for around 72 h. Try to ship the bag the same day as sample collection to ensure on-time and intact delivery of the sample.
In order to sample with a plastic bag, a pump capable of operating at the recommended flow rate is required. An airflow calibrator is also needed to confirm the flow rate. The user has to choose between a bag with single fittings (a hose/valve for flushing and filling the bag and sealing it off after sampling or a syringe port with a septum for removing the sample for analysis) or dual-fitted bags (with separate hose/valve and syringe port fittings).
When sampling directly from the air, the procedure is:
-
Attach a piece of flexible PTFE tubing to the valve on the bag.
-
Connect the other end of the tubing to the sampling pump.
-
To begin sampling, open the valve on the bag, turn on the pump and note the start time.
-
Gently fill the bag until it is approximately half full and close the valve securely before disconnecting the bag.
-
Store the bag out of direct sunlight and away from heat to prevent the contents from reacting or degrading.
When collecting an air sample using an air-tight syringe, the procedure is:
-
Insert the syringe into the septum of the port on the Tedlar bag and slowly push the plunger in.
-
Fill until the bag is approximately half full.
-
Slowly remove the syringe from the port on the bag.
Examples of applications in the literature
Some literature references for the sampling of air by using plastic bags are Cariou and Guillot (2006), Wang and Austin (2006), Guo et al. (2007), Kumar and Víden (2007), Wang et al. (2012), Chang et al. (2018) among others.
6.1.4 Sorbent Tube Sampling
Sorbent tubes are widely used for sampling gas-phase species in air. The collected species can be extracted from the sorbent by using a solvent or thermal desorption. Extraction into a solvent makes the sample amenable to chemical analysis by either liquid or gas chromatography. In thermal desorption, high-temperature gas streams are used to remove the compounds from the sorbent and inject them, often with cryofocusing, into an instrument, such as GC–MS for analysis. Sorbent tubes are generally good for sampling both polar and non-polar compounds but not suitable for highly volatile species. A range of materials can be used in sorbent tubes and the user should choose the material that is the most appropriate for the compounds of interest.
Some of the key advantages of sorbent tubes are:
-
Small, portable and light weight.
-
The availability of a large selection of sorbents to match the target compounds, which can be polar and non-polar VOCs. If there is no commercial combination that matches the target compounds, it is easy to produce home-made combinations.
-
The commercial availability of thermal desorption systems to release compounds from the sorbent and into the analytical system.
-
The possibility of dealing with water using a combination of hydrophobic sorbents.
-
Sample tubes used in thermal desorption can usually be reused at least 100 times before the sorbent needs to be replaced.
It is important to know the concentration range of target VOCs in the air samples, since the tube dimensions selected must facilitate these two essential functions without introducing their own practical limitations. Caution must be exercised in order to avoid sample breakthrough. Representative samples are obtained when the correct air volume and sorbent size are employed. Therefore, the total volume of sample collected must be known. The amount of VOCs retained on a sorbent is determined to a large extent by the sorbent bed length and sorbent mass. Typically, a sorbent tube has a length of 90 mm and an outer diameter of 6 mm, containing 0.1–1 g of the sorbent.
It is very important when choosing the most appropriate sorbent to consider the following parameters: hydrophobicity, thermostability and loadability. For example, the less water is retained by the sorbent, the less interference is experienced during analysis. When a single sorbent is not sufficient to capture a range of target compounds, a combination of sorbents can be employed.
Sorbent types
The sorbent is placed in a glass or stainless steel tube and VOCs present in the air are collected onto one or more sorbent tubes using a sampling pump. The use of sorbent tubes for sampling VOCs in ambient air followed by thermal desorption GC and GC–MS has been the subject of several reviews (Woolfenden 1997, 2010a, b).
The different kinds of sorbents that are regularly used include:
Tenax
Tenax tubes contain the polymer p-phenylene oxide packed in glass or stainless steel tubes. They are used in the US EPA Methods T-O1 and VOST for the collection of non-polar VOCs, as well as some polar VOCs and some lighter semi-volatile organics. Tenax is not suitable for organic compounds with high volatility, e.g. those with a vapour pressure greater than approximately 250 mbar.
Carbon Molecular Sieves
Carbon molecular sieves (CMS) are commercially available carbon polymers packed in stainless-steel sampling tubes. They contain tiny crystals of graphite that are cross-linked to yield a microporous structure with high surface area. Tubes containing CMS are used in the US EPA Method TO-2 for sampling and analysis of highly volatile non-polar organic compounds.
Mixed Sorbent Tubes
Mixed sorbent tubes contain two or more types of sorbents. The advantages of each sorbent combine to increase the range of compounds that can be sampled. The use of mixed sorbent tubes can also reduce the chance of highly volatile compounds breaking through the sorbent media. Tenax and CMS are a good combination for a mixed sorbent tube as the former material efficiently collects a wide range of organic compounds, while the latter is effective for the species with high volatility.
Chemically Treated Silica Gel
Silica gel can be treated or coated with chemical species to facilitate sampling of specific compounds in air. One of the most widely used examples of this approach is the DNPH-coated silica gel cartridge used with US EPA Method TO-11.
XAD-2 Polymer
Amberlite® XAD-2 polymers are hydrophobic, cross-linked polystyrene copolymer resins used for the collection of semi-volatile polar and non-polar organic compounds. The XAD-2 polymer is usually packed in tubes along with polyurethane foam and used with US EPA Method TO-13 or the semi-VOST method. The compounds collected on the XAD-2 polymer are chemically extracted for analysis.
Charcoal Cartridges
Charcoal cartridges contain two sections for adsorbing compounds from air. The adsorbed compounds are usually extracted into a solvent and analysed by GC or GC–MS. Quantitative sample collection is demonstrated when target chemicals are detected on the first charcoal section but not on the second. Flow rates and sample volumes can be adjusted to minimize the breakthrough of compounds from the first to the second section.
A summary of types, properties and most suitable target compounds for various sorbents for use in Method TO-17 is shown in Table 6.1.
Procedure for sorbent tube sampling
The main factors to consider before sampling onto sorbent tubes are:
-
Selection of the tube and sorbent packing for the sampling application (using Table 6.1).
-
Selection of the sampling volume, considering the breakthrough characteristics of the sorbents.
-
Selection of sampling time taking into account expected concentration and breakthrough.
-
Ensure that the tubes are properly conditioned—bear in mind that newly packed tubes have to be conditioned for at least 2 h at 350 °C passing at least 50 mL/min of pure helium carrier gas through them. After that, the tubes have to be sealed and stored at 4 °C until use.
-
All appropriate equipment is available—selected sorbent tubes, calibrated pump and flow controller, tubing to connect the tubes to the chamber and to the pump.
-
If the expected concentrations are close to the breakthrough of the first sorbent tube, a second tube could be connected to ensure complete collection of the target compounds.
The step-by-step procedure is:
-
1.
Using clean gloves, remove the sorbent tube caps and attach them to the sampling lines.
-
2.
Set the flow rates of the pump using a mass flow monitor and adjust the flow rate to the decided value for sampling.
-
3.
Sample for the selected period. Recheck the sampling flow rates at the end of the monitoring.
-
4.
Make notes of all relevant sampling parameters (sampling time, flow rates, sample code/number/identification).
-
5.
Remove the sampling tubes using clean gloves, recap the tubes with their fittings, wrap the tubes (for example, with uncoated Al foil) and place them in a clean, opaque airtight container or envelope adequately labelled.
-
6.
Store the containers/envelopes adequately labelled in a clean, cool (4 °C) organic solvent-free environment until time for analysis.
Examples of applications in the literature
Miracolo et al. (2011) studied the aircraft exhaust fumes in a chamber using both online instruments and off-line sampling techniques. Tenax sorbent tubes were among the offline techniques used. Something similar was studied by Presto et al. (2011).
Riemer et al. (1994) studied terpene and related compounds in semi-urban air, nevertheless the applied offline techniques are also suitable to be used in chamber experiments.
Composition of SOA together with the gas phase composition has been studied by Nordin et al. (2013). VOC gas phase samples were collected on sorbent tubes filled with Tenax-TA and Carbopack-B.
Tenax has been widely used for determining VOC composition in air monitoring activities. Srivastava and Devotta (2007) used this offline sampling technique to determine the indoor air quality of public places in India; therefore, it is suitable for use in chamber experiments.
As an example of a combination of sorbents, Kuntasal et al. (2005) determined VOCs in different environments using sorbent tubes, among other sampling techniques.
6.2 Particle Sampling
The collection of particles produced during chamber experiments is routinely carried out for offline analysis of their chemical and physical properties. The detailed chemical composition of particles produced from VOC oxidation is often studied to understand SOA formation mechanisms that are used in atmospheric models and simulations. Offline chemical analysis allows the identification and quantification of target species, as well as the determination of more general parameters such as total organic carbon, water-soluble organic carbon and carbon oxidation state. Physical properties of SOA particles, such as the UV–visible absorption, are also determined to further our understanding of the impacts of secondary aerosol formation and chemistry on radiation balance in the troposphere.
Filter sampling, inertial classification, gravitational sedimentation, centrifugation and thermal precipitation are the most important techniques used to collect particles in different environments. For chamber investigations, filter sampling, as well as inertial classification, are the most important techniques. While inertial classifiers are often applied in field studies, their use in chamber experiments is limited due to the high sampling volume needed. The great advantage of inertial classifiers is the size segregation, which is usually not possible with standard filter sampling. In the following sections, filter sampling techniques as well as inertial classification in chamber experiments will be discussed.
6.2.1 Filter-Based Particle Collection
The collection of particles by filter is based on the interaction of five different mechanisms (Raynor et al. 2011).
-
(a)
Interception: particles in an air stream contact the filter surface. Relevant for those particles that are larger than the filter pores.
-
(b)
Impaction: flow direction of an air stream transporting particles changes and the inertia of the particles lead to collision with the surface. Most important for particles larger than 1 µm. Process becomes more important as the density, velocity and diameter of the particle increase.
-
(c)
Diffusion: Collision of particles with the surface due to Brownian motion. Most likely for particles of ≤0.1 µm.
-
(d)
Electrostatic attraction: electrostatic charge causes attraction between particles and filter. Charged filter can attract neutral particles and vice versa.
-
(e)
Sedimentation: Particles fall onto filter due to gravitational forces. Very likely for large particles or slow flow velocities. Only relevant for smaller particles if air is moving downward onto the filter.
Filter material
The size, shape, density and electrostatic charge of particles, as well as the chemical and physical properties, can all affect the filtration mechanism. Available filters are made of different materials, coatings and sizes. The majority of the filters belong to one of the following groups:
-
(a)
Fibrous filter: composed of a deep mesh of fibres with a random orientation, e.g. glass fibre filter (Fig. 6.5)
-
(b)
Membrane filter: complex structure which enhances circuitous travel routes for particles, e.g. mixed cellulose ester (MCE, Fig. 6.5) or polytetrafluoroethylene (PTFE, Fig. 6.5)
-
(c)
Capillary pore filter: circular pores, e.g. polycarbonate or polyethylene terephthalate (PET, Fig. 6.5).
The material affects the pore size and with this the collection efficiency and artefact vulnerability. Therefore, a decision on the type of filter used for chamber experiments should take into account various technical requirements including particle size and the chemical identity of the target compounds.
Particles collected by a fibrous or porous membrane are forced to “travel” through the filter via circuitous routes that increase the interaction of particles with the filter and enhance the collection efficiency dramatically. Capillary pore filters often show a lower collection efficiency than fibrous or porous membrane filters of the same pore size (or pore diameter). Thus, it can be stated that the pore size or pore diameter does not reflect the size of particles collected by this filter. Therefore, special effort should be spent selecting the filter material to collect chamber-generated SOA (Burton et al. 2006).
Furthermore, as shown in Fig. 6.4, the collection efficiency for a polycarbonate filter is lowest between 40 and 60 nm. This is caused by the fact that the impaction mechanism is less efficient for particles smaller than 100 nm. In the range ≤100 nm, diffusion is more important but less efficient for collection efficiency. This is defined as “most penetrating particle size” and describes the smallest particle size collected by a filter. According to previous studies, this size is affected by flow rate, charge, filter material and loading (Lee and Liu 1980; Martin and Moyer 2000).


Electron microscope picture from a glass fibre filter (a, 1 μm equivalent pore diameter), a mixed cellulose ester filter (b, 0.8 μm equivalent pore diameter), a polytetrafluoroethylene (c, 3 μm equivalent pore diameter) and a polycarbonate capillary core filter (d, 1 µm equivalent pore size). Picture taken from Lindsley, NIOSH (2016)
Additionally, filters are available with different types of coatings, binder or additional content to enhance their collection efficiency. Each filter type has their own optimal set-up and flow rate which typically depends on filter type and pore size. While performing filter sampling on a chamber, two aspects need be considered loading effects and pressure drop.
Loading effects and pressure drop
Aside from the filter material and the pore size (or equivalent pore diameter), some additional parameters should be kept in mind while selecting the proper filter material. These include the pressure drop and loading effects. The pressure drop describes the loss of static pressure from the front surface of the filter to the rear side. This needs to be considered not only in terms of the lifetime of the pump but also with regards to the filter thickness, solidity and face velocity. Suitable filters are characterized by a low-pressure drop combined with a high collection efficiency. Special care should be taken if the pressure drop is very small or changes rapidly. This usually indicates an improper seal in the holder and the air stream carrying particles inadvertently passes the filter.
Loading effects need to be considered if a large mass is loaded onto the filter. Particles loaded on a filter tend to form dendrites that can be seen as chains emanating from the filter surface. On one hand, these dendrites increase the collection efficiency as particles can be collected additionally at the end of the chain. On the other hand, dendrites lead to a larger pressure drop and they can break down during collection, filter storage and sample preparation for offline analysis. Consequently, this will lead to a loss of collected material. Therefore, massive filter loadings should be avoided as well as folding of loaded filters.
A large loading on the filter directly affects the pressure drop. If the loading is too large, the flow through the filter changes and the calculation of sampling volume is no longer accurate. This problem can be overcome by using a flow controller unit. Furthermore, it is very helpful for an estimation of the formed particle mass can be given. This should be considered together with the mass needed for offline analysis.
Artefacts
The limitations of filters are mainly caused by positive artefacts due to adsorption of water and organics or negative artefacts due to evaporation of collected material. Filter artefacts lead to inaccuracy while determining chemical composition, loading and physical properties. The artefacts are caused by chemical and physical properties of the particles as well as of the filter material and collection method. Generally, filter artefacts can be split into the following groups, (a) volatilization of collected material, (b) particle bounce, (c) moisture effect and (d) non-aqueous adsorption.
Volatilization of collected material
Volatile or semi-volatile compounds in the particle phase evaporate back into the airflow and pass through the filter. According to Raoult’s and Henry’s law, this mechanism is most likely if the partial pressure of a compound at the particle surface is greater than the particle pressure in the air passing through the filter. Consequently, this leads to a lower-than-expected concentration of target species in the particle phase. The most important factors influencing the volatilization are particle concentration, filter face velocity, pressure drop and the gas–particle equilibrium (e.g. Cheng and Tsai 1997; Zhang and McMurry 1991; Ashbaugh and Eldred 2004).
Particle bounce
When collecting small particles at low flow rates, the adhesive forces capturing the particles greatly exceed their kinetic energy. If the particle size is increasing as well as the air velocity, larger particles “bounce off” the filter surface. Consequently, this process leads to an underestimation of target species on the filter. On the other hand, if the air is going downwards into the filter, particles can “bounce in” the filter surface. This process can therefore result in an overestimation of target species.
Moisture effects
Moisture greatly influences particle collection on filters, in particular the gravimetry. In general, water can adsorb or desorb from a filter before, during and after sampling. The importance of moisture differs greatly from the filter material. For example, when comparing membrane filters made of Teflon and MCE, it was found that Teflon was less affected by moisture whereas the MCE filter showed a massive effect (Tsai et al. 2002). In particular, if the filter was not equilibrated to environmental conditions prior to weighing, the MCE showed non-reproducible results and a very strong moisture adsorption. Therefore, it is strongly recommended to consider carefully, the filter material for collection under high RH as well as a re-equilibration to environmental conditions prior to sample treatment (Tsai et al. 2002).
Non-aqueous vapour adsorption
Besides water, VOCs and in particular OVOCs can be adsorbed to filter surfaces and/or onto collected material. This lowers the gas-phase concentration while increasing the particle-phase concentration. Sulfates, nitrates and semi-volatile compounds are also very prone to this behaviour. Another aspect to be considered is the artefact formation due to the interaction of collected organics with reactive gases such as ozone, SO2, etc. It has been demonstrated that high levels of ozone during sampling can lead to the decomposition of particulate OVOCs. This has been intensively reported for PAHs (Liu et al. 2006; Schauer et al. 2003, see review by Menichini 2009 and citations therein), but only rarely for single compounds (Limbeck et al. 2001; Yao et al. 2002; Kerminen et al. 1999; Warnke et al. 2006).
Intensive studies have been carried out to investigate artefacts caused by evaporation and adsorption on the determination of OC/EC (Turpin et al. 1994; Mader and Pankow 2001; Mader et al. 2003; Kim et al. 2001; Subramanian et al. 2004; Kirchstetter et al. 2001).
In particular, quartz fibre filters are very prone to artefacts due to their active surface. Even though, they need to be used for OC/EC analysis as they can be heated prior to analysis up to 800 °C. Studies investigating artefact effects on OC determination revealed an error of −80% up to +50% (Turpin et al. 2000).
Artefacts can be identified either by a complex sampling set-up or by using a backup filter which is placed behind the target filter (Mader et al. 2003; Warnke et al. 2006). Applying the back-up filter method, it was shown that pinonic acid, an important α-pinene oxidation product, caused a massive artefact due to adsorption. Therefore, great care needs to be taken when quantifying semi-volatile organics.
Denuders
Artefacts due to non-aqueous vapour adsorption can largely be avoided by placing a denuder in front of the filter. So-called denuder-filter devices are widely used.
Various types of denuders are used to remove OVOCs as well as inorganic and basic gases. An activated charcoal denuder can be used if OVOCs need to be removed (Eatough et al. 2001). In addition, an annular denuder (e.g. Temime et al. 2007; Healy et al. 2008; Kahnt et al. 2011), coiled denuder (Pui et al. 1990), honeycomb denuder (Koutrakis et al. 1993) and porous-metal denuder (Huang et al. 2001; Tsai et al. 2001) have also been successfully applied. In general, these denuders fulfil two important tasks; (i) avoid artefacts due to adsorption of organics and inorganics, (ii) provide information about gas-phase chemical composition.
In the simplest approach, the denuder contains charcoal to adsorb all gas-phase compounds that could affect filter sampling. If information about the gas-phase chemical composition is needed, the denuder can be coated with an appropriate type of resin (e.g. XAD-4, XAD-2), extracted and subsequently analysed. The coating will directly influence the type of organics trapped on the denuder and can enhance the adsorption potential of the denuder. Many of the resins are effective at trapping non-polar species, but they are much less efficient for removing polar organics. To improve the collection of polar compounds, the denuder can also be coated with an appropriate derivatizing agent. For example, Temime et al. (2007) used a denuder coated with XAD-4 resin and the derivatizing agent O-(2,3,4,5,6-pentafluorobenzyl)hydroxylamine (PFBHA) to enable the on-tube conversion of gas-phase carbonyls to their oxime derivatives which were extracted and identified by GC–MS. This technique not only prevented carbonyls from depositing on a filter but also allowed for their quantification in the gas phase. Using a similar approach, Kahnt et al. (2011) used DNPH on XAD-4 coated denuders to successfully trap a range of gas-phase carbonyl compounds, including methylglyoxal, glyoxal, benzaldehyde, formaldehyde and acetone. As shown in Table 6.2, the use of the derivatizing agent proved to be very effective in reducing the amount of carbonyls detected on the filter.
It should be remembered that the use of a denuder disturbs the gas-particle equilibrium and enhances the re-evaporation of collected species (Zhang and McMurry 1991), in particular for semi-volatile species. Therefore, impregnated filters can also be used to enhance the capture of semi-volatile species, such as carbon-impregnated glass fibre filter (Eatough et al. 2001), XAD-impregnated quartz fibre filter (Swartz et al. 2003), nylon filter (Tsai and Perng 1998) and citric acid-coated filter (Tsai et al. 2000).
General procedure for filter sampling
The following equipment and materials are required:
-
Air pump with a flow controller to set the desired rate. Pumps and flow controllers have to be calibrated before use.
-
Correct filter material with the corresponding pore size.
-
Gloves to handle the samples, opaque envelopes and suitable labels.
A schematic of a general set-up for filter sampling is shown in Fig. 6.6. A denuder can also be placed in front of the filter if desired. The general procedure is as follows:

Schematic of a filter collection system
-
Place the filter in the filter holder.
-
Connect the sampling line to the chamber just before sample collection begins. The filter should not be connected for hours without sampling.
-
Start sampling and use the flow controller to control the sampling rate.
-
The chosen sampling time should take into account the expected concentration of species, safe sampling volumes and potential for breakthrough.
-
Stop sampling while closing the flow controller.
-
Take the filter out of the holder, place it in a suitable petri dish and store at a minimum of −20 °C until analysis. If the sample contains semi-volatile components, filters can be wrapped in aluminium foil, placed in sealed plastic bag and stored in a freezer until analysis.
6.2.2 Inertial Classifiers
The term “inertial classifier” includes impactors, virtual impactors and cyclones (see review by Marple and Olson (2011) and citations therein). The collection and the size classification follow the inertia of the particle. The sample flow is transported through the classifier and while turning the flow direction, particles of sufficient inertia are captured. Particles of less inertia remain in the gas flow and are transported to the next stage or escape the classifier. Various inertial classifiers are available for different kind of purposes and technical requirements. Criteria for selection include the number of stages, flow rate and cut points. Particle collection with classifiers is often limited in chamber experiments due to the high flow rates needed for sampling. Several classifiers apply around 70–100 L min−1 to ensure sufficient loading on the single stages (high-flow cascade impactor, high-volume virtual impactor, gravimetric impactor). In addition to these high-volume samplers, some classifiers apply a flow between 10 and 30 L min−1 (e.g. Moudi, nano-Moudi, Dekati Mass monitor). Only a few chamber studies report the use of inertial classifiers for chamber use (e.g. Palen et al. 1993; Sax et al. 2005; Jain and Petrucci 2015; Hosny et al. 2016).
Impactors are most common in atmospheric science, in particular conventional and cascade impactors. Conventional impactors collect particles larger than the cut size. Particles smaller than the cut size remain in the airflow and are not impacted at the substrate surface. Ideal impactors are characterized by a sharp collection efficiency curve. If several stages of impactor plates are connected in a row, this is referred to as a cascade impactor, Fig. 6.7.

Schematic of a DLPI+ (Dekati® Low-Pressure Impactor, Dekati Ltd), illustrating the collection principle of a cascade impactor
In the cascade impactor, particle collection can be described using the Stokes number which characterizes the velocity increase of the sample flow throughout successive stages impacting smaller particles down to the lowest plates. Glass plates, membrane filters or foils can be used as substrates.
Virtual impactors are similar to conventional impactors with the exception that the impaction plate is removed by collection probe. Within the collection probe, classification takes place whereby larger particles penetrate more into the probe than smaller ones. Particles larger than the cut size are transported through the probe via the minor flow, whereas particles smaller than the cut size are transported via the major flow (exists at the top of the probe). Both flows can be further transported into other devices.
Cyclones use a cyclonic sample flow which swirls downwards into a conical section and spirals upwards around the cyclone axis to the upper end. Particles are deposited on the surface walls and in the cone. A grit pot is installed downwards to collect particles that settle down.
Similar to filter sampling, particle collection by impaction has limitations that are highly related to artefact formation including particle bounce, evaporation of organics, overloading and interstage losses. Particle bounce, evaporation processes and the effects of overloading are described in the section below. Interstage losses occur when material impacts internal surfaces other than the collection substrate. These loss processes are more pronounced under turbulent conditions.
General procedure for inertial classifier sampling
The following equipment and materials are required:
-
Air pump with a flow controller to set the desired rate. Pumps and flow controllers have to be calibrated before use.
-
Chosen substrate (filter, metal foil or other).
-
Gloves to handle the samples, opaque envelopes and suitable labels.
The cut size of the inertial classifier should be selected carefully. If too little mass is collected for the different size ranges, no further analysis is possible. The general procedure is as follows:
-
Place the substrate(s) on the plate(s).
-
If applicable, turn on the conditioning system.
-
Connect the sampling line to the chamber just before sample collection begins. The filter should not be connected for hours without sampling.
-
Start sampling and use the flow controller to control the sampling rate (for low-volume sampler, large-volume samplers often have no flow controller unit). Large-volume samplers usually contain an internal flow meter or measure at least the pressure drop via a pressure gauge.
-
The chosen sampling time should take into account the expected concentration of species.
-
Stop sampling.
-
Take the substrates from the plates, taking care not to damage them, especially if they need to be weighed.
-
Place the substrates in a suitable petri dish and store at a minimum of −20 °C until analysis. If the sample contains semi-volatile components, filters can be wrapped in aluminium foil, placed in sealed plastic bag and stored in a freezer until analysis.
-
Clean plate(s) and control the nozzles (Fig. 6.8).
Fig. 6.8 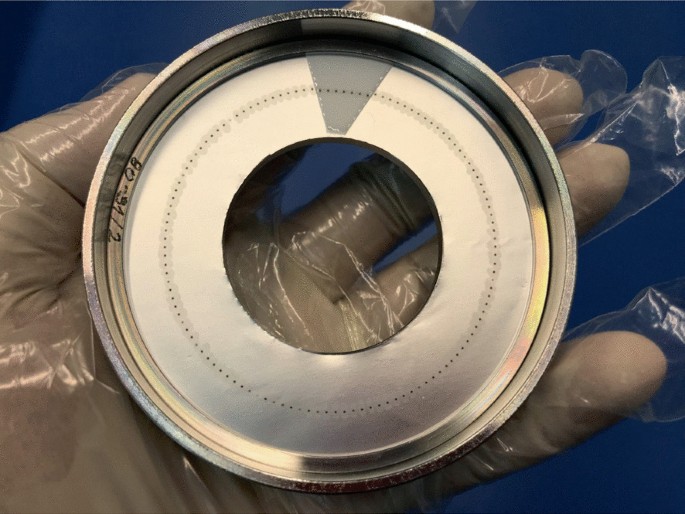
Loaded impaction plate (stage 2) from a 5-stage Berner-type cascade impactor (Picture source ©TROPOS)

6.2.3 Particle-into-Liquid Sampler
A particle-into-liquid sampler (PILS) is an aqueous-solution-based online technique for determining the bulk chemical composition of aerosol particles (Weber et al. 2001). Particles are collected by impaction in the instrument after condensational growth by supersaturated water vapour typically at elevated temperatures of around 100 °C. This collection technique allows the sampling of about 10–20 L/min of air into small liquid flows in the microliter/min range, Fig. 6.9. Instruments using this collection method have been developed that utilize a sample flow of up to 2500 L/min (Demokritou et al. 2002).

Schematic of a Particle-into-Liquid Sampler (PILS) for collection and off-line analysis of atmospheric aerosol particles (Watson 2016)
The effluent of a PILS or similar instrument can in principle be combined with any analysis technique suitable for liquid samples and has been used to collect liquid fractions for further detailed offline analyses such as high-pressure liquid chromatography (HPLC) mass spectrometry, which allows to characterize the detailed particle composition with a time resolution of a few minutes (e.g. Zhang et al. 2016; Bateman et al. 2011). A good example of the use of highly time-resolved PILS in simulation chamber studies is provided by Pereira et al. (2015), who performed state-of-the-art mass spectrometry analysis on samples collected by PILS to follow the formation and evolution of individual compounds in SOA produced by the photooxidation of aromatic compounds. In addition to the high time resolution for particle collection, PILS-type devices allow for automated sampling from atmospheric simulation chambers or to couple the liquid effluent directly to analytical instruments, such as an ion chromatograph (e.g. Sorooshian et al. 2006) for inorganic ions, small carboxylic acids or total water-soluble organic carbon (e.g. Peltier et al. 2007). Overall, the number of studies applying PILS to simulation chamber experiments is rather limited (Sierau et al. 2003; Nakao et al. 2011; Zhang et al. 2016). However, an interesting recent study which combined PILS with the Dithiothreitol (DTT) assay to evaluate the oxidizing potential of particles generated in a simulation chamber shows that this sampling technique still has potential applications (Jiang et al. 2016).
An alternative design for condensational growth of particles is the o-MOCA instrument, where particles are passing through a supersaturated laminar flow wet-walled tube at room temperature to incorporate particles into droplets, where supersaturation conditions are more accurately controlled compared to PILS-type instruments. Droplets are then impacted into a small liquid volume for further offline or semi-continuous online analysis. The advantage of this technique compared to typical PILS designs is the milder droplet growth conditions (room temperature), although sampling flow rates are typically lower than for PILS instruments, e.g. a few L/min which results in higher detection limits (Eiguren-Fernandez et al. 2017).
Other instruments, which utilize condensational growth of particles and impaction, have been developed over the last two decades. Examples are the Particle Collection System (PCS) developed by Simon and Dasgupta (1995) with a 10 L/min sample flow, the Steam Jet Aerosol Collector (SJAC, Slanina et al. 2001) or the condensation growth and impaction system (C-GIS, Sierau et al. 2003) which was coupled to a differential mobility analyser to allow particle size-dependent compositional analyses of the impacted liquid samples, Fig. 6.10.

Schematic of the condensation growth and impaction system (C-GIS) for collection and of-line analysis of atmospheric aerosol particles
Similar instruments, such as the MARGA (Monitor for AeRosols and GAses) use steam jet aerosol collectors to trap particle components and wet rotating denuders to absorb water-soluble gases (Rumsey et al. 2014). The aqueous aerosol and gas extracts are then typically coupled with ion chromatography and analysed for major inorganic ions or low molecular weight organic acids (Chen et al. 2017; Stieger et al. 2019) in a semi-online manner. The advantage of this instrument is the simultaneous collection and characterization of the gas and particle phase to study partitioning and particle growth processes.
There are a number of limitations associated with the use of PILS in atmospheric simulation chamber experiments. Firstly, the rather high flow rates at which PILS collectors are usually operated are potentially an issue for smaller chambers. In addition, most PILS designs operate by mixing hot water vapour into the aerosol sample flow, which might cause some undesired reactions in the droplets or evaporation of semi-volatile particle components. Furthermore, gas/particle partitioning of particle components in an aqueous droplet (i.e. governed by Henry’s Law coefficients) should be considered to assess possible sampling artefacts of these particle collection devices (Zhang et al. 2016). Such potential artefacts need to be characterized to establish if they are relevant for a particular set of target analytes. Finally, it should be kept in mind that PILS is only suitable for water-soluble compounds and that the samples are usually highly diluted which requires highly sensitive analytical techniques or enrichment procedures applied after sampling.
General procedure for particle-into-liquid sampling
The following equipment and materials are required:
-
Air pump with a flow controller to set the desired rate. Pumps and flow controllers have to be calibrated before use.
-
Chosen vials or substrates for sample collection.
-
Gloves to handle the samples, opaque envelopes and suitable labels.
The general procedure is as follows:
-
Place the vials or substrates into the sampler.
-
Connect the set-up to the chamber just before sample collection begins.
-
Start sampling and use the flow controller to control the sampling rate.
-
The chosen sampling time should taking into account the expected concentration of species.
-
Stop sampling.
Take the samples, label them and store at a minimum of −20 °C until analysis.
References
Arnts, R.R.: 2,4-dinitrophenylhydrazine-coated silica gel cartridge method for determination of formaldehyde in air: identification of an ozone interference. Environ. Sci. Technol. 23, 1428–1430, 1423(1411) (1989). https://doi.org/10.1021/es00069a018
Ashbaugh, L., Eldred, R.: Loss of particle nitrate from teflon sampling filters: effects on measured gravimetric mass in California and in the IMPROVE network. J. Air Waste Manag. Assoc. 1995(54), 93–104 (2004). https://doi.org/10.1080/10473289.2004.10470878
Bateman, A.P., Nizkorodov, S.A., Laskin, J., Laskin, A.: Photolytic processing of secondary organic aerosols dissolved in cloud droplets. Phys. Chem. Chem. Phys. 13, 12199–12212 (2011). https://doi.org/10.1039/c1cp20526a
Brombacher, S., Oehme, M., Beukes, J.A.: HPLC combined with multiple mass spectrometry (MSn): an alternative for the structure elucidation of compounds and artefacts found in smog chamber samples. J. Environ. Monit. 3, 311–316 (2001). https://doi.org/10.1039/b101204p
Burton, N.C., Grishpun, S.A., Reponen, T.: Physical collection efficiency of filter materials for bacteria and viruses. Ann. Occup. Hyg. 51, 143–151 (2006). https://doi.org/10.1093/annhyg/mel073
Cardin, D.B., Noad, V.L.: The combination of 3 new sampling techniques paired with GCMS for determination of uptake rates and accurate monitoring of SVOC endocrine disruptors in indoor air, entech instruments (2018). https://www.entechinst.com/download/combination-of-3-newsampling/
Cariou, S., Guillot, J.-M.: Double-layer Tedlar bags: a means to limit humidity evolution of air samples and to dry humid air samples. Anal. Bioanal. Chem. 384, 468–474 (2006). https://doi.org/10.1007/s00216-005-0177-4
Chen, X., Walker, J.T., Geron, C.: Chromatography related performance of the Monitor for AeRosols and GAses in ambient air (MARGA): laboratory and field-based evaluation. Atmos. Meas. Tech. 10, 3893–3908 (2017). https://doi.org/10.5194/amt-10-3893-2017
Cheng, Y.-H., Tsai, C.-J.: Evaporation loss of ammonium nitrate particles during filter sampling. J. Aerosol Sci. 28, 1553–1567 (1997). https://doi.org/10.1016/S0021-8502(97)00033-5
Deming, B.L., Pagonis, D., Liu, X., Day, D.A., Talukdar, R., Krechmer, J.E., de Gouw, J.A., Jimenez, J.L., Ziemann, P.J.: Measurements of delays of gas-phase compounds in a wide variety of tubing materials due to gas–wall interactions. Atmos. Meas. Tech. 12, 3453–3461 (2019). https://doi.org/10.5194/amt-12-3453-2019
Demokritou, P., Gupta, T., Koutrakis, P.: A high volume apparatus for the condensational growth of ultrafine particles for inhalation toxicological studies. Aerosol Sci. Technol. 36, 1061–1072 (2002). https://doi.org/10.1080/02786820290092230
Druzik, C.M., Grosjean, D., Van Neste, A., Parmar, S.S.: Sampling of atmospheric carbonyls with small DNPH-coated C18 cartridges and liquid chromatography analysis with diode array detection. Intern. J. Environ. Anal. Chem. 38, 495–512 (1990). https://doi.org/10.1080/03067319008026952
Eatough, D.J., Eatough, N.L., Obeidi, F., Pang, Y., Modey, W., Long, R.: Continuous determination of PM2.5 mass, including semi-volatile species. Aerosol. Sci. Technol. 34, 1–8 (2001). https://doi.org/10.1080/02786820121229
Eiguren-Fernandez, A., Kreisberg, N., Hering, S.: An online monitor of the oxidative capacity of aerosols (o-MOCA). Atmos. Meas. Tech. 10, 633–644 (2017). https://doi.org/10.5194/amt-10-633-2017
Guo, H., So, K.L., Simpson, I., Barletta, B., Meinardi, S., Blake, D.R.: C1–C8 volatile organic compounds in the atmosphere of Hong Kong: overview of atmospheric processing and source apportionment. Atmos. Environ. 41, 1456–1472 (2007). https://doi.org/10.1016/j.atmosenv.2006.10.011
Healy, R.M., Wenger, J.C., Metzger, A., Duplissy, J., Kalberer, M., Dommen, J.: Gas/particle partitioning of carbonyls in the photooxidation of isoprene and 1,3,5-trimethylbenzene. Atmos. Chem. Phys. 8, 3215–3230 (2008). https://doi.org/10.5194/acp-8-3215-2008
Hosny, N.A., Fitzgerald, C., Vyšniauskas, A., Athanasiadis, A., Berkemeier, T., Uygur, N., Pöschl, U., Shiraiwa, M., Kalberer, M., Pope, F.D., Kuimova, M.K.: Direct imaging of changes in aerosol particle viscosity upon hydration and chemical aging. Chem. Sci. 7, 1357–1367 (2016). https://doi.org/10.1039/c5sc02959g
Huang, C.-H., Tsai, C.-J., Shih, T.-S.: Particle collection efficiency of an inertial impactor with porous metal substrates. J. Aerosol Sci. 32, 1035–1044 (2001). https://doi.org/10.1016/s0021-8502(01)00038-6
Jain, S., Petrucci, G.A.: A new method to measure aerosol particle bounce using a cascade electrical low pressure impactor. Aerosol Sci. Technol. 49, 390–399 (2015). https://doi.org/10.1080/02786826.2015.1036393
Jiang, H., Jang, M., Sabo-Attwood, T., Robinson, S.E.: Oxidative potential of secondary organic aerosols produced from photooxidation of different hydrocarbons using outdoor chamber under ambient sunlight. Atmos. Environ. 131, 382–389 (2016). https://doi.org/10.1016/j.atmosenv.2016.02.016
Kahnt, A., Iinuma, Y., Böge, O., Mutzel, A., Herrmann, H.: Denuder sampling techniques for the determination of gas-phase carbonyl compounds: a comparison and characterisation of in situ and ex situ derivatisation methods. J. Chromatogr. B 879, 1402–1411 (2011). https://doi.org/10.1016/j.jchromb.2011.02.028
Kerminen, V.-M., Teinilä, K., Hillamo, R., Mäkelä, T.: Size-segregated chemistry of particulate dicarboxylic acids in the Arctic atmosphere. Atmos. Environ. 33, 2089–2100 (1999). https://doi.org/10.1016/S1352-2310(98)00350-1
Kim, B., Cassmassi, J., Hogo, H., and Zeldin, M.: Positive organic carbon artifacts on filter medium during PM2.5 sampling in the South Coast air basin. Aerosol. Sci. Technol. 34, 35–41 (2001). https://doi.org/10.1080/02786820118227
Kirchstetter, T.W., Corrigan, C.E., Novakov, T.: Laboratory and field investigation of the adsorption of gaseous organic compounds onto quartz filters. Atmos. Environ. 35, 1663–1671 (2001)
Koutrakis, P., Sioutas, C., Ferguson, S.T., Wolfson, J.M., Mulik, J.D., Burton, R.M.: Development and evaluation of a glass honeycomb denuder/filter pack system to collect atmospheric gases and particles. Environ. Sci. Technol. 27, 2497–2501 (1993). https://doi.org/10.1021/es00048a029
Kumar, A., Víden, I.: Volatile organic compounds: sampling methods and their worldwide profile in ambient air. Environ. Monit. Assess. 131, 301–321 (2007). https://doi.org/10.1007/s10661-006-9477-1
Kuntasal, Ö.O., Karman, D., Wang, D., Tuncel, S.G., Tuncel, G.: Determination of volatile organic compounds in different microenvironments by multibed adsorption and short-path thermal desorption followed by gas chromatographic–mass spectrometric analysis. J. Chromatogr. A 1099, 43–54 (2005). https://doi.org/10.1016/j.chroma.2005.08.093
Lee, K.W., Liu, B.Y.H.: On the minimum efficiency and the most penetrating particle size for fibrous filters. J. Air Pollut. Control Assoc. 30, 377–381 (1980). https://doi.org/10.1080/00022470.1980.10464592
Limbeck, A., Puxbaum, H., Otter, L., Scholes, M.: Semivolatile behavior of dicarboxylic acids and other polar organic species at a rural background site (Nylsvley, RSA). Atmos. Environ. 35, 1853–1862 (2001)
Lindsley, W.G.: Filter pore size and aerosol sample collection. National Institute for Occupational Safety and Health (2016). https://www.cdc.gov/niosh/docs/2014-151/pdfs/chapters/chapter-fp.pdf
Liu, Y., Sklorz, M., Schnelle-Kreis, J., Orasche, J., Ferge, T., Kettrup, A., Zimmermann, R.: Oxidant denuder sampling for analysis of polycyclic aromatic hydrocarbons and their oxygenated derivates in ambient aerosol: evaluation of sampling artefact. Chemosphere 62, 1889–1898 (2006). https://doi.org/10.1016/j.chemosphere.2005.07.049
Mader, B.T., Pankow, J.F.: Gas/solid partitioning of semivolatile organic compounds (SOCs) to air filters. 3. An analysis of gas adsorption artifacts in measurements of atmospheric SOCs and organic carbon (OC) when using teflon membrane filters and quartz fiber filters. Environ. Sci. Technol. 35, 3422–3432 (2001). https://doi.org/10.1021/es0015951
Mader, B., Schauer, J., Seinfeld, J., Flagan, R., Yu, J., Yang, H., Lim, H.-J., Turpin, B., Deminter, J., Heidemann, G., Bae, M., Quinn, P., Bates, T., Eatough, D., Huebert, B., Bertram, T., Howell, S.: Sampling methods used for the collection of particle-phase organic and elemental carbon during ACE-Asia. Atmos. Environ. 37, 1435–1449 (2003). https://doi.org/10.1016/s1352-2310(02)01061-0
Marple, V.A., Olson, B.A.: Sampling and measurement using inertial, gravitational, centrifugal, and thermal techniques. In: Aerosol Measurement: Principles, Techniques, and Applications. Wiley (2011)
Martin, S.B., Moyer, E.S.: Electrostatic respirator filter media: filter efficiency and most penetrating particle size effects. Appl. Occup. Environ. Hyg. 15, 609–617 (2000). https://doi.org/10.1080/10473220050075617
Menichini, E.: On-filter degradation of particle-bound benzo[a]pyrene by ozone during air sampling: a review of the experimental evidence of an artefact. Chemosphere 77, 1275–1284 (2009). https://doi.org/10.1016/j.chemosphere.2009.09.019
Miracolo, M.A., Hennigan, C.J., Ranjan, M., Nguyen, N.T., Gordon, T.D., Lipsky, E.M., Presto, A.A., Donahue, N.M., Robinson, A.L.: Secondary aerosol formation from photochemical aging of aircraft exhaust in a smog chamber. Atmos. Chem. Phys. 11, 4135–4147 (2011). https://doi.org/10.5194/acp-11-4135-2011
Nakao, S., Clark, C., Tang, P., Sato, K., Cocker Iii, D.: Secondary organic aerosol formation from phenolic compounds in the absence of NOx. Atmos. Chem. Phys. 11, 10649–10660 (2011). https://doi.org/10.5194/acp-11-10649-2011
Nordin, E.Z., Eriksson, A.C., Roldin, P., Nilsson, P.T., Carlsson, J.E., Kajos, M.K., Hellén, H., Wittbom, C., Rissler, J., Löndahl, J., Swietlicki, E., Svenningsson, B., Bohgard, M., Kulmala, M., Hallquist, M., Pagels, J.H.: Secondary organic aerosol formation from idling gasoline passenger vehicle emissions investigated in a smog chamber. Atmos. Chem. Phys. 13, 6101–6116 (2013). https://doi.org/10.5194/acp-13-6101-2013
Palen, E.J., Allen, D.T., Pandis, S.N., Paulson, S., Seinfeld, J.H., Flagan, R.C.: Fourier transform infrared analysis of aerosol formed in the photooxidation of 1-octene. Atmos. Environ. a. Gen. Top. 27, 1471–1477 (1993). https://doi.org/10.1016/0960-1686(93)90133-J
Peltier, R.E., Weber, R.J., Sullivan, A.P.: Investigating a liquid-based method for online organic carbon detection in atmospheric particles. Aerosol Sci. Technol. 41, 1117–1127 (2007). https://doi.org/10.1080/02786820701777465
Pereira, K.L., Hamilton, J.F., Rickard, A.R., Bloss, W.J., Alam, M.S., Camredon, M., Ward, M.W., Wyche, K.P., Muñoz, A., Vera, T., Vázquez, M., Borrás, E., Ródenas, M.: Insights into the formation and evolution of individual compounds in the particulate phase during aromatic photo-oxidation. Environ. Sci. Technol. 49, 13168–13178 (2015). https://doi.org/10.1021/acs.est.5b03377
Presto, A.A., Nguyen, N.T., Ranjan, M., Reeder, A.J., Lipsky, E.M., Hennigan, C.J., Miracolo, M.A., Riemer, D.D., Robinson, A.L.: Fine particle and organic vapor emissions from staged tests of an in-use aircraft engine. Atmos. Environ. 45, 3603–3612 (2011). https://doi.org/10.1016/j.atmosenv.2011.03.061
Pui, D.Y.H., Lewis, C.W., Tsai, C.J., Liu, B.Y.H.: A compact coiled denuder for atmospheric sampling. Environ. Sci. Technol. 24, 307–312 (1990). https://doi.org/10.1021/es00073a003
Puthussery, J.V., Zhang, C., Verma, V.: Development and field testing of an online instrument for measuring the real-time oxidative potential of ambient particulate matter based on dithiothreitol assay. Atmos. Meas. Tech. 11, 5767–5780 (2018). https://doi.org/10.5194/amt-11-5767-2018
Ras, M., Borrull, F., Marcé, R.: Sampling and preconcentration techniques for determination of volatile organic compounds in air samples. TrAC, Trends Anal. Chem. 28, 347–361 (2009). https://doi.org/10.1016/j.trac.2008.10.009
Raynor, P.C., Leith, D., Lee, K.W., Mukund, R.: Sampling and analysis using filters. In: Aerosol Measurement: Principles, Techniques, and Applications. Wiley (2011)
Riemer, D.D., Milne, P.J., Farmer, C.T., Zika, R.G.: Determination of terpene and related compounds in semi-urban air by GC-MSD. Chemosphere 28, 837–850 (1994). https://doi.org/10.1016/0045-6535(94)90235-6
Rumsey, I.C., Cowen, K.A., Walker, J.T., Kelly, T.J., Hanft, E.A., Mishoe, K., Rogers, C., Proost, R., Beachley, G.M., Lear, G., Frelink, T., Otjes, R.P.: An assessment of the performance of the monitor for AeRosols and GAses in ambient air (MARGA): a semi-continuous method for soluble compounds. Atmos. Chem. Phys. 14, 5639–5658 (2014). https://doi.org/10.5194/acp-14-5639-2014
Sax, M., Zenobi, R., Baltensperger, U., Kalberer, M.: Time resolved infrared spectroscopic analysis of aerosol formed by photo-oxidation of 1,3,5-Trimethylbenzene and α-Pinene. Aerosol. Sci. Technol. 39, 822–830 (2005). https://doi.org/10.1080/02786820500257859
Schauer, C., Niessner, R., Pöschl, U.: Polycyclic aromatic hydrocarbons in urban air particulate matter: decadal and seasonal trends. Chem. Degradat. Sampling Artif. Environ. Sci. Technol. 37, 2861–2868 (2003). https://doi.org/10.1021/es034059s
Sierau, B., Stratmann, F., Pelzing, M., Neusüss, C., Hofmann, D., Wilck, M.: A condensation-growth and impaction method for rapid off-line chemical-characterization of organic submicrometer atmospheric aerosol particles. J. Aerosol Sci. 34, 225–242 (2003). https://doi.org/10.1016/s0021-8502(02)00159-3
Simon, P.K., Dasgupta, P.K.: Continuous automated measurement of the soluble fraction of atmospheric particulate matter. Anal. Chem. 67, 71–78 (1995). https://doi.org/10.1021/ac00097a012
Sin, D., Wong, Y.-C., Sham, W.-C., Wang, D.: Development of an analytical technique and stability evaluation of 143 C-3-C-12 volatile organic compounds in Summa((R)) canisters by gas chromatography-mass spectrometry. Analyst 126, 310–321 (2001). https://doi.org/10.1039/b008746g
Sirju, A.-P., Shepson, P.B.: Laboratory and field investigation of the DNPH cartridge technique for the measurement of atmospheric carbonyl compounds. Environ. Sci. Technol. 29, 384–392 (1995). https://doi.org/10.1021/es00002a014
Slanina, J., ten Brink, H., Otjes, R., Even, A., Jongejan, P., Khlystov, A., Waijers-Ijpelaan, A., Hu, M., Lu, Y.: The continuous analysis of nitrate and ammonium in aerosols by the steam jet aerosol collector (SJAC): extension and validation of the methodology. Atmos. Environ. 35, 2319–2330 (2001). https://doi.org/10.1016/s1352-2310(00)00556-2
Sorooshian, A., Brechtel, F.J., Ma, Y., Weber, R.J., Corless, A., Flagan, R.C., Seinfeld, J.H.: Modeling and characterization of a particle-into-liquid sampler (PILS). Aerosol. Sci. Technol. 40, 396–409 (2006). https://doi.org/10.1080/02786820600632282
Spicer, C.W., Holdren, M.W., Riggin, R.M., Lyon, T.F.: Chemical composition and photochemical reactivity of exhaust from aircraft turbine engines. Ann. Geophys. 12, 944–955 (1994). https://doi.org/10.1007/s00585-994-0944-0
Srivastava, A., Devotta, S.: Ind0aces in Mumbai, India in terms of volatile organic compounds. Environ. Monit. Assess. 133, 127–138 (2007). https://doi.org/10.1007/s10661-006-9566-1
Stieger, B., Spindler, G., van Pinxteren, D., Grüner, A., Wallasch, M., Herrmann, H.: Development of an online-coupled MARGA upgrade for the 2 h interval quantification of low-molecular-weight organic acids in the gas and particle phases. Atmos. Measure. Tech. 12, 281–298 (2019). https://doi.org/10.5194/amt-12-281-2019
Subramanian, R., Khlystov, A.Y., Cabada, J.C., Robinson, A.L.: Positive and negative artifacts in particulate organic carbon measurements with denuded and undenuded sampler configurations special issue of aerosol science and technology on findings from the fine particulate matter supersites program. Aerosol. Sci. Technol. 38, 27–48 (2004). https://doi.org/10.1080/02786820390229354
Swartz, E., Stockburger, L., Vallero, D.: Polycyclic aromatic hydrocarbons and other semivolatile organic compounds collected in New York City in response to the events of 9/11. Environ. Sci. Technol. 37, 3537–3546 (2003). https://doi.org/10.1021/es030356l
Tejada, S.B.: Evaluation of silica gel cartridges coated in situ with acidified 2, 4-dinitrophenylhydrazine for sampling aldehydes and ketones in air. Int. J. Environ. Anal. Chem. 26, 167–185 (1986). https://doi.org/10.1080/03067318608077112
Temime, B., Healy, R.M., Wenger, J.C.: A denuder-filter sampling technique for the detection of gas and particle phase carbonyl compounds. Environ. Sci. Technol. 41, 6514–6520 (2007). https://doi.org/10.1021/es070802v
Tsai, C.-J., Perng, S.-N.: Artifacts of ionic species for hi-vol PM10 and PM10 dichotomous samplers. Atmos. Environ. 32, 1605–1613 (1998). https://doi.org/10.1016/S1352-2310(97)00387-7
Tsai, C.-J., Perng, S.-B., Chiou, S.-F.: Use of two different acidic aerosol samplers to measure acidic aerosols in Hsinchu, Taiwan. J. Air Waste Manag. Assoc. 50, 2120–2128 (2000). https://doi.org/10.1080/10473289.2000.10464237
Tsai, C.-J., Huang, C.-H., Wang, S.-H., Shih, T.-S.: Design and testing of a personal porous-metal denuder. Aerosol Sci. Technol. 35, 611–616 (2001). https://doi.org/10.1080/02786820117809
Tsai, C.-J., Chang, C.-T., Shih, B.-H., Aggarwal, S.G., Li, S.-N., Chein, H.M., Shih, T.-S.: The effect of environmental conditions and electrical charge on the weighing accuracy of different filter materials. Sci. Total Environ. 293, 201–206 (2002). https://doi.org/10.1016/s0048-9697(02)00015-3
Turpin, B.J., Huntzicker, J.J., Hering, S.V.: Investigation of organic aerosol sampling artifacts in the los angeles basin. Atmos. Environ. 28, 3061–3071 (1994). https://doi.org/10.1016/1352-2310(94)00133-6
Turpin, B., Saxena, P., Andrews, E.: Measuring and simulating particulate organics in the atmosphere: problems and prospects. Atmos. Environ. 34, 2983–3013 (2000). https://doi.org/10.1016/s1352-2310(99)00501-4
US EPA. Compendium of methods for the determination of toxic organic compounds in ambient air (2022). https://www.epa.gov/amtic/compendium-methods-determination-toxic-organic-compounds-ambient-air
Wang, D.K.W., Austin, C.C.: Determination of complex mixtures of volatile organic compounds in ambient air: an overview. Anal. Bioanal. Chem. 386, 1089–1098 (2006). https://doi.org/10.1007/s00216-006-0475-5
Wang, B., Ho, S.S.H., Ho, K.F., Huang, Y., Chan, C.S., Feng, N., Ip, S.H.S.: An environmental chamber study of the characteristics of air pollutants released from environmental tobacco smoke. Aerosol. Air Qual. Res. 12, 1269–1281 (2012). https://doi.org/10.4209/aaqr.2011.11.0221
Warnke, J., Bandur, R., Hoffmann, T.: Capillary-HPLC-ESI-MS/MS method for the determination of acidic products from the oxidation of monoterpenes in atmospheric aerosol samples. Anal. Bioanal. Chem. 385, 34–45 (2006). https://doi.org/10.1007/s00216-006-0340-6
Watson, T.B.: Particle-into-Liquid Sampler (PILS) Instrument Handbook, United States (2016). https://www.osti.gov/servlets/purl/1251405
Weber, R.J., Orsini, D., Daun, Y., Lee, Y.N., Klotz, P.J., Brechtel, F.: A particle-into-liquid collector for rapid measurement of aerosol bulk chemical composition. Aerosol. Sci. Technol. 35, 718–727 (2001). https://doi.org/10.1080/02786820152546761
Winberry, W.T., Forehand, L., Murphy, N.T., Ceroli, A., Phinney, B.: Compendium of methods for the determination of air pollutants in indoor air; Engineering-Science, Inc., Cary, NC (USA)PB-90-200288/XAB United States NTIS, PC A99/MF E06 GRA English, Medium: X; Size, 845 p (1990)
Woolfenden, E.: Monitoring VOCs in air using sorbent tubes followed by thermal desorption-capillary GC analysis: summary of data and practical guidelines. J. Air Waste Manag. Assoc. 47, 20–36 (1997). https://doi.org/10.1080/10473289.1997.10464411
Woolfenden, E.: Sorbent-based sampling methods for volatile and semi-volatile organic compounds in air. Part 1: Sorbent-based air monitoring options. J. Chromatgr. A 1217, 2674–2684 (2010a). https://doi.org/10.1016/j.chroma.2009.12.042
Woolfenden, E.: Sorbent-based sampling methods for volatile and semi-volatile organic compounds in air. Part 2. Sorbent selection and other aspects of optimizing air monitoring methods. J. Chromatgr. A 1217, 2685–2694 (2010b). https://doi.org/10.1016/j.chroma.2010.01.015
Wragg, F.P.H., Fuller, S.J., Freshwater, R., Green, D.C., Kelly, F.J., Kalberer, M.: An automated online instrument to quantify aerosol-bound reactive oxygen species (ROS) for ambient measurement and health-relevant aerosol studies. Atmos. Meas. Tech. 9, 4891–4900 (2016). https://doi.org/10.5194/amt-9-4891-2016
Yao, X., Fang, M., Chan, C.: Size distributions and formation of dicarboxylic acids in atmospheric particles. Atmos. Environ. 36, 2099–2107 (2002). https://doi.org/10.1016/s1352-2310(02)00230-3
Zhang, X., McMurry, P.H.: Theoretical analysis of evaporative losses of adsorbed or absorbed species during atmospheric aerosol sampling. Environ. Sci. Technol. 25, 456–459 (1991). https://doi.org/10.1021/es00015a012
Zhang, X., Dalleska, N.F., Huang, D.D., Bates, K.H., Sorooshian, A., Flagan, R.C., Seinfeld, J.H.: Time-resolved molecular characterization of organic aerosols by PILS + UPLC/ESI-Q-TOFMS. Atmos. Environ. 130, 180–189 (2016). https://doi.org/10.1016/j.atmosenv.2015.08.049
Author information
Authors and Affiliations
Corresponding author
Editor information
Editors and Affiliations
Rights and permissions
Open Access This chapter is licensed under the terms of the Creative Commons Attribution 4.0 International License (http://creativecommons.org/licenses/by/4.0/), which permits use, sharing, adaptation, distribution and reproduction in any medium or format, as long as you give appropriate credit to the original author(s) and the source, provide a link to the Creative Commons license and indicate if changes were made.
The images or other third party material in this chapter are included in the chapter's Creative Commons license, unless indicated otherwise in a credit line to the material. If material is not included in the chapter's Creative Commons license and your intended use is not permitted by statutory regulation or exceeds the permitted use, you will need to obtain permission directly from the copyright holder.
Copyright information
© 2023 The Author(s)
About this chapter

Cite this chapter
Borrás, E. et al. (2023). Sampling for Offline Analysis. In: Doussin, JF., Fuchs, H., Kiendler-Scharr, A., Seakins, P., Wenger, J. (eds) A Practical Guide to Atmospheric Simulation Chambers. Springer, Cham. https://doi.org/10.1007/978-3-031-22277-1_6
Download citation
DOI: https://doi.org/10.1007/978-3-031-22277-1_6
Published:
Publisher Name: Springer, Cham
Print ISBN: 978-3-031-22276-4
Online ISBN: 978-3-031-22277-1
eBook Packages: Chemistry and Materials ScienceChemistry and Material Science (R0)