
Abstract
The development of parameters for a certain additive technology is the key to increase the number of materials that are processed as well as the applications. This chapter shows the details to take into account for the development of parameters for various technologies.
You have full access to this open access chapter, Download chapter PDF
7.1 Development of Materials for Material Extrusion (MEX)
Material Extrusion (MEX) allows to use a wide range of thermoplastics that are commercially available in spools, satisfy nearly all the material requirements for numerous applications and are moderately priced compared to other AM techniques. Until the year 2012, the materials for MEX, especially those for low cost 3D-printers, were mainly limited to acrylonitrile butadiene styrene (ABS) and poly(lactic acid) (PLA), due to their ease of processing both in terms of filament production and MEX. Even nowadays, these two materials are still the top-sellers among the MEX material portfolio and the price of commercial filaments are around 20€/kg in a variety of colours. Recently, the material alternatives have increased considerably, leading to a variety of commercially available thermoplastics. Figure 7.1 summarises the availability of the most important polymer types as filaments for MEX; the information about the commercial availability is based on the materials advertised in numerous websites from different companies. Many polymer types (displayed in orange in Fig. 7.1) have already been commercialised, as both the industry aims to widen the material portfolio for MEX in order to expand the application of this AM technology. Besides PLA and ABS, polyethylene terephthalate (PET) and polycarbonate (PC) can nowadays be already declared as standard MEX materials. However, most of the other materials, even those that are commercially available, cannot always be used trouble-free, thus they require plenty of hands-on experience and as such still need improvements, as has been shown for various investigated filament types.

Pyramid of polymeric materials as a function of the availability of the materials in the MEX market. For the commonly used polymer abbreviations refer to He et al. ([56]—licensed under CC BY)
The increase of scientific studies (displayed in purple in Fig. 7.1) on polystyrene (PS), polyether sulfone (PES), polybutyleneterephthalate (PBT), high-density-polyethylene (HDPE), polyvinyl chlorine (PVC), as well as polycaprolactone (PCL) shows the efforts to widen the material portfolio. The fact that even niche materials, such as silicone elastomers, recycled polymers, plant-based polymers, biopolymers, or highly-filled polymers for the indirect production of metals/ceramics have been under investigation for the use in extrusion-based AM confirms the versatility of MEX and reflects the wide spread use of MEX for many applications. Nevertheless, the usability of such novel materials for MEX as an everyday usable and reliable material such as PLA or ABS will be determined in the future.
By looking at Fig. 7.1, it can be seen that many amorphous polymers are available commercially. This is because amorphous materials have a low coefficient of thermal expansion, which facilitates their processability by MEX, especially in terms of shrinkage, warpage, and distortion. However, many of the amorphous polymers have low toughness, a narrow range of service temperature, and a weak resistance to chemicals. Figure 7.2 also shows a smaller proportion of semi-crystalline thermoplastics available for sale. Especially polymers with a high degree of crystallinity, such as the commodity semi-crystalline plastics, namely low-density-polyethylene (LDPE), linear low-density-polyethylene (LLDPE), ultra-high molecular weight polyethylene (UHWMPE), polyoxymethylene homopolymers (POM-H), polytetrafluoroethylene (PTFE) or certain polyamide (PA) types appear to be particularly challenging to be processed by means of MEX. Even though semi-crystalline thermoplastics possess outstanding and unique properties, their use in MEX has not yet been thoroughly studied.

Toughness/stiffness balance of MEX materials classified as thermoplastic elastomers, amorphous and semi-crystalline polymers, and semi-crystalline composites ([56]—licensed under CC BY)
In order to visualise the great potential of semi-crystalline thermoplastics, Fig. 7.2 shows the toughness/stiffness-balance of different commercially available filament types and selected experimental MEX materials from the open literature. Amorphous thermoplastics are easy to process, but they have a small toughness (elongation at break between 3 and 9%) and lower stiffness (Young’s modulus between 1900 and 2400 MPa). Semi-crystalline thermoplastics, on the other hand, reveal a wider range of toughness and stiffness, with a Young’s modulus between 800 and 4000 MPa and an elongation at break between 2.5% and 1600%. When fillers are added to semi-crystalline Thermoplastics (i.e. semi-crystalline composites in Fig. 7.2, their stiffness is enhanced drastically (e.g. up to 15,000 MPa for PA filled with carbon fibres (CF)), which is much higher than that of amorphous polymers, while their toughness remains in a similar range to that of the amorphous polymers. Hence, semi-crystalline polymers, especially semi-crystalline composites, have a great potential for the use as filaments in MEX. In order to prepare composite materials compounding is needed. How to compound materials is described in the following section.
7.1.1 Compounding of Special Materials for Material Extrusion AM
One way to change the properties of materials is to blend or mix them with other materials, which can be referred as compounding. Compounding has also been applied for thermoplastics used in MEX. One way to compound is to add different thermoplastics together in order to create blends, another way is to add solid fillers to prepare composites. As previously described, thermoplastic composites have better mechanical performance as their unfilled counterparts. A somehow unexpected change in the processability has also been observed particularly in semi-crystalline thermoplastics that tend to warp during MEX processing. It has been shown that the addition of fillers can prevent warpage and increase the geometrical accuracy of specimens printed with semi-crystalline thermoplastics, since the shrinkage after solidification is reduced, and the thermal conductivity as well as the viscosity of the molten material are increased. Therefore, it is important to learn the different ways used to prepare thermoplastic composites.
Thermoplastic composites may be produced mainly by three different methods: in situ polymerization, solution intercalation and melt processing. In situ polymerization consists on dispersing particles of different sizes in liquid monomers or monomer solutions. The resulting mixture is polymerized using standard polymerization methods. One advantage of this process is that there is the potential to graft the polymer onto the particle surface, which greatly increases the mechanical performance of the composite. When using in situ polymerization, particles may still require surface modification, because even though it is easier to disperse in a liquid than in a viscous melt, the settling process is also faster.
Solution intercalation is based on a two-step process, which is generally applied when the fillers are nano scale. First, the particles are initially dispersed in a solvent in which they are swellable, examples of a solvent include water, chloroform or toluene. In the second step, the swollen particles are mixed with a polymer solution. The polymer chains intercalate and displace the solvent within the interlayer of the filler particles. When the solvent is removed, the intercalated structure remains, resulting in a very well dispersed composite.
In situ polymerization and solution intercalation methods involve the use of solvents that are not environmentally friendly, flammable, health hazards and expensive. These two techniques require a solvent that is compatible with both the polymer and the filler particles, something that is not available all the time. Also, these two techniques are not compatible with common polymer processing equipment. As a consequence, melt processing has become the preferred method of producing thermoplastic-based composites. Melt processing utilizes conventional thermoplastic polymer processing techniques such as extrusion and internal mixing. Consequently, it would be easier for the polymer processing industry to adopt and integrate melt production of composites within their production lines.
Since melt processing is the simplest way to obtain thermoplastic-based composites, the following section will deal with the dispersion of filler particle in thermoplastics under melt processing. A good dispersion of filler particles inside the polymer matrix provides composites with better physical properties and better quality in the final 3D printed parts. When filler particles are well dispersed, there is an increase on the surface area that is available to interact with the polymer matrix. Therefore, better filler–polymer affinity improves the dispersion. The dispersion of particles not only depends on the affinity between the matrix and the filler, but also on the processing conditions used during melt compounding.
Compounding can be achieved in a continuous or a batch mode. For industrial production of compounds continuous production is most of the time preferred due to its higher productivity. Continuous compounders include co-rotating twin-screw extruders, Buss co-kneaders and Farrell continuous mixers. Batch compounders include high shear internal mixers, and roll mills.
The co-rotating intermeshing twin screw extruder is a high-speed machine used primarily in compounding applications. The intermeshing and low clearances between the screws creates a self-wiping feature that provides some advantages not available in other types of twin- screw machines, such as a complete elimination of any stagnant zone. They are usually made in a modular design, that is, the screw is made of a variety of elements that slide over a common shaft, and the barrel is assembled from several elements bolted together. This allows the geometry of the machine to be altered depending on the requirements of the specific process, resulting in a large degree of flexibility. Among the main screw elements used in co-rotating twin screw extruders are the conveying elements and the kneading disks. The kneading discs are the dominant elements in determining mixing efficiency. In general, co-rotating twin screw extruders are very efficient machines for dispersing particles in a viscous molten thermoplastic, therefore they are used in high volume productions. A photograph of a co-rotating twin screw extruder is shown in Fig. 7.3.

(Source MUL facilities)
Co-rotating twin screw extruder for continuous compounding
When developing new materials is generally preferred to use small amount of materials to avoid unnecessary waste; therefore for compounding small scales batches, two-rotor counter-rotating non-intermeshing internal mixers, also known as, kneaders are widely used in both academic and industrial research and development laboratories (Fig. 7.4). Kneaders measure and record the torque and the material temperature as functions of time and this allows studying the mixing process. When the material is fully melted the measured torque becomes directly proportional to the viscosity of the melt and for this reason these devices are referred as torque rheometers.

(Source MUL facilities)
Kneader for compounding at small scale
New thermoplastic compounds for material extrusion additive manufacturing (MEX) can be prepared in a kneader, especially when the final formulation is still under development and the particular functionality needs to be tailored. For example, it might be desirable to increase the thermal conductivity or the tensile strength of a thermoplastic material to have applications where heat management and strength may be an issue. Fillers such as metal powders or carbon fibers can be added to thermoplastics to this effect.
The material that is extracted from a kneader is usually in large pieces that are not easy to process by other machines such as extruders in order to make filaments. In order to break the large pieces of the compounds obtained after kneading different size reduction machines can be used. One of these devices is a cutting mill such as the one shown in Fig. 7.5. Size reduction in cutting mills is performed by shearing and cutting. The material is introduced through a hopper into the grinding chamber where it is seized by the rotor and it is comminuted between the rotor blades and the stationary cutting bars inserted in the milling chamber. At the bottom of the milling chamber there is a sieve that determines the size of the particles to be obtained after the milling process. As soon as the particles are small enough to pass through the openings of the bottom sieve, they are discharged and collected in a receptacle.

(Source MUL facilities)
Cutting mill for granulating the compounds prepared in the kneader
7.1.2 Differential Scanning Calorimetry of Polymeric Materials for MEX
When new materials are prepared is important to check their thermal properties, such as their melting and crystallization temperatures. In MEX, the filament is melted, and the unmolten material is used to extrude the melt through the nozzle; once the material is extruded it is deposited on the build platform or the previously deposited layer. Therefore, it is important to known at which temperature the material melts and solidifies in order to set up the printing equipment at the right extrusion temperature and build platform temperature. Please notice that for amorphous or glassy thermoplastics, such as the numerous used in MEX it is incorrect to refer to a melt transition, so the term melt refers to producing a liquid at the required processing temperature. One way to determine the transition temperatures of polymeric materials is to use differential scanning calorimetry.
Differential Scanning Calorimetry (DSC) is a thermo-analytical measuring technique where the difference in heat flow rate between a sample and a reference is monitored as a function of time while the two samples are exposed to the same heating or cooling cycle. In other words, DSC is used to determine the amount of heat absorbed or released by a substance while undergoing a physical or a chemical change. Heat absorption or release occurring at any transition changes the total energy of the material, which is characterized in terms of enthalpy (\(H\)) when the pressure remains constant. The change of enthalpy between two states (\(\delta H\)) can be estimated as:
where \({c}_{p}\) is the heat capacity and \(T\) is the temperature.
Processes that increase enthalpy are called endothermic, some examples include the glass transition, melting and evaporation of polymers; while process that lower enthalpy are called exothermic and some examples include crystallization and decomposition of polymers. Therefore, using DSC, the transition temperatures of polymers for MEX can be measured and later on used to determine the processing temperatures at which to process materials in the AM process. The heat capacity of a polymeric material can also be measured using DSC devices. In order to measure the heat capacity, the heat flow (\(\dot{Q}\)), the heating or cooling rate (\({v}_{T}\)), the sample mass (\(m\)) must be known. Once these parameters are known, the heat capacity \({c}_{p}\) can be estimated using the following equation.
As it can be seen in the previous equation the mass of the specimen (\(m\)) and the heating or cooling rate (\({v}_{T}\)) can influence the measured values and thus comparative DSC measurements should be done using similar masses and at the same heating or cooling rates. In addition, Eq. 7.2 describes that the heat flow is directly proportional to the heat capacity, and therefore the glass transition temperature (\({T}_{g}\)) can be determined by observing the change in the slope of the heat flow against temperature curve.
The \({T}_{g}\) of an amorphous polymer material can be useful to know at which temperature the print bed of MEX machine should be set. It has been found that when the bed temperature is higher than \({T}_{g}\) of the material to be printed the adhesion of than material increases and therefore the specimens can be fabricated without the risk of detachment from the build platform.
By increasing the temperature above \({T}_{g}\) of semi-crystalline materials, such as many polymers used in MEX, it is observed that crystals begin to fall apart and chains come out of their ordered arrangement in what it is called melting. This endothermic transition is represented by a peak in the heat flow curve, where the top of the peak is referred as the melting temperature (\({T}_{m}\)) and calculating the area below such peak, the latent heat (\(\delta {H}_{m}\)) can be estimated. Something similar can be done to estimate the crystallization temperature (\({T}_{c}\)), when the temperature is lowered, and an exothermic transition is observed. These two temperatures are crucial during the process of MEX. The extrusion temperature should always be higher than \({T}_{m}\) and the extrudate should be cooled down below \({T}_{c}\) in order to have geometrical stability of the deposited layers. The extrusion temperature should be set up more than 10 degrees higher than \({T}_{m}\) since the heat transfer from the heating block to the viscous polymer melt is quite low and the residence time is quite short. It is important to mention that the contact temperature at which the extruded material comes in contact with the solidified layer plays an important role in the interlayer cohesion and as such to the mechanical properties of the fabricated specimens.
An example of how to perform DSC measurements is shown here. The equipment shown in Fig. 7.6 is a DSC1 from Mettler-Toledo, Switzerland and this is the device used to measure the thermal properties of materials compounded for MEX.

(Source MUL facilities)
Differential scanning calorimetry device
7.1.3 High Pressure Capillary Rheometry of Polymeric Materials for MEX
A high-pressure capillary rheometer allows the routine analysis of the viscosity of polymer melts and composites at shear rates from 10 to 106 s−1. The realizable shear rate range depends on the viscosity of the material to be tested, the selected temperature, and the used die geometry (e.g., round die or slit die). Capillary rheometers are well suited to measure viscosity values representative of the MEX process since they operate in steady shear flow modes and at shear rates that are relevant for material extrusion processes (102–103 s−1).
The capillary rheometer is composed of a test barrel that is temperature controlled and an exchangeable die at its end. The die can have a variable geometry (e.g. round or slit). When all test parameters are defined and the system reaches the test temperature, the test barrel can be filled with polymer granulate. In order to fill it bubble free, the material should be filled in small portions and manually pressed with a tamper. The measurement is ready to begin when the test barrel is full. Then, the preheat time (or melting time) starts. At the end of the preheat time, the test starts automatically by the movement of the piston with the first preselected feed rate. And the melt inside the test barrel is extruded through the die by means of a piston. The melt pressure is measured by using mounted pressure transducers before the round die or along the slit length of the slit die. As soon as the pressure varies exactly within the tolerance limit, the speed of the piston is recorded. Therefrom, the apparent viscosity data are calculated immediately. At the same time, the piston speed is increased to the next value. In this way, the whole speed program is run step by step.
The two types of dies used for capillary rheometry are presented together with a discussion of important points one should be aware of when measuring viscosities with them.
Round Die
Capillary rheometers with round dies are widely used in polymer melt rheometry. Round dies exist in different lengths with the same diameter (L/D = 10, 20, and 30). The entrance angle of a round die is 180°. To measure the temperature near the die wall, thin thermocouples can be attached to the die. Using the dimensions of the die, the speed of the piston, and the related pressure drop, the so-called apparent viscosity is calculated. In order to obtain the correct viscosity of polymeric materials, two corrections are commonly applied to round dies data: the Bagley correction and the Weissenberg-Rabinowitsch correction. The Bagley correction takes care of viscoelastic effects at the entrance of the die. During the melt flow in the die inlet and outlet pressure losses are developed, and the Bagley correction can be used to correct these pressure losses. Therefore, several measurements with capillaries with the same diameter but with different lengths have to be done to apply this correction.
The plotted measured pressures (\({p}_{\mathrm{meas}}\)) of the die versus L/D ratio in general can be described by a linear function for each individual shear rate. The extrapolation of these straight lines to the L/D ratio = 0 provides the pressure correction value (\({p}_{\mathrm{en}}\)) mentioned in
where \({\tau }_{r}\) is true shear stress, \({p}_{\mathrm{en}}\) is entrance pressure loss, and \(R\) is die radius.
The apparent shear rate for round die \({\dot{\gamma }}_{a,r}\) is calculated by using
with \(\dot{V}\) as the volumetric flow rate.
The Weissenberg-Rabinowitsch correction for the round die considers the fact that the shear rate mentioned in Eq. (7.4) is only valid for Newtonian fluids and provides the true shear rate at the capillary wall for them; therefore, Equation has to be used.
Finally, the true viscosity is calculated from
Slit Die
In the slit die, the pressure gradient, which is used to calculate the viscosity, is measured by using a series of pressure transducers along the length of the slit. The pressure profile along the slit die is measured by melt pressure transducers.
The temperature at the die wall is recorded by using thermocouples, which are fixed very near to the inner wall of the slit. The slit die has the rectangular channel of width (\(B\)) and height (\(H\)). The pressure drop \(\Delta p\) can be determined by taking the difference of two pressures measured along the flow length and the corresponding distance \(\Delta L\) between the pressure transducers. Thus, no Bagley correction is necessary when the pressure drop is measured along the slit. However, a so-called shape factor \({F}_{p}\) in Eq. (7.9) might be employed to account for the influence of the width in the rectangular flow channel. The true shear stress \({\tau }_{s}\) can be calculated from the measured pressures along the slit length and geometrical parameters of slit die, by using
is applicable when the ratio B/H is greater than 40; in other cases, \({\tau }_{s}\) is given by Eq. 7.8:
The apparent shear rate \({\dot{\gamma }}_{\mathrm{app},s}\) given by
The Weissenberg-Rabinowitsch correction adjusts the shear rate at the wall for non-Newtonian liquids, such as molten thermoplastics. The true shear rate at the wall for a slit die (\({\dot{\gamma }}_{s}\)) is calculated using Equation
Finally, the true shear viscosity is calculated using
An example of how to perform a capillary rheometry measurement is shown here. A picture of the Rheograph 2002 high pressure capillary rheometer (Göttfert Werkstoff-Prüfmaschinen GmbH, Buchen, Germany) is shown in Fig. 7.7.

(Source MUL facilities)
High pressure capillary rheometer for measuring viscosity at high shear rates
7.1.4 Rotational Rheometry of Polymeric Materials for MEX
In order to measure the viscosity at lower shear rates or lower frequencies a rotational rheometer is used. Also, when the viscosity is too low for a material that it drips out of the capillary without any force being applied by the piston, then the rotational rheometer is an option to measure the viscosity of those fluids. When the rheometer is used in oscillatory mode the viscoelastic response of materials can be measured and it is described by the values of the storage and loss moduli. These two moduli can give information regarding the structure of the polymer or the filled composites and can be used as a quality control measure for materials to be used in MEX.
Rotational rheometers generally have two rotational-symmetric components mounted on a common axis, with the fluid to be rheologically characterized between them. The shear rate results from the angular velocity at which the components rotate, while the shear stress comes from the torque that is applied to the sample. A rotational rheometer can be of two types, controlled stress or controlled rate. In a controlled stress rheometer, the shear stress is specified, and the velocity gradient is determined proportionally to the viscosity. In a controlled rate rheometer, the shear rate is specified, and the resulting shear stress is determined. The most common geometries used in rotational rheometry are plate-plate, cone-plate, and coaxial. Only the plate-plate rheometry will be discussed here since this is the most versatile geometry since it can be used with unfilled and filled molten thermoplastic polymers, which can be used in the MEX process.
Plate-plate rheometry is characterized by the use of two parallel plates with a radius \(R\) and separated by a distance \(H\). In this configuration, the velocity gradient depends on \(R\) and \(H\). Consequently, the shear rate can be modified by changing the distance \(H\) or the angular velocity \(\omega\). The shear rate in a plate-plate arrangement varies also along the radius of the plates and is maximum \({\dot{\upgamma }}_{\mathrm{R}}\) at the external radius \(R\), thus the maxim shear rate can be calculated with the following equation:
The angular velocity can be calculated from the rotor speed \(N\) measured as the number of revolutions per minute with the following equation:
The shear stress \(\tau\) is obtained from the applied torque \(M,\) the radius of the plate \(R\) and a correction factor \(n\), known as the power law exponent from the Weissenberg correction since polymeric materials are non-Newtonian fluids, as described above:
When the applied shear stress or strain is sinusoidal in nature, the viscoelastic moduli can be measured. This kind of tests is called oscillatory dynamic tests. For rheological measurements done on a controlled rate rheometer, one can impose the deflection angle \(\varphi\) or the strain \(\gamma\) as a sinusoidal function of time \(t\) and angular velocity \(\omega\) given as:
or
where index \(A\) is for the applied amplitude.
The torque \(M\)or the shear stress \(\tau\) can be measured and will also be sinusoidal functions shifted by a phase shift angle \(\delta\), given by the following equations:
or
The opposite will be true for a controlled stress rheometer. The torque or the stress is applied as a sinusoidal function and the angle of deflection or the strain is measured as sinusoidal functions shifted by a phase shift angle.
Once the shear stress, the shear strain and the phase shift angle are known, the elastic or storage modulus \(G^{\prime}\), the viscous or loss modulus \(G^{\prime\prime}\), as well as the complex viscosity \({\eta }^{*}\) can be calculated using the following three equations:
and
Before measurements can be performed in the rotational rheometer, it is recommended to press small disks in order to minimize the amount of air trapped when melting granules directly at the rheometer. Trapped air can considerably affect the measured values in a rotational rheometer. In order to produce dense disks of the material to be investigated a vacuum press is used like the one shown in Fig. 7.8.

(Source MUL facilities)
Vacuum press for sample preparation for rotational rheometry and thermal conductivity
Once the specimens for rotational rheometry are prepared then measurements can begin. A photograph of a rotational rheometer is shown in Fig. 7.9.

(Source MUL facilities)
Rotational rheometer for measuring viscosity at lower shear rates
7.1.5 Thermal Conductivity of Polymeric Materials for MEX
The thermal conductivity of the materials to be processed by MEX affects how fast the material melts and solidifies after deposition. The rate at which the material solidifies affects the quality of specimens printed with an MEX machine. For example, it has been observed that for semi-crystalline polymers it is better that the polymers have a higher thermal conductivity in order to prevent warpage of the printed specimens during the MEX process.
The thermal conductivity of polymers can be measure with several methods; one of these methods is the modified transient plane source (MTPS) method. Because the MTPS method is fast, reliable, and non-destructive. A photo of the device to measure thermal conductivity is shown in Fig. 7.10.

(Source MUL facilities)
Thermal conductivity device that uses the modified transient plane source method
The system is comprised of a sensor, control electronics and computer software. The sensor has a central heater/sensor element in the shape of a spiral surrounded by a guard ring. The guard ring generates heat in addition to the spiral heater, thus, approximating a one-dimensional heat flow from the sensor into the material under test in contact with the sensor. The voltage drop on the spiral heater is measured before and during the transient. The voltage data is then translated into the effusivity value of the tested material. The conductivity is calculated from the voltage data an iterative method.
The sensor used to measure the effusivity has a solid surface optimally engineered for the testing of fluids. When measuring solids, a contact agent is required as there is some contact resistance that may significantly affect the results if not addressed within the measurement protocol. The quality of contact and therefore the heat transfer depends on many parameters such as type of material, surface quality and wettability. The best contact agent available is water, since it has a relatively high thermal conductivity (~0.6 Wm−1 K−1), low viscosity, and is easy to apply and clean. Water can be used in a limited temperature range though, from around 5 °C to around 70 °C. At temperatures lower than 5 °C and higher than 70 °C alternative contact agents are available. Calibrations of solids (except for foams) are all done with water.
In order to obtain better results, it is better to use flat discs that completely cover the sensor of the thermal conductivity device. For that reason, specimens were prepared in the vacuum press following the procedure describe in the rotational rheometry section. Examples of the discs prepared with the copper compounds are shown in Fig. 7.11.

(Source MUL facilities)
Samples for thermal conductivity measurements prepared in the vacuum press
7.1.6 Filament Production for MEX
Extrusion to produce filaments to be used in MEX is an important step in order to ensure good quality in the parts produced by MEX. The filament must have a round cross-section so it can be easily fed to the liquefier in the extrusion head. The measure of how round a filament is known as ovality and for a perfectly round filament its ovality is equal to zero. The filament should also have a very narrow distribution of diameter as close as possible to the target diameter of 1.75 mm. Filaments with good quality are produced when the extrusion rate, the haul-off rate and the winding unit are all stable and adjusted accordingly.
The MEX process based on filaments, deposits material through the liquefier based on the constant displacement of the 1.75 mm diameter filaments. The filament displacement rate and the feeding roller speeds are calculated according on the specified build conditions and assuming the diameter of the filament is constant. It can be inferred that if the filament diameter is less than the assumed diameter of 1.75 mm, the flow rate of the material being extruded is less than the expected rate. Variations of the diameter result in underflow that can result in insufficient contact between adjacent deposited strands, creating a weak point or severe underflow there may not exists any contact between the deposited strands resulting in voids between the strands, which in turn make the parts weaker in term of their mechanical performance. Filaments with too large diameter can lead to overflow and to the accumulation of material around the nozzle or on certain parts of the printed specimen, which eventually lead to geometrical inaccuracies. Increase in the ovality in the other hand, can lead to slippage of the filament between the rollers, which in turn can lead to less than optimum flow and thus similar effects as a varying diameter. For these reasons, it is important to produce filaments with the diameter as close as possible to the specified dimension, usually 1.75 or 2.85 mm and with an ovality as close as possible to zero.
Filaments can be produced in the capillary rheometer like the one shown in Fig. 7.12, but instead of dropping the extrudate into the lower platform, the extrudate is collected and transported on a conveyor belt away from the die. This is shown in Fig. 7.12. This method does not give filaments with high quality, but it is preferred when the amount of material available is little, which is the case during the material development process.

(Source MUL facilities)
Filament production set up for small amounts
The better way to produce filaments in a continuous fashion is to use a single screw extruded fitted with a round die. The extrudate is also collected on a water bath or a conveyor belt that transports it to the haul off unit and finally to the winding unit. This method is preferred when the amount of material is larger then one liter, since a higher amount of material needs to be wasted before the extrusion process is stable. A schematic representation and a photograph of a filament extrusion line is shown in Fig. 7.13.

(Source MUL facilities)
Filament extrusion line for large amounts: a shematic (courtesy of Damir Ciglar), b real line
7.2 Development of Materials for PBF Technologies
7.2.1 Metallic Materials
The use of metal powders in the Additive Manufacturing industry is increasing in different sectors since it became a suitable process to produce complex metal net shape parts, and not only prototypes as before.
On one hand, metallic materials play a very important role in additive manufacturing concerning: (i) making parts from powders, (ii) powder manufacturing, (iii) families of metallic powders for AM, (iv) powder characteristics, and (v) influence of powder characteristics on the powder behaviour.
On the other side, efforts on research and development of advanced materials need to be concentrated in the challenge of reaching full or near full density without compromising microstructure while keeping good dimensional stability and tight tolerances as well as tailoring special properties bymeans of advanced microstructure control (Fig. 7.14).

(Source AIDIMME)
Relationship between density, microstructure and geometry for creating an advanced material
Among the benefits of making parts from powders by using metal additive manufacturing technologies it can be found:
-
Increased design freedom compared to conventional casting and machining.
-
Net shape process with less raw material consumption which is really important in the case of expensive or difficult to machine alloys. This net shape process means reducing the number of assembly operations such as welding or brazing.
-
Short production cycle time to process complex parts layer by layer in a few hours. Then, total cycle time including post processing usually takes a few days or weeks which generally is much shorter than conventional metallurgy processes with production cycles of several months.
However, some limitations need to be considered:
-
Material choice because many alloys are available, but some of them are not suitable for AM such as non weldable metals or difficult-to-weld alloys which can require specific approaches.
-
Material properties since it has been known that some parts made from AM tend to show anisotropy in the build direction (Z axis).
-
Densities of 99.9% can be reached, but some residual internal porosity may remain.
-
Mechanical properties are usually superior to cast parts but in general inferior to wrought parts.
-
AM technology is not only used for prototyping but also for metal part production.
-
Increasing the metal powder production for AM might reduce powder costs too.
7.2.2 Powder Manufacture and Metal Powders for Additive Manufacturing (AM)
There are many ways in which metals might be produced in powder form. One of the key points in powder manufacturing is the different powder shapes (Fig. 7.15) that can be achieved depending on the powder production method.

(Source AIDIMME)
Example of powder shapes
The most important powder production methods are:
-
Mechanical methods by disintegration without phase change: machining and mechanical communition (milling).
-
Physical methods by disintegration with phase change: atomization techniques than can be gas atomization or water atomization.
-
Chemical reduction methods by ore reduction, thermal decomposition, hydrometallurgy.
-
Electrolytic reduction methods by precipitation from aqueous solutions or melt electrolysis.
Metal Powders for Additive Manufacturing are usually produced using the gas atomization processing. In this manufacturing process, a molten metal is broken up into small droplets and quickly solidified before they come into the contact with each other or with a solid surface. The main way is to disintegrate a thin stream of molten metal by subjecting it to the impact of high energy jets of gas or liquid. The main difference relies on the particle shape obtained; powders produced by gas atomization present spherical shape while powders produced by water atomization show irregular shape.
Gas atomization is the usual powder manufacture method for additive manufacturing due to the following characteristics:
-
Powder particles present the same chemical composition since the starting constitutent metals are fully alloyed in the molten state.
-
Spherical shape is positive for powder flowability, powder density and size distribution.
-
A wide range of alloys are currently able to be processed by gas atomization.
There is a specific gas atomization process known as VIM Vacuum Induction Melting gas atomization where the melting process takes place in a vacuum chamber. This is highly recommended for atomizing reactive elements like titanium (Ti), copper (Cu), aluminium (Al) and also superalloys to avoid the drawback of oxygen pick-up. Figure 7.16 shows TiAl powder particles produced by VIM gas atomization.

(Source AIDIMME)
TiAl powder particles produced by VIM
Other particular metallic materials like molybdenum (Mo) and tungsten (W) (refractory metals) are produced by plasma atomization which generally results in more spherical particles with less amount of finest particles. Figure 7.17 exhibits two different metals, pure copper on the left and Ti6Al4V alloy on the right produced by gas and plasma atomization, respectively. It can be seen how the gas atomization technique gives both finest and less spherical particles compared to plasma technique.

(Source AIDIMME)
Copper (on the left) and Ti6Al4V (on the right) powder particles produced by gas and plasma atomization, respectively
The spectrum of powder manufacture methods together with the disrumption of the additive manufacturing technologies has made possible a wide range of alloys in powder form:
-
Steels
-
Commercially pure (CP)-titanium and titanium alloys
-
Aluminium alloys
-
Nickel base superalloys
-
Cobalt base superalloys
-
Pure copper and copper alloys
-
Magnesium alloys
-
Precious metals: gold, silver and platinum
-
Refractory metals: molybdenum and tungsten
-
Metal matrix composites.
The quality of metal powders is extremely important since many other aspects from the AM process will be influeced by the powder quality: (i) build-to-build consistency, and thus, the production of defect-free components, (ii) mechanical properties, (iii) process qualification and, (iv) reproducibility between AM systems.
As it has been mentioned in Sect. 4 Additive Manufacturing Processes Classification, metallic materials are mainly processed by PBF-EB/M or PBF-LB/M technologies. Depending on the material and the technology selected, the main features of metal powders usually are:
-
Metal powders for PBF-EB/M: less expensive and with a Particle Size Distribution (PSD) between 45 and 105 μm.
-
Metal powders for PBF-LB/M: more expensive and with a PSD between 20 and 50 μm.
This particular difference on size will influence mainly in: (i) surface roughness of the final part, and (ii) ability to flow and spread:
-
Metal powders for PBF-EB/M: this wide range and big size of particles results in a final part with rougher surface as well as in a powder with better ability to flow and spred.
-
Metal powders for PBF-L/M: in this case, finer particles give smoother surfaces of the final part but it is detrimental for the flowability which can provoke that the powder does not flow and this can result in lack of fusion and defects on the final part.
The further processing and results achieved in the final AM part are highly influenced by the powder characteristics. Figure 7.18 exhibits the main powder characteristics that should be characterized for the proper understanding of metal powders behaviour.

(Source AIDIMME)
Powder characteristics
Morphology, size distribution, microstructure, chemical composition and physical properties such as density and flowability are the powders characteristics that will define the behaviour of a metal powder and the ability to be processed by AM technologies. The way in which these five properties are correlated to each one is summarized in Table 7.1.
Additionally, each metal powder should be considered as unique and thus, specific aspects need to be analyzed:
-
Health, safety and environmental issues.
-
i.e., in nanomodified powders, the presence of nanoparticles should be to take into account for specific Personal Protective Equipment.
-
i.e., in metallic powders, the Minimum Ignition Energy (MIE) Test should be analyzed in order to determine the minimum energy of an electrical spark that will result in ignition of a dust cloud under specified test conditions. This value is extremely important during handling reactive or fine powders and during processing and post-processes in AM technologies out of protective atmospheres.
-
-
Powder reusability.
-
i.e., definition of conditions for re-using fresh powders after AM cycles.
-
-
Powder storage, handling and aging.
-
i.e., protective gas, control of humedity and temperature is strongly recommended for almost all alloys.
-
Introduction to Powder Characterization for AM
A high-quality AM production is related to the starting material (also known raw material or feedstock). It should be paid attention to the powder and its properties Fig. 7.19.

(Source AIDIMME)
Quality of AM parts is directly dependant on the raw material or feedstock
Additive Manufacturing providers are the responsible to define powder properties requirements for a particular additive manufacturing technology. Generally, the AM provider is the powder provider too but, in some cases, it is possible to process powder provide by a third supplier. So, who is going to process the material has to assure that the powder properties meet the defined powder requirements.
In addition to the metal powder requirements defined by the supplier, it is important to know if there is any specific standard for this material. Recently, a set of Additive Manufacturing Standards have been developed.
Regarding AM powder characterization for powder bed fusion technologies, two main standards for Ti6Al4V are found:
-
F2924-14 standard specification for additive manufacturing titanium-6 aluminum-4 vanadium with powder bed fusion
This specification covers additively manufactured titanium-6aluminum-4vanadium (Ti-6Al-4V) components using full-melt powder bed fusion such as electron beam melting and laser melting. It indicates the classifications of the components, the feedstock used to manufacture Class 1, 2, and 3 components, as well as the microstructure of the components. This specification also identifies the mechanical properties, chemical composition, and minimum tensile properties of the components. (This abstract is a brief summary of the referenced standard. It is informational only and not an official part of the standard; the full text of the standard itself must be referred to for its use and application).
In addition to this material standard, ASTM F3049-14 must be included to control the feedstock.
-
ASTM F3049-14 standard guide for characterizing properties of metal powders used for additive manufacturing processes
This specification determines the properties of the feedstock powder used in these processes is a necessary condition for industry’s confidence in powder selection and ability to produce consistent components with known and predictable properties. The intention of this guide is to provide purchasers, vendors, or producers of metal powder to be used in additive manufacturing processes with a reference for existing standards or variations of existing standards that may be used to characterize properties of metal powders used for additive manufacturing processes. It will serve as a starting point for the future development of a suite of specific standard test methods that will address each individual property or property type that is important to the performance of metal-based additive manufacturing systems and the components produced by them. While the focus of this standard is on metal powder, some of the referenced methods may also be appropriate for non-metal powders.
7.2.3 Tests for AM Powder Characterization
As introduced in section before, there is a strong relationship between powder properties and the powder behaviour. An overview of tests for the AM powder characterization is shown in Fig. 7.20.

(Source AIDIMME)
Overview of tests for AM powder characterization
-
Particle Size Distribution analysis: The aim of this analysis is to ensure that every powder lot is sized for the application, meeting the additive technology requirements. Particle size distribution by laser diffraction method follows standard procedure according to ASTM B822-10.
In Powder Bed Fusion technologies the most common range of particle size is:
-
PBF-LB/M: Particle size distribution between 20 and 63 microns
-
PBF-EB/M: Particle size distribution between 45 and 105 microns. No presence of particles smaller than 10 microns. The presence of particles smaller than 10 micros could be dangerous if the AM peripheral devices does not work under inert gas conditions or controlled atmosphere.
-
An example of PSD report is shown in Fig. 7.21.

(Source AIDIMME)
Example of a PSD report
-
Full chemistry analysis: The aim of this analysis is to ensure that the chemical composition of the powder meets the requirements before and after its additive manufacturing processing. Chemical content of the alloy requirements are included in the reference standard of the material. For instance, ASTM F2924-14 and ASTM F3001-14. Different chemical analysis techniques are employed:
-
Surface analysis:
-
X-Ray photoelectron Spectroscopy.
-
Augen Slectron Spectroscopy.
-
Secondary Ion Mass Spectroscopy.
-
-
AM processed material analysis:
-
Inductively Coupled Plasma.
-
Atomic Absorption Spectrometry.
-
Optical emission (High T combustion).
-
Infra-red.
-
X-ray Fluoresence.
-
X-ray powder diffraction.
-
-
Microanalysis
-
Scanning Electron Microscopy.
-
Energy Dispersive X-ray Spectroscopy.
-
Nanoprobe.
For impurities and inclusions detection:
-
-
Chemical analysis
-
Microscopy techniques.
In case of Ti6Al4V powder, two main kinds of analysis are found:
-
Composition via ICP—established ICP analytical routine: Ti, Al, V, Fe, Cr, Mo, Nb, W, Cu, Ni, Co, Fe, Mn, Sn, Si, P, Ta, B, Y.
-
Other elements—C, N, O, S, H via LECO combustion analysis (Fig. 7.22).
Fig. 7.22 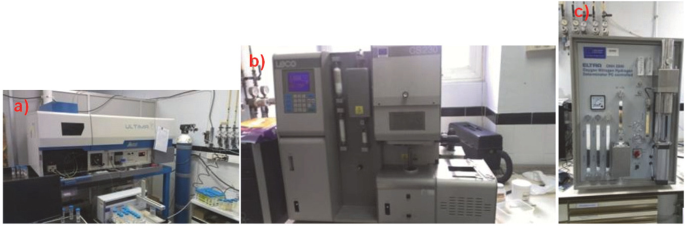
(Source AIDIMME facilities)
Equipment for chemical analysis characterisation at AIDIMME: a Ultima2 (ICP-OES), b Leco CS230 and c ONH-2000(IGF)
-

In order to analyze aluminum, vanadium and iron content, it has been used high performance ICP-OES (inductively coupled plasma optical emission spectrometry). In order to analyze carbon content, it has been used the Leco, due to difficulties in getting Carbon and Sulphur into solution, these elements are not readily measured by ICP Spectroscopy and an alternative technique is combustion analyzer for the measurement in metals, ceramic and other inorganic materials. Oxygen, Hydrogen and Nitrogen content is determined by inert gas fusion (IGF).
Chemical analysis explained before follows the standard procedures according to ASTM E1941 for Carbon, for Hydrogen, ASTM E1409 for Oxygen and Nitrogen, and for other elements.
-
Microstructure analysis: The aim of this analysis is to ensure no internal gas in the powder particles and evaluation of the powder morphology according to ASTM E3-11. Standard guide for preparation of metallographic specimens. Powder requirements are defined by the additive manufacturing provider. For instance, PBF-EB/M powder particles shall be spherical, with minimum are/volume ration and no presence of internal porosity (Fig. 7.23).
Fig. 7.23 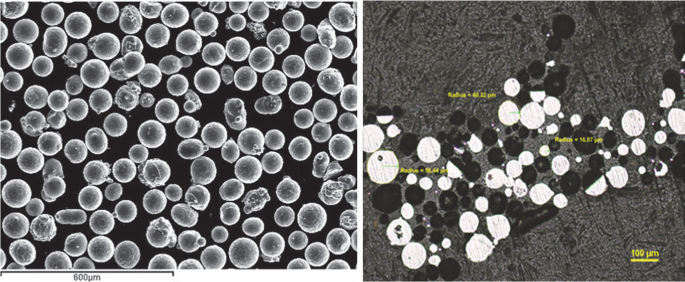
(Source AIDIMME)
Spherical particle shape with presence of satellites (left) and powder internal porosity (right)

-
Flow analysis: This analysis ensures batch consistency and optimal flowability for AM process according to additive manufacturing technology provider. The flowability characteristic of a powder is directly related to both the physical properties of the material itself, as well as the specific processing conditions in the handling system. The flowability is tested using Hall flowmeter (Fig. 7.24), according the ASTM B213.
Fig. 7.24 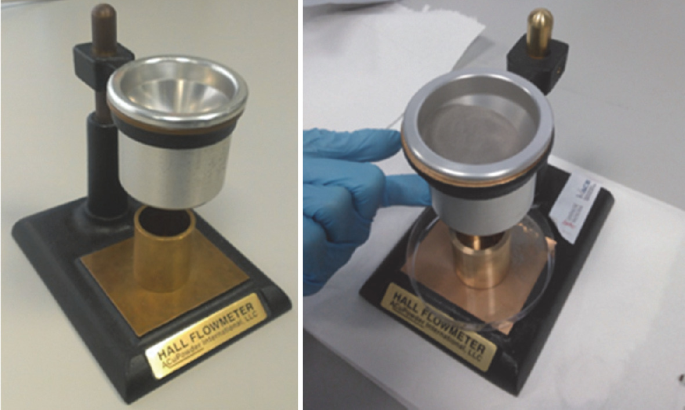
(Source AIDIMME)
Hall flow rate equipment

Usually, a Hall funnel (2.54 mm orifice) is employed. In case the powder does not flow freely through this, a Carney funnel (5.08 mm orifice) is employed. For PBF-EB/M technology the flow rate (Hall-ASTM B213) shall be lower than 30 seconds/50 g. In case of Ti6Al4V alloy for PBF-EB/M, flow rate is around 20-22 seconds/50g.
-
Apparent density analysis: This analysis ensures low porosity powder to obtain an optimal part performance. The apparent density is the ratio of the mass to a given volume of powder. This is determined by means of Hall flowmeter funnel as described in ASTM B212. In case the powder does not flow, standard ASTM B417 with Carney funnel is followed. For PBF-EB/M technology the apparent density must be higher than 50% of solid material density. In case of Ti6Al4V powder for PBF-EB/M, the apparent density is around 2.5 g/cm3.
7.2.4 Processing Parameters Determination for PBF-EB/M
As explained previously, PBF-EB/M machines are partially open-software so that users can modify and adjust the process parameters either for standar materials or for new powders. In some occasions process parameters can be adjusted in order to improve the process perfomance, for instance, the thicker the layer thickness is, the higher the build ratios will be, but simply changes like layer thickness will require a completely new setup of process parameters in order to melt the powder properly. Not only build ratio can be optimized, but also the behaviour of the melted material.
Therefore, it can be distinguished two different workpaths:
-
Process parameter adjustment for standard materials: Improve somehow any of the features of the process when working with standard materials. This will imply from slight variations to very complex process adjustments in order to enhace the machine performance.
-
Process parameter determination for nonstandard powders; this approach requires apparently much more efforts since there is not a first processing parameter setup. In this case different parameters must be tested so that consolidated material is analyzed afterwards in order to define the optimal energy to be deposited. The challenge to be faced within this approach is to find a processing window where material is flawlesly melted.
Standard Parameters Adjusted During Parameter Development:
-
Scanning speed: (mm/seg) defines the velocity of the beam while melting the powder in different stages as contours, hatch or waffer. Increased velocity will lead to a reduction in the energy deposition.
-
Focus offset: defines how focused or defocused the beam is. Depending on the build phase, defocused beams are required or not. Very sharp beams will increase the accuracy of the scanning path but on the other hand will increase the energy density.
-
Line offset: (mm) distance between scanning lines. Every layer is made up of consecutive lines that increase the heat acumulation in the processed part. Low line offset values will lead to lack of fusion whereas very close lines will lead to part overheating.
-
Beam current: (mA) current applied in each phase to heat or melt the powder.
-
Process temperature (C): value measured beneath the build plate. Process temperature needed to partialy sinter the powder deposited each layer.
-
Layer thickness (mm): powder bed height.
In addition, PBF-EB/M technologies use complex functions in order to regulate the energy deposition bearing in mind the part geometry. The aim of these functions is to prevent process issues like heat accumulation and so on.
-
Thickness function: this function explores previous layers and analyze the areas that were melted so as to adjust the power and scanning speed. Energy density is reduced in low conductivity areas (non melted material) in order to prevet overheating. This function is normally triggered when overhanging.
-
Speed function: measures the line path length and adjust both the beam current and the scanning speed in order to homogenize the temperatures no matter the geometry that is being melted.
-
Turning point: Although melting path can be modified, it normaly presents a snake shape where at the end of a line there is a corner where energy can be accumulated. Turning point function aims to reduce the beam speed in this area so as to maintain constant temperatures (Fig. 7.25).
Fig. 7.25 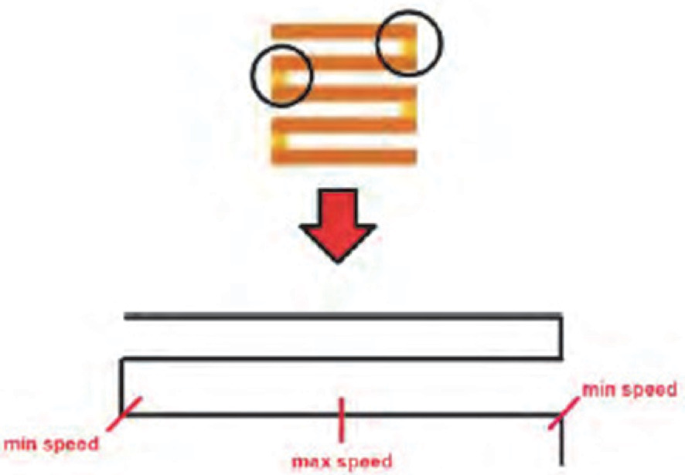
(Source AIDIMME)
Turning point scheme

Processing Window
Process parameter development for new materials is an iterative process where the material density and properties after consolidation are improved. The goal is to achieve what is better known as “processing window” (Fig. 7.26) which is basically a certain area where parameters allow us to obtain processed material in a proper manner.

Source AIDIMME)
Processing window gathering (
This process implies huge efforts, material and partially dedicated machines. It is normaly required to carry out consecutive builds varying some of the parameters pointed out previously, rejecting the ones where consolidated material presents lack of fusion or building issues and approving the ones where consolidated material presents good qualities.
As a summary, what it is obtained from this process parameter development is a window where some parameters define the processing boundaries of a certain material. Although only two variables are represented in the table below it is normaly required to adjust the whole setup of process parameter but only two specific variables are mapped within the window.
Green highlighted areas correspond to suitable process conditions whereas orange areas determine the processing boundaries or limits from which material is not properly processed (Fig. 7.27).

(Source AIDIMME)
Processing window of a certain material
7.2.5 Qualification of the PBF-EB/M Production
Qualification is defined as a method to ensure that an AM process (combination of technology and material) is controlled and the result of it meets required specifications in a repeatability manner. Reproducibility and Repeatability are the key values to include AM technologies as a production technology.
AM Challenges for Manufacturing Metallic Components for Critical Markets
Looking an overview of all steps required to obtain an AM part, it is necessary to evaluate all challenges of each step in order to control all possible variables and ensure that results meets all requirements of each step (Fig. 7.28).

(Source RepAir project, AIDIMME)
Overview of all steps to obtain and AM part
For each step, there are some challenges that it is essential to consider its influence in the whole process in order to include an AM technology as a manufacturing option in critical sectors like aircraft or medical.
In terms of materials, it is important to consider:
-
Powder properties differences from different powder suppliers. There are some powder manufacturing processes (gas atomization, plasma atomization, etc.) and results regarding powder properties are different.
-
Differences in raw material from different batches, because AM technologies allow the use of blended powder, so the properties of the feedstock differ from virgin powder.
-
Powder properties variation due to the reusability of it.
-
Possible impurities due to non-dedicated machines.
Regarding Additive Manufacturing processes and post-processes:
-
The complexity of the deposition process: energy source type and deposition feed raw material delivery and build chamber conditions.
-
The physical phenomena related with AM are complex and dependent on multiple factors: Process variables vs mechanical properties and distortions.
-
The need of post-processes for finishing parts, including machining critical areas to meet dimensional tolerances, grinding and blasting to reduce surface roughness.
Regarding Design and Part assessment:
-
AM is not sufficiently understood nor characterized.
-
Mechanical properties datasets are not available. It should be very interesting to have mechanical properties of a combination of material/machine in order to know the material properties in simulation software for designing process.
-
Neither a correlation between product and process specifications is available.
-
Nowadays, there are a lot of standard under development. New standards will bring these technologies closer to the industry.
As a summary, it is important to highlight that the process qualification is a method by which the parts processed as it has been specified are examined to ascertain if they meet the required specifications (qualifying criteria) in a repeatedly manner to be identified as qualified on Fig. 7.29.

(Source RepAir project, AIDIMME)
Qualification process overview
The aim of the qualification procedure is to identify the variables of the process and its allowance range in order to know their influence in the part performance and process reproducibility. Thereby, this qualification process provides a correlation between product and process specifications to ensure adequate and consistent performance of parts; the procurement procedures; and assessment procedures for part acceptance.
How AM Could Be Introduced in an Affordable Way to Critical Markets Like Aircraft, Automotive, Medical?
Some industrial sectors are very restricted related to design modifications, such as an aircraft sector. In order to introduce in an affordable way AM in the industry is better to start testing and checking an AM part similar to its conventional part. For this reason, for some sector these are the steps for its introduction in some sectors:
-
1.
AM of well-known geometry or small modifications for no critical parts.
-
2.
New design geometry adapted to AM for no critical parts.
-
3.
New design geometry adapted to AM for critical parts.
An overview of a strategy for AM implementation is presented in Fig. 7.30.

(Source RepAir project, AIDIMME)
Overview of an AM implementation strategy
REPAIR Project: Future RepAIR and Maintenance for Aerospace Industry (2013–2016)
RepAIR Project performed a research on future repair and maintenance for the Aerospace industry. Therefore, the onsite maintenance and repair of aircraft by integrated direct digital manufacturing was in the focus of this project. REPAIR project was funded by European Commission FP7 Program. The main objective of RepAIR project was to shift the “make” or “buy” decision towards the “make” decision by cost reduction in the remake and rework of spare parts and therefore improve cost efficiency for maintenance repair in aeronautics and air transport.
A crucial advantage of this technology was the flexible availableness (even at the gate) allowing on-time maintenance. Through a higher level of automation und fewer stages of production, less personal costs are necessary which therefore reduce the MRO costs. These operations require a higher qualification and promote the preservation and expansion of highly qualified workplaces in Europe. Moreover, the storage costs will be significantly reduced.
The partners that participated in the project were APR, AIMME, ATOS, AVANTYS engineering, The Boeing Company, Cranfield University, Danish Aerotech, Danish Techn. Institute, Lufthansa Technik, O'Gayar Consulting, SLM Solutions, University of Paderborn. More information about this project can be found in.
Development of the Process Qualification in RepAIR Project
A process qualification procedure is the method used for the assessment of all the variables/factors suitable to influence in both technical requirements of the final part and process reproducibility compliance as well. This method should be developed based on the expertise and knowledge of all the processes considered in the supply chain and considering potential dependencies between variables coming from different processes such as post-melting processes.
The process qualification procedure requires the assessment and control of key raw materials/feedstock, consumables, and process parameters; the development of a fixed practice for each AM component; the verification of each fixed practice via NDI and destructive testing; and part-specific acceptance testing (both NDI and destructive testing) to ensure the integrity of parts.
Once the specification is generated and the supply chain defined, development of design data must be accomplished using material produced to the requirements of the specification. If the products of the AM process are confirmed to be robust by exhibiting nearly isotropic and uniform behaviour throughout the entire component and having low variability from part to part when parts are produced within the limits of the specification, a single design database for a given alloy is feasible. Once design data are available, an assessment of the predictability of structural performance must be conducted.
As result of the execution of the process qualification, it derives a knowledge about which should be the variables/factors with more impact in the part performance –key factors-, the allowance range for the key factors and the characterisation data for predicting structural behaviour among design.
Therefore, in the production of AM components, quality procedures and quality control should be developed and implemented in a quality management system for monitoring the key factors and verifying if they are inside of the allowance range. Finally, the verification of each fixed practice via NDI and destructive testing; and part-specific acceptance testing (both NDI and destructive testing) to ensure the integrity of parts (Fig. 7.31).

(Source RepAir project, AIDIMME)
General approach for the process qualification procedure and its application in the production
The general approach for the process qualification procedure could be divided in four steps:
-
1.
Process specification development and supply chain definition.
On this step, a process specification should be developed for AM manufacturing component. As part of the process specification, the AM process and post processes should be established based on some sensible technical requirements from the component such as:
-
Material(s) specification(s): it is required to provide information related to the material such as material standard reference. The material standard establishes the chemical and mechanical behaviour of the material and some conditions for purchasing, storing, handling or processing. In some cases, other standard references would be considered for further information required such as testing methods for properties assessment. In this topic, special attention should be paid to the standards published from the ASTM F-42 and ISO TC-261 standardisation group and other known and accepted by component sector. Other material requirements not considered in the corresponding standards should be provided in addition.
-
Geometry: it is required to provide the geometry in a 3D solid model format; the dimensional, geometrical and surface tolerances required through the corresponding drawing. If it is required a redesign of the part with the aim to reduce the weight of the part, the 3D model of the redesigned part should be provided. If some post processes are required in order to meet the technical requirements such as machining the definition of all 3D solid models required per process including the allowance material in the critical areas of the part should be provided as well.
-
Use conditions: it is required to provide information related to the use of the part such as its function; the load conditions; the part environment conditions –chemical, temperature range, pressures range, humidity range; the configuration of the part within the system to which it belongs; the interactions with other parts or systems.
-
Possible failure modes: it is required to provide information about the possible failure modes such as type of failure mode; frequency of the failure mode; failure location on part; mean time to repair/replace the part. The assessment tests should be considered in the process qualification procedure depending on the possible failure modes.
-
Economic measures: it is required to provide information related to economical issues such as the economic goal; the description of the current manufacturing processes; the current part costs; the production targets; the batch size for primary equipment; the batch size of parts; the average technical delay; the average logistic delay; the average administrative delay and other issue relevant for taking economical decisions related to the process specification.
-
Traceability: it is required to provide information/documentation about how a part is identified by itself and in relation with the subsystems or systems it is included; about the raw material; about the process specified for manufacturing the part; about the providers considered into the supply-chain, about the assessment tests for validating the part.
-
Therefore, the process specification for manufacturing a component should be established based on all the information previously gathered considering the prior aspects. The process specification should include issues such as:
-
All the manufacturing techniques used for achieving the final part: the specification of the AM technologies and the corresponding heat and surface treatments required after melting the parts. A workflow of all the steps required should be developed.
-
The raw material processed or feedstock by the manufacturing techniques: the specification of the powder, the use conditions, the recyclability of the powder, the ageing allowed of the powder, the performance variance among the process and the powder blend procedure.
-
The geometries required among the process: it is required to distinguish between the initial part model and the redesigned part model. Even, other additional geometries required in intermediate steps should be specified such as the geometry related to the supports for the AM technique and the geometry for machining process with the corresponding overmass to be removed afterwards.
-
The AM process plan. It is required to establish the geometries to be built per cycle. The cycle refers to an individual build platform for the AM process. Depending on the process specification for qualifying the process, it could be required to build per cycle not only the parts if not also some witness specimens for assessment purpose. In addition, some other considerations should be considered such as the location of the parts in relation with the powder bed –build platform-, the build orientation, the properties variance along the chamber volume. To qualify the AM process plan specified some other conditions should be fixed among the cycles such as the system; the process settings –process parameters-; the operators knowledge; the maintenance agreements; the execution of the calibration process and the operational instructions to operate properly.
-
The post-processing plan: it is required to provide information about the post-processes required to meet the technical requirements such as heat and surface treatments. This information would include the geometries required in each post process; the fixtures developed for machining and the strategy to obtain a surface quality part; the heat treatment settings for stress relief and/or improving the microstructure and the HIP settings for reducing the porosity and for improving the structural performance of the part.
-
The assessment plan: it is required to establish the definition of a set of studies to be carried out through NDT and destructive tests to characterise all the process specified. In these studies the raw material, the AM processed material and the part should be characterised following the assessment developed. The characterisation studies proposed should consider the standards as reference for establishing the qualification process. A prior selection of standards required should be established from the beginning.
-
The process reproducibility: the number of cycles required in order to assess the reproducibility of the process specified. A comparison between the results from the characterisation of the different cycles should be considered to determine potential variance between the results.
-
2.
To identify all critical variables—parameters- among the process specification of each step in the supply chain: key factors.
Among the process specified for manufacturing a part, many variables—parameters are involved. All these variables have a cross-linked relation between them due to the nature of the AM technologies. Therefore, it is required to know about the potential dependencies between them.
It refers to critical variables, to the set of variables with more influence in the quality of the resultant part. The quality of the resultant part deals with the compliance with the technical requirements required and if the process specified becomes stable and repeatable. These critical variables should be considered as key factors to be monitored among the process specified.
Of all manufacturing techniques considered in the process specification, the newest and less known are the AM, in particular metal AM processes. So, efforts have concentrated in the definition of the parameters of the AM process and its dependencies with other conventional processes. To do this task, a list of the parameters among the process specification should be considered and classified in the next groups:
-
Plant
-
Raw material
-
AM processed material
-
Post processes
-
Part.
In the process qualification, some of the parameters are not variable along the cycles or batches usually. On that case, we consider in the studies those as fixed parameters. Figure 7.32 shows a preliminary set of parameters.

(Source RepAir project, AIDIMME)
Preliminary definition of AM process parameters classified in groups
-
3.
Development of studies to fix some parameter and to analyse the influence of all of them.
After considering a list of parameters classified in groups, some studies should be considered for analysing the influence in the quality of the part of each parameter by itself and in relation with others.
The studies look for evaluating the dependencies between, the raw material in a specific powder batch; the reusability of the powder; the AM processed material properties depending on the bed location (along X–Y axis and Z axis) and the build direction (X, Y and Z axis); the influence of the HIP and the surface roughness in the fatigue behaviour.
Before to carry out these studies, it is crucial to review all scientific publications and internal studies developed by the technology provider or AM experts in order to delimit the extent of the studies to carry out. The conclusions and the knowledge acquired in these reports shall be documented.
-
4.
Control the value of the critical variables or key factors.
Finally, after searching relevant publications or carrying the studies proposed before, as result the key factors would be identified and also it would be possible to know about which is the allowance range for each of them. The term “allowance range” means the lower and upper value of each parameter considered as boundaries. If the value of one key factor is inside of this allowance range, it is possible to say that the part quality is in compliance concerning this parameter.
The aim to setup the allowance range of the key factors is that in production, it is possible to monitor its values and if they are inside of the established boundaries or not. The assessment of the key factors should be implemented in the quality management procedures as quality control points.
A Guide for Additive Manufacturing Qualification Procedure Implementation
Based on the qualification process qualification procedure developed in the project a guide for AM Qualification Procedure was defined, this guide covers additively manufactured Ti6Al4V components using full-melt powder bed fusion such as electron beam melting and laser melting,
This method is based on the requirements specified in the standard ASTM F2924-14 and the expertise from experts with complementary background. The method proposed for AM Qualification considers the following steps for AM manufacturing process (Fig. 7.33).

(Source RepAir project, AIDIMME)
AM manufacturing process steps
-
(1)
Component requirements specification. This contains a specific register of a set of requirements to be acquired for the component considered. The requirements specification will drive the qualification method, herewith even, the component design, and the manufacturing plan. Once the design of the part and the manufacturing plan are implemented, verification of the component will be carried out against the requirements specified in this specification.
-
(2)
Manufacturing plan for qualification. Once the component requirements have been specified a manufacturing plan for qualification can be specified. This plan requires several build cycles in which different witness specimens are assessed in accordance with the corresponding chapters of the ASTM F2924-14. The specimens considered are for chemical composition from powder lots and melt material as well, microstructure and mechanical property—tensile and fatigue-. Different location, orientation on the build platform, number of test specimens for each build cycle are considered for establishing the relationships between these process variables and the results. Moreover, the assessment of the results reproducibility among build cycles is driven in the manufacturing plan. Prior to proceed with the manufacturing plan execution it is convenient to ensure issues related with the control of the AM facilities (AM machine, auxiliary equipment, software version) and AM personnel qualification.
-
(3)
Feedstock (powder). In this se. ction it is described the studies to be considered for specifying the feedstock –metal powder- in the process qualification method. Special attention will be required to the following facts:
-
There are some causes, which may affect to the presence of inclusions and impurities in the chemical composition of the powder, even in the melt material, such that the final material chemistry will be not in accordance with Table 1 from ASTM F2924-14. The use of a non-dedicated machine for one specific metal, which requires changing the powder alloy and in consequence, it is one of the most relevant causes of the powder contamination.
-
High chamber temperature—case of PBF-EB/M—during building derives in a variation in chemical composition regarding virgin powder due to evaporation of some elements. During handling, some alloys may suffer significant oxygen pick-up, even due to humidity inside the build chamber, which may not be completely eliminated. Oxygen pick-up may increase material fragility. The chemical composition of the metal powder shall be adequate to yield, and after processing, the final material chemistry shall be in accordance with the Table 1 of the ASTM F2924-14.
-
The use of the used powder is allowed, but additionally to the effects of variance in the chemical composition described above, modifications in other powder properties such as size distribution, particle shape, apparent density and flow rate may produce also bad fusion results.
-
Powder blends are allowed unless otherwise specified between the component supplier and the component purchaser, as long as all powder used to create the powder blend meet the requirements listed in Table 1 from ASTM F2924-14 and lot numbers are documented maintained.
-
Therefore, it is convenient to consider in the process qualification method the following studies related to the feedstock control:
-
Assessment of the amount of inclusions and impurities present in the chemical composition of the feedstock. The assessment of the chemical composition in the melt material will serve to ascertain if the final material chemistry is in accordance with Table 1 from the ASTM F2924-14. However, the assessment of the chemical composition in the powder prevents non-conformities for build cycles before processing.
-
Assessment of the feedstock properties variation along several build cycles. This study considers the assessment of the property variations in both, powder and melted material as well, when the same powder lot is processed several times in different build cycles in a machine. Powder properties assessed shall be chemical composition, size distribution, particle shape, apparent density and flow rate. Meanwhile AM processed material assessed shall be chemical composition. This study provides information about the most limiting element in the chemistry, hereafter referred as “critical element” and a correlation of the percentages by weight of this element between the melt material and powder. This information shall drive the procedure for blending the powder and shall provide the maximum number of times used powder can be used.
-
(4)
AM and post-processed material characterization. As part of the manufacturing plan for qualification it is included the specification of the post-processing sequence of operations. Post-processing operations may be used to achieve the desired shape, size, surface finish, or other component properties.
According to the component requirements specified, a structural performance of the AM processed material shall be characterised in the process qualification method. Therefore, once the feedstock studies described in the prior section have been conducted, the critical element has been identified and the powder blending has been specified, the processed material shall be characterised using as feedstock, several samples with a percentage by weight of the critical element into the minimum and maximum values specified in Table 1 from ASTM F2924-14. That means, the structural properties of the AM processed material shall be predictable if it is processed from any feedstock with a percentage by weight of the critical element into these values.
-
(5)
Manufactured component. The component properties depend on the position and location of they are processed on the build platform.
The design of the support structures may influence in the result of the component processed by AM. Support structures act as not only for supporting the weight of the material when it is melted if not also as heat conductor between the melt point and the build platform. Distortion during and after this process is mainly due to thermal gradients and local strains caused by phase changes. It cannot be avoided, but the support structure can be designed in such a way that distortion is minimised.
Post-processing operations may be used to achieve the desired shape, size, surface finish, or other component properties.
On that case, it is required finally an assessment of the component properties in order to qualify if the process for manufacturing the component as it is specified in the manufacturing plan shall comply the component requirement specifications.
Depending on the market sector, during the AM component manufacturing, a set of samples shall be built together with the component in order o guarantee the correct manufacture of the component, ensuring the chemical composition and mechanical properties of the AM processed material. This guide could be considered as reference for other metal alloys using full melt powder bed fusion such as electron beam melting and laser melting.
RepAIR Project Study Case:
According to the qualification process guide described, the following case study has been considered for its implementation following the standard reference ASTM F2924-14:
-
(1)
Component requirements specification. The selected case study is a non-structural load-bearing bracket. The material for this part is Ti6Al4V. The dimensions are about 180 × 110 × 40 mm. Its modes of failure can be an overload, a fatigue failure or a creep distortion. A drawing with dimensions, tolerances and references has been provided by the OEM.
-
(2)
Manufacturing plan for qualification. For manufacturing the bracket, both PBF-LB/M and PBF-EB/M has been considered. This study case only shows the implantation of PBF-EB/M in the manufacturing plan. The part after AM processed should be machined and HIP treated for acquiring the dimensions, surface roughness and fatigue behavior required. The location, orientation of the part in the build platform is specified according technical and economic feasibility. Thereby, the minimum support structures are considered for avoiding machining operations but preventing distortions and manufacturing failures.
The qualification platform was designed taking into account all previous considerations. It was built three times, for the assessment of process robustness and results reproducibility. This platform includes the following samples (Fig. 7.34).

(Source RepAir project, AIDIMME)
Manufacturing platform definition for qualification
Considered samples are:
-
Witness specimens for chemical composition analysis of the AM processed material:
-
Sphere coupons of 5 mm diameter for characterizing the Oxygen content by weight. Four of these spheres are linked between them for ascertaining the Oxygen content variation along z-axis. The linked spheres are built in every corner of the platform for ascertaining the Oxygen content variation along x and y-axis. These samples are built directly over the platform.
-
Support structures have been used for other element characterization present in the alloy; and for the assessment of inclusions and impurities.
-
Sphere coupons of 5 mm diameter for characterizing the Oxygen content by weight linked to the part. There are considered 3 items per part.
-
-
Witness specimens for tensile test of the AM processed material:
-
The geometry of the specimen considered is according the standard reference.
-
The number of specimens considered for tensile test was 8 per build cycle.
-
The position of these specimens on the build platform was the following, all of them were separated over the build platform 15 mm at least and positioned close to each of its corners and its borders; they were oriented as follows, 4 in z axis direction, 2 in x axis direction and 2 in y axis direction. Thus, it is possible to know about the property variations related to build position and orientation.
-
-
Witness specimens for microstructure and porosity test of the AM processed material:
-
The geometry of the specimen considered is a cylinder coupon of 14 mm diameter and 10 mm length.
-
These specimens are linked to the vertical tensile bars, at each of its ends. Such that, 4 of them are separated over the build platform 15 mm at least. Thus, it is possible to know about the propery variations related to build position in x, y and z-axis.
-
The number of specimens considered for microstructure was 8 per build cycle.
-
-
Components:
-
Two brackets are considered with the orientation more feasible from technical and economic point of view. This orientation prevents failures along manufacturing. The support structure design is conceived for reducing distortions phenomena and for minimizing the machining operations after AM process.
-
-
(3)
Feedstock. For the characterisation of the feedstock the following assessment has been done in accordance with the standards listed into Table 7.2:
Table 7.2 Standards for tests -
The assessment of the amount of inclusions and impurities based on the materials prior processed in the system.
-
The assessment of the feedstock properties variation along 3 build cycles using the same powder lot, after characterizing the starting powder.
-
-
(4)
AM and post-processed material characterization. For the characterisation of the feedstock the following assessment has been done in accordance with the standards listed into Table 7.2:
-
The chemistry of the AM processed material.
-
The tensile properties of the melt material with and without HIP treatment.
-
The microstructure and porosity of the melt material with and without HIP treatment.
-
-
(5)
Manufactured component. For the characterisation of the manufactured component the following assessment has been done:
-
Dimensional and surface measurement after machining and HIP treatment.
-
Two different fixtures and process parameters for machining operation has been considered from different suppliers.
-
Figures 7.35 and 7.36 show the witness specimens and parts manufactured by PBF-EB/M (Fig. 7.37).

(Source RepAir project, AIDIMME)
Build cycle manufactured

(Source RepAir project, AIDIMME)
Tensile bars together with samples for microstructure and porosity testing

(Source RepAir project, AIDIMME)
Manufactured parts with (a) and without support (b)
-
Feedstock. There is not relevant variation of the powder characteristics along the three build cycles. There is not presence of impurities or inclusions after following the powder handling procedures established by the technology developer, even in a non-dedicated system for a given alloy.
-
AM processed material:
-
The chemistry of the AM processed part is according to the Table 1 specified in ASTM F2924-14, even in the case of Oxygen as critical element in this alloy (Table 7.3). The values shown in the graph correspond to the average of the % Oxygen of all specimens per build cycle (Figs. 7.38, 7.39).
Table 7.3 Evolution of % Oxygen content (average of all specimens) in AM processed material along the build cycles Fig. 7.38 
(Source RepAir project, AIDIMME)
Oxygen evolution in AM processed material
Fig. 7.39 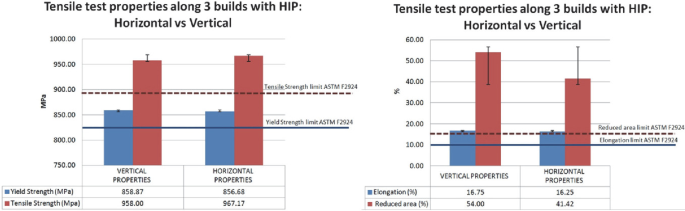
(Source RepAir project, AIDIMME)
Tensile properties variation considering build orientation for the specimens HIP treated
-


-
Concerning the tensile tests of the specimens with and without HIP treatment, all of them are according with the ASTM F2924. Table 7.4 shows the results per build cycle considering the build orientation (horizontal vs. vertical). Figure 7.40 shows the tensile properties comparing the average values of all specimens without and with HIP treatment.
Table 7.4 Results of tensile test of the specimens with and without HIP treatment

(Source RepAir project, AIDIMME)
Tensile test properties with and without HIP treatment
-
It is important to highlight the repeatability of the mechanical properties: repeatability trend curve (Fig. 7.41), and the curves stress vs. strain from all the specimens with HIP treatment (Fig. 7.42). The build cycle, the location and the orientation of the specimens are considered in the legend of the graph.
Fig. 7.41 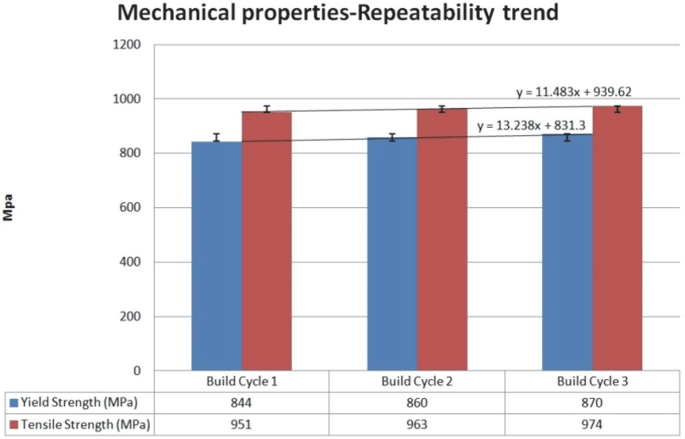
(Source RepAir project, AIDIMME)
Repeatability of the mechanical properties
Fig. 7.42 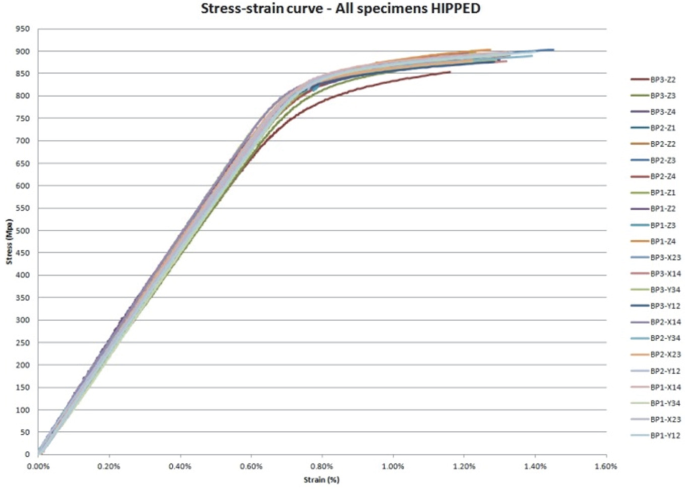
(Source RepAir project, AIDIMME)
Stress versus strain curves from all the specimens with HIP treatment


-
For Ti6Al4V grade 5, HIP process reduces or eliminates internal porosity that contains parts processed by AM (Table 7.5; Fig. 7.43), and this phenomenon improves the fatigue behaviour of the material. HIP process increases the columnar grain size in both, width and length and also it increases the thickness of the α-plates along the build direction (Fig. 7.43). In general, the size of α-platelets colony is very small and in the majority of cases they are present in singular forms. Therefore, HIP treatment modifies the microstructure and reduces slightly the static mechanical properties of the material (Fig. 7.40).
Table 7.5 Average values of porosity and melted material with and without HIP treatment Fig. 7.43 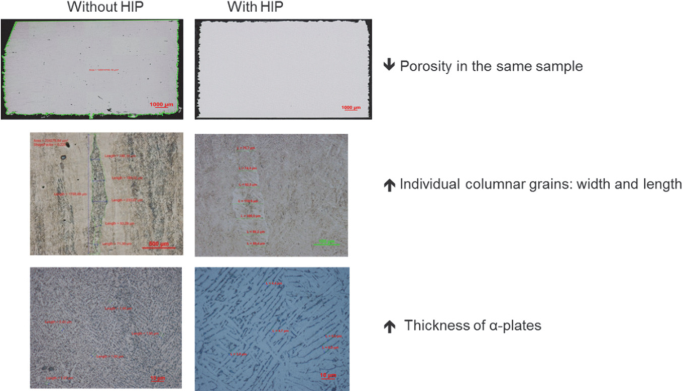
(Source RepAir project, AIDIMME)
Microstructure evaluation and comparison between with and without HIP

7.2.6 Powder Recycling for PBF-EB/M
Feedstock control in an AM technology is highly important to obtain good and reproducible results in an AM production. In case of Powder Bed Fusion technologies, it is necessary to guarantee that the properties of the powder as feedstock are suitable for this technology as it was mentioned at the beginning of the chapter.
In chapter 7 of the ASTM F2924-14 it is highlight:
-
The use of the used powder is allowed. The proportion of virgin powder to used powder shall be recorded and reported for each production run. The maximum number of times used powder can be used as well as the number of times any portion of a powder lot can be processed in the build chamber should be agreed upon between component supplier and purchaser.
-
Powder blends are allowed, unless otherwise specified between the component supplier and the component purchaser, as long as all powder used to create the powder blend meet the requirements listed in the corresponding standards and lot numbers are documented maintained.
ASTM F2924 allows the use of used powder and blended powder, but how many times is it possible to re-use it? Which is the procedure for blending the powder?
The following information on feedstock control in PBF-EB/M technology is extracted from to two research projects: (i) AEROBEAM [1], and (ii) MANSYS [37].
-
AEROBEAM: Direct Manufacturing of stator vanes through electron beam melting (2012–2013). Evaluation and comparison of mechanical properties between fresh and recycled powder.
Aimed at investigating the mechanical properties of aeronautical Ti6Al4V stator vanes elaborated by Electron Beam Melting, tensile and fatigue tests were performed on both fresh and recycled powder to assess the mechanical properties of Ti6Al4V material elaborated by EB-PBF. Limit of use of the recycled Ti6Al4V atomized powder associated with the PBF-EB/M process will be determined.
Partners: AIMME, CEIT. Topic Manager: SAFRAN Snecma.
Funded by: European Commission FP7 Program. Cleansky JTI-CS-2012-01-ECO-01-049
-
MANSYS: Manufacturing decision and supply chain management SYStem for additive manufacturing (2013–2016).
ManSYS aims to develop and demonstrate a set of e-supply chain tools to enable the mass adoption of Additive Manufacturing. “A complete decision making system and robust supply chain management system for metal additive manufacturing; enabling the production and delivery of quality assured, highly customized products and services”.
Partners: AIMME, BCT GmbH, Berenschot, GE Marmara Technology Center (GE MTC), LPW, Materialise, Poly-Shape, Smith & Nephew, TNO, TWI, Twocare, Wisildent.
Funded by: European Commission FP7 Program. FoF.NMP.2013-9 (Advanced concepts for technology-based business approaches addressing product-services and their manufacturing in globalised markets).
There are some particularities related to the Powder Bed Fusion technologies that influence in the status of the powder.
-
The use of non-dedicated machines for one specific metal, which requires changing the powder alloy periodically; it is one of the most relevant cause of the powder contamination and finally the built material is contaminated too. It is no possible to work in specific area of medical sector, such as AM implants.
-
In the case of PBF-EB/M—High chamber temperature during building derives in a variation in chemical composition regarding virgin powder due to evaporation of some elements. During handling, some alloys may suffer significant oxygen pick-up, even due to humidity inside the build chamber, which may not be completely eliminated. Oxygen pick-up, may increase material fragility, but also affects powder fluidity, avoiding proper powder distribution in layers and may produce bad fusion between them.
Due to the described particularities some studies were done in order to control the PBF-EB/M feedstock:
-
Assessment of the amount of inclusions and impurities present in the chemical composition of the feedstock for PBF-EB/M. The assessment of the chemical composition in the material as built serve to ascertain if the final material chemistry is in accordance with the Table 1 of the ASTM F2924-14. However, the assessment of the chemical composition in the powder prevents non-conformities for build cycles before processing.
The ARCAM A2 machine for this example is a non dedicated machine, for this reason an exhaustive cleaning process was performed when a new material shall be processed.
A list of the metal alloys previously processed in the machine shall be specified; in this case the metal alloys were CoCr ASTM 75, Nickel alloy and pure Copper powder.
The chemical composition analysis was assessed in different samples, from powder lot and as built material as well. Table 1 from ASTM F 2924 shows the small percentage of impurities that are allowed for this kind of material.
Results from different builds show that the clean procedure followed before proceed with new powder batch is correct and it is possible to process Ti6Al4V with guarantee that there is not presence of impurities according to ASTM F2924-14 or ASTM F3001-14.
-
Assessment of the feedstock properties variation along several build cycles. This study considers the assessment of the property variations in both, powder and as built material as well, when the same powder lot is processed several times in different build cycles in a machine. Powder properties assessed shall be chemical composition, size distribution, particle shape, apparent density and flow rate. As built material property assessed shall be chemical composition.
-
The identification of the critical elements in the chemical composition
-
Identification the Maximum number for re-using the same powder
-
The study was performed on Arcam A2 machine, using Ti-6Al-4V powder provided by Arcam AB. Builds were manufactured consecutively with the same recycled powder. After each build, all the powder—the blasted, the vacuum-cleaned and the one remaining in the hoppers—was sieved and mixed together. Then, a sample of approximately 20 g of powder is taken for powder analysis. Once the powder samples were taken, the powder hoppers are reloaded with the sifted powder from the bucket and the next build is prepared. The builds were performed in the room with controlled temperature (21–23 °C) and controlled humidity (35-40%).
The powder analysis strategy was established in the following manner: the powder was analyzed build after build until reaching the build in which one or more elements are out of range.
After evaluation of all chemical analysis results, it was established that the maximum level of recyclability in this study is 12. This value depends strongly on oxygen content which is the only one that in this analysis showed clear tendency of increase. It must be underlined that the recyclability level will always depend on the initial oxygen content in the fresh powder (in this case it was 0.14%). All other alloying elements are more or less constant and way under the allowed limit. It is of much importance to highlight that this study was performed under the most critical scenario, since no fresh powder was added at any point. The common procedure in EB-PBF manufacturing is to keep the same powder quantity by adding new powder as it is spent. In other words, the mixture of fresh and recycled powder will leave us always on the safe side in comparison to these results.
It is possible to conclude that the used if Ti6Al4V is allowed, it is required to monitor the content by weight of the Oxygen in the material in order to avoid risks. This parameter should be considered as critical element in the chemistry of this alloy and therefore, it is shall be specified as one item to be controlled in a Quality process.
7.2.7 Parts Characterizing and Qualification
Introduction to Technologies for Part Qualification
After an Additive Manufacturing process of a set of parts in a build plate, a part qualification or testing procedure shall be followed in order to assure that parts meet customer requirements (specially for critical parts). A tentative procedure could be:
-
1.
Visual inspection (surface porosity, defects, etc.).
-
2.
Evaluation of log files and AM reports, in order to detect possible fails like vacuum, temperature, electron gun problems, etc. Variables depend on the AM technology.
-
3.
Chemical analysis (with a tester that is built in the same build cycle than the critical part).
-
4.
Dimensional tolerances (with the dimensional tester).
-
5.
Dimensional tolerances of the part (depending on the shape of the part it is necessary specific equipment like Scanner 3D).
-
6.
Mechanical behaviour (with tensile test specimens or product test, but they are destructive tests).
-
7.
Non-Destructive Testing (NDT) to control what happen inside the part (Dye-penetrant inspection, Ultrasonic inspection and CT scan).
-
8.
Other tests depending on the application of the final part.
Figure 7.44 exhibits an example of visual inspection defects.

(Source AIDIMME)
Example of visual inspection defects
One of the most widespread applications of metal Additive Manufacturing is the manufacture of unique parts; therefore Non-Destructive Tests are needed for evaluation. There are two kinds of defects:
-
External defects, such as surface defects, surface porosity, distortion, surface inclusion, textures.
-
Internal defects, such as internal porosity, inclusion and lack of fusion.
Some of the NDT are suitable for detecting external defect, such as Visual test or Fluorescent Penetrant Inspection (FPI) and for internal defects are suitable techniques like X-Ray and Computer Tomography Scan (CT Scan). Computer Tomography (CT scan) may be selected as the most suitable non-destructive test for the inspection of an AM part. All kind of defects (internal and external) are detected by this testing method.
Computer Tomography Scan Inspection for Qualifying AM Parts
CT scan or computed tomography (formerly computerized axial tomography scan or CAT scan) is a non-destructive materials test which makes use of computer-processed combinations of many X-ray measurements taken from different angles to produce cross-sectional (tomographic) images (virtual “slices”) of specific areas of a scanned object, allowing the user to see inside the object without cutting.
Good results are observed in parts processed by Additive manufacturing Technologies for three main reasons:
-
Defects detection
-
Internal pores.
-
Cracks.
-
Inclusions.
-
Non melted material inside channels (trapped powder).
-
Cleaning parts deficiency.
-
-
During process parameters development process, detection of internal pores and cracks in a specific location (hatch or contour) allow modifying specific parameters depending on this defect and the detected location.
CT scan measurement principle is the measurement of the attenuation of the X-Ray radiation due to the component geometry and the density of the material used.
There are some parameters to take into account before CT scanning of a part, because b it determines the power of the equipment to be used and if it is possible to make the measurement:
-
Volume of the part.
-
The material.
-
The thickness of the part that depends on the density of the material and the equipment technical characteristics.
-
The shape of the part.
These parameters determine the measurement of a part as well as whether it is possible to scan more than one part at the same time.
There are different companies around Europe that offer CT scan services. Following examples were developed by AIDIMME with the collaboration of Carl Zeiss Iberia Company that belongs to Zeiss Group and it is located in Barcelona.
AM defects detection:
Example 1
Tensile test inspection (Fig. 7.45).

(Source Fractal project)
PBF-EB/M bars and tensile test samples after machining by AIDIMME
One of the tensile test specimens exhibited poor elongation during tensile testing (Fig. 7.46).

(Source Fractal project)
Tensile test results (developed by CEIT)
CT scan was performed in a tensile specimen belonging to the same group of the failed one. Lack of fusion was detected (Fig. 7.47).

(Source Fractal project)
Lack of fusion detection
Example 2
Inner channels with unmelted powder (Fig. 7.48).

(Source Fractal project)
PBF-EB/M cleaning process deficiency
Example 3
Porosity detection (Fig. 7.49).

(Source Fractal project)
Porosity detection in the borderline between contour and hatch due to wrong adjustment of overlapp parameter
Example 4
Detailed evaluation of powder particles.
Differences in porosity, volume, morphology or irregularities can be analized in powder particles through CT-scan (Fig. 7.50).

(Source AIDIMME)
Detailed evaluation of powder particles
Example 5
Porosity inspection, lack of fusion and powder acumulation in PBF-EB/M processed material (Fig. 7.51).

(Source AIDIMME)
Detailed inspection of PBF-EB/M processed material
Example 6
Selection of the best process parameters for specific alloys.
The processed material might be evaluated in both XY and Z build directions (Fig. 7.52).

(Source AIDIMME)
Detailed evaluation in Z build direction
Quality of the processed material can be examined by using ct-scan to observe any difference between different combinations of process parameters (Fig. 7.53).

(Source AIDIMME)
Detailed evaluation in X–Y build direction. Evaluation of different combination of process parameters
Example of 3D Scanner for Qualification.
First, the build plate containing all parts including testers should be scanned. Second, parts from plate should be removed and finally, testers and critical parts should be scanned (Fig. 7.54).

(Source Skin project, AIDIMME)
Example of 3D scan for qualification
7.3 Development of Materials for PBF-LB/P
7.3.1 Processing Parameters Determination for PBF-LB/P
As in the PBF-EB/M technologies, most part of the PBF-LB/P equipments are partially open so that users can modify the processing parameters in order to improve the results obtained in standard materials or to gather new processing parameters for nonstandard materials.
Therefore, two different approaches can be followed:
-
Process parameter adjustment for standard materials: by modifying certain parameters or process features we can improve the surface roughness or the build ratios of PBF-LB/M parts.
-
Process parameter determination for nonstandard materials; this approach requires apparently much more efforts since there is not a first processing parameter setup. In this case different parameters must be tested so that sintered powder is assessed afterwards in order to determine the optimal energy to be deposited. The challenge to be faced within this approach is to find a processing window where material is flawlesly sintered.
Standard parameters adjusted during parameter development/process improvement:
-
Line offset (mm): distance between scanning lines. Every layer is made up of consecutive lines that increase the heat acumulation in the processed part. Low line offset values will lead to lack of fusion whereas very close lines will lead to part overheating.
-
Laser power (W): determines the energy aported by the laser source, depending on the material nature this value will vary. In addition, CO2 lasers require periodical recharges thus laser power will vary during the life cycle of the laser.
-
Part location and part orientation are detrimental for the part quality obtained. As gathered in the following lines, this input will be curzial in the surface roughness and dimensional accuracy of parts produced by PBF-LB/P.
-
Process temperature (°C): as a remainder, PBF-LB/P process work under a preheated environment which is at 12–16 °C below the sintering /melting point of the material. Temperature should be adjusted depending on the material nature.
-
Layer thickness (mm): powder bed height.
Processing parameter influence in PBF-LB/P parts are collected from results achieved in SKIN project carried out by AIDIMME. The aim of the project was to improve the surface quality of additive manufacturing parts in order to improve their mechanical performance, both in metal parts processed with PBF-EB/M technology and in polymer parts processed with PBF-LB/P technology.
As a clear result of how parameters affect the part surface finish, a deep study was carried out by AIDIMME within an internal project called SKIN. In this project, different strategies where applied while sintering parts in PBF-LB/P so as to cuantify surface finish improvements in polyamide-12 parts manufactured in a 3D systems SINTERSTATION 2500 Laser sintering equipment. Results are represented in lines below.
-
Influence of different part orientation.
-
Influence of different line offset values.
Part Orientation
When it comes to part positioning, the way the part is located inside the build envelopment will determine how accurate the part is reproduced. In this sense, a surface which is facing the upper part of the build volume is not reproduced as smooth a surface that is facing down. Measuring in different directions it is demonstrated that critical surfaces which are important must be placed facing down (Fig. 7.55).

(Source Skin project, AIDIMME)
Assessment of surface roughness in PBF-LB/P parts
In addition, not only this phenomenon affects the surface roughness of laser sintered parts but also the part position in reference to the X–Y-Z axis. Samples allocated in different ways inside the production envelopment were measured.
-
Parts facing X and Y reference axis came out smoother that samples facing the Z axis (Fig. 7.56).
Fig. 7.56 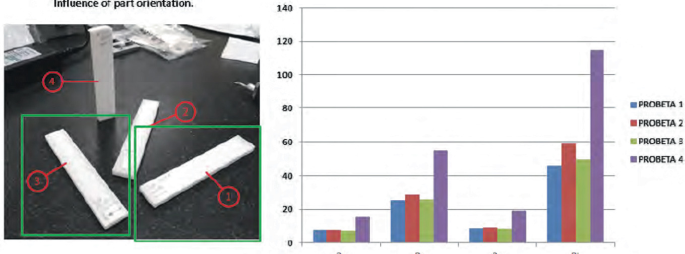
(Source Skin project, AIDIMME)
Surface roughness in LS parts positioned in different reference axis
-
On the other hand, when testing gradual angled Z samples, like represented in the figure below. Sample positioned completely parallel to the Z axis obtained the best results (Fig. 7.57).
Fig. 7.57 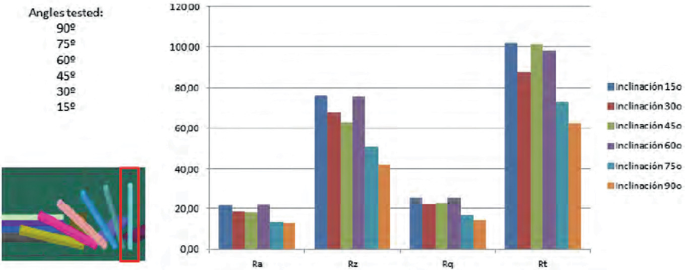
Source Skin project, AIDIMME)
Angled parts respect the Z axis. Surface roughness measurements (


Line Offset
As previously pointed out, very closed scanning lines could lead to a part overheating producing dramatic results in laser sintered parts, whereas wider line ofset values can lead to weak parts. Within skin project different values were tested obtaining the smoothest surfaces for a line offset of 0.11 mm (Fig. 7.58). However, it was demonstrated that wider values as 0.13 mm can improve the build ratios barely affecting the surface roughness. Therefore, 0.13 mm of line offset was considered a good balance between part quality and build ratio.

(Source Skin project, AIDIMME)
Line offset samples—surface roughness
As in any process parameter development, the behaviour of each material will be different and therefore will require specific processing parameters. Hence the processing window must be gathered. This is an iterative process where different parameters are tested and gradually adjusted in order to improve the material processability.
Values represented in this section correspond to tests manufacted by a sinterstation 2500 equipment from 3D systems.
7.3.2 Qualification of the PBF-LB/P Production
One of the key factors in PBF-LB/P technology is temperature stability. Slight variations in the temperature whithin the process will lead to part distortions, curling and other typical issues of additive manufacturing. Figure 7.59 shows process timing in a build cake depending on area.

(Source AIDIMME)
Process timing depending on area
Other important issue may be taking advantage of a support free technology by means of nesting softwares as Magics. This can help the technician with the parts allocation by improving the build density as much as possible. The more parts fit in the build envelopment the cheaper the unitary costs will be.
-
Example 1. Sinterstation DTM 2500. The smaller the parts are the better the packaging will be. Mean value of 6.044 cc (Fig. 7.60).
Fig. 7.60 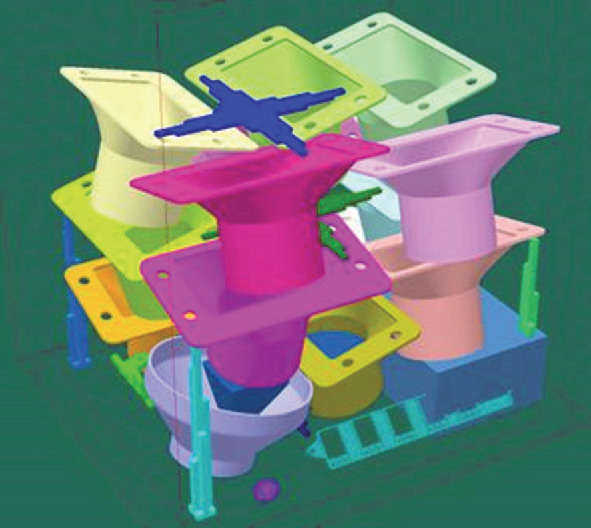
(Source AIDIMME)
Example of high grade of packaging
-
Example 2. Sinterstation DTM 2500. Qualification of the build production by controlling X-Y scale at different heights and Z scale in the corners Fig. 7.61.
Fig. 7.61 
(Source AIDIMME)
Example of X–Y-Z testers
-
Example 3. Laser power test to detect possible laser failure (Fig. 7.62).
Fig. 7.62 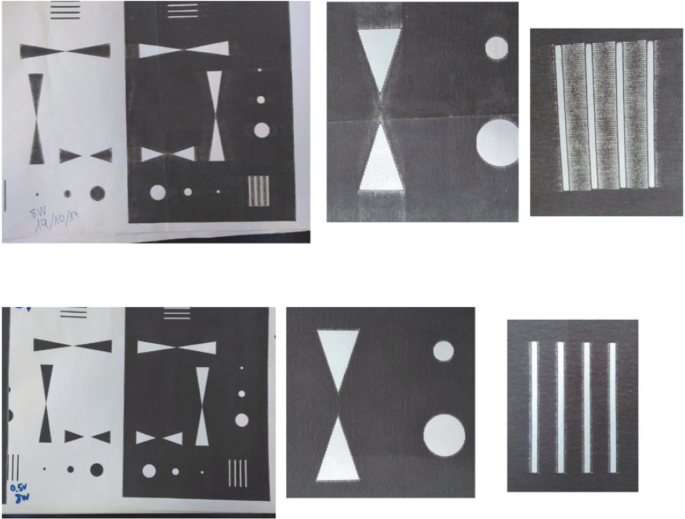
(Source AIDIMME)
Example of laser failure


It should be also highlighted the important role of powder handling and mixing in qualification of PBF-LB/P production. This is explained in detail in the following section: Powder blending and recycling for PBF-LB/P.
7.3.3 Powder Blending and Recycling for PBF-LB/P
Powder blending and recycling in PBF-LB/P is highly important due to most part of the production costs come from the feedstock itself. This means that a wrong powder reusability methodology can lead to a higly affected powder batch that does not allow us obtaining high quality parts due to the phenomenon known as “orange peel” (Fig. 7.63). Some drawbacks like poor mechanical properties of the final part or difficulties in process parameters are originated by this adverse phenomenon.

(Source AIDIMME)
Example of orange peel
LS powders will be deteriorated, thus must be refreshed with new material for further usages. Should the refreshing powder not be enough, sintered parts will show orage peel and poor quality.
It can be found in bibliography some methods like the Melt Flow Rate Test (MFRT) where we can quantify how affected the powder is. This method measures the time while a certain amount of powder is melted through an extruder at a specific temperature. Depending on this value already used feedstock must be refreshed in a controlled manner improving the reusability yields.
Based on the recommendations of machine suppliers, all the un-sintered powder collected from a build must be mixed with fresh powder in a constant ratio either manually or automatically. Based on experience and literature, it can be recommended not to use constant ratios. Powder should be mixed in order to keep the Melt Flow Rate between 24 and 26 g/10 min.
References
AEROBEAM: Direct Manufacturing of stator vanes through electron beam melting (2012–2013). Partners: AIDIMME, CEIT
Agarwala, M.K., Jamalabad, V.R., Langrana, N.A., Safari, A., Whalen, P.J., Danforth, S.C.: Structural quality of parts processed by fused deposition. In Rapid Prototyping J. 2(4), 4–19 (1996). https://doi.org/10.1108/13552549610732034
Bagley, E.B.: End corrections in the capillary flow of polyethylene. J. Appl. Phys. 28(5), 624–627 (1957). https://doi.org/10.1063/1.1722814
Bagsik, A., Schöppner, V., Klemp, E.: Long-Term Ageing Effects on Fused Deposition Modelling Parts with ULTEM*9085, pp. 629–640 (2012)
Bhattacharya, S.N., Kamal, M.R., Gupta, R.K.: Polymeric Nanocomposites. Theory and practice. Carl Hanser Publishers, Munich, Cincinnati (2008)
Bose, S., Ke, D., Sahasrabudhe, H., Bandyopadhyay, A.: Additive manufacturing of biomaterials. Progress Mater. Sci. 93, 45–111 (2018). https://doi.org/10.1016/j.pmatsci.2017.08.003
Calafel, I., Aguirresarobe, R.H., Peñas, M.I., Santamaria, A., Tierno, M., Conde, J.I., Pascual, B.: Searching for rheological conditions for FFF 3D printing with PVC based flexible compounds. Materials (Basel, Switzerland) 13(1) (2020). https://doi.org/10.3390/ma13010178
Cano, S., Gonzalez-Gutierrez, J., Sapkota, J., Spoerk, M., Arbeiter, F., Schuschnigg, S., et al.: Additive manufacturing of zirconia parts by fused filament fabrication and solvent debinding. Selection of binder formulation. Additive Manuf. 26, 117–128 (2019). https://doi.org/10.1016/j.addma.2019.01.001
Chaunier, L., Guessasma, S., Belhabib, S., Della Valle, G., Lourdin, D., Leroy, E.: Material extrusion of plant biopolymers: opportunities & challenges for 3D printing. Additive Manuf. 21, 220–233 (2018). https://doi.org/10.1016/j.addma.2018.03.016
Cheng, H., Manas-Zloczower, I.: Study of mixing efficiency in kneading discs of co-rotating twin-screw extruders. Polym. Eng. Sci. 37(6), 1082–1090 (1997). https://doi.org/10.1002/pen.11753
Cheng, H., Manas-Zloczower, I.: Distributive mixing in conveying elements of a ZSK-53 co-rotating twin screw extruder. Polym. Eng. Sci. 38(6), 926–935 (1998). https://doi.org/10.1002/pen.10260
Sanchez, C., Fabio, A., Boudaoud, H., Hoppe, S., Camargo, M.: Polymer recycling in an open-source additive manufacturing context. Mech. Issues. Addit. Manuf. 17, 87–105 (2017). https://doi.org/10.1016/j.addma.2017.05.013
C-Therm Technologies: C-Therm TCi™ Principles of Operation. Available online at https://ctherm.com/tech_library/category/21/, checked on 30 Mar 2020
Eisenschitz, R., Rabinowitsch, B., Weissenberg, K.: Zur Analyse des Formänderungswiderstandes, pp. 91–94. https://doi.org/10.1007/978-3-642-92045-5_11
Emri, I., Gonzalez-Gutierrez, J., Gergesova, M., Zupančič, B.V., Saprunov, I.: Experimental determination of material time-dependent properties. In: Hetnarski, R.B. (ed.) Encyclopedia of Thermal Stresses, pp. 1494–1510. Springer Netherlands, Imprint: Springer, Dordrecht (2014)
Eswaran, R., Janeschitz-Kriegl, H., Schijf, J.: A slit viscometer for polymer melts. Rheol. Acta 3(2), 83–91 (1963). https://doi.org/10.1007/BF01979457
EVO-tech GmbH: EVO-tech 3D-Drucker. Entdecken Sie den nächsten Schritt in der EVO-lution des 3D Drucks (2019). Available online at https://evo-tech.eu/, updated on 6th of March 2019, checked on 6th of March 2019.
Fallon, J.J., McKnight, S.H., Bortner, M.J.: Highly loaded fiber filled polymers for material extrusion: a review of current understanding. Additive Manuf. 30, 100810 (2019). https://doi.org/10.1016/j.addma.2019.100810
Fastermann, P.: 3D-Druck/Rapid Prototyping. Eine Zukunftstechnologie - kompakt erklärt. Springer Vieweg, Berlin Heidelberg (2012)
Fitzharris, E.R., Watanabe, N., Rosen, D.W., Shofner, M.L.: Effects of material properties on warpage in fused deposition modeling parts. Int. J. Adv. Manuf. Technol. 95(5–8), 2059–2070 (2018). https://doi.org/10.1007/s00170-017-1340-8
FRACTAL Project Development of new concepts of laser-based additive manufacturing technology using innovative strategies in the way of depositing dust and providing energy. (2015–2019). ETXE-TAR, SIMET, ALME, LANTEC, FAE, MESUREX, CESA, CEIT, UB, CL-UPM, BCAM o UPV, AIDIMME, CEIT
Gnanasekaran, K., Heijmans, T., van Bennekom, S., Woldhuis, H., Wijnia, S., de With, G., Friedrich, H.: 3D printing of CNT- and graphene-based conductive polymer nanocomposites by fused deposition modeling. Appl. Mater. Today 9, 21–28 (2017). https://doi.org/10.1016/j.apmt.2017.04.003
Gonzalez-Gutierrez, J., Cano, S., Schuschnigg, S., Kukla, C., Sapkota, J., Holzer, C.: Additive manufacturing of metallic and ceramic components by the material extrusion of highly-filled polymers: a review and future perspectives. A review and future perspectives. Materials 11(5) (2018). https://doi.org/10.3390/ma11050840
Gonzalez-Gutierrez, J., Stringari, G.B., Emri, I.: Powder injection molding of metal and ceramic parts. In: Wang, J. (ed.) Some Critical Issues for Injection Molding, pp. 65–86. InTech, Rijeka, Croatia (2012). Available online at http://cdn.intechopen.com/pdfs-wm/33645.pdf. Checked on 18 July 2016
Grande, J.: Arevo Labs announces Carbon Fiber and Nanotube-reinforced High Performance materials for 3D Printing Process (2014). Solvay. Available online at https://www.solvay.com/en/media/press_releases/20140324-Arevo.html
Grellmann, W., Seidler, S. (eds.): Polymer testing, 2nd edn. Hanser Publishers, Munich (2013)
Gurr, M., Mülhaupt, R.: 8.04 rapid prototyping. In: Hashmi, S., Batalha, G.F., van Tyne, C.J., Yilbas, B. (eds.) Comprehensive Materials Processing, pp. 77–99. Elsevier, Oxford (2014)
Hämäläinen, J.: Semi-crystalline polyolefins in fused deposition modeling. Master’s Thesis. Tampere University of Technology, Tampere (2017)
He, J., Chen, J., Hellwich, K.-H., Hess, M., Horie, K., Jones, R.G., et al.: Abbreviations of polymer names and guidelines for abbreviating polymer names (IUPAC Recommendations 2014). Pure Appl. Chem. 86(6), 1003–1015 (2014). https://doi.org/10.1515/pac-2012-1203
Herz Austria GmbH (Ed.): Herz. Filamente (2019). Available online at https://www.herz-filament.at/de/. Updated on 6th of March 2019, checked on 6th of March 2019
Hutmacher, D.W., Schantz, T., Zein, I., Ng, K.W., Teoh, S.H., Tan, K.C.: Mechanical properties and cell cultural response of polycaprolactone scaffolds designed and fabricated via fused deposition modeling. J. Biomed. Mater. Res. 55(2), 203–216 (2001). https://doi.org/10.1002/1097-4636(200105)55:2<203::AID-JBM1007>3.3.CO;2-Z
Kaiser, W.: Kunststoffchemie für Ingenieure. Von der Synthese bis zur Anwendung. In: Kaiser, W. (ed.) Kunststoffchemie für Ingenieure. München: Carl Hanser Verlag GmbH & Co. KG, pp. I–XXXII (2015)
Kaveh, M., Badrossamay, M., Foroozmehr, E., Hemasian Etefagh, A.: Optimization of the printing parameters affecting dimensional accuracy and internal cavity for HIPS material used in fused deposition modeling processes. J. Mater. Process. Technol. 226, 280–286 (2015). https://doi.org/10.1016/j.jmatprotec.2015.07.012
Kukla, C., Duretek, I., Gonzalez-Gutierrez, J., Holzer, C.: Rheology of highly filled polymers. In: Rivera-Armenta, J.L., Cruz, B.A.S. (eds.) Polymer Rheology. InTech (2018). Available online at https://www.intechopen.com/books/polymer-rheology/rheology-of-highly-filled-polymers
Ligon, S.C., Liska, R., Stampfl, J., Gurr, M., Mülhaupt, R.: Polymers for 3D printing and customized additive manufacturing. Chem. Rev. 117(15), 10212–10290 (2017). https://doi.org/10.1021/acs.chemrev.7b00074
Mackay, M.E.: The importance of rheological behavior in the additive manufacturing technique material extrusion. J. Rheol. 62(6), 1549–1561 (2018). https://doi.org/10.1122/1.5037687
MANSYS: MANufacturing decision and supply chain management SYStem for additive manufacturing (2013–2016). Partners: TWI United Kingdom, MAT Belgium, LPW United Kingdom, BCT Germany, POL France, BER Netherlands, TNO Netherlands, AIMME Spain, SMITH & NEPHEW UK LIMITED, SN United Kingdom, WISILDENT SRL, WIS Italy, GE MARMARA TECHNOLOGY CENTER Turkey, TWO Italy
MatterHackers: 3D printer filament. Available online at https://www.matterhackers.com/store/3d-printer-filament?clk=bing. Checked on 27 July 2017
Meijer, H.E.H., Elemans, P.H.M.: The modeling of continuous mixers. Part I: The corotating twin-screw extruder. Polym. Eng. Sci. 28(5), 275–290 (1988). https://doi.org/10.1002/pen.760280504
Mezger, T.G.: The Rheology Handbook. For Users of Rotational and Oscillatory Rheometers, 2nd rev. ed. Vincentz Network (Coatings compendia), Hannover (2006)
Naranjo, A., Roldán-Alzate, A., Sierra, J., Osswald, T.: Plastics Testing and Characterization. Industrial Applications. Hanser, Munich (2008)
Ni, F., Wang, G., Zhao, H.: Fabrication of water-soluble poly(vinyl alcohol)-based composites with improved thermal behavior for potential three-dimensional printing application. J. Appl. Polym. Sci. 134(24) (2017). https://doi.org/10.1002/app.44966
Okamoto, M.: Polymer/Layered Silicate Nanocomposites. Rapra Technology Limited, Shawbury, UK (2003)
Parandoush, P., Lin, D.: A review on additive manufacturing of polymer-fiber composites. Compos. Struct. 182, 36–53 (2017). https://doi.org/10.1016/j.compstruct.2017.08.088
Peterson, G.I., Larsen, M.B., Ganter, M.A., Storti, D.W., Boydston, A.J.: 3D-printed mechanochromic materials. ACS Appl. Mater. Interfaces 7(1), 577–583 (2015). https://doi.org/10.1021/am506745m
Plott, J., Shih, A.: The extrusion-based additive manufacturing of moisture-cured silicone elastomer with minimal void for pneumatic actuators. Additive Manuf. 17, 1–14 (2017). https://doi.org/10.1016/j.addma.2017.06.009
RepAir project. Future RepAIR and Maintenance for Aerospace industry. (2013–2016). Partners: Boeing, Lufthansa Technik, Universidad de PaderBorn, APR, AIMME, Atos España, Avantys Engineering, Universidad de Cranfield, Danish Aerotech, Danish Teknologisk Institut, O’Gayar Consulting 2009 y SLM Solutions
Retsch GmbH: Cutting mills for pre-cutting and fine grinding (2020). Available online at https://www.retsch.com/products/milling/cutting-mills/. Checked on 25 March 2020
Schirmeister, C.G., Hees, T., Licht, E.H., Mülhaupt, R.: 3D printing of high density polyethylene by fused filament fabrication. Additive Manuf. 28, 152–159 (2019). https://doi.org/10.1016/j.addma.2019.05.003
Shih, C.-K., Wetzel, M.: Continuous process visualization. Visual observation, on-line monitoring, model-fluid extrusion and simulation. In: Manas-Zloczower, I. (ed.) Mixing and Compounding of Polymers, 2nd edn. Carl Hanser Verlag GmbH & Co. KG, Munich (2009)
Singamneni, S., Huang, B., Davidson, K.: Polystyrene in granular form for fused deposition modeling. In: Conference Proceedings of International Symposium on Flexible Automation, pp. 469–473 (2020). Available online at https://asmedigitalcollection.asme.org/ISFA/proceedings-abstract/ISFA2012/45110/469/267146. Checked on 25 March 2020
SKIN project: Improvement of the performance of processed materials with additive manufacturing through post-processes (2017–2018). AIDIMME
Spoerk, M., Arbeiter, F., Raguž, I., Holzer, C., Gonzalez-Gutierrez, J.: Mechanical recyclability of polypropylene composites produced by material extrusion-based additive manufacturing. Polymers 11(8) (2019). https://doi.org/10.3390/polym11081318.
Spoerk, M., Gonzalez-Gutierrez, J., Lichal, C., Cajner, H., Berger, G.R., Schuschnigg, S. et al.: Optimisation of the adhesion of polypropylene-based materials during extrusion-based additive manufacturing. Polymers 10(5) (2018a). https://doi.org/10.3390/polym10050490
Spoerk, M., Gonzalez-Gutierrez, J., Sapkota, J., Schuschnigg, S., Holzer, C.: Effect of the printing bed temperature on the adhesion of parts produced by fused filament fabrication. Plastics, Rubber Comp. 47(1), 17–24 (2018). https://doi.org/10.1080/14658011.2017.1399531
Spoerk, M., Holzer, C., Gonzalez-Gutierrez, J.: Material extrusion-based additive manufacturing of polypropylene: a review on how to improve dimensional inaccuracy and warpage. In J. Appl. Polym. Sci. 137(12), 48545 (2020). https://doi.org/10.1002/app.48545
Spoerk, M., Savandaiah, C., Arbeiter, F., Traxler, G., Cardon, L., Holzer, C., Sapkota, J.: Anisotropic properties of oriented short carbon fibre filled polypropylene parts fabricated by extrusion-based additive manufacturing. Compos. Part A Appl. Sci. Manuf. 113, 95–104 (2018). https://doi.org/10.1016/j.compositesa.2018.06.018
Stoof, D., Pickering, K.: 3D printing of natural fibre reinforced recycled polypropylene. In: Bickerton, S., Lin, R.J.-T., Somashekar, A.A., Singh, I., Srivatsan, T.S. (eds.) Processing and Fabrication of Advanced Materials—XXV. Processing and Fabrication of Advanced Materials—XXV. Auckland, New Zealand, 22–25 January 2017, pp. 668–691. University of Auckland (2017)
Stratasys Ltd: FDM thermoplastics. Find your FDM thermoplastic. Stratasys Ltd (2015). Available online at http://www.stratasys.com/materials/fdm. Checked on 27 July 2017
Tellis, B.C., Szivek, J.A.,; Bliss, C.L.,; Margolis, D.S., Vaidyanathan, R.K., Calvert, P.: Trabecular scaffolds created using micro CT guided fused deposition modeling. Mater. Sci. Eng. C, Mater. Biol. Appl. 28(1), 171–178. https://doi.org/10.1016/j.msec.2006.11.010
Teo, E.Y., Ong, S.-Y., Chong, M.S.K., Zhang, Z., Lu, J., Moochhala, S. et al.: Polycaprolactone-based fused deposition modeled mesh for delivery of antibacterial agents to infected wounds. Biomaterials 32(1), 279–287 (2011). https://doi.org/10.1016/j.biomaterials.2010.08.089
Tong, C., Kee-Hai, H., Swee-Hin, T.: Scaffold design and in vitro study of osteochondral coculture in a three-dimensional porous polycaprolactone scaffold fabricated by fused deposition modeling. Tissue Eng. 9, 103–112 (2003)
Tseng, J.-W., Liu, C.-Y., Yen, Y.-K., Belkner, J., Bremicker, T., Liu, B.H., et al.: Screw extrusion-based additive manufacturing of PEEK. Mater. Design 140, 209–221 (2018). https://doi.org/10.1016/j.matdes.2017.11.032
Valentan, B., Kadivnik, Z., Brajlih, T., Anderson, A., Drstvensek, I.: Processing Poly(ether etherketone) on a 3D printer for thermoplastic modelling. Mater. Tehnol. 47(6), 715–721 (2013)
Wales, J.L.S., den Otter, J.L., Janeschitz-Kriegl, H.: Comparison between slit viscometry and cylindrical capillary viscometry. Rheol. Acta 4(2), 146–152 (1965). https://doi.org/10.1007/BF01984712
Wohlers, T.T., Caffrey, T., Campbell, R.I.: Wohlers Report 2017. 3D Printing and Additive Manufacturing State of the Industry: Annual Worlwide Progress Report. Wohlers Associates, Fort Collins, Colorado (2017)
Xuan, Y., Tang, H., Wu, B., Ding, X., Lu, Z., Li, W., Xu, Z.: A specific groove design for individualized healing in a canine partial sternal defect model by a polycaprolactone/hydroxyapatite scaffold coated with bone marrow stromal cells. J. Biomed. Mater. Res. Part A 102(10), 3401–3408 (2014). https://doi.org/10.1002/jbm.a.35012
Zander, N.E., Gillan, M., Lambeth, R.H.: Recycled polyethylene terephthalate as a new FFF feedstock material. Additive Manuf. 21, 174–182 (2018). https://doi.org/10.1016/j.addma.2018.03.007
Zein, I., Hutmacher, D.W., Tan, K.C., Teoh, S.H.: Fused deposition modeling of novel scaffold architectures for tissue engineering applications. Biomaterials 23(4), 1169–1185 (2002). https://doi.org/10.1016/S0142-9612(01)00232-0
Zhansitov, A.A., Khashirova, S.Y., Slonov, A.L., Kurdanova, Z.I., Shabaev, A.S., Khashirov, A.A., Mikitaev, A.K.: Development of technology of polysulfone production for 3D printing. High Perform. Polym. 29(6), 724–729 (2017). https://doi.org/10.1177/0954008317704500
Author information
Authors and Affiliations
Corresponding author
Editor information
Editors and Affiliations
Rights and permissions
Open Access This chapter is licensed under the terms of the Creative Commons Attribution 4.0 International License (http://creativecommons.org/licenses/by/4.0/), which permits use, sharing, adaptation, distribution and reproduction in any medium or format, as long as you give appropriate credit to the original author(s) and the source, provide a link to the Creative Commons license and indicate if changes were made.
The images or other third party material in this chapter are included in the chapter's Creative Commons license, unless indicated otherwise in a credit line to the material. If material is not included in the chapter's Creative Commons license and your intended use is not permitted by statutory regulation or exceeds the permitted use, you will need to obtain permission directly from the copyright holder.
Copyright information
© 2022 The Author(s)
About this chapter

Cite this chapter
Ureña, J. et al. (2022). Development of Material and Processing Parameters for AM. In: Godec, D., Gonzalez-Gutierrez, J., Nordin, A., Pei, E., Ureña Alcázar, J. (eds) A Guide to Additive Manufacturing. Springer Tracts in Additive Manufacturing. Springer, Cham. https://doi.org/10.1007/978-3-031-05863-9_7
Download citation
DOI: https://doi.org/10.1007/978-3-031-05863-9_7
Published:
Publisher Name: Springer, Cham
Print ISBN: 978-3-031-05862-2
Online ISBN: 978-3-031-05863-9
eBook Packages: EngineeringEngineering (R0)