
Abstract
This chapter addresses gaps in the age-structural theory of state behaviour, specifically as it pertains to the statistical expectation that states with a youthful population age structure (a median age 25.5 years or less) are the most vulnerable to intrastate conflict. The authors test variations of this expectation by employing logistic regression to generate two sets of two-dimensional logistic probability functions: one set representing the probability (on the y-axis) of experiencing a non-territorial (revolutionary) conflict in the next five years, over the course of the age-structural transition (on the x-axis, measured in median age), the other doing the same for territorial (separatist) conflicts. The results disclose that: (1) whereas statistical vulnerability to both types of intrastate conflict is highest in the youthful phase, the declining pattern of vulnerability to non-territorial (revolutionary) conflict is statistically much more sensitive to a state’s advancement through the age-structural transition than the pattern of territorial (separatist) conflicts; and (2) whereas, when submitted to testing on in-sample and out-of-sample data, the pattern of non-territorial (revolutionary) conflicts appears wholly consistent with theoretical expectations, this is not entirely the case for territorial (separatist) conflicts.
You have full access to this open access chapter, Download chapter PDF
1 Introduction
Concerns focused on the political instability of states with persistent high fertility and large cohorts of young adults—what some have called a “youth bulge” (e.g. Urdal, 2006; Weber, 2018)—are really nothing new. Inspired by the theorizations of Coale and Hoover (1958), Herbert Möller (1968–1969) convincingly argued that the unprecedented surge of young men into Europe’s rapidly growing population during the mid-nineteenth century contributed to the ease of recruitment, the rise of militarism and the high frequency of political rebellion and war on the continent. Möller’s theorization laid the foundations for later historical research on fertility and age structure’s role in rebellions during the early modern era (Goldstone, 1991), and for more recent efforts to strengthen the conceptual and statistical understanding of vulnerabilities to intrastate conflict that are associated with a state’s position in the age-structural transition.Footnote 1
The objective of the following article is to address two research questions that recognize inconsistencies and gaps in the current theory:
- Q1::
-
Does the youth bulge model apply equally to both non-territorial intrastate conflicts (revolutions) and territorial conflicts (separatist conflicts)?
- Q2::
-
Does a state’s recent conflict history differentially affect the risk of intrastate conflict in various parts of the age-structural transition?
The first research question (Q1) reflects the results of a recent study by Yair and Miodownik (2016). They conclude that the presence of a relatively large country-level youth bulgeFootnote 2 statistically explains the onset of recent non-ethnic armed conflict. However, they find that this measure fails to explain the onset of ethnic conflict . Moreover, observational evidence appears to support their findings. Examples of ethnic separatist conflicts emerging in non-youthful states abound. These include armed separatist conflicts in eastern Ukraine , in Russia’s Caucasus region, in the Armenian enclave of Nagorno-Karabakh in Azerbaijan, in Thailand’s Pattani Muslim region and in Bosnia in the 1990s. In each case, deep ethnic and religious cleavages and a resilient minority identity remain tightly coupled to unresolved ethnic grievances and incompatibilities, despite the advancement of the country-level age structure and the economic and social development that typically accompanies this demographic shift.
The latter research question (Q2) relates to the observation that most revolutions (non-territorial conflicts) arising in states with mature populations are brief, as opposed to those among youthful states, which tend to persist or frequently re-emerge. For example, the decline of the Soviet Union precipitated two non-territorial revolts in two non-youthful states, both lasting under two weeks and both enduring a significant number of battle-related deaths: a successful revolution in Romania, in December of 1989, and, in late September and early October of 1993, a decisive showdown over constitutional powers in Russia. In July 2016, armed violence associated with an attempted coup in Turkey ended in just two days. While politically pivotal events in terms of their duration, they contrast sharply with the numerous decades-long revolts that sub-Saharan states have recently endured, or with the 4 or 5 that have dragged on in Latin America through much of the latter part of the twentieth century (UCDP/PRIO, 2018). Nonetheless, analysts have yet to determine whether variation in age structure statistically affects the duration of revolutionary conflict—a dynamic that is every bit as critical to diplomatic and defence policymakers as the risk of its onset.
The research described in this chapter revises the youth bulge hypothesis by disaggregating cases by conflict type and by recent conflict history. The methodology employed is age-structural modelling (Cincotta, 2012, 2017), an application of logistic regression analysis structured to generate readily interpretable, repeatable and testable two-dimensional probability functions in the age-structural domain, M, an x-axis representing the path of the age-structural transition. We check the validity of these models by testing extended models, which feature independent variables that are hypothetical competitors of median age. We also present panel models that include country and year-fixed effects to explore the issue of unobserved heterogeneity. Finally, we use the (United States) National Intelligence Council’s (NIC) four-phase system to determine if the patterns expected by hypotheses that are posed in this study are visually apparent in the observed data, both within the sample (1975–2010) and beyond the sample (2011–present) (NIC, 2012).
The chapter’s analysis indicates that a youthful country-level age structure is indicative of an elevated risk of onset and a high risk of an intermittent or persistent revolutionary conflict, which is defined as a non-territorial intrastate conflict in the UCDP/PRIO Armed Conflict Data Set (2018) (UCDP/PRIO-ACDS) where the ultimate objective of opposition forces is to alter the political form of the central government or to replace or modify its regime. Movement out of the youthful portion of the age-structural transition turns out to be an excellent predictor of a decline in the risk of a future revolution. A simple model of this dynamic forecasts a very slow, erratic decline in the five-year count of states in revolutionary conflict, from now until 2040.
Our analyses also indicated that a statistically significant decline related to the country-level age structure can be expected for separatist conflicts defined as an intrastate conflict in which the armed opposition aims to alter the political status of a territory (i.e. a territorial conflict, as disaggregated by UCDP/PRIO’s data). However, the statistical risk gradients of models of this type of conflict are very shallow, suggesting that measures of country-level age structure are typically poor predictors of separatist conflict onset or termination. This analysis suggests that armed separatist conflict has a much higher probability of persisting or re-emerging, despite the majority’s progress through the age-structural transition. Thus, we see no way to confidently predict trends in separatist conflict using population age structure. However, we note that the trend in the number of states engaged in separatist conflict has been on the rise since 2014.
2 Theory
Theoretical expectations that relate human population age structure to the risk of various forms of conflict are part of a larger body of theory referred to as the age-structural theory of state behaviour (Cincotta, 2017). According to this theory, the probabilities of realizing certain social, economic and political conditions shift as the population moves through the age-structural transition.
This article employs a discrete four-phase classification system, developed from a schema conceived by Malmberg and Lindh (2006: 68). Each of the four phases is defined in terms of country-level median age, a scalar measure used by population biologists and demographers to crudely characterize and compare the age distributions of populations. This system is based on country-level median age, m (the age of the person for whom 50% of the population is younger). The system divides the transition into four discrete phases: youthful (m ≤ 25.5 years), intermediate (25.6 ≤ m ≤ 35.5 years), mature (35.6 ≤ m ≤ 45.5 years) and post-mature (m ≥ 45.6 years).
2.1 The Youth Bulge Hypothesis
Put simply, proponents of the youth bulge hypothesis postulate that states with populations where there are large proportions of young adults in the adult population—i.e. states in the youthful phase of the age-structural transition—are expected to face an elevated risk of political violence and intrastate conflict, whether perpetrated by non-state or state actors (Urdal, 2006; Mesquida & Weiner, 1999). States that experience sustained declines in fertility and enter the transition’s intermediate phase are expected to face substantially reduced risks of conflict. In recent history, states that have ultimately entered the intermediate phase, have first dropped below a total fertility rate (TFR) of about 2.8 children per woman (Cincotta, 2017).
Since its earliest elaboration (Möller, 1968–1969), proponents of the youth bulge hypothesis have focused on the ease of mobilizing idealistic, risk-taking young-adult males where alternative options for economic and social mobility are perceived as limited (Goldstone, 1991; Fuller & Pitts, 1990; Huntington, 1997).Footnote 3 Generally, the hypothesis has been coupled to the recognition that states with the pyramid-shaped age structures , which is characteristic of a youthful population (e.g. Nigeria’s age structure, depicted in Fig. 1), face upward pressures on demand for health care, education , jobs and basic infrastructure, but typically demonstrate low levels of state capacity and political stability. Due to these characteristics, youth bulge countries are often expected to experience relatively high rates of out-migration (Weiner & Teitelbaum , 2001: 17–21).

Population pyramids . Examples of the (U.S.) NIC’s four age-structural phases (NIC, 2017). The data represent the proportions of five-year groups (males on the left, females on the right) in the total population and are projections drawn from the United Nations Department of Social Affairs, Population Division, 2017; hereafter cited as UNPD, 2017; medium fertility variant for the year 2025. The four phases are (from left to right): youthful [YTH] (Nigeria); intermediate [INT] (Morocco); mature [MAT] (USA); and post-mature [PMT] (Japan)
2.2 Hypotheses
The study tests six hypotheses: three concerning revolutionary conflicts and three concerning separatist conflicts. Each hypothesis is a statistical expectation of a trend in the five-year probability of a state being in conflict (either revolutionary or separatist) over the length of the age-structural domain, M, measured in median age. To limit the spikes and troughs that are characteristics of the annual count of states in intrastate conflict, the five-year count is used to predict the risk of intrastate conflict.
For revolutionary conflict:
- H1::
-
The five-year risk of revolutionary conflict declines among states that have not recently experienced revolutionary conflict as their median age increases (i.e., as the age structure matures and the youth bulge dissipates).
- H2::
-
The five-year risk of revolutionary conflict will be greater among states that have recently experienced revolutionary conflict.
- H3::
-
Despite a recent history of persistent revolutionary conflict, the five-year risk of revolutionary conflict will decline as median age increases.
For separatist conflicts:
- H4::
-
The five-year risk of a territorial conflict declines among states that have not recently experienced territorial conflict as their median age increases.
- H5::
-
The five-year risk of territorial conflict will be greater among states that have recently experienced territorial conflict.
- H6::
-
Despite a recent history of persistent territorial conflict, the five-year risk of territorial conflict will decline as median age increases.
3 Methods
Age-structural modelling repositions state behaviours—i.e. categorical political, social and economic conditions—that occur over the course of chronological time, T, onto M, a domain that represents the path of the age-structural transition (Cincotta, 2012, 2017). Rather than attempt to discern causality, the methodology’s objective is to generate a set of readily interpretable two-dimensional graphic models that portray the probability of observing a discrete category of social, economic or political behaviour, π, among states across a range of median ages, m, that span the age-structural transition. These graphs are designed to visually provide analysts with expectations that help to: (a) improve their current assessments; (b) identify unexpected behaviours; and (c) statistically anticipate the future. Their use by analysts provides a continuous test of the age-structural models from which these expectations were generated.
Age-structural modelling employs logistic regression analysis to statistically transform a set of dichotomous observations made among states, to a simple logistic function, π(m), in the age-structural domain, M. For each state, each yearly datum includes:
-
the dichotomous observation of an outcome variable, π, which records the absence (0) or presence of a categorical condition (1);
-
the quantitative observation of the domain variable, m, which is measured in years of median age;
-
dichotomous observations of independent control variables, Ci, Ci+1, …, Cj, which set apart the effects of exogenous factors that are known (from previous studies) to statistically explain the outcomes of exceptional cases; and
-
dichotomous observations of experimental variables, Ej, Ej+1, …, En, which are hypothesized to statistically explain differences in outcomes.
For age-structural models, the estimated logit,\( g\left( \varvec{m} \right) \) is represented as:
when fit by iteration to the set of dichotomous observations of states, the logistic regression algorithm yields a dependent variable, π(m), read on the vertical axis as the likelihood of observing the discrete categorical outcome in the age-structural domain.

The plotted cumulative proportion (points) and smoothed cumulative distribution function (CDF) are shown for the underage-five mortality rate of less than 25.0 deaths per 1,000 live births. The CDF, π(m), was estimated using logistic regression. Its first derivative, π′(m), is expected to peak at π(m) = 0.50(Max). E marks early attainers, and L marks late holdouts (also see online Appendix A.3.2)
The categorical outcome of the model (referred to as the outcome variable) can be either a discrete condition (e.g. a country that will experience a revolutionary conflict during next five calendar years) or a discretely bounded category within the transition of a continuous indicator (e.g. less than 25.0 childhood deaths per 1,000 live births).
Besides computing the fitted parameter values and their standard errors, commercial software typically computes the probability function, π(m)—in this research, referred to as the age-structural function—and its upper and lower 0.95 confidence intervals. To communicate the probability of a state being a member of this category over the length of the age-structural domain, M, the corresponding probability function is plotted over the present range of country-level median ages (currently a median age of 15.0–47.0 years, although M extends to 55.0 years).
In addition to a (pooled) logistic regression, we also present panel models including country- and year-fixed effects. Usually one of the most important questions in cross-country comparative research is the issue of unobserved heterogeneity. Countries differ with regard to a large number of socio-economic, demographic, political, historical, cultural and other factors, and many of these potential explanatory variables are often highly co-linear (e.g. see Schrodt, 2014). This makes it difficult to attribute differences in the risk of violent conflict between countries to specific independent variables. A popular approach to remedy this issue is the within-transformation, most often referred to as the fixed-effects estimator in econometric terminology. Rather than looking at differences between countries, a fixed-effects approach examines differences within each country over time. For our application, the crucial question is whether a country’s risk of experiencing violent conflict decreases during times when median age is below the long-term average value of the same country.
With a binary outcome, including fixed effects into panel regression models becomes less trivial but feasible. We estimate the conditional logit model discussed in Allison (2009) and implemented in the survival package (Therneau, 2015) in R (R Core Team, 2019). We replicated the results using the binary fixed effects (bife) package (Stammann et al., 2016) which applies an analytical bias correction to an unconditional logit model. Since the results are virtually identical, we only report the findings from conditional logit models (Tables 1 and 2).
3.1 The Sample
As a matter of consistent practice, the list of recognized independent political entities is drawn from the United Nations (UN). From this list, two types of entities were eliminated from the analysis: (1) non-independent political entities (e.g. Palestine, Western Sahara) whose state behaviour may be constrained or induced by an occupying power; and (2) independent states with a population under 500,000 (including Belize, Iceland, Brunei and numerous small island states).
A substantial number of states have entered the active data set between 1975 and 2010. These include several states, which became part of the data pool the year that they surpassed a population of 500,000 (e.g. Bhutan, Cape Verde, Djibouti, Equatorial Guinea, Solomon Islands) and a large group of newly independent states (e.g. Eritrea, former Soviet republics, former Yugoslav republics, Slovak Republic, South Sudan, Timor-Leste). Thus, the annual active data set has grown from 136 states in 1975 to 166 in 2018.
The use of states as the unit of analysis has several analytical limitations. The country-level median age may obfuscate the presence of significantly populous minorities who display demographic dynamics differing substantially from the majority. Even when the country-level age structure has matured, minority-majority demographic differences can be associated with ethnic tensions (Leuprecht 2010; Cincotta, 2011).
3.2 Temporal Extent of Data
The age-structural models generated in this research are built upon data assembled from international agency sources and drawn from a period beginning in 1975, or when first available after 1975, and ending in 2010. This selection of 35 years corresponds to a period after the dissolution of the remaining European overseas empires (British, French, Dutch, Belgian and Portuguese) and begins after the year that Freedom House first made its annual assessment of civil liberties and political rights (1972). This end date (2010) provides several decades of data, yet it leaves a period—2011 to the present—for out-of-sample model testing.
3.3 Outcome Variables
-
The future five-year risk of revolutionary conflict. Dichotomous: 1 = one or more years during which a revolutionary conflict is noted in the next five years; 0 = no revolutionary conflicts during the next five years. Data source: UCDP/PRIO Armed Conflict Data Set, Version 18.1.
-
The future five-year risk of separatist conflict. Dichotomous: 1 = at least one separatist conflict in the next five years; 0 = no separatist conflicts during the next five years. Data source: UCDP/PRIO Armed Conflict Data Set, Version 18.1.
3.4 Independent Variables
-
Median age. Continuous domain variable: indicator is the age of the median of the country-level population, measured in years. Source: UNPD (2017).Footnote 4,Footnote 5
-
Small population states. Dichotomous control variable: 1 = a state with a population less than 5.0 million and petroleum and/or mineral revenues comprising less than 15.0% of GDP (i.e. not a resource-reliant state); 0 = a state with a population equal to or greater than 5.0 million, or any state that qualifies as resource reliant. Source: UNPD (2017).
-
Resource-reliant states. Dichotomous control variable: 1 = a state with petroleum and/or mineral revenues that are equal to or greater than 15.0% of GDP; 0 = a state with petroleum and/or mineral revenues less than 15.0% of GDP. Source: World Development Indicators Data Base, World Bank Group (2017).
-
Conflict absence. Dichotomous experimental variable: 1 = cases in which there have been zero (0) conflict years of the same type of conflict (revolutionary or separatist) during the prior four-year period (revolutionary conflicts in this category are noted on graphs as RAbs; separatist conflict, SAbs); 0 = all other conflict histories. Source: UCDP/PRIO (2018).
-
Conflict intermittence. Dichotomous experimental variable: 1 = cases in which there have been 1 or 2 conflict years during the prior four-year period (graphed as RImt, SImt); 0 = all other conflict histories. Source: UCDP/PRIO (2018).
-
Conflict persistence. Dichotomous experimental variable: 1 = cases in which there have been 3 or 4 conflict years during the prior four-year period (graphed as RPer, SPer); 0 = all other conflict histories. Source: UCDP/PRIO (2018).
3.5 Age-Structural Models Versus Extended Models
In the fixed effects analysis, the age-structural form (where median age is the only continuous independent variable) was expanded to include other continuous and dichotomous independent variables that represent competing hypotheses. In this research, four competing variables—per capita income, educational attainment, anocracy and ethnolinguistic heterogeneity (each discussed below)—were added to the age-structural model to generate a set of expanded models.
3.6 Alternative Independent Variables
-
Per capita income. Continuous variable: Log10 transform of GDP per capita, in 2010 US$. Source: World Bank’s World Development indicators, World Bank (2017).
-
Late-secondary attainment, 20–29 years of age. Continuous variable: the proportion of the population from ages 20–29 years, male and female combined, who have attained late-secondary school levels or higher. Source: Wittgenstein Center, Lutz et al. (2011).
-
Anocracy. Dichotomous variable: Partly Free Status in Freedom House’s annual survey of political rights and civil liberties. Source: Freedom House (2018).
-
Ethnolinguistic heterogeneity. Continuous variable: Index of ethnolinguistic fractionalization, ELF(1), indicating heterogeneity in terms of major world linguistic groups. Source: Desmet et al. (2011).
4 Results
Notably, median age was determined to be highly significant in all fixed effects models of revolutionary conflict (RAbs, RImt, RPer) and separatist conflict (SAbs, SImt, SPer), as were each of the dichotomous conflict history variables (absence, intermittence and persistence) in each model (Tables 1 and 2). Other general findings include:
-
In pooled models, states with small populations (less than 5.0 million) yielded significant coefficients indicating a reduced risk of intrastate conflict when compared to more populous states.
-
In pooled models, both resource-reliant states (oil + mineral rents >15% of GDP) and ethnolinguistically fractionated states, as a group, were statistically different from other states for both revolutionary conflict (RAbs, RImt, RPer) and separatist conflict (SAbs, SImt, SPer), suggesting an elevated five-year risk of intrastate conflict across the age-structural transition.
-
In the fixed effects conditional logit models of revolutionary conflict (see Table 1), GDP per capita and late secondary educational attainment were found to be statistically significant. Their net effect was to drive down the five-year risk of revolutionary conflict. Elevated levels of GDP per capita apparently tended to slightly increase the five-year risk of revolutionary conflict across the age-structural transition, while elevated levels of late secondary attainment tended to decrease that risk. Anocracy, which political analysts often assume to be a conflict-risk factor, had no apparent statistical effect.
-
In the fixed effects conditional logit models of separatist conflict (see Table 2), GDP per capita was found to be statistically significant. Its net effect was to drive down vulnerability to revolutionary conflict. Apparently, elevated levels of income tended to increase the five-year risk of conflict across the age-structural transition. However, among fixed effects models, neither late secondary attainment nor anocracy were significant.
4.1 Age-Structural Models: Revolutionary Conflict Hypotheses
- H1::
-
As median age increases, the risk of experiencing an onset of revolutionary conflict declines among states that have not recently experienced revolutionary conflict.
Failed to reject H1.
Rationale. In the revolutionary conflict absence model (Table 1, RAbs), the coefficient for median age is negative and highly significant, indicating a decline in risk as states advance through the age-structural transition. Moreover, the model’s functional form (and ±0.95 confidence intervals), graphed in the age-structural domain (Fig. 2), indicates that the probability of revolutionary conflict in the next five years, while relatively low (roughly one-fifth of risk associated with states with recent conflict) is highest among states that chronically experience the most youthful age structures (m < 20.0 years).

The functional forms and 0.95 confidence intervals for three mutually exclusive categories of 4-year conflict history: RAbs (0 conflict years over the past 4 most recent years), RImt (1 or 2 conflict years) and RPer (3 or 4 conflict years). Youthful (YTH), intermediate (INT) and mature (MAT) phases of the age-structural transition are shown above the graph. Data are from non-territorial conflicts, 1972–2010 (UCDP/PRIO, 2018)
- H2::
-
The risk of revolutionary conflict will be greater among states that have recently experienced a revolutionary conflict.
Failed to reject H2.
- H3::
-
Despite a recent history of persistent revolutionary conflict, the five-year risk of revolutionary conflict will decline as median age increases.
Failed to reject H3.
Rationale. The coefficients and functional forms of the series of revolutionary conflict history models indicate that both conflict intermittence (RImt) and conflict persistence histories (RPer) carry very high risks of future revolutionary conflict (at m = 15 years, p > 0.85 and p > 0.95, respectively). Nonetheless, these models’ functional forms (Fig. 2) display a tendency for risks to decline as states advance through the intermediate phase of the age-structural transition (Fig. 2).
4.2 Age-Structural Models: Separatist Conflict Hypotheses
- H4::
-
As median age increases, the five-year risk of experiencing an onset of separatist conflict will decline among states that have not recently experienced separatist conflict.
The results of tests of H4 were ambiguous. Both the pooled and fixed-effects models indicate that an onset of separatist conflict is statistically more likely to occur at the youthful phase than at the mature phase of the age-structural transition. However, median age is a poor competitor in extended models and, in non-statistical tests using the four-phase age-structural system, it is an inconsistent predictor.
Rationale. Whereas the coefficient values in the separatist conflict absence (Sabs) model (Table A.3.2, SAbs) are negative and statistically significant, its coefficient is small and its functional form (Fig. 3, SAbs) is nearly flat—i.e. the risk of an onset of separatist conflict is spread almost evenly across the age-structural domain (Fig. 3). The small margin—for states at a median age of 15.0 years, a five-year risk of only one in fifteen (p < 0.07)—offers very little information to foreign affairs analysts or policymakers who might seek guidance from this theory.

The functional forms and 0.95 confidence intervals for three mutually exclusive categories of 4-year conflict history: SAbs (0 conflict years over the past 4 most recent years), SImt (1 or 2 conflict years) and SPer (3 or 4 conflict years). Youthful (YTH), intermediate (INT) and mature (MAT) phases of the age-structural transition are shown above the graph. Data are from territorial conflicts, 1972–2010 (UCDP/PRIO, 2018)
In the extended onset model, each of the hypothetical alternatives is statistically significant (Table A.3.2, S-Onset-X). Moreover, this competition reverses the sign of the coefficient of median age and vastly reduces its contribution to the model (p = 0.16).
- H5::
-
The five-year risk of separatist conflict will be greater among states that have recently experienced separatist conflict.
Failed to reject H5.
- H6::
-
Despite a recent history of persistent separatist conflict, the five-year risk of separatist conflict will decline as median age increases.
Similar to tests of H4, tests of H6 produce ambiguous results. Both the pooled and fixed-effects models indicate that an onset of separatist conflict is statistically more likely to occur at the youthful phase than at the mature phase of the age-structural transition. However, median age is a poor competitor in extended models and, in non-statistical tests using the four-phase age-structural system, it is an inconsistent predictor.
Rationale. For separatist conflicts, re-emergence and persistence are the most powerful drivers of future risks of separatist conflict. Unlike the functional form representing persistent revolutionary conflict, age-structural maturation appears to have very modest effects on states with persistent separatist conflict (Fig. 3, SPer). Thus, the risk of persistence of an ongoing separatist conflict remains high, even as the state-level age structure traverses the intermediate phase and enters the mature transitional phase. Nonetheless, there is some suggestion (SImt) that, as age structure matures, future risks of re-emergence could slowly dissipate among some weakened separatist conflicts.
4.3 Models with Fixed Effects
Tables 1 and 2 present the results from panel models including country- and year-fixed effects. Model 1 is a pooled logistic model replicating the results from the previous between-country regressions. From Model 2 on, fixed effects are included and the interpretation changes to a within-country comparison. Time-constant variables such as ethnolinguistic heterogeneity or the oil dummy are dropped from these models since only time-varying variables can affect the outcome within a specific country. Model 2 shows a model with only median age and fixed effects as a benchmark and the subsequent models add controls and rivalling explanatory variables, mirroring the previous setup.
The intriguing finding here is that median age is a robust and statistically significant predictor of lower risks of both revolutionary conflict (Table 1) as well as separatist conflict (Table 2). This means that as countries become more mature in their age structure, their risks of violent internal conflict usually decline. This finding holds when we control for past conflict, per capita income, educational attainment and regime type. Among the latter variables increases in late-secondary education lower the risks of revolutionary conflict, while the effects on separatist conflict are weaker and not statistically significant. Per capita income has positive effects on both outcome variables which is a marked difference to the pooled model. This means that increases in economic development are usually followed by an increased, rather than decreased, risk of violent conflict if other factors such as age structure and education are held constant.
Note that the interpretation of the within-country (fixed effects) models is slightly different from the between-country (pooled) models. Both models have their strengths in different domains. With the fixed-effects model, a stronger causal claim can be made for the effect of the independent variable of interest. The absolute values of median age are no longer important; rather, the change within a specific country over time is what affects the change in the risk of violent conflict. We observe that as countries progress through the demographic transition and median age increases, the risks of both separatist and revolutionary conflict usually decrease for the very same countries. By contrast, the pooled logistic model can more easily be used for pragmatic out-of-sample predictions which are less straightforward with the conditional logit model. These predictions can tell analysts what will likely happen if countries enter new, previously unseen stages within the demographic transition from the lessons we have learned from other countries (i.e. a between-country comparison). There is some uncertainty with regard to unobserved heterogeneity, i.e. countries that are projected to have a mature age structure by 2050 might differ from countries that currently have a high median age with regard to factors that are not in the model which might influence the risk of future conflict. But from what we know about the mechanisms today, these predictions are the “best guess” for the future.
5 Looking Back: A Discrete Test of the Models
In this section, the basic expectations of the revolutionary and separatist age-structural models are summarized and then compared to age-structural trends in conflict observed across seven five-year periods, from 1976–1980 to 2011–2015 (the 2011–2015 period provides an out-of-sample test). The observed conflict trends are produced by disaggregating states into the NIC’s (2017) discrete age-structural categories (Fig. 4)—youthful (Y), intermediate (I) and mature (M)—based on their median age (because only a few states have recently entered the post-mature category, mature and post-mature are aggregated). Because of the consistent statistical significance of small population size (states with less than 5.0 million population), a category was created for small youthful states (Y*).

The proportion of states engaged in (a) revolutionary conflict and (b) separatist conflict in each of four age-structural categories. Conflicts are grouped in five-year periods from 1976–1980 to 2011–2015. Categories are based on median age: youthful (m ≤ 25.5 years); intermediate (25.6 ≤ m ≤ 35.5 years); and mature (35.6 ≤ m ≤ 45.5 years). Whereas states with youthful populations under 5 million residents experienced intrastate conflicts (second category), conflicts among similarly small states with intermediate and mature populations have been extremely rare. Data are drawn from the UCDP/PRIO Armed Conflict Data Set (UCDP/PRIO, 2018) and UN Population Division estimates (UNPD, 2017)
5.1 Revolutionary Conflict
Based upon the conflict history models of revolutionary conflict (RAbs, RImt, RPer), analysts should expect:
-
youthful states to be the most vulnerable to the onset of revolutionary conflict, as well as to its persistence—substantially more likely than states in the intermediate or mature age-structural categories.
-
youthful states with small populations (less than 5.0 million) to be less likely to experience revolutionary conflict than youthful states with larger populations.
-
states with a mature population only rarely experience a revolutionary conflict, which would be unlikely to persist.
The observed age-structural pattern of revolutionary conflict (Fig. 4a) is generally consistent with the expectations generated by the conflict history models (RAbs, RImt, RPer). Close inspection of the data indicates that the peak in the five-year count of states in revolutionary conflict in the 1991–1995 period was preceded by a decade of relatively large numbers of youthful states (15–18) engaged in persistent revolutionary conflict (i.e. conflict in three or four of the past four years).
This early 1990s peak was the product of coinciding peaks in persistent revolutionary conflict in southern and eastern Africa, as well as in Latin America, plus relatively large numbers onsets and intermittent revolutionary conflicts (5–8). By the 1996–2000 period, the prevalence of revolutionary conflicts in Latin America had dropped precipitously.
5.2 Separatist Conflict
Based on functional outcomes of the conflict history models of separatist conflict (Fig. 3, SAbs, SImt, SPer), analysts should expect:
-
a weak age-structural pattern disrupted by patterns driven by conflict persistence and re-emergence.
-
states with small populations (less than 5.0 million) to be less likely to experience separatist conflict than states with larger populations.
-
modest declines among mature states that have experienced persistent separatist conflict.
The observed age-structural pattern of separatist conflict (Fig. 4b) was generally consistent with expectations derived from the separatist models (SAbs, SImt, SPer). Whereas a defined age-structural pattern among separatist conflicts held up through much of the Cold War, the pattern broke down in the 1996–2000 period and is no longer apparent. Without strong age-structural patterns in the onset and persistence of separatist conflict, and the propensity of this type of conflict to re-emerge regardless of age structure, forecasting separatist conflicts using age-structural methods seems inappropriate.
Until the 2011–2015 period, the five-year count of countries in revolutionary conflict was consistently about 50% higher than separatist conflict (there are states in which both types have occurred in a year). The most recent data (UCDP/PRIO, 2018) indicate that the number of countries in separatist conflict is nearly equal to the number with revolutionary conflict—a reversal generated by onset in some youthful states, and the persistence and re-emergence of separatist conflicts in states in the intermediate phase of the age-structural transition.
6 Looking Forward: A Forecast of Trends in Revolutionary Conflict
Whereas the previously present conflict history models of revolutionary conflict (RAbs, RImt, RPer) provide numerous insights, their dependence on recent conflict histories—details that they are unable to generate (as in a simulation) and then use to calculate future risks—makes these models unsuitable for forecasting. In the following section, forecasts of RT, the global five-year count of states experiencing at least one year of revolutionary conflict during that period, are generated using a linear model:
where Y, I, M and P represent counts of states, all with populations greater than 5.0 million, in the youthful, intermediate, mature and post-mature age-structural phases, respectively.Footnote 6 Y* is the count of least populous states in the youthful phase, each with a population under 5.0 million. There is no corresponding term in this relationship for the least populous states in more mature phases (since 1972, no state in a more mature phase, with a population under 5.0 million, has experienced a revolutionary conflict).
In this model, each categorical count is multiplied by an estimate (ak) of the proportion of states in revolutionary conflict, a, in each age-structural category, k, over a five-year period. In the middle forecast, ak, is the categorical mean of 5 five-year post-Cold War periods, from 1991–1995 to 2011–2015. The categorical mean plus one standard deviation is used to generate the forecast’s upper bound; the categorical mean minus one standard deviation marks its lower bound (Table 3).
The forecast of revolutionary conflict begins in the ongoing five-year period, 2016–2020, and ends in 2036–2040. In the latter period, it suggests a global count between 13 and 22 revolutionary conflicts, down from 28 in the 2011–2015 period. This slow downward trending forecast (Fig. 5)—a speculative departure from the slightly upward trend in revolutionary conflict since 2010—appears superficially similar to the forecast made from a detailed model of all intrastate conflicts by Hegre et al. (2013). However, these two forecasts are not comparable. Because we find that separatist conflicts are largely unresponsive to changes in country-level median age, separatist (territorial) conflicts have been omitted from our forecast.
Despite its simplicity, this model is quite robust. When applied to the in-sample period from 1976 to 2010, the model does well at tracking the conflict trendline. Its upper and lower estimates completely envelope all recorded 5-year estimates of the number of states in conflict, even rising and falling with the peak in revolutionary conflicts, which was recorded in the early 1990s (see observed peak in Table 4, Fig. 5)—a feat that other models have been unable to perform.
This model provides reasonable regional expectations (Table 4). However, the observed five-year count of states in revolutionary conflicts has generally exceeded the model’s expected count in the three most youthful regions: (1) West and Central Africa; (2) East and Southern Africa; and (3) the Middle East, North Africa and Central Asia Region. Observed counts have generally been slightly lower than expected in the three remaining regions: (1) Europe; (2) North and South America; and (3) the East Asia, India and Pacific Region.
How is the forecast holding up? The most recent UCDP/PRIO (2018) data show that 25 states have already experienced a revolutionary conflict during the 2016–2017 period, which is within the forecast’s lower (18) and upper (30) bounds for the 2016–2020 period. The same data set records 24 states engaged in separatist conflict during the 2016–2017 period.
7 Conclusions
The leading story of this chapter concerns the limited duration of revolutionary conflicts; but not their duration in years of chronological time, as political scientists would naturally assume. Instead, revolutionary conflicts do not persist across the age-structural transition. Analysts should expect revolutions to be settled, fade, or of short duration after states enter the intermediate phase of this transition. Advances in country-level median age—particularly beyond the median age of 30 years—tend to dampen the statistical risk of a revolution.
Our conclusions concerning separatist conflict are more tenuous. Separatist conflicts appear somewhat more likely to occur in the more youthful phase of the age-structural transition—however, an onset is relatively rare. However, once a separatist conflict has begun, it can persist or re-appear intermittently, even as the country-level median age advances into the intermediate and mature phases of the age-structural transition. For example, ethnic conflicts in Myanmar (intermediate phase), the Ukraine (mature phase) and Azerbaijan (mature phase) have erupted periodically, despite the age-structural maturity of these states.
Notably, separatist conflicts in the youthful phase dominated those in more mature phases of the age-structural transition until the late 1990s. Since then, separatist conflicts have been just as prevalent or more prevalent among states in the intermediate phase of the transition, as they have in the youthful phase (Fig. 4b). Whereas the ratio of countries experiencing revolutionary conflict to those experiencing separatist conflicts remained around 2–1 since the early 1980s, that ratio has been close to 1 since 2015 (UCDP/PRIO, 2018).
When disaggregated by conflict type and conflict history, a stronger, sturdier model of the relationship emerges between states with youthful populations and the onset and persistence of revolutionary conflict. Several means of testing—i.e. using statistically generated age-structural functions (Fig. 2), empirical patterns generated by discretely categorized conflict data (Fig. 4a), and testing against hypothetical alternatives in an extended model (see Table A.3.1)—provide evidence that the five-year risk of an onset of revolutionary conflict remains elevated in the youthful phase of the age-structural transition (i.e. states with a youth bulge). And, this evidence indicates that this measure of risk to the onset of revolutionary conflict declines as these states approach, and traverse, the intermediate phase of the age-structural transition—a window on the age-structural domain that is associated with the growth of institutional capacity and political development (Cincotta & Madsen, 2017; Cincotta, 2017).
More importantly, the study provides evidence that persistent and intermittent revolutionary conflicts are likely to fade if and when states head deeply into the intermediate phase of the age-structural transition—much in the way that Colombia’s long-running Marxist insurgencies appear to be nearing a close. Moreover, where revolutionary conflicts have arisen in intermediate and mature states, they have typically been relatively brief (in chronological time). Examples are the recent revolt of a military faction in Turkey (in 2016), and insurrections in Russia (1993), Romania (1989) and Georgia (1991–1993) following the breakup of the Soviet Union and the disintegration of the Warsaw Pact.
The exceptions to this general rule have been non-territorial, mostly civilian-targeted efforts in industrial countries, some of which have been generated by overseas organizations using foreign travellers or immigrants—a difficult to classify melding of international actors and resident discontents. Others have been generated by self-motivated individuals, often influenced by social media.
7.1 Discussion: The Persistence of Separatist Conflict
The lack of a strong relationship between separatist conflict and the country-level age structure reflects ethnic conflicts’ apparent ability to persist and re-emerge through much of the age-structural transition. This should not surprise analysts. Unlike revolutionary conflict, which has been geographically widespread among youthful states, the vast majority of separatist conflicts currently arise and re-emerge in states whose borders enclose a multi-ethnic mix reflecting the territorial conquests of empires that endured into the twentieth century. These extinct empires include the Ottoman and Austro-Hungarian Empires (dismantled in 1918); the British, French, German, Netherlands, Belgian and Portuguese Overseas Empires (nearly fully dismantled by the early 1970s), and the Russian Empire (ultimately dismantled at the dissolution of the Soviet Union at the close of 1991). Conversely, the states that once made up Spain’s New World empire, most of which had gained independence in the early nineteenth century, have suffered much less from separatist conflict over the past 70 years. According to UCDP/PRIO (2018), separatist conflicts have been absent from the Americas since 1950, when Puerto Rican separatists engaged the US government in armed conflict.
What explains the divergence in separatist and revolutionary conflict dynamics? According to Yair and Miodownik (2016), the sources of grievances matter most. While advances in age-structural maturity and the dissipation of the youth bulge tend to relieve much of the employment-related grievances and inequities felt by young adults, separatists’ core grievances, centred around their identity and the lack of political autonomy granted to their identity group, are often unresolved.
In addition, Cincotta (2011) has argued that minority youth bulges can facilitate separatist political movements. Economically and socially marginalized ethnic minorities, particularly in rural enclaves, often retain high levels of fertility while fertility among the more urbanized and better educated majority declines (e.g. Lebanese Shiites, rural Kurds in south-eastern Turkey, Pattani Muslims in Thailand and some Caucasian minorities in Russia). Under these conditions, the country-level median age advances, majority-minority economic and social conditions diverge, and the marginalized minority grows more rapidly than the majority—a situation that tends to fuel fears among the politically endowed majority particularly when articulated by political entrepreneurs (Blomquist, 2016; Blomquist & Cincotta, 2016; Cincotta et al., 2003; Leuprecht, 2010).
Does separatist warfare preclude the settlement of conflict? Of course, that is not the case, theoretically or empirically. The age-structural function for intermittent separatist conflicts (Fig. 3, SImt) suggests a very slow and uncertain decline (shown by wide confidence intervals) in the five-year risk of conflict. This function’s slow decline across the age-structural transition alludes to the protracted warfare and costly interventions that ultimately led to the successful mediation, violent termination or slow ideological disintegration of separatist movements in Spain (Basques), the UK (Irish Catholics), Indonesia (Timorese, Aceh), India (Nagas, Punjabi Sikhs) and Ethiopia (Eritreans).
7.2 Outlook: Intrastate Conflict’s Future
What can demographic projections tell defence and intelligence analysts about the future of armed conflict? Assuming that the UN Population Division’s medium fertility variant provides a reasonable projection of the pace of regional demographic change, over the next two decades (to 2040), foreign affairs analysts should expect:
-
a slow downward trend in the global number of states engaged in a revolutionary conflict (Fig. 5) with notable regional declines in Latin America and the Caribbean, East Asia and Southeast Asia, the Maghreb, Central Asia and southern Africa (Table 4); and
Fig. 5 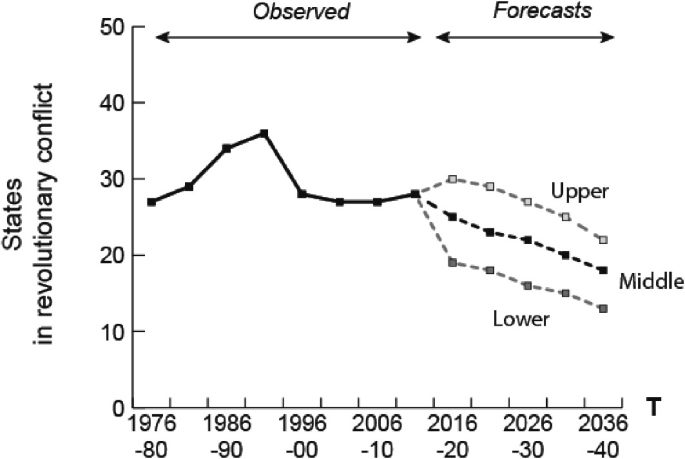
The trend in the number of states engaged in revolutionary conflict (but not intrastate separatist conflict) over seven five-year periods (1976–1980 to 2011–2015). Forecasts are for 2016–2020 to 2036–2040. Five-year counts of states in revolutionary conflict (observed) are drawn from non-territorial conflicts in the UCDP/PRIO Armed Conflict Data Set (2018)
-
sustained, and possibly increasing, counts of states in revolutionary conflict in the remaining contiguous clusters of youthful states, situated in: the Greater Sahel, tropical Africa (West, Central, East); the Horn of Africa-Yemen; Pakistan-Afghanistan; the Mashreq-Levant (Syria, Iraq, Jordan); and possibly in parts of the South Pacific Region (Papua New Guinea, Timor-Leste, Solomon Islands).

With the exception of the South Pacific group, there are currently few indications that these youthful clusters are maturing. Whereas the UNPD’s current medium fertility variant projects that about 30% of today’s 69 youthful states are likely to exit the youthful category by 2035, only a handful of these are located within the most war-torn youthful clusters.
Given this outlook, the world’s developed states would do well to increase support for peace operations, as well as for regional efforts to contain the spread of spill-over conflicts in and around the most youthful regions: the Sahel, tropical Africa, the Middle East and the Horn of Africa-Yemen. As a long-term strategy, development donors should increase their support for the suite of programs and policies that, in youthful countries, have promoted the transition to a more mature age structure—including those that lengthen girls’ educational attainment, provide access to modern contraception and information, and secure equal rights for women.
In the long-run, separatist conflicts could present the most persistent threat to regional stability. To lower the risks of separatist conflicts, there is a need to encourage greater participation of now-marginalized ethnic and religious minorities, and to support those political leaders who show the motivation and political will to implement integrationist policies. Where these measures fail, it may be useful to consider in extreme cases (e.g. the Sahel, Somalia, Yemen, the Mashreq, Afghanistan) the formation of new nation states with more realistic borders, replacing multi-ethnic colonial-era entities and post-colonial conglomerates that have become sites for recurring ethnoreligious conflict (for a critique of partition theory, see Sambanis, 2000). To reduce the risk of post-independence revolutionary conflict (e.g., South Sudan, Timor-Leste), age-structural theory would suggest that populations in those fledgling states should be within, or beyond, the intermediate phase of the age-structural transition (beyond median age of 26 years)—conditions that, unfortunately, have rarely been achieved by states at independence.
7.3 Future Research
For researchers who are intent on further clarifying demography’s relationship with revolution, this chapter’s conclusions open several avenues for research. Among these opportunities, studies that focus on the cessation of revolutionary conflict are (in the authors’ opinion) likely to yield the most return. Because the models presented in this chapter indicate that foreign affairs analysts should expect the risk of revolutionary conflict to decline to low levels during the transition’s intermediate phase (26–35 years), one should ask:
-
What qualities best characterize those revolutionary conflicts that come to a sustained conclusion early in the age-structural transition?
-
And, what qualities characterize revolts that start and end much later in this transition - within and beyond the demographic window?
While academic researchers have argued that anocracies (partial democracies) are more vulnerable to intrastate conflict than democracies or autocracies (Regan & Bell, 2010), among intelligence analysts the hypothesis has a reputation as a poor predictor of future conflict. That said, investigations of revolutions among more specific regime types—e.g. single-party autocracies, military regimes and multi-party authoritarians—when observed across the age-structural domain might provide clues to the timing of the onset and/or cessation of revolutionary conflict.
Predicting the course of ethnic separatist conflict is another matter. As Yair and Miodownik’s (2016) research first suggested, legitimate clues to a future onset or cessation of separatist conflict are more likely to exist at the sub-national level (ethnic group or provincial level) than in country-level data sets. While there are suggestions that majority-minority gaps in fertility and age structure may reflect acute inter-ethnic tensions that are difficult to resolve, the fact that many central government agencies do not collect ethnicity-coded data, or do not release those data to the public, limits research on this topic to case studies.
Here, again, the researchers’ dilemma is in full force: the more one learns, the more one comprehends how little one really understands. Whereas Herbert Möller’s most basic observations on the relationship between demography and conflict—published more than 50 years ago—still hold up today, the dynamics that underlie those observations turn out to be less simple than political demographers (including ourselves) believed them to be.
Notes
- 1.
The age-structural transition describes the transition from a population numerically dominated by children, adolescents and young adults, to distributions with large proportions of older adults and seniors (cf. Cincotta et al., 2003; Goldstone, 2002, 2012; Hegre et al., 2013; Leahy et al., 2007; Mesquida & Weiner, 1999; Sciubba, 2011, 2012; Urdal, 2006, 2012).
- 2.
This is measured as the proportion of young adults, ages 15–24, in the adult population.
- 3.
- 4.
Note: For the six states of the Gulf Cooperation Council (GCC) states (Bahrain, Kuwait, Oman, Qatar, Saudi Arabia, and the United Arab Emirates), median age is computed from estimates and projections of citizen residents (excluding temporary labour migrants), which were originally provided by the US Census Bureau’s International Program Center. These data are not publicly available via the centre’s International Data Base (USCB-IPC, 2015).
- 5.
The median age projections for the GCC states’ citizen-resident populations be obtained from the author via email or downloaded from his website (www.politicaldemography.org).
- 6.
See Methods for definitions of categories, based on median age.
References
Allison, P. D. (2009). Fixed effects regression models. SAGE.
Blomquist, R. (2016). Ethno-demographic dynamics of the Rohingya-Buddhist conflict. Georgetown Journal of Asian Affairs, 3(1), 94–117.
Blomquist, R., & Cincotta, R. P. (2016). Myanmar’s democratic deficit: demography and the Rohingya Dilemma. New Security Beat. https://www.newsecuritybeat.org/2016/04/myanmars-democratic-deficit-demography-rohingya-dilemma/. Accessed 9 February 2020.
Cincotta, R. P. (2008–2009). Half a chance: Youth bulges and transitions to liberal democracy. Environmental Change and Security Program Report, 13, 10–18.
Cincotta, R. P. (2011). Minority youth bulges and the future of intrastate conflict. New Security Beat. https://www.newsecuritybeat.org/2011/10/minority-youth-bulges-and-futureof.html. Accessed 9 February 2020.
Cincotta, R. P. (2012). Demography: A development perspective. In J. Spear & P. D. Williams (Eds.), Security and development in global politics: A critical comparison (pp. 291–310). Georgetown University Press.
Cincotta, R. P. (2017). The age-structural theory of state behavior. In W. R. Thompson (Ed.), Oxford reference encyclopedia: Empirical international relations theory. Oxford University Press.
Cincotta, R. P. (2018). Age-structure and intrastate conflict: More or less than we imagined? New Security Beat. https://www.newsecuritybeat.org/2018/04/age-structure-intrastate-conflict-imagined. Accessed 9 February 2020.
Cincotta, R. P., Engelman, R., & Anastasion, D. (2003). The security demographic: Population and civil conflict after the Cold War. Population Action International.
Cincotta, R. P., & Madsen, E. L. (2017, October 29). The four dividends: The age-structural timing of transitions in child survival, educational attainment, income, and political stability. Presented at the IUSSP International Population Conference. Cape Town, South Africa.
Coale, A. J., & Hoover, E. M. (1958). Population growth and economic development in low-income countries: A case study of India’s prospect. Princeton University Press.
Desmet, K., Ortuño-Ortín, I., & Wacziarg, R. (2011). The political economy of linguistic cleavages. Journal of Development Economics, 97, 322–338. (note: linguistic heterogeneity data set online at: http://www.anderson.ucla.edu/faculty_pages/romain.wacziarg/papersum.html. Accessed 9 February 2020).
Freedom House. (2018). Freedom in the world, 2018. Freedom House.
Fuller, G., & Pitts, F. R. (1990). Youth cohorts and political unrest in South Korea. Political Geography Quarterly, 9(1), 9–22.
Goldstone, J. A. (1991). Revolution and rebellion in the early modern world. University of California Press.
Goldstone, J. A. (2002). Population and security: How demographic change can lead to violent conflict. Journal of International Affairs, 56(1), 3–22.
Goldstone, J. A. (2012). Demography: A security perspective. In J. Spear & P. D. Williams (Eds.), Security and development in global politics: A critical comparison (pp. 271–289). Georgetown University Press.
Hegre, H., Karlsen, J., Nygård, H. M., Strand, H., & Urdal, H. (2013). Predicting armed conflict, 2010–2050. International Studies Quarterly, 57(2), 250–270.
Huntington, S. P. (1997). The clash of civilizations and the remaking of world order. Touchstone Books.
Leahy, E., Engelman, R., Vogel, C. G., Haddock, S., & Preston, T. (2007). The shape of things to come: Why age structure matters to a safer, more equitable world. Population Action International.
Leuprecht, C. (2010). The demographic security dilemma. Yale Journal of International Affairs, 5(2), 60–74.
Lutz, W., Butz, W. P., & Samir, K. C. (2011). World population and human capital in the twenty-first century. IIASA.
Malmberg, B., & Lindh T. (2006). Forecasting global income growth using age-structural projections. In I. Pool, L. R. Wong & É. Vilquin (Eds.), Age-structural transitions: Challenges for development, (pp. 60–82). Committee for International Cooperation in National Research in Demography.
Mesquida, C. G., & Wiener, N. I. (1999). Male age composition and the severity of conflicts. Politics in the Life Sciences, 18(2), 181–189.
Möller, H. (1968–1969). Youth as a force in the modern world. Comparative Studies in Society and History, 10, 237–260.
National Intelligence Council. (2012). Global trends, 2030: Alternative worlds. Office of the Director of National Intelligence.
National Intelligence Council. (2017). Global trends: Paradox of progress. Office of the Director of National Intelligence.
R Core Team (2019). R: A language and environment for statistical computing. R Foundation for Statistical Computing. http://www.R-project.org. Accessed 9 February 2020.
Regan, P. M., & Bell, S. R. (2010). Changing lanes or stuck in the middle: Why are anocracies more prone to civil wars? Political Science Quarterly, 63(4), 747–759.
Sambanis, N. (2000). Partition as a solution to ethnic war: An empirical critique of the theoretical literature. World Politics, 52(4), 437–483.
Schrodt, P. A. (2014). Seven deadly sins of contemporary quantitative political analysis. Journal of Peace Research, 51(2), 287–300.
Sciubba, J. D. (2011). The future faces of war: Population and national security. Praeger.
Sciubba, J. D. (2012). Demography and instability in the developing world. Orbis. https://doi.org/10.1016/j.orbis.2012.01.009.
Sommers, M. (2011). Governance, security and culture: Assessing Africa’s youth bulge. International Journal of Conflict and Violence, 5(2), 292–303.
Stammann, A., Heiß, F., & McFadden, D. (2016). Estimating fixed effects logit models with large panel data. In VfS annual conference 2016 (Augsburg): Demographic change (No. 145837). Verein für Socialpolitik/German Economic Association.
Therneau, T. M. (2015). A package for survival analysis in S, v. 2.38. https://CRAN.R-project.org/package=survival. Accessed 9 February 2020.
United Nations Department of Social Affairs, Population Division. (2017). Population prospects, the 2017 revision. United Nations. http://esa.un.org/unpd/wpp/Excel-Data/population.htm. Accessed 9 February 2020.
Uppsala Conflict Data Program, and Peace Research Institute of Oslo (UCDP/PRIO). (2018). UCDP/PRIO Armed Conflict Dataset, Version 18.1. https://ucdp.uu.se. Accessed 9 February 2020.
Urdal, H. (2006). A clash of generations? Youth bulges and political violence. International Studies Quarterly, 50, 607–629.
Urdal, H. (2012). Youth bulges and violence. In J. A. Goldstone, E. P. Kaufmann & M. D. Toft (Eds.), Political demography: How population changes are reshaping security and national politics (pp. 117–132). Oxford University Press.
U.S. Census Bureau, International Program Center. (2015). International data base. https://www.census.gov/population/international/data/idb/informationGateway.php. Accessed 9 February 2020.
Weber, H. (2018). Age structure and political violence: A re-assessment of the “youth bulge” hypothesis. International Interactions. https://doi.org/10.1080/03050629.2019.1522310.
Weiner, M., & Teitelbaum, M. (2001). Political demography, demographic engineering. Berghahn Books.
World Bank Group. (2017). World development indicators data base. http://databank.worldbank.org/data/reports.aspx?source=world-development-indicators. Accessed 9 February 2020.
Yair, O., & Miodownik, D. (2016). Youth bulge and civil war: Why a country’s share of young adults explains only non-ethnic wars. Conflict Management and Peace Science, 33(1), 25–44.
Acknowledgements
We are grateful for the statistical advice of our principal editor, Achim Goerres, and the editorial comments and suggestions of an anonymous reviewer.
Author information
Authors and Affiliations
Corresponding author
Editor information
Editors and Affiliations
1 Electronic Supplementary Material
Below is the link to the electronic supplementary material.
Rights and permissions
Open Access This chapter is licensed under the terms of the Creative Commons Attribution-NonCommercial 4.0 International License (http://creativecommons.org/licenses/by-nc/4.0/), which permits any noncommercial use, sharing, adaptation, distribution and reproduction in any medium or format, as long as you give appropriate credit to the original author(s) and the source, provide a link to the Creative Commons license and indicate if changes were made.
The images or other third party material in this chapter are included in the chapter's Creative Commons license, unless indicated otherwise in a credit line to the material. If material is not included in the chapter's Creative Commons license and your intended use is not permitted by statutory regulation or exceeds the permitted use, you will need to obtain permission directly from the copyright holder.
Copyright information
© 2021 The Author(s)
About this chapter

Cite this chapter
Cincotta, R., Weber, H. (2021). Youthful Age Structures and the Risks of Revolutionary and Separatist Conflicts. In: Goerres, A., Vanhuysse, P. (eds) Global Political Demography. Palgrave Macmillan, Cham. https://doi.org/10.1007/978-3-030-73065-9_3
Download citation
DOI: https://doi.org/10.1007/978-3-030-73065-9_3
Published:
Publisher Name: Palgrave Macmillan, Cham
Print ISBN: 978-3-030-73064-2
Online ISBN: 978-3-030-73065-9
eBook Packages: Political Science and International StudiesPolitical Science and International Studies (R0)