
Abstract
Machine Learning for Phenotyping is composed of three chapters and aims to introduce clinicians to machine learning (ML). It provides a guideline through the basic concepts underlying machine learning and the tools needed to easily implement it using the Python programming language and Jupyter notebook documents. It is divided into three main parts: part 1—data preparation and analysis; part 2—unsupervised learning for clustering and part 3—supervised learning for classification.
You have full access to this open access chapter, Download chapter PDF
Keywords
- Machine learning
- Phenotyping
- Data preparation
- Data analysis
- Unsupervised learning
- Clustering
- Supervised learning
- Classification
- Clinical informatics
1 Supervised Learning for Classification
The next section focuses on building mortality prediction models/classifiers using common algorithms and the ‘sklearn’ library, in particular k-nearest neighbors, logistic regression, decision trees and random forest. Before starting, it is important to define which performance measures should be used to evaluate the performance of different classifiers.
1.1 Definition of Performance Measures
Having a single-number evaluation metric is useful for comparing the performance of different models. Accuracy can be misleading when classes are imbalanced. Sensitivity (also called “recall” or “true positive rate”) is a useful measure that indicates the percentage of non-survivors who are correctly identified as such. In the context of our problem, having a high sensitivity is very important, since it tells us the algorithm is able to correctly identify the most critical cases. However, optimizing for sensitivity alone may lead to the presence of many false alarms (i.e. false positives). Therefore, it is important to also have in mind specificity, which tells us the percentage of survivors who are correctly identified. Sensitivity and specificity are given by:
-
Sensitivity = \(\frac{TP}{TP + FN}\)
-
Specificity = \(\frac{TN}{TN + FP}\)
One way of combining sensitivity and specificity in a single measure is using the area under the receiver-operator characteristics (ROC) curve (AUC), which is a graphical plot that illustrates the performance of a binary classifier as its discrimination threshold is varied.
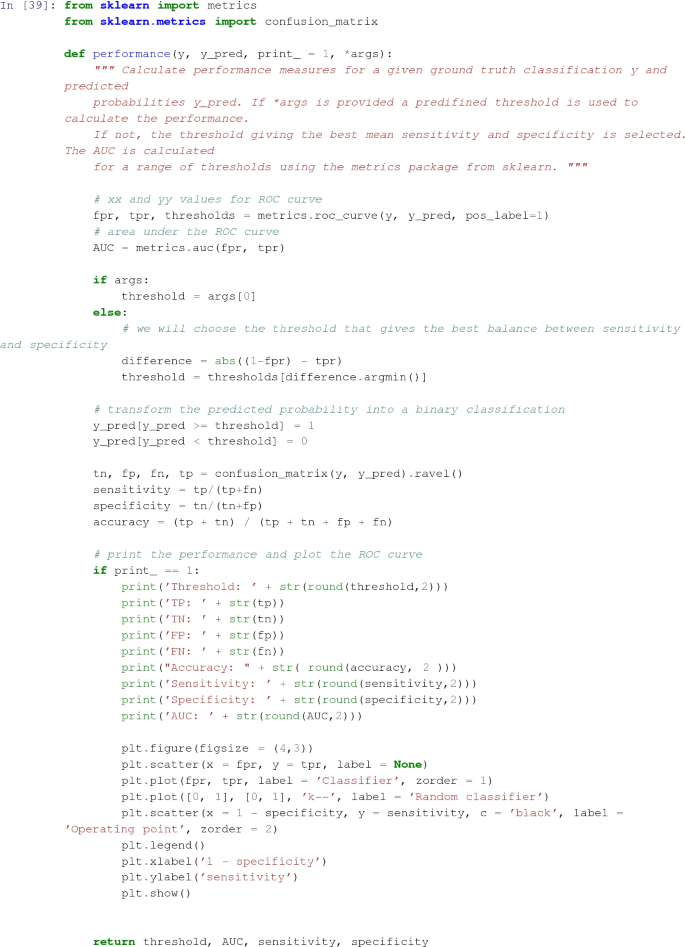
The following function shows how to calculate the number of true positives, true negatives, false positives, false negatives, accuracy, sensitivity, specificity and AUC using the ‘metrics’ and ‘confusion_matrix’ packages from ‘sklearn’; how to plot the ROC curve and how to choose a threshold in order to convert a continuous value output into a binary classification.
1.2 Logistic Regression
When starting a machine learning project it is always a good approach to begin with a very simple model since it will give a sense of how challenging the question is. Logistic regression (LR) is considered a simple model because the underlying math is easy to understand, thus making its parameters and results interpretable. It also takes time computing compared to other ML models.
1.2.1 Feature Selection
In order to reduce multicollinearity, and because we are interested in increasing the interpretability and simplicity of the model, feature selection is highly recommended. Multicollinearity exists when two or more of the predictors in a regression model are moderately or highly correlated. The problem with multicollinearity is that it makes some variables statistically insignificant when they are not necessarily so, because the estimated coefficient of one variable depends on which collinear variables are included in the model. High multicollinearity increases the variance of the regression coefficients, making them unstable, but a little bit of multicollinearity is not necessarily a problem. As you will see, the algorithm used for feature selection does not directly addresses multicollinearity, but indirectly helps reduce it by reducing the size of the feature space.
Sequential forward selection/forward stepwise selection The sequential forward selection (SFS) algorithm is an iterative process where the subset of features that best predicts the output is obtained by sequentially selecting features until there is no improvement in prediction. The criterion used to select features and to determine when to stop is chosen based on the objectives of the problem. In this work, maximization of average sensitivity and specificity will be used as the criterion.
In the first iteration, models with one feature are created (univariable analysis). The model that yields the higher average sensitivity and specificity in the validation set is selected. In the second iteration, the remaining features are evaluated again one at a time, together with the feature selected in the previous iteration. This process continues until there is no significant improvement in performance.
In order to evaluate different feature sets, the training data is divided into two sets, one for training and another for validation. This can be easily achieved using the ‘train_test_split’ as before:

Since there is no SFS implementation in python, the algorithm is implemented from scratch in the next example. The ‘linear model’ package from ‘sklearn’ is used to implement LR and a minimum improvement of 0.0005 is used in order to visualize the algorithm for a few iterations. The figure shows the performance associated with each feature at each iteration of the algorithm. Different iterations have different colors and at each iteration one feature is selected and marked with a red dot. Note that this operation will take some time to compute. You can decrease the ‘min_improv’ to visualize the algorithm for fewer iterations or increase it to allow more features to be added to the final set. You can also remove the lines of code for plotting the performance at each run, to reduce the time of computation.


Iteration 1 (blue dots associated with lower performance) corresponds to a univariable analysis. At this stage, maximum GCS is selected since it yields the higher average sensitivity and specificity. Iteration 2 corresponds to a multivariable analysis (GCS plus every other independent variable). There is a big jump from iteration 1 to iteration 2, as expected, and small improvements thereafter until the performance reaches a plateau. We can plot the performance obtained at each iteration:


According to SFS, important features that help predict the outcome are:
-
Maximum GCS, decrease in GCS during the first hours in the ICU associated with high mortality (cluster 3);
-
Age;
-
Maximum heart rate;
-
Minimum and maximum pH;
-
Mean respiratory rate;
-
Small increase in diastolic BP during the first 24 h (cluster 2);
-
Variation in systolic BP;
-
Maximum and variation in glucose.
In the exercises you will be advised to investigate how these conclusions change when a different data partitioning is used for training and testing. You can do this by changing the random seed.
Remember that for large number of features (85 in our case) we cannot compute the best subset sequence. This would mean testing all combinations of 85 features, 1–85 at a time. It is hard enough to calculate the number of combinations, let alone train models for every one of them. This is why greedy algorithms that lead to sub-optimal solutions are commonly used. Even k-means, which is very fast (one of the fastest clustering algorithms available), falls in local minima.
Recursive Feature Elimination (RFE) Recursive feature elimination is similar to forward stepwise selection, only in this case features are recursively eliminated (as opposed to being recursively added) from the feature set. It can be implemented using the ‘RFE’ function from ‘sklearn’. At the ‘sklearn’ documentation website you will find:
“Given an external estimator that assigns weights to features (e.g., the coefficients of a linear model), the goal of recursive feature elimination (RFE) is to select features by recursively considering smaller and smaller sets of features. First, the estimator is trained on the initial set of features and the importance of each feature is obtained either through a ‘coef_’ attribute or through a ‘feature_importances_’ attribute. Then, the least important features are pruned from current set of features. That procedure is recursively repeated on the pruned set until the desired number of features to select is eventually reached.”
A disadvantage of using ‘sklearn’ implementation of RFE is that you are limited to using ‘coef_’ or ‘feature_importances_’ attributes to recursively exclude features. Since LR retrieves a ‘coef_’ attribute, this means RFE will recursively eliminate features that have low coefficients and not the features that yield the lower average sensitivity specificity as we would like to if we were to follow the example previously given with SFS.
Similarly to SFS, a stopping criterion must also be defined. In this case, the stopping criterion is the number of features. If the number of features is not given (‘n_features_to_select’ = None), half of the features are automatically selected. For illustrative purposes, the next example shows how to use RFE to select 13 features:

The attribute ‘support_’ gives a mask of selected features:


The attribute ‘ranking_’ gives the feature ranking. Features are ranked according to when they were eliminated and selected features are assigned rank 1:


For example, the last feature to be excluded by RFE is:


However, this does not mean that this particular cluster tendency of glucose is not important; such a conclusion cannot be drawn due to the presence of other features that are highly correlated with this one.
SFS and RFE selected the following features in common:


1.2.2 Model Testing
Feature selection has been performed using training and validation sets. In the next steps, the performance is evaluated using an independent test set not used to select features. First, a LR model is fitted to the training data on the feature set selected by SFS:


Next, a general function called ‘model_evaluation’ is created in order to:
-
1.
yield probability estimates for unseen data. This is achieved using the ‘predict_proba’ function;
-
2.
evaluate model performance using both training and test sets.

We can call the function to evaluate the previous model on test data:


Results are assigned to a DataFrame for future reference, with the label ‘LR SFS’:

The coefficients of the model can be visualized using the ‘coef_’ attribute. The next function takes a LR model and column names and plots the model coefficients in ascending order:


The results seem to cohere with expected clinical practice. There are enough variables in the model which correlate with mortality as we would expect them to. This increases our faith in the remainder of those variables whose association with mortality in clinical practice is not inherently obvious. The results evoke interesting relationships between other variables which are less well known to affect mortality, such as glucose.
The same process can be repeated for RFE:


1.3 K-Nearest Neighbors
Another simple algorithm investigated in this work is k-nearest neighbors (kNN). It is known as a “lazy” algorithm, since it does not do anything during the learning phase: the model is essentially the entire training dataset. When a prediction is required for an unseen observation, kNN will search through the entire training set for the \(k\) most similar observations. The prediction is given by the majority voting of those \(k\) nearest neighbors. The similarity measure is dependent on the type of data. For real-valued data, the Euclidean distance can be used. For other types of data, such as categorical or binary data, the Hamming distance is recommended. In this work we focus only on the Euclidean distance.
A very common alternative to the straightforward kNN is weighted kNN, where each point has a weight proportional to its distance. For example, with inverse distance weighting, each point has a weight equal to the inverse of its distance to the point to be classified. This means that neighboring points have a higher vote than farther points. As an example, we will use the ‘KNeighborsClassifier’ function from ‘sklearn’ with 3 neighbors, with the parameter ‘weights’ set to ‘distance’, in order to have weighted votes and the features selected through SFS.
Warning: In ‘sklearn’, if there is a tie in majority voting, for instance if you provide \(k = 2\) and the two neighbors have identical distances but different class labels, the results will depend on the ordering of the training data. Therefore, it is recommended to use an odd number of k.


Running the same algorithm with the features selected through RFE yields very similar results. You can check for yourself by substituting the input vector in the previous script.
1.4 Decision Tree
Most ICU severity scores are constructed using logistic regression, which imposes stringent constraints on the relationship between explanatory variables and the outcome. In particular, logistic regression relies on the assumption of a linear and additive relationship between the outcome and its predictors. Given the complexity of the processes underlying death in ICU patients, this assumption might be unrealistic.
We hope to improve the prediction obtained by LR by using a nonparametric algorithm such as a decision tree (DT). A DT is a model that uses a tree-like graph of rules that provides probabilities of outcome. It can be used for classification and regression, it automatically performs feature selection, it is easy to understand, interpret (as long as the tree has a small depth and low number of features) and requires little data preparation. Since this type of algorithm does not make strong assumptions about the form of the mapping function, it is a good candidate when you have a lot of data and no prior knowledge, and when you do not want to worry too much about choosing the right features.
However, DT learners are associated with several disadvantages. They are prone to overfitting, as they tend to create over-complex trees that do not generalize well and they can be unstable because small variations in the data might result in a completely different tree being generated. Methods like bagging and boosting (i.e., random forests), are typically used to solve these issues.
1.4.1 CART Algorithm
This work will focus on the CART algorithm, which is one of the most popular algorithms for learning a DT. The selection of variables and the specific split is chosen using a greedy algorithm to minimize a cost function. Tree construction ends using a predefined stopping criterion, such as a minimum number of training instances assigned to each leaf node of the tree.
Greedy Splitting The greedy search consists of recursive binary splitting, a process of dividing up the input space. All input variables and all possible split points are evaluated and chosen in a greedy manner (the very best split point is chosen each time). All values are lined up and different split points are tried and tested using a cost function. The split with the lowest cost is selected.
For classification, the Gini index (G) function (also known as Gini impurity) is used. It provides an indication of how “pure” the leaf nodes are, or in other words, an idea of how good a split is by how mixed the classes are in the two groups created by the split:
-
perfect class purity: a node that has all classes of the same (\(G=0\))
-
worst class purity: a node that has a 50–50 split of classes (\(G=0.5\))
The \(G\) for each node is weighted by the total number of instances in the parent node. For a chosen split point in a binary classification problem, \(G\) is calculated as:
\(G = ((1 -g1_1^2 + g1_2^2) \times \frac{ng1}{n})+ ((1 - g2_1^2 + g2_2^2) \times \frac{ng2}{n})\), where:
-
\(g1_1\): proportion of instances in group 1 for class 1;
-
\(g1_2\): proportion of instances in group 1 for class 2;
-
\(g2_1\): proportion of instances in group 2 for class 1;
-
\(g2_2\): proportion of instances in group 2 for class 2;
-
\(ng1\): total number of instances in group 1;
-
\(ng2\): total number of instances in group 2;
-
\(n\): total number of instances we are trying to group from the parent node.
Stopping Criterion The most common stopping procedure is to use a minimum count of the number of training observations assigned to each leaf node. If the count is less than some minimum then the split is not accepted and the node is taken as a final leaf node. The minimum count of training observations is tuned to the dataset. It defines how specific to the training data the tree will be. Too specific (e.g. a count of 1) and the tree will overfit the training data and likely have poor performance on the test set.
The CART algorithm can be implemented in ‘sklearn’ using the ‘DecisionTreeClassifier’ function from sklearn.ensemble’. Next follows a list of important parameters to have in consideration when training the model:
-
criterion: function to measure the quality of a split. Default = ’gini’.
-
splitter: strategy used to choose the split at each node. Supported strategies are ‘best’ to choose the best split and ‘random’ to choose the best random split. Default = ‘best’.
-
max_features: maximum number of features in each tree. Default is sqrt(n_features).
-
max_depth: maximum depth of the tree. If None, nodes are expanded until all leaves are pure or until all leaves contain less than ‘min_samples_split’ samples.
-
min_samples_split: minimum number of samples required to split an internal node. Default = 2.
-
min_samples_leaf: minimum number of samples required to be at a leaf node. Default = 1.
-
max_leaf_nodes: grow a tree with ‘max_leaf_nodes’ in best-first fashion. Best nodes are defined as relative reduction in impurity. If None then unlimited number of leaf nodes. Default = None.
-
random_state: if int, seed used by the random number generator. Default = None.
In the next example, a small DT (maximum depth of 5) is created. Since the algorithm has embedded feature selection, we can use all the extracted features as input without having to worry about dimensionality issues.


As already discussed in the previous Chapter, there are two major sources of error in machine learning—bias and variance:
-
Bias: how the algorithm performs on the training set.
-
Variance: how much worse the algorithm does on the test set than the training set.
Understanding them will help you decide which tactics to improve performance are a good use of time. High bias can be viewed as an underfitting problem and high variance as an overfitting problem. Comparing the training and test results, it seems that the DT is overfitting the training data (high variance). You can investigate how bias and variance are affected by different choices of parameters. This topic is further explored in Sect. 11.2.3.
1.4.2 Tree Visualization
In order to visualize the tree, some extra packages need to be installed (‘pydot’ and ‘graphviz’). Use the following example to visualize the tree created in the previous step:

Out[58]:

With the binary tree representation shown above, making predictions is relatively straightforward.
1.4.3 Feature Importance
As you can see in the previous figure, not all features are selected. The ‘feature_importances_’ attribute gives the relative importance of each feature in the model. The importance of a feature is computed as the (normalized) total reduction of the criterion yielded by that feature. It is also known as the Gini importance. Features with relative importance greater than 0 correspond to features that were selected by the model. The next example shows how to plot the features in descending order of relative importance.


Again, we will store the results, but in this case we need to update the actual number of features used:

1.5 Ensemble Learning with Random Forest
The rationale behind ensemble learning is the creation of many models such that the combination or selection of their output improves the performance of the overall model. In this chapter we will explore one type of ensemble learning based on decision trees, called random forest.
Random forest (RF) comprises split-variable selection, sub-sampling and bootstrap aggregating (bagging).
The essential idea in bagging is to average many noisy but approximately unbiased models, and hence reduce the variance. Trees are ideal candidates for bagging, since they can capture complex interaction structures in the data, and if grown sufficiently deep, have relatively low bias. Since trees are notoriously noisy, they benefit greatly from the averaging. Friedman et al. - 2008 - The Elements of Statistical Learning.
Next follows a description of the RF algorithm for classification during the learning and test phases.
1.5.1 Training
\(B:\) Number of trees
-
1.
For \(b=1\) to \(B\)
-
1.1.
Draw a bootstrap sample of size \(N_b\) from the training data (bootstrap = random sampling with replacement).
-
1.2.
Grow a random tree \(T_b\) to the bootstrapped data, by recursively repeating the following steps for each terminal node of the tree, until the minimum node size \(n_\mathrm{min}\) is reached. See CART algorithm.
-
Select m variables at random from the \(p\) variables
-
Pick the best variable/split-point among \(m\)
-
Split the node into two daughter nodes
-
-
1.1.
-
2.
Output the ensemble of trees
1.5.2 Testing
Let \(C_b(x_i)\) be the predicted class probability of the \(b\)th tree in the ensemble for observation \(x_i\). Then, the predicted class probability of the random forest for observation \(x_i\) is:
\(C_{rf}^B(x_i)= \frac{1}{B}\sum _{b=1}^{B}C_b(x_i)\)
The predicted class probabilities of an input sample are computed as the mean predicted class probabilities of the trees in the forest. The class probability of a single tree is the fraction of samples of the same class in a leaf.
The algorithm can be implemented in ‘sklearn’ using the ‘RandomForestClassifier’. Similarly to the DT, important parameters to define are:
-
n_estimators: number of trees in the forest.
-
criterion: function to measure the quality of a split. Default = ‘gini’.
-
max_features: maximum number of features in each tree. Default is sqrt (n_features).
-
max_depth: maximum depth of the tree. If None, then nodes are expanded until all leaves are pure or until all leaves contain less than min_samples_split samples.
-
min_samples_split: minimum number of samples required to split an internal node. Default = 2.
-
min_samples_leaf: minimum number of samples required to be at a leaf node (external node). Default = 1.
-
random_state: if int, seed used by the random number generator. Default = None.
-
bootstrap: Whether bootstrap samples are used when building trees. The sub-sample size is always the same as the original input sample size but the samples are drawn with replacement if bootstrap = True. Default = True.
The next example shows how to build a RF classifier with 100 trees and a maximum depth of 10:


As you can see, in the previous RF configuration the training error is very low. This warrants suspicion of high variance. In fact, the performance in the test set is significantly lower. In order to reduce overfitting, we can reduce the depth of the trees and increase the ‘min_samples_split’.


We were able to decrease the variance, but we still have moderate performance in the test set. Ideally, the performance should be evaluated for various combinations of parameters, and the combination yielding the best performance should be selected. The performance of the selected set could then be evaluated using a test set not used before.
1.5.3 Feature Importance
At each split in each tree, the improvement in the split-criterion (\(G\)) is the importance measure attributed to the splitting feature and is accumulated over all the trees in the forest separately for each feature. The same function created for DT can be used for RF:


Update the actual number of features used in the RF:

The features to which RF assigns higher feature importance are consistent with previous findings. Several features extracted from GCS appear at the top.
1.6 Comparison of Classifiers
The next example summarizes the performance of several classifiers and their ability to generalize. To better assess the classifiers ability to generalize, the difference between training and test performance is plotted.


2 Limitations
In the next section, critical aspects of the study conducted are discussed.
2.1 Selecting One Model
What is the best model? At this point it is probable that the reader is posing this question. The answer to what is the best model, or what model should be selected, is not straightforward. At this point, it really is about selecting a good path to continue exploring. A single decision tree is clearly not the way to go in terms of performance, but it can be useful if interpretability is a must. LR is also interpretable when the feature set contains a resonable number of features. So if interpretability is important, LF with RFE or SFS should be considered. RF performs well in the test set but the increase in performance relative to simpler models is very small. The choice depends on reaching a good trade-off between what’s more important; e.g., if sensitivity is very important, and not so much interpretability, then the first RF should be chosen.
2.2 Training, Testing and Validation
Before making any conclusions about performance, it is advisable to change the data partitions used for training, testing and validating. A single data partitioning has been used in order to facilitate the presentation of ideas, but ideally the evaluation should not be limited to a single random data division. Cross validation can be used to investigate the variablity in performance when different data partitions are used. Following this approach, all data is used for training and testing the models and the results are averaged over the rounds.
2.3 Bias/variance
Decision tree based models have high variance, i.e., the trees are probably overfitting the training data and this hampers their ability to generalize. Again, cross-validation should be performed—we would likely get very different DTs for different training partitions (which is why RF is better!). As mentioned before, the bias/variance problem could be addressed by training/validating models for a range of distinct combinations of parameters and selecting a set that minimizes overfitting to the training data (low bias) and that at the same time performs well in the validation set (low variance).
3 Conclusions
This chapter provides a step by step illustrative guideline of how to conduct a machine learning project for healthcare research and the tools needed to easily implement it using the Python programming language and Jupyter notebook documents. It focuses on exploratory data analysis, variable selection, data preprocessing, data analysis, feature construction, feature selection, performance evaluation and model training and testing. The steps conducted before machine learning should allow the researcher to better understand how the data can be prepared for modeling. Tools for data analysis have also been presented in order to guide decisions and point towards interesting research directions. At each step, decisions are made based on the requisites of the problem. It should be emphasized however that a single answer to how to best conduct a project similar to the one presented here does not exist. In particular, many decisions were made in order to preserve simplicity and improve model interpretability, for example when deciding to extract summary statistics and snapshots measurements from the time series without resorting to more complex approaches that could have led to better performance.
4 Exercises
4.1 Daily Prediction
It is useful to evaluate the performance of the classifier using data from the first day. It will give us a more realistic sense of how the classifier would behave in a real setting if we wanted a decision at the end of the first day.
We have performed dimensionality reduction by extracting relevant information from the complete time series (48 h). Investigate how the performance changes if you do this separately for each 24 h.
4.2 Clustering Patterns
Clustering has been employed for patient stratification. Data were normalized for each patient individually so that the groups would reflect physiological time trends. How do the patterns change if:
-
1.
the random seed used to generate the training and test sets changes;
-
2.
the random seed used to initiate the cluster centers changes;
-
3.
data is not normalized;
-
4.
data is normalized for the entire training set at once?
4.3 Class Imbalance
Undersampling has been used in order to mitigate bias toward a predominant class. Class balancing can also be performed by sampling an equal number of observations from each class. In ‘sklearn’, you can use the parameter ‘class_weight’ in order to control for imbalanced training data when learning logistic regression, decision trees or random forest:
-
class_weight = {class_label: weight}: weights associated with classes. If not given, all classes are assumed to have weight one.
-
class_weight = ‘balanced’: uses the values of y to automatically adjust weights inversely proportional to class frequencies in the input data.
Investigate how class_weight = ‘balanced’ impacts the performance of the models.
4.4 Bias/Variance
Investigate how bias and variance are affected by different choices of parameters.
5 Recommended Literature
-
1.
Machine Learning Yearning (2018) by Andre Ng (draft version currently available)
-
2.
The elements of statistical learning (2001) by Friedman J, Hastie T, Tibshirani R.
-
3.
Secondary Analysis of Electronic Health Records (2016) by MIT Critical Data
-
4.
Python Data Science Handbook (2016) by Jake VanderPlas
-
5.
Hands-On Machine Learning with Scikit-Learn and TensorFlow (2017) by Aurélien Géron
Acknowledgements
This work was supported by the Portuguese Foundation for Science & Technology, through IDMEC, under LAETA, project UID/EMS/50022/2019 and LISBOA-01-0145-FEDER-031474 supported by Programa Operational Regional de Lisboa by FEDER and FCT.
Author information
Authors and Affiliations
Corresponding author
Editor information
Editors and Affiliations
Rights and permissions
Open Access This chapter is licensed under the terms of the Creative Commons Attribution 4.0 International License (http://creativecommons.org/licenses/by/4.0/), which permits use, sharing, adaptation, distribution and reproduction in any medium or format, as long as you give appropriate credit to the original author(s) and the source, provide a link to the Creative Commons license and indicate if changes were made.
The images or other third party material in this chapter are included in the chapter's Creative Commons license, unless indicated otherwise in a credit line to the material. If material is not included in the chapter's Creative Commons license and your intended use is not permitted by statutory regulation or exceeds the permitted use, you will need to obtain permission directly from the copyright holder.
Copyright information
© 2020 The Author(s)
About this chapter

Cite this chapter
Salgado, C.M., Vieira, S.M. (2020). Machine Learning for Patient Stratification and Classification Part 3: Supervised Learning. In: Celi, L., Majumder, M., Ordóñez, P., Osorio, J., Paik, K., Somai, M. (eds) Leveraging Data Science for Global Health. Springer, Cham. https://doi.org/10.1007/978-3-030-47994-7_11
Download citation
DOI: https://doi.org/10.1007/978-3-030-47994-7_11
Published:
Publisher Name: Springer, Cham
Print ISBN: 978-3-030-47993-0
Online ISBN: 978-3-030-47994-7
eBook Packages: Computer ScienceComputer Science (R0)