
Abstract
A fundamental assumption of linear acoustics is that the presence of a wave does not have an influence on the properties of the medium through which it propagates. By extension, the assumption of linearity also means that a waveform is stable since any individual wave does not interact with itself. Small modifications in the sound speed due to wave-induced fluid convection (particle velocity) and to the wave’s effect on sound speed through the equation of state can lead to effects that could not be predicted within the limitations imposed by the assumption of linearity. Although a wave’s influence on the propagation speed may be small, those effects are cumulative and create distortion that can produce shocks. These are nonlinear effects because the magnitude of the nonlinearity’s influence is related to the square of an individual wave’s amplitude (self-interaction) or the product of the amplitudes of two interacting waves (intermodulation distortion). In addition, the time-average of an acoustically induced disturbance may not be zero. Sound waves can exert forces that are sufficient to levitate solid objects against gravity. The stability of such levitation forces will also be examined along with their relation to resonance frequency shifts created by the position of the levitated object.
You have full access to this open access chapter, Download chapter PDF
Keywords
- Harmonic distortion
- Intermodulation distortion
- Shock waves
- Acoustic levitation
- Bernoulli pressure
- Rayleigh disk
The goal of this chapter is to raise awareness of the limitation of linear analysis, not to create professional expertise in nonlinear acoustics. A fundamental assumption of linear acoustics is that the presence of a wave does not have an effect on the properties of the medium through which it propagates. Under that assumption, two sound waves can be superimposed when they occupy the same space at the same time, but one wave will have no effect on the other wave and once they part company there will be no evidence of their previous interaction. This is illustrated in Fig. 15.1. By extension, the assumption of linearity also means that a waveform is stable since any individual wave does not interact with itself.Footnote 1

Two wave packets pass through each other. (Left) The two wave packets are approaching each other. (Center) When those wave packets overlap, the disturbances superimpose. (Right) After their superposition, they continue their propagation with no evidence of their previous interaction
We already know that this assumption of the wave having no influence on the properties of the propagation medium cannot be strictly correct. The wave imparts a small particle velocity, v1, to the fluid that adds to the sound speed when that velocity is in the direction of propagation and subtracts from the sound speed when the particle velocity is opposite to the direction of propagation. The local value of the sound speed, c(x, t), will vary in time and space due to the wave’s convective contribution so that co + v1(x, t) ≥ c(x, t) ≥ co − v1(x, t), where co is the equilibrium (thermodynamic) sound speed: \( {c}_o=\sqrt{{\left(\partial p/\partial \rho \right)}_s} \).
The wave also modulates the medium’s thermodynamic sound speed. For the case of an ideal gas undergoing adiabatic compressions and expansions, there is an accompanying temperature change of amplitude, T1, given by Eq. (7.25), that is related to the amplitude of the pressure change, p1(x, t): (∂T/∂p)s = [(γ − 1)/γ](Tm/pm). Since the sound speed in an ideal gas is dependent upon the temperature of the gas through Eq. (10.23), this implies that the change in sound speed, δc, due to a temperature change is given by (δc/co) = ½(T1/Tm). In an ideal gas, the local sound speed is slightly faster than co when the acoustic pressure is positive since the gas is warmer and slightly slower than co when the acoustic pressure is negative since the gas is cooler.
As will be demonstrated, these small modifications in the sound speed due to wave-induced fluid convection and to the wave’s effect on sound speed through the equation of state can lead to interesting effects that could not be predicted within the limitations imposed by the assumption of linearity. Although their influence on the sound speed may be small, those effects are cumulative. These are called nonlinear effects because the magnitude of the nonlinearity’s influence is related to the square of an individual wave’s amplitude (self-interaction) or the product of the amplitudes of two interacting waves (intermodulation distortion).
An additional consequence of the inclusion of nonlinearity is that the time-average of an acoustically induced disturbance may not be zero. In the linear case, the measure of a wave’s amplitude will be equally positive and negative around its undisturbed equilibrium value, so that the time-average of the wave’s influence will be zero. When the hydrodynamic equations and the equation of state were linearized, the terms in those equations that were discarded could lead to non-zero time-averaged effects. For the linearized continuity equation, the ρ1v1 term was discarded since Eq. (8.19) demonstrated that it was smaller than the ρmv1 term for small values of the acoustic Mach number, Mac ≪ 1. A similar choice was made for the linearization of the Euler equation. The convective portion of the total derivative, \( \left({\overrightarrow{v}}_1\cdotp \nabla \right){\overrightarrow{v}}_1 \), was discarded when compared to \( \partial {\overrightarrow{v}}_1/\partial t \)in Eq. (8.38) under the same assumption of small acoustic Mach number. To complete the overall linearization, the Taylor series expansion of the equation of state in Eq. (10.3) was truncated after the first-derivative term.
In this chapter we will recover some of the interesting acoustical phenomena that were lost to the linearization of the phenomenological equations that describe both the dynamics and the medium itself.
1 Surf’s Up
When most people hear the term “wave,” it is likely that word will conjure mental images of surf breaking along a beach. (It is a most pleasant image!) The breaking of waves in shallow water is a dramatic nonlinear effect that is due to both the convective nonlinearity and the fact that the height of the wave modulates the propagation speed of a shallow-water gravity wave. The speed of a shallow-water gravity wave represents the competition between the water’s inertia and the restoring force of gravity. Figure 15.2 is a schematic representation of one cycle of such a wave on a fluid of equilibrium depth, ho, with a peak wave height of magnitude |h1| ≪ ho.
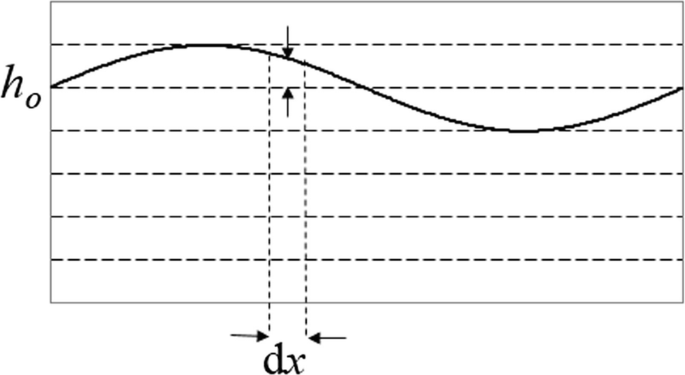
Schematic representation of a sinusoidal disturbance on the free surface of a liquid that has a mean depth, ho. The wave on the surface has an amplitude, |h1| ≪ ho, but with a wavelength λ ≫ ho
The assumption that the fluid is “shallow” implies that the mean depth of the fluid, ho, is much smaller than the wavelength of the disturbance, λ.
Since there is a free surface, we will assume that the fluid is incompressible. It is much more favorable (energetically) for the free surface to move up than it is for a pressure increase to increase the fluid’s density. The continuity equation can be written by recognizing that the rate-of-change of the fluid’s height,\( {\dot{h}}_1\left(x,t\right) \), is determined by the difference in the amount of fluid that enters and leaves a “slab” of infinitesimal thickness, dx, shown in Fig. 15.2.
For a shallow-water gravity wave, the fluid’s particle velocity in the direction of propagation, vx, is greater than the rate-of-change of height of the free surface if ho ≪ λ. This is an effect most of us have experienced while frolicking in the surf near the ocean’s shore—it is usually the “surge” that knocks us over, not \( {\dot{h}}_1 \).
Since gravity (not compressibility) provides the restoring force, Euler’s Eq. (7.34) relates the fluid’s velocity in the direction of propagation, vx, to the gravitational pressure gradient.
The combination of Eqs. (15.2) and (15.3), with the assumption of a rightward traveling wave in Eq. (15.1), leads to a dispersion relation that generates the equilibrium values for propagation speed, cgrav, of a shallow-water gravity wave.Footnote 2
Logarithmic differentiation of Eq. (15.4) provides the relationship between the local wave speed and the instantaneous depth of the fluid.
We would like to combine the effects of changing depth on the sound speed with the convective contribution to the local sound speed produced by vx. The continuity Eq. (15.2) provides that necessary conversion.
The convective contribution to the local wave speed, c(vx), can be combined with the change in local wave speed due to the changing fluid depth.
Both convection and the speed’s change with depth conspire to increase the local wave speed when h1(x, t) > 0 and reduce the local wave speed when h1(x, t) < 0. The wave’s crests travel faster than the zero-crossings (i.e., h1(x, t) = 0) and its troughs travel slower than the zero-crossings. Figure 15.3 shows the cumulative consequences of the wave’s influence on its own local propagation speed. As the wave progresses, the crests will start to overtake the troughs.

The local propagation speed of a shallow-water gravity wave depends upon the amplitude, \( \left|\hat{\mathbf{h}}\right|\equiv {h}_1 \), of the wave. As shown by arrows, an initially sinusoidal wave will change shape because the crests are moving faster than the troughs. As shown, this distortion has made the slope at the zero-crossing infinite
In Fig. 15.3, the coordinate system was chosen to move with the equilibrium wave speed, cgrav, so that the distortion becomes evident. At the instant captured in Fig. 15.3, the slope of the zero-crossing has become vertical. To reach that condition, the crest of a sinusoidal waveform must have advanced by one radian length toward the zero-crossing, k−1 = λ/2π (see Prob. 1), and the trough must have lagged behind by the same amount. The time, TS, it takes for the crest to advance by k−1 is given by the speed excess, 3vx/2, calculated in Eq. (15.7). The distance traveled by the wave once the slope first becomes infinite is known as the shock inception distance, DS.
For surf, the wave can continue beyond DS. Since surf has free surface, h1 can actually become multivalued and will eventually “break,” sometimes with a spectacularly powerful display of sound and foaminess. Stokes was the first to recognize in 1848 that viscosity is the physical mechanism that prevents a sound wave from becoming multivalued. Stokes was also the first to draw a distorted waveform, like the one in Fig. 15.3, which he did in that same paper where he talked about the essential role of viscosityFootnote 3 [1].
1.1 The Grüneisen Parameter
The principles introduced to describe waveform distortion and the creation of a shock front for shallow-water gravity waves are common to all sound waves in fluids. A sound wave will influence the propagation speed of the medium due to a combination of the convective contribution and the fact that the wave’s amplitude also influences the propagation speed. Of course, the nature of that contribution and the relative importance of the convective and equation of state contributions will be differ depending upon the medium. The convenience of representing both contributions in terms of the local fluid particle velocity was demonstrated in the analysis of surf that produced Eq. (15.7). The strength of nonlinear distortion in any medium that supports a plane progressive wave will now be generalized by the introduction of the Grüneisen parameter, Γ.
The Grüneisen parameter is a designation taken from solid-state physics where it represents the nonlinearity of a solid’s elasticity that is responsible for the non-zero value of a solid’s thermal expansion coefficient.Footnote 4 The reader should be cautioned that calling this nonlinear distortion parameter the “Grüneisen parameter” and designating it as Γ is not a common choice in other treatments of nonlinear acoustics. For example, in a recent paper by Hamilton [2], Γ represents the Gol’dberg number that is abbreviated as G in this textbook (see Sect. 15.1.4). In Eq. (15.9), the general amplitude variable is simply written as “y,” and the equilibrium sound speed is designated co to distinguish it from the local amplitude-dependent sound speed, c(v) = co +Γv.
If a medium’s sound speed depended upon the density of the medium, ρ, which obeyed the linear continuity equation, the Grüneisen parameter would be expressed in terms of the sound speed’s variation with density.
For an ideal gas, the sound speed depends upon the mean absolute temperature, Tm. As before, δc represents the change in the sound speed due to the change in local temperature.
The Grüneisen parameter for an ideal gas can be expressed in terms of the change in the speed of sound with temperature, the change in temperature with pressure, and the particle velocity amplitude, v1, associated with the acoustic pressure amplitude, p1, as related by the Euler equation for progressive plane wave propagation: p1 = (ρmco)v1.
Using the relationship between temperature and pressure for an adiabatic sound wave in Eq. (7.25), the Grüneisen parameter for an ideal gas can be calculated.
For noble gases, γ = 5/3 so Γ = 4/3. For diatomic gases and primarily diatomic gas mixtures like air, γ = 7/5, so Γair = 6/5. In both cases, it is the convective contribution that is most significant contributor for nonlinear distortion in a gas.
To start developing intuition regarding the formation of a shock wave, consider a sound wave in air that has an amplitude at the “threshold of feeling,” 120 dBSPL, so p1 = 28 Pa. If the frequency of the sound wave is 1.0 kHz and the mean gas pressure is 100 kPa, then the acoustic Mach number for such a loud sound can be evaluated using the Euler equation.
When such a wave propagates down a duct of constant cross-section, the shock inception distance, DS, can be expressed in terms of the wavelength of sound using Eq. (15.9).
At ten times that amplitude (140 dBSPL, the “threshold of pain”) and for a frequency of 10 kHz, the shock inception distance would be 4.6 m. In the throat of the horn, for a horn-loaded compression driver [3] or in a brass musical instrument (e.g., trumpet or trombone), the amplitude can be still larger by a factor of ten [4].
1.2 The Virial Expansion and B/2A
For the characterization of nonlinear behavior of sound waves in liquids, it is common to expand the equation of state in a Taylor series, known as a virial expansion, in powers of the relative deviation of the density from its equilibrium value, (δρ/ρm) = (ρ − ρm)/ρm.
The coefficients in that expansion, A, B, C, etc. are called the virial coefficients and have the units of pressure. For an adiabatic process, they can be expressed in terms of progressively higher-order thermodynamic derivatives of pressure with respect to density.
It is useful to notice that B can be expressed in terms of the derivative of the sound speed with respect to density, which was related to the non-convective contribution to the Grüneisen parameter in Eq. (15.10). The final form for B/A follows from the expansion of the sound speed derivative with respect to pressure, (∂c/∂p)s = (∂c/∂p)T + (∂T/∂p)s(∂c/∂T)p, and temperature, (∂p/∂T)s = (∂ρ−1/∂s)p = (∂ρ−1/∂T)p/(∂s/∂T)p, along with the introduction of the isobaric coefficient of thermal expansion, βp = (1/V)(∂V/∂T)p = ρm(∂ρ−1/∂T)p, and the introduction of the specific heat at constant pressure, cP = (1/Tm)(∂s/∂T)p [5].
The sound speed can also be expressed in terms of these virial coefficients [6].
This result allows the Grüneisen parameter for liquids to be expressed in terms of B/A.
Some representative values of B/A for different substances is provided in Table 15.1. The values of B/A for liquids are generally greater than 2.0, which means that it is the equation of state’s nonlinearity that dominates the convective nonlinearity. This is reasonable since Euler’s equation implies that the particle velocity in a liquid is much less than that of a gas for equal pressure changes: (ρmc)liquid ≫ (ρmc)gas.
1.3 Anomalous Distortion*
Before moving on, it is interesting to consider the role that a non-zero value of C implies for the formation of shock waves. The behavior that is represented by the Grüneisen parameter causes the sound speed to be increased when the amplitude of the wave is positive and decrease when the amplitude is negative. The C coefficient makes a contribution that either always increases the sound speed, irrespective of the sign of the wave’s amplitude, or always decreases the sound speed, depending upon the sign of C.
Cormack and Hamilton have investigated shear waves with a cubic nonlinearity, C ≠ 0, using numerical simulations [8]. Figure 15.4 shows two plane waveforms that were initially sinusoidal (dotted lines) that have produced both leading- and trailing-edge shocks (solid lines); two shock fronts per wavelength, unlike Figs. 15.3 and 15.7, where only a quadratic nonlinearity was operative (e.g., 1 + B/2A ≠ 0 but C/A = 0).

Waveforms for an initially sinusoidal plane shear wave (dotted lines) in a medium that is dominated by a cubic nonlinearity disturbance far from the sound source with C < 0. (From [8])
A situation where both the quadratic and cubic nonlinearity play a role in superfluid helium sound propagation near absolute zero was identified for shockwave formation of compressional plane waves where the superfluid component velocity, vs, is non-zero, but the (viscous) normal fluid is immobilized, vn = 0. That sound wave mode in superfluids is known as 4th sound (see Fig. 15.5). This creates a superfluid critical acoustic velocity amplitude, vd, which can be defined in terms of the virial coefficients, to be the velocity amplitude where the contribution made by the wave distortion due to the (B/2A) term is equal to the influence of C/A [9].

There are two different sound speeds in liquid 4He below the superfluid transition temperature, Tλ ≅ 2.14 K, at saturated vapor pressure. The ordinary bulk compressional wave speed, known as “first sound,” is fairly constant. The speed of thermal waves, called “second sound,” is generally an order of magnitude less than first sound and is a strong function of temperature, vanishing above the superfluid transition temperature, Tλ. Fourth sound is a compressional sound wave in a porous medium that immobilizes the normal fluid so that only the superfluid can oscillate
For negative values of C, the wave is slowed whether the amplitude of the wave is positive or negative.
This double-shock behavior, caused by C ≠ 0, is rather rare for compressional waves. Using values for (B/A) and (C/A) for water [10], vd = 1.2co, corresponding to acoustic pressure swings of 26,000 atmospheres, well over 100 times greater than the highest cavitation threshold ever measured for pure water [11]. This double-shock behavior has been observed for sound propagating through a liquid near its critical point [12].
In an ideal gas, the virial expansion can be expressed in terms of the ratio of specific heats, γ = cP /cV, also known as the polytropic coefficient.
For an ideal gas, (B/A) = (γ−1) and (C/A) = (γ−1) (γ −2) so the denominator of Eq. (15.22) vanishes making vd/co = ∞; double shocks are an impossibility in gases.
Two other unusual results for the Grüneisen parameter arise from the propagation of sound in superfluid helium [13]. Superfluids are analogous to superconductors in that superfluids can flow without viscosity, just like electrical currents flowing without electrical resistance in superconductors. In addition, the superfluid component has both an elastic and a thermal “restoring force” [14]. In superfluid helium, there is a thermal sound mode, known as second sound, that is propagating, not diffusive, like the response governed by the Fourier heat diffusion Eq. (9.4) for classical liquids (see Sect. 9.3.1).Footnote 5 The temperature dependence of both second sound and the ordinary compressional wave speed (called first sound) are plotted in Fig. 15.5.
It is clear from the speed of second sound vs. temperature that there is a region where the second sound speed decreases with increasing temperature, behavior that is opposite to that of an ideal gas in Eq. (15.11). In that case, the convective contribution to the nonlinearity is opposite to the equation of state’s contribution. At T = 1.884 K, the two contributions cancel each other, and a large amplitude second sound wave can propagate without distortion [15].
A final anomalous example is provided by third sound in superfluid helium. Because the superfluid can flow without resistance, sound waves can propagate in adsorbed films as thin as two atomic layers of helium.Footnote 6 In very thin films, the dominant restoring force is the van der Waals attraction which varies inversely with the fourth power of the distance: f = α/h4. Substituting the van der Waals force for the gravitational force in Eq. (15.4) and providing a correction for the thickness-averaged mass density of the superfluid component, 〈ρs〉, unlike the surf, the speed of third sound, c3, is inversely proportional to the film thickness, ho.
For superfluid films that are less than 10 Å = 10−9 m thick or about three atomic layers of helium, the equation of state produces troughs that travel faster than the crests so the waves distort backward, as shown in Fig. 15.6, compared to ordinary distortion shown in Fig. 15.3.

Very thin films of superfluid helium can support surface waves that are restored by the van der Waals attraction between the fluid and the substrate on which the fluid is adsorbed. For films less than 10 Å thick (about three atomic layers), the troughs travel faster than the crests, and the wave bends backward
1.4 The Gol’dberg Number
A wave of arbitrary amplitude will not necessarily form a shock. If the sound is attenuated, then the amplitude will decrease with distance, and the tendency to distort will be reduced, since the distortion is amplitude dependent. A dimensionless metric, known as the Gol’dberg number, G, compares the shock inception distance, DS, to the exponential attenuation length, ℓ = α−1, where α is the amplitude exponential attenuation constant that was examined in Chap. 14 [16].
As an example, the Gol’dberg number can be evaluated for a 2 kHz sound wave with pressure amplitude of \( \left|\hat{\mathbf{p}}\right| \) = 900 Pa (150 dB re: 20 μParms) in dry air that propagates down a cylindrical waveguide with an inside diameter of 10.0 cm. For dry air at mean pressure, pm = 100 kPa and Tm = 23 °C, co = 345 m/s with δν = 50 μm and δκ = 59 μm. Using Eq. (15.15), with \( {M}_{ac}=\left|\hat{\mathbf{p}}\right|/\gamma {p}_m=0.64\% \) and λ = 17.3 cm, DS = 3.6 m. Using Eq. (13.78), the attenuation length in that waveguide is ℓ = αtv−1 = 20.6 m. The Gol’dberg number, given in Eq. (15.25), is G = 5.7 > 1. In this example, the wave will shock before the wave of that initial amplitude suffers sufficient attenuation.
For an initially sinusoidal plane wave in free space, far from any solid boundaries (i.e., not confined within a 10 cm diameter waveguide!), the attenuation length due to classical thermoviscous dissipation, including “bulk viscosity,” at 2 kHz in dry air at one atmosphere would be about 1.2 dB/km ≅ 1.4 × 10⁻⁴m (see Fig. 14.5), resulting in an exponential attenuation distance of about 7 km making G ≅ 200. For a plane wave in free space with G = 5.7, there would be significant distortion, but a fully developed sawtooth shock would not be created. This is because the classical attenuation coefficient is proportional to frequency squared (see Sect. 14.3), so the attenuation of the second harmonic is four times that of the fundamental, rather than just \( \sqrt{2} \) larger for the waveguide, where the attenuation depends upon the square root of the frequency. Mark Hamilton has provided numerical simulations of the waveforms of such a plane progressive wave in free space for G = 5.7 that are shown in Fig. 15.7.

Numerical simulation of an initially sinusoidal plane wave in free space with Gol’dberg number, G = 5.7, is shown as the blue sinusoid. As the wave progresses, nonlinear effects cause it to distort, and classical attenuation mechanisms reduce its amplitude. A sawtooth waveform, shown in Fig. 15.8, is not produced. (Figure courtesy of Mark Hamilton)
The Gol’dberg number is a dimensionless measure of the importance of nonlinearity relative to dissipation. In some circumstance, dissipation can be entirely ignored. For deepwater gravity waves, the primary source of dissipation is viscosity, and the Gol’dberg number is on the order of one million [17].
1.5 Stable Sawtooth Waveform Attenuation
For large values of the Gol’dberg number, an initially sinusoidal sound wave propagating in one dimension (i.e., ignoring spherical spreading) will steepen and ultimately become a repeated sawtooth waveform. At sufficiently high Gol’dberg numbers, even spherically spreading waveforms that are initially sinusoidal can form shocks [2]. In fact, any periodic waveform will steepen and ultimately form a repeated sawtooth shape, shown in Fig. 15.8, when the Gol’dberg number is sufficiently large and the wave has propagated well past the shock inception distance.

Any periodic wave of sufficient Gol’dberg number will distort into the sawtooth waveform shown in a coordinate system that is moving along with the wave at the thermodynamic sound speed, co. The “excess velocity” produced by the Grüneisen parameter is proportional to the velocity amplitude, u, of the wave. The sloping “back” of the sawtooth must then experience solid body rotation since the excess velocity is proportional to the amplitude above its zero-crossing
Once the sawtooth waveform has developed, the shock front produces a gradient in the temperature, particle velocity, and pressure that is very large. Such gradients produce large dissipation due to thermal conduction across the shock front and viscous shear. The amplitude of the sawtooth waveform must decrease due to the resulting energy dissipation. Calculation of the shock wave’s attenuation can be made by expressing the discontinuity of the entropy across the shock that is cubic in the pressure discontinuity [18]. For an ideal gas, the difference in entropy across the shock is expressed in terms of the universal gas constant, ℜ, and the mean molecular mass of the gas, M, by use of the Rankine-Hugoniot shock relations [19].
Inspection of Fig. 15.8 suggests a simpler geometric approach [20]. If the particle velocity amplitude for the sawtooth waveform is u, then by Eq. (15.9), each portion of the waveform must advance, relative to the zero-crossing, by (Γu dt) during a time interval, dt. The coordinate system, as shown in Fig. 15.8, moves with co, by making the x axis be (x – cot). In that frame of reference, the fact that the back of the shock is a straight line, representing a linear increase in u, requires that the unshocked portion of the waveform undergo solid body rotation, as indicated by the curved arrow in Fig. 15.8.
Since the wave must remain single-valued, the shock front must dissipate sufficient energy to keep the waveform from becoming multiple-valued. The two hashed triangles shown in Fig. 15.8 are similar triangles by Garrett’s First Law of Geometry, so the ratio of their heights to their bases must be equal.
Setting dt = dx/co, Eq. (15.27) can be integrated from a reference location, xo, at which the acoustic Mach number is Mo, out to some arbitrary distance, x, from that reference location.
This result is both interesting and distinctly different from previous expressions for attenuation. First, the amplitude of the shock does not decay exponentially with distance. Second, although the dissipation is due to thermoviscous losses produced by the steep gradients across the shock front, the attenuation is independent of both the fluid’s shear viscosity, μ, and its thermal conductivity, κ, and depends instead upon the Grüneisen parameter.
This sawtooth waveform does not persist. Eventually, it “unshocks,” as shown in Fig. 15.30, as its amplitude decreases to the level where classical attenuation mechanisms are dominant [21].
2 Weak Shock Theory and Harmonic Distortion
In most fluids, the nonlinearity in the equation of state and the nonlinearity introduced by the acoustically induced convection conspire to cause waves to distort. That distortion increases with the propagation distance, if the amplitude of the wave is sufficient for such nonlinear effects to dominate thermoviscous attenuation (i.e., G ≫ 1). For waves of sufficiently large amplitude, this process will turn any periodic wave into a sawtooth wave. In this section, the focus will be on the initial stages of this distortion process.
If a wave is initially a sinusoidal “pure tone,” it will only contain a single Fourier component. That fundamental frequency can be designated f1. The distortion will change the wave shape, but the wave will still be periodic with a period, T = (f1)−1. The description of the distorted waveform will necessarily require additional Fourier components at harmonic multiples of the fundamental frequency, fn = nf1, with n = 2, 3, 4, etc. This section will focus on the growth of those harmonic components with distance and their dependence on the initial amplitude of the wave.
2.1 The Order Expansion
When linear acoustics was first developed in Chap. 8, the parameters that described the acoustic fields were expressed as the sum of an equilibrium value plus a first-order deviation from equilibrium. Equation (8.1) expressed the pressure as \( p\left(\overrightarrow{x},t\right)={p}_m\left(\overrightarrow{x}\right)+{p}_1\left(\overrightarrow{x},t\right) \). Similar expansions were made for the mass density, \( \rho \left(\overrightarrow{x},t\right) \), in Eq. (8.2), temperature, \( T\left(\overrightarrow{x},t\right) \), in Eq. (8.3), and (specific) entropy per unit mass, \( s\left(\overrightarrow{x},t\right) \), in Eq. (8.4). In all cases, the first-order deviations from equilibrium were assumed to be much smaller than the equilibrium values (e.g., p1 ≪ pm).
This order expansion will now be extended to keep track of the effects of nonlinearity on propagation. For example, the particle velocity will be represented as the sum of the fluid’s mean equilibrium velocity, vm, and the deviations from equilibrium that are proportional to successively higher powers of such deviations. These deviations will be subscripted to indicate their dependence on the amplitude of the disturbance. A subscript of “1” will indicate a first-order contribution that is linear in the amplitude of the disturbance. A subscript of “2” will indicate a second-order contribution that is quadratic in the amplitude of the disturbance or is the product of two first-order contributions, possibly produced by the interaction of two different waves.
Since our attention will be focused on one-dimensional propagation, x does not need to be a vector and because the fluids will not be subjected to any externally imposed mean flow, vm(x) = 0. As was the case for linear acoustics, the first-order contribution to the acoustical deviation from equilibrium, v1(x, t), will be proportional to the amplitude of the disturbance from equilibrium. The second-order contribution, v2(x, t), will be proportional to the square of the amplitude of the disturbance from equilibrium or to the product of two first-order disturbances, etc.
It will also be assumed that these individual contributions are “well ordered,” in that each successive higher-order contribution will be smaller than its lower-ordered neighbor. In the case of particle velocity, all contributions will also be significantly smaller than the thermodynamic sound speed, co, in the weak shock limit.
2.2 Trigonometric Expansion of the Earnshaw Solution
The analysis of the distortion of an initially sinusoidal sound wave can generate a second-order correction by allowing the speed of sound to be dependent upon the amplitude of the disturbance. This result was first exploited by Earnshaw (1805–1888) and was published in 1860 [22].
Here, Earnshaw solved the for a wave launched by a piston located at x = 0 that has a displacement, X(t), and velocity u(t) = dX/dt. The parameter, ϕ, represents the time a given point on a waveform left the piston’s face. Earnshaw was also the first to show that Γgas = (γ + 1)/2, for a sound wave in an gas obeying the Adiabatic Gas Law, as we did in Eq. (15.13).
We can exploit Earnshaw’s insight to calculate the growth of the second harmonic by successive approximation [23] if the initial disturbance is assumed to be a single-frequency, rightward traveling wave with an initial particle velocity amplitude, v′.
A second-order contribution will be generated by substitution of the “local” sound speed, as expressed in Eq. (15.9), for the thermodynamic sound speed that appears in Eq. (15.32), as was expressed by Earnshaw in Eq. (15.31).
In the weak shock limit, Mac = v1/co ≪ 1, so the denominator of the argument of the cosine function can be approximated by its binominal expansion.
The trigonometric identity for the cosine of the sum of two angles, a and b, is cosω(a + b) = cos (ωa) cos (ωb) − sin (ωa) sin (ωb). That identity can be used to separate Eq. (15.34) into two terms.
Since v1 (x, t) was defined in Eq. (15.32), the first-order terms on both sides of Eq. (15.35) can be eliminated so that only the second-order contribution remains. The first-order contribution can also be substituted into the second-order expression.
Using the double-angle sine identity, sin(2a) = 2 sin (a) cos (a), it becomes clear that the trigonometric product introduces a second harmonic component that grows linearly with distance, x, scaled by the wavelength, λ, and is proportional to the square of the initial amplitude, (v’)2.
The assumption regarding the relative amplitude of the terms in the order expansion, as asserted in Eq. (15.30), will be violated before |v2| = |v1|. To determine the limit of this solution’s applicability, those amplitudes can be equated to determine a distance, x1=2, before which this assumption would be violated.
It is not surprising that this approximation would fail at a distance that is less than twice the shock inception distance, DS. It is also true that this solution assumes that energy is transferred to the second harmonic with no reduction in the amplitude of the fundamental. That is clearly not possible, since the energy that appears as the second harmonic contribution was provided by the energy in the fundamental. The subsequent analysis will correct that difficulty.
2.3 Higher Harmonic Generation
It would be possible to continue the successive approximation procedure to calculate successively higher harmonics, but that procedure would quickly become algebraically messy. A simple and more intuitive approach is to use Eq. (15.9) to incorporate the local sound speed to deform the wave, as was done initially for shallow-water gravity waves in Fig. 15.3, and then simply use Fourier analysis to extract the amplitudes of the harmonics [24].
An undistorted wave can be parameterized by making its amplitude, y, be a function of a parameter, θ: y = sin (θ). To distort the wave, the plotted position can be advanced by an amount related to the propagation distance, d, scaled by the shock inception distance, DS.
In Fig. 15.9, one-half of a sine function has been plotted on the x axis at two different advanced locations in Eq. (15.40).

One-half-cycle of nonlinear distortion. The solid line is the undistorted (sinusoidal) waveform. The dashed line represents the waveform that has propagated to the shock inception distance, σ = x/DS < 1. The dotted line represents the waveform that has propagated to one-half the shock inception distance
There is no additional information provided by the negative half-cycle, so the harmonic content of the distorted waveform can be Fourier analyzed between 0 ≤ θ < π.
The Fourier coefficients can be projected to obtain the amplitudes of the harmonics using the same procedure as applied to vibrating strings in Sect. 3.5.
Using the integral definition of Bessel functions of the 1st kind in Eq. (C.26), Eq. (15.41) can be expressed as the sum of four Bessel functions.
Two successive applications of the recurrence relations in Eqs. (C.27) and (C.28) reduce the expression for the harmonic amplitude coefficients, Cn, to the compact form in Eq. (15.43), which is plotted in Fig. 15.10.

Fourier coefficients for a nonlinearly distorted sinusoidal wave as a function of the scaled propagation distance, σ = x/DS. The solid line is the amplitude of the fundamental at f1 that should be read from the left-hand axis. The long-dashed line is the second harmonic amplitude, C2, at f2 = 2f1, the narrow-dashed line is the third harmonic amplitude, C3, at f3 = 3f1, and the dotted line is the fourth harmonic amplitude, C4, at f4 = 4f1. All Cn for n > 1 should be read from the right-hand axis
This result was originally obtained using algebraic methods by Fubini-Ghiron in 1935 [25].
The initial growth rate of the harmonics with propagation distance can be appreciated by expansion of the Bessel functions for small values of their arguments, nσ, as expressed in Eq. (C.12). As shown in Eq. (C.14), the J1(x) Bessel function increases linearly with x = nσ. By Eq. (15.43), C1 ∝ J1(σ)/(σ) so it is initially independent of distance. One nice feature of this solution is that as the higher harmonic amplitudes grow, the amplitude of the fundamental decreases. At d = DS, the amplitude of the fundamental is only 88% of its original value.
The first terms in the expansion of the higher-order Bessel functions, Jn (x), all are proportional to xn. As per Eq. (15.43), each Bessel function is divided by x = (nσ), so that each amplitude coefficient increases in proportion to the (n−1) power of the scaled distance, σ = x/DS. This behavior is evident in Fig. 15.10. The second harmonic amplitude, C2, initially grows linearly with distance, just as predicted by Airy [23] in the solution by successive approximation that led to Eq. (15.37). The third harmonic amplitude, C3, has an initially quadratic dependence on distance, and the fourth harmonic amplitude, C4, has an initially cubic dependence on the propagation distance.
A calculation by Fay [26] that included dissipation also produced an expression for the harmonic amplitudes, Bn, that describe a stabilized waveform where the Gol’dberg number includes thermoviscous attenuation, αT-V, in Eq. (14.29).
Note that the Fay solution produces the (stable) sawtooth waveform of Fig. 15.8 for distances that satisfy G ≫ n(1 + σ), where the hyperbolic sine function can be replaced by its argument to produce the Fourier amplitude coefficients of a sawtooth waveform (see Fig. 1.22 and Chap. 1, Prob. 12), \( {B}_n^{sawtooth}=2/n\left(1+\sigma \right) \). As shown by Blackstock [27], the Fay result for the harmonic amplitudes does not reduce to those of Fubini in Eq. (15.43), in the limit of vanishing viscosity since the Fubini coefficients are valid near the source, σ ≤ 1, and the Fay coefficients in Eq. (15.44) are valid in the sawtooth region, σ ≥ 3. Blackstock provides a solution that connects those two regimes in his paper that has become known as the “Blackstock bridging function.”
3 The Phenomenological Model
Hydrodynamics provides a complete description of the propagation of sound in fluids. All of the nonlinear behavior that has been introduced in this chapter thus far should be derivable from that hydrodynamic description. As will be demonstrated now, the hydrodynamic approach will also provide additional insights and motivate the description of additional nonlinear phenomena.
As discussed in Sect. 7.3, the dynamics of a single-component homogeneous fluid can be described by two thermodynamic variables (e.g., ρ and s or p and T) and the three components of the velocity field.
As before, vx is the x component of velocity, and \( {\hat{e}}_x \) is the unit vector in the x direction. The “system” is “closed” if there are five independent conservation equations that relate the variables to each other. Those equations should be familiar by now and are reproduced below:
The form of the entropy Eq. (15.47) is rather more general than will be required but includes the square of the viscous shear tensor, Φ, and the bulk viscosity, ζ, along with thermal conductivity, κ, all as potential sources of entropy production.
As before, those conservation laws contain both p and ρ as (mechanical) thermodynamic variables, so that an equation of state, p = p(ρ, s), describing each individual fluid’s properties, is required to “close” the set. In the absence of dissipation (i.e., κ = μ = ζ = 0), the equation of state can be combined with the continuity Eq. (15.46), and the entropy conservation Eq. (15.47) to demonstrate that the entropy will be conserved.
This simplifies the expansion of the equation of state in terms of the density deviation, ρ′ = ρ − ρm, since all of the derivatives can be evaluated at constant entropy.
3.1 The (Nondissipative) Nonlinear Wave Equation
As with Earnshaw’s solution and the calculation of the harmonic amplitude components in the weak shock limit, this analysis will be restricted to one-dimensional propagation (i.e., vy = vz = 0), but at this point, there is no penalty for retaining the vector velocity for evaluation of the hydrodynamic equations and the equation of state up to terms of second-order in the deviation from equilibrium.
The first-order wave equation is homogeneous.
The first-order terms from Sect. 7.2 that were combined to produce that linear wave equation can be subtracted from the combination of Eqs. (15.51), (15.52), and (15.53) to leave a wave equation for the space-time evolution of the second-order sound fields.Footnote 7
This wave equation for the second-order deviations of the density from equilibrium is not homogeneous; it has a source term that is driven by quadratic combinations of the first-order sound fields. Using the Euler relation for the first-order fields and Eq. (15.10), this second-order wave equation can be re-written in a more familiar form for plane progressive waves.
Not surprisingly, the strength of this nonlinear source term is proportional to the Grüneisen parameter, Γ.
3.2 Geometrical Resonance (Phase Matching)
The second-order wave equation should reproduce the results obtained for second harmonic distortion in the weak shock limit that were generated by the trigonometric expansion of Earnshaw’s solution. That result can be recaptured by squaring the right-going sinusoidal traveling wave, ρ1 = ρ′ cos (ωt − kx), and then inserting it into the source term on the right-hand side of Eq. (15.56).
The constant will disappear upon operation by the Laplacian, but the cos2(ω t − kx) term will drive the second-order wave equation. What is crucially important is the recognition that the phase speed of the source term, cph = 2ω/2k, is identical to the phase speed of the second-order density deviations, ρ2, which propagates with speed, \( {c}_o=\sqrt{{\left(\partial p/\partial \rho \right)}_s} \).
This correspondence between the phase speed of the source and the phase speed of the disturbance it creates is called geometric resonance. In this case, the wavevectors representing the first- and second-order fields, \( {\overrightarrow{k}}_1\;\mathrm{and}\;{\overrightarrow{k}}_2 \), are colinear. Considering this process as the first-order wave’s interaction with itself, the geometric resonance for these colinear propagation directions can be expressed as a wavevector sum.
Each infinitesimal fluid volume that is excited by quadratic combinations of the first-order sound fields can be considered a source for the second-order sound field. In Fig. 15.11, those fluid volumes are represented by individual loudspeakers with amplitudes that are proportional to ρ′2. Because the phase velocity is also the thermodynamic sound speed, co, each of those “virtual loudspeakers” produces sound that sums in just the same way as the discrete end-fire line array in Sect. 12.7.1. When the sound radiated by the first virtual loudspeaker propagates to the position of the second, the two will be in-phase, and their amplitudes will add coherently. The sum then propagates to the third location and adds in-phase and so on. This coherent addition along the direction of propagation produces the linear growth in the second harmonic’s amplitude that was described in Eqs. (15.37) and (15.43), as well as in Fig. 15.10. It also demonstrates the corresponding quadratic dependence on the amplitude of the first-order field at any location.

Conceptual representation of the linear growth of the amplitude of the second harmonic with distance produced by the inhomogeneous source term that drives the wave equation for the second-order acoustic density deviations expressed in Eq. (15.56). The original pump-wave source “loudspeaker” is shown in bold lines and bold fonts at the far left of this figure
3.3 Intermodulation Distortion and the Parametric End-Fire Array
The distortion of a single, initially sinusoidal plane wave is due to the wave’s own influence on the medium through which it is propagating. The formalism of Eq. (15.56) makes it convenient to consider the nonlinear interaction of two plane waves propagating in the same direction but having different frequencies, ω↓ and ω↑. For simplicity, let both sound waves have equal amplitudes, ρ1.
At the linear level, they create a sound field that is simply their superposition.
The nonlinear source term in Eq. (15.56) is driven by the square of that linear superposition. Letting a = (ω↓t − k↓x) and b = (ω↑t − k↑x), the drive can be expressed as the sum of five contributions.
Again, the constant term in the square brackets will be eliminated from the driving term by the Laplacian in Eq. (15.56). The (2a) and (2b) terms represent the second harmonic distortion of the individual wave produced by their self-interaction. The sum and difference terms, cos(a + b) and cos (a − b), are called intermodulation distortion products and represent the effect that one wave has on the medium that the other wave is passing through.
Having already analyzed the self-distortion that creates the second harmonic distortion, our interest will now be focused on two interacting waves. Those interacting waves will be called the pump waves or primary waves. We will assume that their frequencies are closely spaced: |ω↑ − ω↓| ≪ (ω↑ + ω↓)/2. These two colinear waves, as well as the products of their nonlinear interactions, are still all in geometric resonance.
In the absence of dispersion, if the two waves are not colinear, then the phase matching that is the consequence of geometrical resonance does not occur, and the interaction does not produce waves that propagate beyond the interaction volume [28].
Since the two “pump” or “primary” waves are assumed to be close in frequency, they have about the same thermoviscous spatial attenuation coefficient, αT-V, resulting in a characteristic exponential decay distance, ℓ = (αT-V)−1, as identified before in Sect. 15.1.3 for definition of the Gol’dberg number. Since the bulk attenuation coefficient is proportional to the square of the frequency, the two self-distorted second harmonic components will suffer exponential decay over a distance that is only one-fourth of ℓ, as will the wave that is produced by the nonlinear interaction that creates a wave at the sum of the two pump frequencies. The exponential decay of either of the pump waves is represented symbolically in Fig. 10.12 (Left). The growth and subsequent exponential decay of the second harmonics and sum waves are represented symbolically in Fig. 10.12 (right).
Although the waveform instability caused by nonlinear distortion had been understood since the time of the American Civil War, it was not until 1963 that Peter Westervelt recognized that highly directional receivers and transmitters of sound may be constructed by use of the nonlinearity in the equations of hydrodynamicsFootnote 8 [29]. Although it had been known, both theoretically [30] and experimentally [31], that two plane waves of different frequencies propagating in the same direction generate two new waves at the sum and difference frequencies, it was not until Westervelt’s paper that the practical utility of that difference-frequency wave was recognized.
As we know from the analysis of the radiation from baffled circular pistons in Sect. 12.8, it is impossible to produce a narrow (i.e., directional) sound beam if the circumference of the radiating piston, 2πa, is on the order of the wavelength, λ, of the sound being radiated, or smaller. This makes it impossible to produce a directional sound beam at low frequencies from small vibrating surfaces. On the other hand, if 2πa ≫ λ, then the radiated sound will be confined to a narrow beam as quantified in Eq. (12.108). Westervelt recognized that it was possible to use nonlinear acoustics to create a narrow low-frequency beam through the interaction of two narrow high-frequency, high-amplitude sound beams of slightly different frequencies. If the high-frequency beams interacted over a distance that was much longer than the difference frequency wavelength, λdiff = 2πco/(ω↑ − ω↓), then the virtual array, like that depicted symbolically in Fig. 15.11, would produce a directional low-frequency sound beam.
As long as the attenuation distance for the pump waves is longer than the wavelength of the difference frequency wave, the difference frequency will be produced by the end-fire linear array from the nonlinear interaction of the two pump waves and will have the directionality characteristic of the pump wave’s directionality (see Fig. 15.15). The growth of the difference frequency wave will initially be linear with distance (as it was for the second harmonic distortion derived in Sect. 15.2.2), but due to the attenuation of the higher-frequency pump waves, depicted symbolically in Fig. 15.12 (left), the difference wave will reach some limiting amplitude as shown in Fig. 15.13.

(Left) Symbolic representation of the exponential decay of the one-dimensional pump wave due to thermoviscous attenuation. (Right) Symbolic representation of the growth and subsequent decay of the second harmonic and sum waves generated by nonlinear processes. Since the frequencies of the second harmonics and the sum wave are approximately twice that of the pump waves, the decay of these nonlinear products takes place over a characteristic exponential decay distance that is one-fourth of that for the pump waves

A directional low-frequency “difference wave” can be created by the nonlinear interaction of two “pump” waves of slightly different frequency, like the wave shown in Fig. 15.12 (left). Since the pump wave attenuates with distance from the source, the difference-frequency wave amplitude initially increases linearly with distance from the source but eventually reaches a maximum amplitude before attenuating or spreading at greater distances
An array consisting of 30 40 kHz piezoelectric transducers, shown in Fig. 15.14, was built to demonstrate the directionality of the difference-frequency beam. Fifteen of the transducers were wired electrically in parallel and driven at ω↓/2π= 37.5 kHz, and the other 15 were wired in parallel and driven at ω↑/2π=39.5 kHz to produce a parametric array that would create a difference wave at (ω↑ − ω↓)/2π= 2.0 kHz. These two sub-arrays were interlaced so that the nearest neighbors to any transducers driven at one of the frequencies would radiate at the other frequency.

Photograph of an array of 30 small piezoelectric transducers that is 5 cm tall and 21 cm wide. The array was wired as two interlaced 15-element sub-arrays. One sub-array was driven at ω↓/2π= 37.5 kHz and the other at ω↑/2π=39.5 kHz to produce a difference-frequency wave at (ω↑ − ω↓)/2π= 2.0 kHz. [Transducer and photo courtesy of T. B. Gabrielson]
That array is shown in Fig. 15.14. It has a height, h = 5 cm, and width, w = 21 cm. This produces a circular-equivalent effective radius, aeff = (h + w)/π ≅ 8 cm. At 40 kHz, the pump wavelength is λpump ≅ 0.9 cm, so kaeff ≅ 60, making the pump waves very directional at that frequency. Using the directionality for a baffled piston in Eq. (12.108), the pump wave’s major lobe is confined within about ±3.6°. Since the array is rectangular rather than circular, the 40 kHz beam will be wider than this circular approximation in the vertical direction and narrower in the horizontal direction.
The attenuation of a 40 kHz sound wave in air is strongly dependent upon humidity (see Fig. 14.5). In dry air, the exponential absorption length, ℓ (0% RH) = 23 m, while for a relative humidity of 60%, ℓ (60% RH) = 2 m. The pump amplitude, p1 ≅ 20 Pa, so by Eq. (15.15), the shock inception distance is DS = 8 m, assuming no spreading. A conservative estimate of the effective low-frequency end-fire array length, deff, might be 2 m, making the virtual line array’s value of kdiff deff ≅ 36 for the 2.0 kHz difference-frequency wave.
Although the directionality that can be achieved by the parametric array in this example is impressive, the electroacoustic energy conversion efficiency is very poor. The difference-frequency acoustic pressure amplitude, measured at 4 m from the source, was p2 = 0.14 Pa ≅ 74 dB re: 20 μParms. At that distance, the beam’s cross-section was about 1 m2. The intensity corresponding to p2 = 0.14 Pa is 22 μW/m2. The electrical input power to the array was about 18 watts, so the net electroacoustic conversion efficiency is just about one-part-per-million or approximately 0.0001%.
This increase in difference-frequency directionality and the low conversion efficiency is illustrated in the directionality plots in Fig. 15.15 for a parametric end-fire array operating at pump frequencies of 22 kHz and 27 kHz to produce a 5 kHz difference-frequency wave in water. The efficiency is better than in air due to the higher value of Γ in water and the higher acoustic pressures that could be produced, but the ratio of the amplitude of the difference-frequency to the pump is quite low, as demonstrated when both the pump and the difference frequency waves are plotted together in Fig. 15.15 (left). The smaller-amplitude difference-frequency wave’s directionality is plotted by itself in Fig. 15.15 (right). Comparison of the two graphs shows that the difference-frequency beam is only slightly wider than the pump frequency beams.

(Left) The directionality of the pump and of the difference-frequency waves is plotted on the same scale. (Right) When the directionality of the difference-frequency wave is plotted by itself, it is clear that the directionality of the difference-frequency wave is only slightly broader than the directionality of the pump waves
The low conversion efficiencies of the parametric array are deemed acceptable for some niche applications. Parametric arrays for use in air are being produced commercially, but I have some trepidation about the possibility of detrimental physiological effects due to the very high pump-wave amplitudes at frequencies that are above the normal range of human hearing. I’m not of the opinion that “what you can’t hear, can’t hurt you.”
The ubiquity of such commercially available parametric arrays that are used to produce directional sound in air (i.e., “audio spotlights”) has renewed interest in the potentially detrimental health effects of high-amplitude ultrasound exposure and led to the publication of a Special Issue of the Journal of the Acoustical Society of America that is focused on this subject [32].
We are currently in the undesirable situation where a member of the public can purchase a $20 device that can be used to expose another human to sound pressure levels that are > 50 dB in excess of the maximum permissible levels for public exposure.
Concern has been exacerbated by reports of the “weaponization” of high-amplitude ultrasound that may have been used to injure diplomats at the US Embassy in Havana, Cuba [33], and elsewhere [34].
When I make measurements near such an ultrasound source (e.g., Fig. 15.14), I wear ear plugs and place sound-attenuating earmuffs over my plugged ears. Other experimentalists who have not taken such precautions have exhibited symptoms like dizziness and nausea.
3.4 Resonant Mode Conversion
So far, the concept of geometrical resonance has restricted the evolution of harmonic distortion or the production of sum and difference waves to media that do not exhibit significant dispersion, as indicated by Eq. (15.61). If there is dispersion, so dco/df ≠ 0, then the some portions of the virtual array will start to become out-of-phase with other portions, and the uniform linear increase in amplitude with distance will become instead a “beating” where the amplitude would start growing and then start diminishing, possibly repeating that alternation if the interaction length were sufficiently long, as some portions of the virtual array subtract from the growth produced by other portions.
In this sub-section, two beams that are not colinear are allowed to interact to produce another wave that travels at a different speed. That beating is illustrated by the measurements made in a waveguide of rectangular cross-section, made by Hamilton and TenCate [38], shown in Fig. 15.16.

The difference frequency amplitude vs. distance along a waveguide showing the “beating” created by the dispersion caused by the waveguide’s frequency-dependent phase speed when the difference frequency, f2 = 165 Hz, propagates as a plane wave and the two pump waves, at f1 = 2900 Hz and f− = 2735 Hz, propagate in the lowest-frequency non-plane wave mode [38]
If the propagation speed of the nonlinear product is greater than the propagation speed of the pumps and if the pump wavevectors are not colinear, there can be geometrical resonance (i.e., phase matching) at a unique interaction angle. I like to call this a “scissors effect.” If we assume that there are two waves of the same frequency, ω↑ = ω↓ = ω, but their wavevectors make a relative angle, θ, with each other, then the phase speed of the “sum” wave will be higher than the phase speed of either pump (primary) wave. This simple geometry is illustrated in Fig. 15.17.

Two pump waves of the same frequency interact at an angle, θ. If θ ≠ 0°, the vector sum of their wavevectors will be less than the sums of their wavenumbers
This is similar to a scissors in that the speed of the intersection of the two blades moves faster than the speed at which the tips of the blades approach each other.
As introduced in Sect. 5.1.1, the speed of longitudinal waves in bulk solids is \( {c}_L=\sqrt{D/\rho } \), where D is the dilatational modulus, also known as the modulus of unilateral compression (see Sect. 4.2.2). Shear waves in bulk isotropic solids propagate at the shear wave speed, \( {c}_S=\sqrt{G/\rho } \), where G is the material’s shear modulus (see Sect. 4.2.3). The relationship between the moduli of any isotropic solid, summarized in Table 4.1, allows the relationship between those two sound speeds to be expressed in terms of the solid’s Poisson’s ratio, ν, and its Young’s modulus, E.
The stability criterion discussed in Sect. 4.2.3 restricts positive values of Poisson’s ratio to ν < ½, thus guaranteeing that cL > cS.
Based on the phase speed increase calculated for the interaction of two waves that are not colinear in Eq. (15.62) and the fact that cL > cS, it would be possible to have two shear waves interact though nonlinearity to produce the faster longitudinal wave where the mode-conversion interaction angle, θmc, is determined by the Poisson’s ratio of the solid in which the two shear waves are interacting.
For polycrystalline aluminum, νAl = 0.345 [35], so cos (θmc /2) = 0.486. The required angle between the two shear wavevectors in aluminum must be θmc = 122° to make the interaction phase speed in Eq. (15.62) satisfies geometrical resonance for nonlinear mode conversion that couples two shear waves, each at frequency, ω, to a longitudinal wave with frequency 2ω.
Resonant mode conversion in solids was first described theoretically by Jones and Kobett [36] and observed experimentally shortly thereafter in aluminum, by Rollins, Taylor, and Todd, at the interaction angle predicted in Eq. (15.64) [37].
Another opportunity for resonant mode conversion is afforded by inspection of Fig. 15.5. From 1 K to 2 K, second (thermal) sound has a speed, c2, of about 20 m/s, while the speed of first (compressional) sound, c1, is around 230 m/s. Two second sound waves that are almost anti-colinear could have an interaction phase speed equal to that of first sound. Using the geometry of Fig. 15.16, the mode conversion half-angle, at temperatures below Tλ = 2.172 K, depends upon the velocity ratio.
This suggests that θmc will be close to 180°.
A waveguide of rectangular cross-section affords an ideal geometry to provide a long interaction length while also affording precise control of the mode conversion angle for two plane waves of second sound. In a waveguide, the interaction angle of the two traveling plane waves (see Fig. 13.23) is controlled by the ratio of the drive frequency to the cut-off frequency. From Fig. 15.17 and Eq. (13.69), the mode-conversion interaction half-angle, θmc/2, is related to the ratio of the second sound drive frequency, ω, to the cut-off frequency of the waveguide’s first non-plane wave mode, ωco.
As shown in Fig. 15.18, if the height of the waveguide is ℓz, then the cut-off frequency would correspond to a single half-wavelength of second sound being equal to the waveguide’s height: ωco = πc2/ℓz. Substitution of Eq. (15.65) into Eq. (15.66) determines the ratio of the second sound frequency necessary for resonant mode conversion, ωmc, to the waveguide’s cut-off frequency, ωco.

A waveguide can provide precise control of the interaction angle, θ, of the two second sound traveling plane waves that satisfy the waveguide’s boundary conditions, since the ratio of the frequency to the cut-off frequency controls the interaction angle
Of course, it is necessary to do this experiment in superfluid helium at temperatures below Tλ, since second sound provides the pump (primary) waves, as well as to have an adequate nonlinear interaction length to observe this resonant mode conversion of second sound to first sound. Those two constraints led to the use of a spiral waveguide shown in Fig. 15.18 (left). Sum and difference waves generated by non-colinear waves in an air-filled waveguide of rectangular cross-section that were not geometrically resonant are shown in Fig. 15.16 that were measured by Hamilton and TenCate [38].
Landau’s two-fluid description of superfluid helium requires eight variables [39]. In addition to the two thermodynamic variables, two separate velocity fields are necessary to describe the motion of the superfluid component and of the normal fluid component, \( {\overrightarrow{v}}_s\kern0.5em \mathrm{and}\kern0.5em {\overrightarrow{v}}_n \). This makes the second-order wave equation for the nonlinear acoustic interactions more complicated than Eq. (15.56), but the inhomogeneous form, which provides a wave Eq. (15.68) to describe the space-time evolution of the second-order pressure, p2, is still driven by quadratic combinations of the first-order sound fields produced by first sound (\( {v}_1^2\kern0.5em \mathrm{and}\kern0.5em {p}_1^2 \)), second sound(\( {T}_1^2\kern0.5em \mathrm{and}\kern0.5em {w}_1^2 \)), or their interaction (p1T1) [15].
Since there are two velocity fields, Eq. (15.68) expresses the fluid’s motion in terms of the center-of-mass velocity, \( \overrightarrow{v} \), which is nearly zero for second sound and \( \overrightarrow{w}={\overrightarrow{v}}_n-{\overrightarrow{v}}_s \), which is nearly zero for first sound. Because w2 is a Galilean invariant (i.e., its value is not dependent on the motion of the coordinate system), it is also a thermodynamic variable, as evidenced by the partial derivative in the final term in Eq. (15.68).
Resonant mode conversion of second sound to first sound was observed experimentally from 1.15 K < Tm < 2.0 K using the spiral waveguide and heater shown in Fig. 15.19 (Right) [40].

(Left) A spiral waveguide shown with the lid that housed the first and second sound sensors (microphones) removed. The depth of the waveguide, Lz = 14.73 mm, and the width, Ly = 4.8 mm. The edge length of the square block into which the spiral groove was cut is 12.7 cm. The total length of the spiral is 150 cm, and a wedge absorber, visible near the waveguide’s center, occupies the final 60 cm. (Right) Second sound is generated by periodically heating the superfluid. This heater consists of two individual NiCr resistance wire elements with a nearly sinusoidal profile to optimize coupling to the first non-plane waveguide (height) mode. Due to the frequency doubling produced when the heaters are driven with an AC current, the two heater halves were driven 90° out-of-phase (electrically) at one-half the mode conversion frequency
4 Non-zero Time-Averaged Effects
Nonlinear acoustical effects are driven by quadratic combinations of first-order sound fields. When the first-order sound field was squared to produce Eq. (15.57), the constant term was ignored because it was operated upon by a Laplacian to produce the virtual sources that drove the inhomogeneous wave equation for the propagation of the second-order sound field. In this sub-section, the effects of that constant term will be explored, first with a focus on the square of the first-order particle velocity, v1, initially restricting our analysis to one-dimensional propagating plane waves.
Since the first-order acoustic fields have a sinusoidal time dependence, their time-averaged values must vanish over times that are long compared to the periods of such disturbances, T ≫ 2π/ω.
The second-order terms, like the squared velocity in Eq. (15.69), that contain a constant term, will produce time-averaged second-order pressures that will not vanish: 〈p2〉t ≠ 0. These second-order non-zero time-averaged pressures can produce substantial forces [41] and torques [42] on objects that are within the sound field. As early as the 1940s, Hillary St. Clair was able to levitate copper pennies (ρCu = 8.9 gm/cm3) [43]. Using an intense sound field produced by a siren and a reflector, Allen and Rudnick were able to repeat St. Clair’s demonstration:
“When a number of pennies are placed on a stretched silk screen, the parameters can be so adjusted that the pennies do somersaults with “Rockette“-like precision; or so that a penny can be made to rise slowly to a vertical position, appearing all the while to be supporting, acrobatically, another which finally assumes a horizontal position above the first penny touching rim to rim. Also, coins resting on the silk screen can be flipped a distance of a few feet by varying the frequency of the siren rapidly.” [44]
4.1 The Second-Order Pressure in an Adiabatic Compression
Nonlinear distortion, the generation of harmonics, and the “scattering of sound by sound” were attributed to the fact that a wave will modify the properties of the medium through which it is propagating. To start our investigation of non-zero time-averaged effects, it will be instructive to consider the piston of area, Apist, in a close-fitted cylinder that is filled with an ideal gas at equilibrium pressure, pm. With the piston in its equilibrium position, designated as x = 0, the equilibrium volume of the gas in the cylinder will be Vo = Apist L, where L is the length of the cylinder from the rigid end located at x = L to the piston’s equilibrium position. This arrangement is identical to that depicted schematically in Fig. 8.5.
If the gas inside the cylinder obeys the Adiabatic Gas Law and if the motion of the piston is sinusoidal, with the piston’s position given by x(t) = x1 sin (ω t), then the pressure within the cylinder will be uniform throughout and given by the Adiabatic Gas Law as long as \( \sqrt{A_{pist}}\ll \lambda /2\pi \kern0.5em ={c}_o/\omega \kern0.5em \mathrm{and}\kern0.5em L\ll {c}_o/\omega \), so that the cylinder can be treated as a “lumped element,” where \( {c}_o=\sqrt{{\left(\partial p/\partial \rho \right)}_s} \)is the speed of sound under equilibrium conditions.
This is the familiar “linear” result; a sinusoidal variation in the piston’s position leads to a sinusoidal variation of the pressure within the cylinder. Such a result assumes that x1/L ≪ 1, so the motion of the piston does not affect the volume, Vo, that appears in Eq. (15.71). Of course, that is not exactly true. As the ratio of x1 to L increases, the importance of the piston’s instantaneous position on the value of the volume of the gas becomes more influential. It is easy to take the change in the cylinder’s volume into account. When the piston moves inward, it sweeps out a volume, δV(t) = −Apist x(t), which should be subtracted from the equilibrium volume, Vo.
Taking the time-average of the pressure over a period, T, the linear term vanishes, but the quadratic term produces a non-zero time-averaged pressure, 〈p2〉t, since sin2(ω t) = ½[1 − sin (2ω t)].
The integral over the component oscillating at 2ω will vanish but the constant component will not. That time-averaged excess pressure will tend to push the piston away from the closed end of the cylinder. This effect produces “piston walk” in Stirling cycle machines.
This time-averaged pressure can be expressed in terms of the first-order pressure calculated in Eq. (15.71): \( {x}_1/L={p}_1/\gamma {p}_m={p}_1/{\rho}_m{c}_o^2 \), if the cylinder contains an ideal gas.
In this form, it is clear that the non-zero time-averaged pressure is quadratic in the first-order pressure. It is also useful to recognize that this result is equal to the potential energy density as derived from the energy conservation Eq. (10.35).
As with the results of weak shock theory in Sect. 15.2, it is the effects of the piston’s position on the volume that appears in the Adiabatic Gas Law of Eq. (15.72) that produces corrections to the linear result. The creation of a net second-order pressure is due to the asymmetry produced by the fact that the average volume on compression of a piston is smaller than the average volume during expansion.
Application of this result to a one-dimensional standing wave resonator is straightforward. Within the resonator, the first-order pressure can be written as \( {p}_1\left(x,t\right)=\mathit{\Re e}\left[\hat{\mathbf{p}}\cos \left( n\pi x/L\right){e}^{j\omega\;t}\right] \). Close to the end at x = 0, the first-order acoustic pressure is nearly independent of position, just as it is in the piston and cylinder example. By the Euler equation, the longitudinal particle velocity can be written as \( {v}_1\left(x,t\right)=\mathit{\Re e}\left[j\left(\hat{\mathbf{p}}/{\rho}_m{c}_o\right)\sin \left( n\pi x/L\right){e}^{j\omega\;t}\right]\equiv -{v}_1\sin \left( n\pi x/L\right)\sin \left(\omega\;t+\varphi \right) \), so the particle velocity goes linearly to zero as x goes to L, just as it does in the piston and cylinder example. This situation near to the rigid end of the resonator (or close to any standing wave pressure anti-node) can be represented by an imaginary line (i.e., a Lagrangian marker) that moves with the gas, acting as the piston while neglecting the remaining gas in the resonator.
In a sealed resonator, the total mass of the gas cannot change. If the static pressure at the rigid ends (as well as at any pressure anti-node for higher-order longitudinal modes of the resonator, n > 1) increases by the amount specified in Eq. (15.74), then the density of the gas must also increase in those locations. For that to happen in a sealed system, the gas density (and pressure) must decrease elsewhere.
In a standing wave, the amplitude of the gas particle velocity at a pressure node (velocity anti-node) is v1 = p1/ρmco, so if the total mass of the gas cannot change, then the non-zero, second-order, time-averaged pressure at the first-order pressure node must be equal and opposite to the value in Eq. (15.74) and can be re-written in terms of v1.
In this form, it is clear that the non-zero time-averaged pressure is quadratic in the first-order velocity amplitude. It is also useful to recognize that this result is equal to the kinetic energy density at the velocity anti-node as derived from the energy conservation Eq. (10.35). It also has the functional form of the Bernoulli pressure.
The relationship between the second-order time-averaged pressure [45], also known as the radiation pressure, and the kinetic and potential energy densities will be derived from the hydrodynamic equations in Sect. 15.4.4 after examining a few examples of the acoustical consequences produced by the Bernoulli pressure in the following sub-section and in Sect. 15.4.3.
4.2 The Bernoulli Pressure
The first introduction in this textbook to the Bernoulli pressureFootnote 9 was provided in the analysis of the Venturi tube (see Sect. 8.4.1) that was intended to aid in the understanding of the convective term in the total hydrodynamic derivative in Eq. (8.33). This resulted in the introduction of a pressure gradient produced in the tube that was driven by the square of the fluid’s velocity, v2.
Since the Bernoulli pressure is proportional to the square of the fluid’s velocity, it is independent of the direction of flow. For the oscillatory velocities that are produced by sound waves, this means that the time-averaged Bernoulli pressure will be non-zero.
The effects of the Bernoulli pressure for oscillatory flows produced by sound waves were recognized and understood by Lord Rayleigh. The Kundt’s tube was a popular piece of acoustic apparatus that produced high-amplitude standing waves by stroking a rod that would excite longitudinal vibrations and couple those vibrations to the air contained in a transparent glass tube [46]. Cork dust or lycopodium seeds were commonly used to visualize the sound field by “decorating” velocity anti-nodes. Figure 8.14 shows cork dust striations in the neck of a resonator that is excited in its Helmholtz mode, fo = 210 Hz (left), and at a frequency, f1 = 1240 Hz, that excited a half-wavelength standing wave in the neck (right) [47].
Rayleigh recognized that two small particles of sufficient mass to remain stationary within the oscillatory flow field, due to their inertia,Footnote 10 would be attracted to each other because the oscillatory air flow must accelerate as it passes between the constrictions produced by the adjacent particles. By Eq. (15.76), the increased fluid velocity between the particles results in a lower pressure so that the resultant pressure gradient would drive the particles together.
The figure taken from Rayleigh’s Theory of Sound that diagrams this attraction is shown in Fig. 15.20 (center). This effect, known as acoustic agglomeration, has been used in several applications where removal of larger clusters of smaller particles from a fluid is easier than the removal of smaller individual particles [48]. More recently, “acoustic agglomeration” has been used for separation of biological cells grown in bioreactors from their nutrient liquid [49].

Three figures taken from Rayleigh’s Theory of Sound, Vol. II [50]. (Left) In Fig. 54b, two particles are oriented along the direction of oscillatory flow indicated by the double-headed arrow. Since the flow is occluded between the two spheres, the time-averaged pressure is greater between the particles causing them to repel. (Center) When the same two particles are oriented normal to the oscillatory flow in Fig. 54c, the increase in the velocity between the two produces a lower pressure that causes the two particles to attract each other. (Right) A rigid disk is placed at 45° with respect to the oscillatory flow
Rayleigh makes a similar argument, as also illustrated in Fig. 15.20 (left), to explain the striations of the dust particles agglomerated in planes that are normal to the oscillatory flow. When two particles (or planes of particles) are separated along the direction of the oscillatory flow, the stagnation of the fluid between them produces an increase in the time-averaged pressure that causes the particles (or planes of particles) to repel each other, as clearly visible in the striations seen in Fig. 8.14.
Another interesting manifestation of the Bernoulli pressure was mentioned by Rayleigh in regard to the forces on a Helmholtz resonator. The fluid’s velocity in the neck of a Helmholtz resonator is high. Based on Eq. (15.76), this suggests that the pressure in the neck must be reduced. Since the neck is in direct contact with an effectively infinite reservoir of atmospheric pressure, the only means by which the required pressure difference can be maintained is if the static time-averaged pressure within the compliance (volume) of the Helmholtz resonator is greater than atmospheric pressure.
This second-order, acoustically induced pressure difference, 〈p2〉t, will lead to a net force on the Helmholtz resonator since the pressure on the surfaces of the volume are unbalanced over the cross-sectional area, \( \pi {a}_{neck}^2 \), of the neck:\( {F}_{net}=\pi {a}_{neck}^2{\left\langle {p}_2\left({v}_{neck}^2\right)\right\rangle}_t \).
“Among the phenomena of the second order which admit of a ready explanation, a prominent place must be assigned to the repulsion of resonators discovered independently by Dvořák [51] and Meyer [52]. These observers found that an air resonator of any kind when exposed to a powerful source experiences a force directed inwards from the mouth, somewhat after the manner of a rocket. A combination of four light resonators, mounted anemometer fashion upon a steel point, may be caused to revolve continuously.” [53]
Apparently, an acoustical demonstration of the nonlinear force on a resonator that resembles a lawn sprinkler, shown in Fig. 15.21, from [52], was well known to RaylTheir dimensionless eigh.Footnote 11 This effect can be observed in a quantitative way by placing a Helmholtz resonator on a sensitive balance and producing a large amplitude sound field in the vicinity using a loudspeaker driven at the Helmholtz resonance frequency and then observing the increase in the resonator’s apparent weight to do “the rocket.”

Apparatus drawing, taken from Dvořák [52], showing “four very light paper or glass [Helmholtz] resonators upon two wooden rods, o p, q r, crossing at right angles, and balanced on a glass cap; all the openings of the resonators fronting one side in the direction of tangents. The whole apparatus is placed before the opening, K, of the resonating box and fork, in the manner indicated”
4.3 The Rayleigh Disk
The Bernoulli pressure of Eq. (15.76) can also exert torques, \( N\left({v}_1^2\right) \), on an extended object placed in an oscillatory flow field. Rayleigh’s diagram of such a disk that is aligned at about 45° with respect to the flow field is shown in Fig. 15.20 (right). That figure captures the flow at an instant when it is moving from right to left, as indicated by the arrows. The approaching flow stagnates between A and B where it diverges, and the receding flow stagnates on the other side of the disk between C and Q where it rejoins. On the inflow side of the desk, the flow must accelerate along A-Q-C as the two flows converge on the outflow side at P. The stagnant flow between A and B on the inflow side and between C and Q on the outflow side has a higher pressure than the faster-moving flows at the same locations on the opposite sides of the disk. This produces a net torque that tends to orient the disk perpendicular to the flow, regardless of the flow direction.
An appreciation for the magnitude of this torque can be obtained by calculation of the moment of the Bernoulli pressure in Eq. (15.76) over both sides of a disk having radius, a, assuming the presence of the disk does not perturb the sound field.Footnote 12 The circle in Fig. 4.11 that was used to calculate the radius of gyration for beam flexure will provide the coordinate system for this integration.
If the disk is assumed to be suspended by a torsion fiber in the oscillatory flow, then the torque will be zero when the surface of the disk is perpendicular to the flow or when the surface of the disk is aligned with the flow. If the angle between the normal to the disk’s surface is designated θ, then the torque will be zero when θ = 0° (occluding the flow) or when θ = 90° (aligned with the flow), except that the θ = 90° orientation will be unstable. If the disk is aligned with the flow and its orientation deviates slightly from θ = 90°, then the torque will cause the disk to seek the θ = 0° orientation. If the disk is in the θ = 0°, any small deviation in θ will subject the disk to a torque that will tend to restore the θ = 0° orientation.
Based on the magnitude of the torque in Eq. (15.77) and the previous stability argument, the torque as a function of the square of the time-averaged oscillatory velocity amplitude,\( {\left\langle {v}_1^2\right\rangle}_t \), and the orientation angle can be written in the form that appears in Theory of Sound, which Rayleigh attributes to König [54].
Rayleigh recognized that “Upon this principle an instrument may be constructed for measuring the intensities of aerial vibrations of selected pitch” and suggests that the disk be a mirror suspended by a silk thread so a light beam could be used as an optical lever (see Sect. 2.4.4) to determine the disk’s orientation [55].
Prior to the introduction of the reciprocity method for calibration of reversible transducers (see Sect. 10.7.2, 10.7.3 and 10.7.4), the Rayleigh disk was a primary technique for determination of acoustic sound field amplitudes [56]. Due to its importance, a detailed analysis of the torque was made by King to include corrections produced by the disk’s influence on the sound field [57]. The torque on a Rayleigh disk located at a velocity anti-node in a standing wave field included wavelength-dependent corrections for the disk’s mass, m1, as well as the disk’s hydrodynamic (inertial) entrained mass, mo = (8/3)ρma3, as calculated in Eq. (12.126).
The indifference of the sign of the torque produced by flow in either direction was important in establishing the physical reality of Landau’s two-fluid theory of superfluid hydrodynamics.5 As mentioned briefly in Sects. 15.1.2 and 15.3.4, there are two velocity fields necessary to characterize the dynamics of superfluid flow,\( {\overrightarrow{v}}_s\kern0.5em \mathrm{and}\kern0.5em {\overrightarrow{v}}_n \). In a thermally induced second sound wave, the superfluid’s center-of-mass velocity is zero, but the counterflow of \( {\overrightarrow{v}}_s\kern0.5em \mathrm{and}\kern0.5em {\overrightarrow{v}}_n \)is non-zero.
Since the Rayleigh disk responds to the torque of both flow fields without respect to their direction, Pellam and Hanson were able to establish the physical existence of both velocity fields and make the first mechanical measurement of second sound in superfluid helium [58]. Later, Koehler and Pellam were also able to measure the superfluid fraction, ρs/ρ, as a function of temperature using their Rayleigh disk [59]. Both measurements employed a mirror as the disk to detect the disk’s deflection optically. Later measurements of torques in superfluids used a nonoptical method to determine the Rayleigh disk’s orientation [60].
4.4 Radiation Pressure
Restricting attention to one dimension, the Bernoulli pressure can be derived from the Euler Eq. (15.48).
The goal will be to express Eq. (15.80) entirely in terms of the gradient of a scalar, so it is useful to introduce the specific enthalpy (heat) function (see Sect. 14.2), h = ε + pV, where ε is the fluid’s internal energy per unit volume (see Sect. 7.1.2): dε = dU/V.
Using the definition of the internal energy from Eq. (7.10), dε = T ds – p dV, the pressure gradient can be expressed in terms of the specific enthalpy, dh = dp/ρm, and the product rule can be invoked to consolidate the convective contribution.
Having started with the Euler equation, the effects of viscosity have already been eliminated, so the Kelvin circulation theorem guarantees that the velocity field will be curl free; thus it can be expressed as the gradient of a scalar, ϕ, known as the velocity potential: \( \overrightarrow{v}=\overrightarrow{\nabla}\phi \) [61].
Since the argument within the gradient in Eq. (15.83) is equal to zero, the function within the gradient must be a constant everywhere throughout the fluid.
This is the “strong” form of Bernoulli’s equation, since it is not restricted only to streamlines, as it was for the version introduced in Eq. (15.76).
To retain accuracy to second-order, the specific enthalpy must also be expanded to second-order.
These thermodynamic derivatives can be evaluated for adiabatic processes, dS = 0, from the differential form of the specific enthalpy: dh = T dS − dp/ρm.
In this sub-section, we are only interested in the parts of Eq. (15.86) which produce a non-zero time-average. As in Eq. (15.70), the time-average of first-order variations will vanish: 〈∂ϕ/∂t〉t = 〈p1〉t = 0.
The second-order time-averaged pressure is the difference between the potential and kinetic energy densities. In classical mechanics, that combination is known as the Lagrangian density [62].
For a collimated traveling wave of the usual form,Footnote 13 p1(x, t) = p1 cos (ω t − kx), the linearized Euler’s equation provides the ubiquitous relationship between the first-order acoustic field variables: p1 = ρmcov1. That relationship can then be substituted into Eq. (15.87).
This result is oddly both philosophically significant and trivially obvious. If there were an object in the traveling-wave field, it would scatter some portion of the sound (see Sects. 12.6.1 and 12.6.2), and the sum of the scattered and incident wave fields would produce a standing wave. If the field is entirely a traveling wave, then that wave field cannot include an “object” which would feel the force of a time-averaged second-order pressure based on the object’s density and/or compressibility contrast.
4.5 Acoustic Levitation in Standing Waves
The result for the time-averaged second-order pressure in Eq. (15.87) can also be evaluated for a standing wave.
Substitution of Eq. (15.89) into (15.87) produces the time-averaged second-order pressure distribution for a standing wave in an ideal gas where \( {\rho}_m{c}_o^2=\gamma {p}_m \).
A standing wave produces a time-averaged (i.e., static) second-order pressure distribution. Due to the spatial dependence on cos (2kx), there is a minimum in the second-order pressure at the location of each pressure node, thus at each velocity anti-node and a maximum one-quarter wavelength from that minimum. This is consistent with the second-order piston example used as an introduction to non-zero time-averaged effects in Sect. 15.4.1.
This second-order time-averaged pressure distribution produces pressure gradients that are fixed in space and time and will exert forces on solid objects of non-zero thickness. The force on an object at either the maximum or the minimum in 〈p2〉t will be zero, but that equilibrium will be unstable at the maximum. If a levitated object is displaced slightly from the maximum, it will be forced toward the minimum in 〈p2〉t that occurs at a first-order velocity anti-node which has the lowest pressure, due to Bernoulli.
The integrated pressure over a small sphere of radius, a ≪ λ, will produce a force, Fsphere, that is, a function of the sphere’s location in the standing wave field.
Rudnick provided a clever confirmation of this result in a simple standing wave tube that measured the angle of displacement of small spheres suspended by “a hair” due to the standing wave [63]. The integrated pressure over a small disk of thickness, t, and radius, a, will produce a force, Fdisk, that is, a function of the disk’s location
To levitate a small sphere made of a material with a mass density, ρsphere, against the force of gravity, the weight of the sphere must be cancelled by the levitation force. This requires that the square of the first-order standing wave pressure field amplitude, p′2, exceed a minimum value, \( {p^{\prime}}_{\mathrm{min}}^2 \).
When this criterion is satisfied, then the position of the sphere will adjust itself within the (vertical) standing wave field to make the net force on the sphere be zero at some location below a velocity anti-node. The stability of that equilibrium will be the subject of Sect. 15.4.6.
Of course, the levitated object does not have to be either a sphere or a disk. As shown in Fig. 15.22, almost any small object can be suspended against the force of gravity if the amplitude of the standing wave sound field is sufficient.

Clockwise from the top left are shown a ladybug, minnow, spider, and ant being levitated by intense standing waves in air. [Courtesy of Northwestern Polytechnical University in Xi’an, China]
4.6 Adiabatic Invariance and the Levitation Force
In the previous sub-section, the influence of the object being levitated by the standing wave on the response of the resonator was ignored. As will now be demonstrated, the perturbation of the resonator’s normal mode frequency caused by an object will provide an alternative method to predict the levitation force by use of adiabatic invariance and without the necessity of integrating the pressure gradient around the object. In the subsequent sub-section, the feedback between the radiation force and the object’s influence on the resonance frequency will also have significant impact on the stability of the levitated object in a resonator that is driven at a constant frequency.
Throughout this text, the concept of adiabatic invariance [64] has been utilized when it was convenient to relate changes in a system’s constraints (e.g., boundary conditions) to one or more of that system’s normal mode frequencies. Now adiabatic invariance will be applied in the same way (i.e., the “variable constraint” being the position of the object in the sound field) to a one-dimensional standing wave tube’s resonance frequencies that are perturbed by an incompressible obstacle that can be placed anywhere within the resonator of length, L, and cross-sectional area, A.
It is assumed that the obstacle of volume, V, shown as a small cube in Fig. 15.23 (left), has dimensions that are all much smaller than the wavelength, λn, of any normal mode of interest: \( \sqrt[3]{V}\ll {\lambda}_n \). Because the obstacle is located at a pressure anti-node (velocity node) in Fig. 15.23 (left), the excluded (incompressible) volume “stiffens” the gas springiness at that rigid end and raises the unperturbed (empty resonator) frequency, f1, of the fundamental (n = 1) mode:f1 = co/2L.

(Left) A small rigid obstacle (grey square) is placed adjacent to the rigid end of a one-dimensional standing wave resonator of length, L. (Right) That obstacle has been “melted” so that its entire volume (grey rectangle) has been preserved but is now distributed uniformly over the resonator’s cross-section, producing a decreased effective length, Leff
To estimate the increase in frequency caused by the obstacle when it is near a pressure anti-node (velocity node), we can use the same trick that simplified the calculation of the frequency shift caused by the deposition of a thin layer of gold that lowered the fundamental frequency of a quartz microbalance in Sect. 5.1.2 due to its additional mass loading. Let the cube be made of wax. If the wax were melted with the tube in the vertical orientation, then the volume of wax would remain unchanged, but it would be spread uniformly over the resonator’s endcap as shown in Fig. 15.23 (right). Since the slope of the pressure at the endcap is zero, the cube and slab versions of the obstacle produce the same stiffening of the gas (i.e., exclude the same amount of resonator volume). The perturbed frequency, f1′, is then that of the slightly shorter resonator shown in Fig. 15.23 (right): f1′ = co/2Leff.
If the same obstacle was moved to the center of the resonator, as shown in Fig. 15.24, then it would lower the resonance frequency below the unperturbed frequency, f1. This is because the obstacle has created a constriction in the resonator’s cross-sectional area, A, at a position within the fundamental mode that is located at a velocity anti-node (pressure node). The high-speed gas near the resonator’s midplane must accelerate to go around the obstacle, thus increasing the kinetic energy without affecting the potential energy stored at the ends of the resonator (see Sect. 13.3.4).

The same obstacle that was shown in Fig. 15.23 is now located at the center of the resonator. In that position, it lowers the frequency of the fundamental (n = 1) normal mode but raises the frequency of the second normal mode (n = 2)
By Rayleigh’s method (see Sect. 2.3.2), this means that the fundamental normal mode frequency must be reduced. The amount of that frequency reduction is dependent upon the shape of the obstacle, so it is not as easy to make a quantitative estimate of the frequency reduction as it was for the case where the incompressible obstacle was located at a pressure anti-node (velocity node). Fortunately, the use of adiabatic invariance provides a method to measure the effect of an obstacle of any shape and any location within the standing wave then relate that frequency shift produced to the levitation force, as described in the next sub-section.
For the resonator’s second mode (n = 2), the obstacle is located at a pressure anti-node and thus raises the resonance frequency of that mode. Again, since the resonator’s midplane contributes gas stiffness in the second mode (along with the gas stiffnesses at both ends), the volume exclusion produced by the obstacle increases the gas stiffness. The “melted wax” trick would work again by symmetry, treating the resonator as two half-resonators, each shortened by the appropriate amount: Leff/2 < L/2.
It is worthwhile to notice that when this obstacle is located at the center of the resonator, it has ruined the harmonicity of the modes of the closed-closed resonator of uniform cross-section: fn ≠ nf1. All of the n = odd modes will be “flattened” (b) (i.e., their normal mode frequencies will be lowered), and all of the n = even modes will be sharpened (#), as long as the \( \sqrt[3]{V}\ll {\lambda}_n \) constraint is satisfied so the obstacle can be consider to be “small.” This strategy is regularly employed to suppress the formation of shock waves in standing wave resonators that are used in high-amplitude applications like thermoacoustic refrigerators [65] and sonic compressors [66].
In previous applications of adiabatic invariance, the work that was done against (or by) the radiation pressure was used to estimate normal mode frequencies of resonators with shapes that did not conform to the 11 separable geometries (see Sect. 13.1). It will now be easy, using Eq. (15.87), to demonstrate the connection between frequency changes and work done against the radiation force. If the resonator, shown schematically in Fig. 15.25, has an initial length, L, the standing wave pressure distribution is related to the velocity distribution that satisfied the rigid (impenetrable) boundary conditions as provided in Eq. (15.89). Here, we will focus on the fundamental mode, n = 1.

A simple plane wave resonator with an adjustable left boundary position (piston)
The time-averaged energy in the first mode, E1, can be expressed as the time-average of the sum of the kinetic and potential energies, or by the virial theorem (Sect. 2.3.1), as the maximum potential energy,(PE)max, by integrating the potential energy density of Eq. (10.35) throughout the resonator’s volume.
The rightmost result again assumes an ideal gas. The radiation force on the piston at the left of Fig. 15.23 is given by Eq. (15.90). The work increment, dW, done by the piston against the radiation force is just the force, Frad = 〈p2〉tA, times the displacement, dx.
Adiabatic invariance requires that the ratio of the energy in a mode to its frequency remains constant if the system’s constraints are changed slowly (i.e., we don’t “jerk” the piston).
This is exactly the frequency change that would be due to a decrease in the resonator’s length by an amount, dx, based on the simplest result: f1 = co/2 L. In fact, the triviality of this result can be interpreted as a check on the expression (or a derivation) of the radiation pressure, 〈p2〉t, in Eqs. (15.87) and (15.90).
It is now possible to combine adiabatic invariance and the normal mode frequency change, related to the change in an obstacle’s position in a standing wave resonator, to calculate the levitation force from an alternative perspective [67]. A DeltaEC model of a resonator is provided in Fig. 15.26. The DeltaEC model makes use of a “Master-Slave Link” between Segments #2c and #6c that keeps the total length of the resonator fixed as the constriction, produced by Segments #3, #4, and #5, is moved from one end of the resonator to the other by changing the length of the DUCT in Seg. #2c from 0.0 m to 0.97 m.

Screenshot of a DeltaEC model of a resonator with cross-sectional area, A = 1.0 x 10⁻³m2, and length, L = 1.0 m, filled with dry air at 300 K and pm = 100 kPa. There is a constriction that reduces the cross-sectional area to 8.0 × 10⁻³ m2 that is 1.0 cm long and two transitions using CONE segments, each 1.0 cm long. That combination of two CONE segments and the constrictive DUCT (Seg. #4) can be positioned anywhere within the resonator. The “Master-Slave Link” in Segments #2c and #6c maintain the total length as the position of the constriction is moved when the DUCT length in Seg. #2c is changed. The “schematic view” at the top of this figure shows the center of the tapered constriction positioned 31.5 cm from the driven end
The resonance frequencies of the first and second standing waves that are plotted in Fig. 15.27 as a function of the constriction’s location were produced using DeltaEC’s incremental plotting function (see Sect. 8.6.12). Plots of the normal mode frequency shifts, similar to those in Fig. 15.27, appeared in the literature for the fundamental mode and for the n = 2 mode [68], although it was not recognized at that time that those shifts were related to the levitation forces by adiabatic invariance.

Resonance frequency of the resonator modeled by DeltaEC in Fig. 15.26 as a function of the position of a constriction that could represent the location of an incompressible sphere or disk. The frequency of the fundamental (n = 1) mode is shown as the solid line with that frequency to be read from the left axis. The frequency of the second harmonic mode (n = 2) is shown as the dashed line to be read from the right axis
The mobile constriction in the DeltaEC model removes 40 cm3 of resonator’s unperturbed 10 liter volume (10,000 cm3). This is approximately equivalent to a resonator of uniform cross-sectional area, A = 1.0 × 10⁻² m2, that contains an incompressible sphere of radius, asphere = 2.12 cm, or to a disk of radius, adisk = 2.52 cm and thickness, t = 2.0 cm. Again, the DeltaEC model will not be exact because the shift in the frequency due to a kinetic energy perturbation is shape dependent, even if the obstacle is small compared to the wavelength. Although the constriction in the DeltaEC model is trapezoidal and not a sphere or disk, it provides a plausible approximation of the change in the resonator’s cross-sectional area that would be caused by the sphere or disk that provides the same volume exclusion.
Adiabatic invariance requires that the ratio of the modal energy to the modal frequency, En/fn, be a constant as long as the motion of the obstacle is slow compared to the period of the standing wave, Tn = (fn)−1. As shown in Fig. 15.27, the resonance frequency is a function of the constriction’s location within the resonator. The energy of the mode must also be a function of position so the radiation force on the sphere, Fsphere, or an obstacle of some other shape must be equal to the gradient in that energy (see Sect. 1.2.1).
Adiabatic invariance guarantees that En/fn = constant, so by log differentiation (Sect. 1.1.3), dEn/dfn = En/fn = constant.
The value of dfn/dx will depend upon the obstacle’s position within the resonator. That slope will have its maximum value at locations equidistant between the nodes and the anti-nodes of the first-order standing wave fields. Using the results for the second standing wave mode produced by the DeltaEC model and plotted in Fig. 15.25, the maximum slope is just π/2 times the difference between the maximum frequency (f2+ = 348.4 Hz) and the minimum frequency (f2− = 345.09 Hz), divided by the separation between the location of those two extrema, Δx = 0.235 m: df2/dx = 21.1 Hz/m.
For convenience, the constant, E2/f2, can be evaluated with the obstacle located at the driven end of resonator (i.e., Seg. #2c = 0.0 m), where E2 is given by Eq. (15.94), with p’ = 2.0 kPa (Seg. #0d), pm = 100 kPa (Seg. #0a), γ = (7/5), and (AL) ≅ 0.01 m3. At that location, f2 = f2+ = 348.4 Hz, and E2 = 7.14 x 10⁻² J, so E2/f2 = 2.05 x 10⁻⁴ J/Hz. Substitution of these two results into Eq. (15.97) provides the radiation force due to the constriction, Frad, at a position equidistant between the nodes and the anti-nodes of the first-order standing wave fields, which is a consequence of adiabatic invariance for a trapezoidal-shaped obstacle.
This result can be compared to the radiation force at the same position for the n = 2 mode, under the same conditions, if the pressure at either anti-node (i.e., rigid end) is set to p’ = 2.0 kPa, equivalent to 157 dB re: 20 μParms, for a sphere, Fsphere, in Eq. (15.91), or a disk, Fdisk, in Eq. (15.92). To make a reasonable comparison, the volume of the sphere is set equal to the volume excluded by the trapezoidal constriction: V = 40 cm3.
From Eq. (15.92), the result would be the same for a disk of the same volume.
Our estimate of the levitation force based on the DeltaEC model and adiabatic invariance is reasonably close to that result, given that the frequency shift computation was based on a constriction rather than an obstruction.
At this point, the serious reader will pause to marvel at the elegance and beauty that adiabatic invariance has demonstrated by its ability to circumvent the difficulties of integrals of second-order pressure fields over objects of arbitrary shape in favor of a simple measurement of the resonant frequency shift as a function of position of the object to be levitated within the resonator. Putterman claims that adiabatic invariance is “the cornerstone of modern physics” [69]. Similar results can be obtained for determination of the torque on a Rayleigh disk by measuring the shift in the resonance frequency as a function of the disk’s orientation [60].
4.7 Levitation Superstability (“Acoustic Molasses”)
Most acoustic levitation systems are driven at a fixed frequency [70]. Since the position of the levitated object can change, the ratio of the drive frequency to the resonator’s resonance frequency, ω/ωo, will also change. That frequency shift at fixed drive frequency produces an effect referred to as “de-tuning” that is illustrated in Fig. 15.27. The frequency shift causes the amplitude of the standing wave to change resulting in a change in the radiation pressure acting on the levitated object. This modifies the Hooke’s law “stiffness” of the radiation force acting on the object. If the object did not influence the tuning, then the object would be levitated at the equilibrium position within the standing wave where the radiation force and the gravitational force would be equal and opposite. The fact that the object’s position also changes the tuning would change the trapping stiffness constant because its position influences the amplitude of the sound in the resonator when driven at fixed frequency.
This change in stiffness can be understood by examining the three shifted response curves illustrated in Fig. 15.28. All the resonance curves in Fig. 15.28 correspond to a quality factor of Q = 10. Assume that the resonator is driven at a fixed frequency that was 5% above the resonance frequency of the empty resonator so that ω/ωo = 1.05. The value of v12 would be 51.2% of the maximum that occurs at ω/ωo = 1.00, if the resonator was empty. If the object moved up from its equilibrium position (i.e., toward the closest velocity anti-node), then the resonator’s resonance frequency would become lower, corresponding to the dotted resonance curve. The force on the object would decrease because the acoustic standing wave amplitude would decrease, since the value of v12 would be 32.3% of the maximum that occurs at ω/ωo = 1.00.

The presence of the acoustically levitated object changes the resonance frequency of the resonator [68]. The solid line is the normalized value of the square of the peak velocity amplitude, v12, produced when the resonator is driven a frequency relative to the resonance frequency of the empty resonator, ω/ωo = 1. The dotted line corresponds to the resonator’s frequency response when the levitated object is located closer to a velocity anti-node. The dashed line corresponds to the resonator’s frequency response when the levitated object is located closer to a velocity node (i.e., a pressure anti-node)
If the object moved down from its equilibrium position (i.e., toward the closest velocity node), then the resonator’s resonance frequency would become higher, and the drive frequency would be closer to the resonance frequency. The value of v12 in Fig. 15.28 would be 80.4% of the maximum that occurs at ω/ωo = 1.00, if the resonator was empty. This corresponds to the dashed resonance curve in Fig. 15.28, and the force on the object would increase because the acoustic standing wave amplitude would have increased. The combined effect would be an increase in the stiffness.
If the empty resonator was initially tuned ω/ωo = 0.95, then the effective stiffness would be less by the same argument except that the object’s influence on the sound amplitude would be determined by its “motion” along the vertical line in Fig. 15.28 above ω/ωo = 0.95, instead of the previous discussion that had the object’s motion causing changes to the acoustic amplitude represented by “motion” along the vertical line above ω/ωo = 1.05 in Fig. 15.28.
If this influence of the object’s position on the effective stiffness of its capture around its equilibrium position in the standing wave occurred instantaneously in response to the object’s change in position, then any displacement of the object would simply oscillate at a slightly different frequency about the equilibrium position than it would if the de-tuning was neglected. Viscous effects (i.e., Stokes drag) would eventually damp those oscillations, corresponding to a mechanical resistance, Rm, in the simple harmonic oscillator equation.
Because we are considering the standing wave resonator as a driven resonant system with Q ≠ 0, the exponential relaxation time, τ, required for the resonator to achieve its steady-state response after its tuning is changed is non-zero (see Sect. 2.5.4): Q = (½)ωοτ. The resonator’s response time is much longer than the period, T = 2π/ωo, of the standing wave: τ = (Q/π)T. That delay in the resonator’s response to the position of the levitated object means that there will be a component of the force modulated by the object’s position that will not be in-phase with the object’s position but that will be in-phase or out-of-phase with the object’s velocity. The influence of the de-tuning will be retarded by a time, τ, so the current radiation force acting on the object will depend upon the position of that object at an earlier time, t − τ.
If this retardation produces a component of the excess (i.e., de-tuning) force that is out-of-phase with the velocity of the object’s displacement from its equilibrium position, dx/dt, then this force will behave like mechanical damping in addition viscous “Stokes drag,” in Eq. (15.100). If this retardation produces a component of the excess (i.e., de-tuning) force that is in-phase with the velocity of the object’s displacement from its equilibrium position, dx/dt, then this force will behave like a negative mechanical resistance.
When the magnitude of that negative resistance is less than the ordinary viscous resistance, Rm, in Eq. (15.100), then oscillations will take longer to damp out. If the magnitude of that negative resistance is greater than Rm, then the amplitude of the object’s oscillations will grow exponentially with time until some other effect limits the oscillation’s amplitude. In some important cases this de-tuning/de-phasing instability will throw the levitated object out of the equilibrium position and possible propel the object against the resonator’s boundaries [71].
The two possible scenarios are illustrated symbolically in Fig. 15.29. If the natural frequency of the resonator is lower than the drive frequency, ω/ωo > 1 (sharp tuning), then motion of the levitated object toward a pressure anti-node (i.e., away from a velocity anti-node) will raise ωo and bring the drive frequency closer to the resonance frequency. This will produce an excess force, Fexcess, that will be increased, thus in-phase with the velocity of the object as it is moving up from its lowest position, since the force will depend upon the previous position of the object at a time, τ, earlier. When the object reaches its maximum vertical position, the natural frequency of the standing wave resonator will be farther out-of-tune, and the radiation force is reduced, so gravity will provide an excess force. Again, due to the delay, that excess force will be acting in the downward direction and is again in-phase with the (now downward) velocity of the object. This scenario is depicted in Fig. 15.29 (left).

The de-tuning/de-phasing instability (or superstability) for an acoustically levitated object depends upon whether the resonance frequency of the resonator is above or below the frequency of the sound produced by the loudspeaker. (Left) If the drive is tuned “sharp” (i.e., ω/ωo > 1), then small displacements from equilibrium will increase, and the trapping will become unstable. (Right) If the drive is tuned “flat,” (i.e., ω/ωo < 1), then small displacements from equilibrium will damp out faster than if only viscous drag was providing the mechanical resistance making the trapping “superstable”
The net effect for the “sharp tuning” case has the excess force doing work on the object, thus increasing the amplitude of its oscillations during each cycle. If the effect is sufficiently large, it can overcome viscous damping making the amplitude of the object’s oscillations grow linearly with time until some other effect limits the amplitude of the oscillations or the object is flung too far from the equilibrium position that it is no longer trapped or bangs against the walls or ends of the resonator.
If the natural frequency of the resonator is higher than the drive frequency, ω/ωo < 1 (flat tuning), then motion of the levitated object toward a pressure anti-node (i.e., away from a velocity anti-node) will raise ωo and bring the drive frequency farther from the resonance frequency. This will reduce the excess radiation force, Fexcess, making the influence of gravity more important. That will produce an additional force that is out-of-phase with the velocity of the object as it is moving up from its lowest position, since the force depends upon the previous position of the object at a time, τ, earlier.
When the object reaches its maximum vertical position, the natural frequency of the standing wave resonator will be closer to the drive frequency, and the radiation force will be increased. Again, due to the delay, that excess force will be acting in the upward direction and is again out-of-phase with the velocity of the object which will be moving downward. This scenario is depicted in Fig. 15.29 (right).
The net effect for the “flat tuning” case has the excess force adding to the viscous resistance and thus increases the damping. The amplitude of the object’s oscillations, if displaced from equilibrium, will decay more quickly than it would if the damping was due only to the Stokes drag. This additional damping causes superstability [72].
This same damping effect is observed in optics where it is known as “optical molasses” and was responsible for Stephen Chu sharing the Nobel Prize in Physics in 1997 with Claude Cohen-Tannoudji and William Phillips “for development of methods to cool and trap atoms with laser light” [73].
5 Beyond the Linear Approximation
Most ordinary acoustical phenomena can be analyzed from the linear perspective that has been the focus of every other chapter of this textbook. Linear acoustics and vibrations provide many useful and convenient simplifications. As we have seen, such simplifications are applicable to a large range of interesting problems. That said, this chapter has introduced a few interesting and useful phenomena that are not contained within a linear analysis. Waveform distortion, harmonic generation, shock wave formation and dissipation, parametric end-fire arrays, and mode conversion all rely upon incorporation of effects that a wave has on its propagation medium which are ignored in the linear limit. Inclusion of nonlinear effects leads to an interesting “life cycle” for a large amplitude acoustic disturbance: distortion → shocking → dissipation → classical attenuation [21]. That evolution in an ordinary fluid is depicted symbolically in Fig. 15.30.

The simplified life cycle of an initially sinusoidal large amplitude acoustic disturbance propagating as a plane wave in one dimension
By restricting the analysis to one-dimensional propagation of plane wave, many of the nonlinear behaviors have been demonstrated while avoiding more complicated mathematics and still being able to appreciate the cumulative influence of convection and of the medium’s own nonlinearity.
The inclusion of nonlinear contributions also provided an introduction to the ability of a sound wave to exert non-zero time-averaged forces and torques on objects that are exposed to high-amplitude sound waves. Acoustic radiation forces are generally much larger than forces that can be exerted by electromagnetic radiation used for trapping atoms [73]. Much of our understanding of these effects can be attributed directly to the Bernoulli pressure that provides an intrinsically second-order contribution to the linear (first-order) pressure field. Once again, exploitation of adiabatic invariance provided a means of avoiding complicated mathematics while providing useful quantitative results.
Finally, it is important to recognize that this chapter was only the “tip of the iceberg.” Many important nonlinear acoustical phenomena have not even been mentioned. Among the most significant are thermoacoustic engines, refrigerators [74], pulse-tube cryocoolers, and sonic mixture separators [75], as well as other important cases of acoustically driven mass streaming [76]. Another area that has been entirely ignored is nonlinear bubble oscillations that can be so violent that they convert sound into light by a process referred to as “sonoluminescence” [77]. The nonlinear distortion of pulses and the propagation of N-waves [78], like those which produce a “sonic boom” [79], are other important phenomena also worthy of investigation.
Topics in the area of nonlinear vibrations also abound. As mentioned in the beginning of this textbook, the inclusion of non-Hookean elasticity leads to the violation of Galilean isochronous independence of period and amplitude. Much like the harmonic distortion produced in high-amplitude wave propagation, a driven nonlinear oscillator will respond at frequencies that are not just the driving frequency. In fact, the response of a nonlinear oscillator can be at sub-harmonic frequencies or can become entirely chaotic rather than deterministic [80].
The purpose of this chapter was to raise awareness of the limitation of linear analysis, not to create professional expertise in nonlinear acoustics. If the reader can recognize the “symptoms” of nonlinear behavior and understand how they arise, then the goals of this final chapter will have been realized.
Talk Like an Acoustician
Convective nonlinearity | Phase matching |
Self-interaction | Resonant mode conversion |
Intermodulation distortion | Pump waves |
Shock inception distance | Primary waves |
Grüneisen parameter | Bernoulli pressure |
Virial expansion | Radiation pressure |
Second sound | Kundt’s tube |
Gol’dberg number | Internal energy |
Order expansion | Enthalpy |
Blackstock bridging function | Velocity potential |
Geometric resonance | Acoustic levitation |
Intermodulation distortion | De-tuning/de-phasing instability |
Exercises
-
1.
Shock inception distance. The derivation of Eq. (15.8) used the fact that the crest of a plane sinusoidal wave advances “by one radian length,” k−1, toward the zero-crossing when the slope of the zero-crossing, dv/dx, becomes infinite. By using the excess velocity, Γv, defined in Eq. (15.9), show this is true in the case where dissipation can be neglected, with an initial waveform, \( v\left(x,t\right)=\left|\hat{\mathbf{v}}\right|\sin \left(\omega t- kx\right) \). For the waveform to become the fully developed sawtooth shock, the crest of the initially sinusoidal wave must advance by λ/4, placing the crest directly over the zero-crossing (see Fig. 15.6). Express that distance, Dsaw, in terms of DS, again for the case where dissipation can be neglected.
-
2.
Waveform distortion. A 19.2 m long waveguide of circular cross-section with inside diameter, D = 5.21 cm, is shown in Fig. 15.31 and Fig. 15.32 (center). The waveguide is driven by two compression drivers, shown in Fig. 15.32 (left), which can produce large amplitude sound waves.Footnote 14 The waveguide is terminated by a porous anechoic cone.

A U-shaped waveguide made from 2″ diameter (nominal) Schedule 40 PVC pipe is suspended from the ceiling to provide an overall propagation path of 19.2 m. At the far end are two compression drivers, and at the near end is a 1.05 m long porous wedge absorber to eliminate reflections. [Waveguide courtesy of Lauren Falco]

(Left) Two compression drivers. (Center) U-shaped waveguide turn-around section. (Right) Microphone flush-mount holder
Three ¼” microphones are flush-mounted at three locations using the fixture that joins smoothly to the PVC pipe to eliminate reflections, shown in Fig. 15.32 (right). One microphone is located very close to the drivers at a position designated x = 0. The second microphone is located at x = 3.17 m, and the third is located at x = 17.9 m.
Assume that the waveguide contains dry air at pm = 100 kPa with a sound speed, co = 345 m/s, and it is driven sinusoidally at f1 = 880 Hz.
-
(a)
Attenuation length. Using the expression in Eq. (13.78), determine the exponential thermoviscous attenuation length,\( \mathrm{\ell}={\alpha}_{T-V}^{-1} \), due to boundary layer dissipation at the fundamental frequency, f1. Is that attenuation length shorter or longer for the higher harmonics?
-
(b)
Shock inception distance and Gol’dberg number. Determine the shock inception distance, DS, and using the result of part (a), determine the Gol’dberg number, G, if p1(0) = 100 Pa (131 dB re: 20 μParms), p1(0) = 300 Pa (140.5 dB re: 20 μParms), and p1(0) = 1000 Pa (151 dB re: 20 μParms).
-
(c)
Harmonic distortion. Using Eq. (15.43) and neglecting attenuation, determine the amplitude of the fundamental, f1 = 880 Hz, second harmonic, f2 = 1.76 kHz, third harmonic, f3 = 2.64 kHz, and forth harmonic, f4 = 3.52 kHz, at x = 3.17 m and at x = 17.9 m, assuming p1(0) = 100 Pa.
-
(d)
More harmonic distortion. Repeat part (c) assuming p1(0) = 300 Pa.
-
3.
Repeated shock. Determine the ratio of the amplitudes of the harmonics to the amplitude of the fundamental, Cn/C1, for a fully developed shock wavelike that shown in Fig. 15.8.
-
4.
Levitation demonstration resonator. A ground-based levitator (i.e., g = 9.8 m/s2) is being designed to demonstrate acoustic levitation by levitating the bottoms of Styrofoam coffee cups. Those disks have a diameter of 5.0 cm and a thickness of 1.5 mm, and each has a mass, mdisk = 0.15 gm. Assume that resonator will be constructed from a 1.5 m long, 6″ (nominal) diameter, optically clear cast acrylic tube with inside diameter, Dtube = 14.0 cm.
-
(a)
Levitation force. If the resonator is operated in its n = 3 standing wave mode, f3 = 350 Hz. Determine the pressure amplitude of the standing wave at the rigid end of the resonator so that the levitation force on the disk is three times its weight.
-
(b)
Equilibrium location. If the tube is oriented so that the speaker is at the bottom and the rigid end is at the top (like those in Fig. 15.29), how far from the top end of the resonator will the disk be levitated at its highest stable location if the standing wave amplitude is that calculated in part (a)?
-
(c)
DeltaEC model. Make a DeltaEC model of the resonator (without the levitated disk) to determine the volume velocity of a piston that has the same diameter as the tube, Dtube, which would be required to produce the standing wave pressure amplitude at the rigid end calculated in part (a) for the n = 3 mode. You may make a slight adjustment of the tube’s length to force f3 = 350 Hz. What are the frequencies of the f1, f2, and f4 modes?
-
(d)
Adiabatic invariance. Use your DeltaEC model in part (a) to estimate the frequency as a function of disk position by moving a constricted DUCT segment that is the same length as the disk (1.5 mm) and has a cross-sectional area equal to that of the empty tube minus the cross-sectional area of the disk. Move that constricted section from the rigid end to about 0.3 m from the driven end of the resonator. Plot f3 vs. position to produce a graph similar to Fig. 15.27. Repeat for f2 vs. position.
-
(e)
Advanced DeltaEC model. Repeat part (c) but explicitly includes the loudspeaker in Fig. 2.43 using the following speaker parameters: mo = 12.0 gm, Κ = 1440 N/m, Bℓ = 7.1 N/A, Rdc = 5.2 Ω, L = 0.1 mH, Rm = 1.9 kg/s, and Apist = 98.5 cm2. The rear of the speaker is enclosed (to protect your hearing!) in a cylindrical enclosure that has an inside diameter of 6″ (15.2 cm) and a length of 8″ (20 cm). What is the electrical current that must be supplied to the voice coil to produce the n = 3 standing wave amplitude calculated in part (a) at f3 = 350 Hz? What are the frequencies of the f1, f2, and f4 modes of the coupled speaker-resonator system (see Sect. 10.7.5)?
-
(a)
-
Hints: The DeltaEC model of the bass-reflex loudspeaker enclosure in Fig. 8.41 might provide a helpful starting point. An “enclosed current driven speaker” segment, IESPEAKER, will provide a way to incorporate the rear enclosure with the electrodynamic speaker’s excitation of standing waves in the tube.
-
(5)
Rayleigh disk. The apparatus in Fig. 15.33 shows a rigid disk (e) suspended at the midplane of a cylindrical resonator from a torsion fiber (b). The resonator has an electrodynamic dome tweeter (g) at one end and an electret microphone (see Sect. 6.3.3) providing a rigid termination at the other end (f). The disk’s angular orientation is detected with the coils surrounding the resonator that incorporates a split-secondary astatic transformer [60]. A gearing system (a) and a coil (d) and magnet structure (n and s) from an analog meter movement can be used to adjust the equilibrium orientation, θo, of the disk or excite a free-decay oscillation. The maximum occlusion of the resonator occurs when θo = 0°.
The resonator’s inside diameter is 3.0 cm and its length, L = 12.0 cm. The diameter of the disk is Ddisk = 1.2 cm. The disk has a mass, m1 = 0.80 gm and a moment of inertia of about its diameter of Idisk = 2.0 x 10⁻⁸ kg-m2
-
(5)

Cross-sectional view of a “modern” Rayleigh disk apparatus. [60]
Assume the resonator contains dry air at 300 K with pm = 100 kPa.
-
(a)
Fundamental resonance frequency. What is the frequency of the fundamental half-wavelength mode of the resonator?
-
(b)
Torsional stiffness. If the frequency of disk oscillations is 1.1 Hz, what is the torsional stiffness of the disk’s suspension?
-
(c)
Standing wave pressure amplitude. The disk’s equilibrium position is adjusted so that θo = 45°. What is the acoustic pressure amplitude, p1, at the surface of the electret microphone if the standing wave causes the disk equilibrium orientation to be θ = 35° and the corrections in the curly brackets of Eq. (15.79) are ignored?
-
(d)
Scattering corrections. How large is the correction provided by Eq. (15.79) relative to the simpler expression for the torque in Eq. (15.78)? Express your result as Nantinode (35°)/N (35°).
-
(e)
Electret microphone sensitivity. If the open-circuit output voltage of the electret microphone is 285 mVac under the conditions of part (b), what is the microphone’s open-circuit sensitivity?
Notes
- 1.
Although instability requires nonlinearity, nonlinearity does not necessarily always result in instability. Solitons are waveforms that remain stable due to the compensatory influences of nonlinearity and dispersion.
- 2.
The exact result for the propagation speed at all depths reduces to cgrav in Eq. (15.4) in the limit that kho → 0. Since this result depends upon k, it is dispersive, so the phase speed, cgrav, will not be equal to the group speed except in the “shallow water” kho → 0 limit.
$$ {c}_{grav}=\frac{\omega }{k}=\sqrt{\frac{g}{k}\tanh {kh}_o} $$ - 3.
An excellent history of the early development of nonlinear acoustics is provided by D. T. Blackstock, “History of Nonlinear Acoustics: 1750s–1930s,” as Chap. 1 in Nonlinear Acoustics, 2nd ed. (Acoust. Soc. Am., 2008), M. F. Hamilton and D. T. Blackstock, editors; ISBN 0–9,744,067–5-9.
- 4.
If the elastic potential of a solid depended on only the parabolic potential energy contribution (see Sect. 1.2.1), then as a solid heated up, the amplitude of the motion of the point particles (molecules) would increase, but their equilibrium position would remain unchanged. If there is a cubic contribution to the interparticle potential energy, then as the amplitude of the molecular vibrations increased (with increasing temperature), the equilibrium position would shift causing thermal expansion or contraction of the solid.
- 5.
In 1962, Lev Landau won the Nobel Prize in Physics for his prediction of the temperature dependence of second sound using his two-fluid theory of superfluid hydrodynamics after the speed of second sound was first measured by Pyotr Kapitza. Kapitza won the Nobel Prize in Physics in 1978 for his measurement of the speed of second sound in superfluid helium.
- 6.
Prof. I. Rudnick has pointed out that superfluids are interesting because they obey the laws of hydrodynamics on the microscopic scale and obey the laws of quantum mechanics on the macroscopic scale.
- 7.
Do not confuse the wave equation for the second-order deviations from equilibrium with the fact that both the first- and second-order wave equations are both second-order partial differential equations. For the classification of differential equations, second-order refers to the highest-order derivative that appears in the equation.
- 8.
Westervelt first presented his parametric array at a meeting of the Acoustical Society of America in Providence, RI, in 1960, J. Acoust. Soc. Am. 32, 934 (1960). The abstract for that presentation included an expression for the radiated intensity of the difference-frequency beam.
- 9.
Daniel Bernoulli (1700–1782) was a Dutch physicist and mathematician who published Hydrodynamica in 1738 that provided the basis of the kinetic theory of gases which he applied to explain Boyle’s law. He was also well known for early development of elasticity theory with Leonard Euler, an effort recognized to this day by the fact that Eq. (5.36) is called Euler-Bernoulli beam equation.
- 10.
The motion of a small particle in a sound field will depend upon the competition between the particle’s inertia (mass), which tends to make it remain stationary in the laboratory frame of reference, and the Stokes drag due to the viscosity of the medium which tends to force the particle to move along with the acoustically oscillating fluid. The inertial force is given by Newton’s Second Law, Finertia = m (dv1/dt), and the Stokes drag force on a spherical particle of radius, a, (at sufficiently low Reynolds number) is Fdrag = 6πμav1. Their dimensionless ratio will determine if the particle moves with the fluid or if the fluid moves around the particle. That ratio can be written for a spherical particle with mass density, ρ, and sound with frequency, f.
$$ \frac{F_{inertia}}{F_{drag}}=\frac{4\pi }{9}\frac{a^2 f\rho}{\mu } $$For a particle with the density of water (ρ = 103 kg/m3), in air with μ ≅ 1.8 x 10⁻⁵ Pa-s, and then at 100 Hz, that ratio is one for a spherical particle with a radius of about 10 microns. A larger radius particle, like cork dust, coffee whitener, or a seed, will remain nearly stationary in the laboratory frame, and the fluid will oscillate around it, while a much smaller particle, like smoke, will move with the fluid.
- 11.
Video demonstrations of several of the non-zero, time-averaged effects in this section were recorded at the 100th meeting of the Acoustical Society of America held in Los Angeles, CA, in 1988. This video is included in the second disk of the Collected Works of Distinguished Acousticians—Isadore Rudnick, compiled by J. D. Maynard and S. L. Garrett (Acoust. Soc. Am., 2011); https://www.abdi-ecommerce10.com/ASA/p-230-collected-works-of-distinguished-acousticians.aspx.
- 12.
This assumption is not as bad as it seems since the Bernoulli pressure, as described in Eq. (15.76), is only valid along a streamline. The streamlines in Fig. 15.20 (right) will follow the contours of the disk accounting for the fact that simple results of Eqs. (15.77) and (15.78) are very nearly the correct result.
- 13.
- 14.
The use of two drivers not only increases the achievable amplitudes but also facilitates measurements of the interaction of two waves of different frequencies.
References
G.G. Stokes, On a difficulty in the theory of sound. Phil. Mag. (Series 3) 33, 349–356 (1848). Also available in R. T. Beyer, Nonlinear Acoustics in Fluids (Van Nostrand Reinhold, 1984)
M.F. Hamilton, Gol’dberg number for diverging waves. J. Acoust. Soc. Am. 104(6), 4419–4427 (2016)
I. Rudnick, On the attenuation of high amplitude waves of stable saw-tooth form propagated in horns. J. Acoust. Soc. Am. 30(4), 339–342 (1958)
A. Myers, R.W. Pyle Jr., J. Gilbert, D.M. Campbell, J.P. Chick, S. Logie, Effects of nonlinear sound propagation on the characteristic timbres of brass instruments. J. Acoust. Soc. Am. 131(1, Pt. 2), 678–688 (2012)
R.T.Beyer, “The parameter B/A ”, in Nonlinear Acoustics, M. F. Hamilton and D. T. Blackstock, eds. (Acoust. Soc. Am., 2008). Ch. 2; ISBN 0-9744067-5-9.
R. T. Beyer, Nonlinear Acoustics (Acoust. Soc. Am., 1997); ISBN 1-56396-724-3. §3.1.
EE.C. Everbach, Parameters of nonlinearity of acoustic media, in Encyclopedia of Acoustics, ed. by M. J. Crocker, (Wiley & Sons, 1997). Vol. I, Ch. 20; ISBN 0-471-17767-9
C.M. Cormack, M.F. Hamilton, Plane nonlinear shear waves in relaxing media. J. Acoust. Soc. Am. 143(2), 1035–1048 (2018)
S.L. Garrett, Nonlinear distortion of 4th sound in superfluid helium 3He-B. J. Acoust. Soc. Am. 69(1), 139–144 (1981)
R.T. Beyer, Nonlinear Acoustics (Experimental), in American Institute of Physics Handbook, ed. by D. E. Grey, 3rd edn., (McGraw-Hill, 1972). See Table 30-3, pg. 3–208
M. Greenspan, C.E. Tschiegg, Radiation-induced acoustic cavitation: apparatus and some results. J. Res. Nat’l. Bur. Standards, Sec. C 71, 299–312 (1959)
M.S. Cramer, A. Kluwick, On the propagation of waves exhibiting both positive and negative nonlinearity. J. Fluid Mech. 142(1), 9–37 (1984)
I. Rudnick, Physical Acoustics at UCLA in the Study of Superfluid Helium, in New Directions in Physical Acoustics – Course LXIII, Varenna, Italy, ed. by D. Sette, (Italian Physical Society and IOS Press, Amsterdam, 1974)
S. J. Putterman, Superfluid Hydrodynamics (North-Holland, 1974); ISBN 0 7204 030104.
S. Putterman, S. Garrett, Resonant mode conversion and other second-order effects in superfluid He-II. J. Low Temp. Phys. 27(3/4), 543–559 (1977)
Z.A. Gol’dberg, Second approximation acoustic equations and the propagation of plane waves of finite amplitude. Soviet Phys. Akust. 2, 346–350 (1956)
A. Larraza, S.L. Garrett, S. Putterman, Dispersion relations for gravity waves in a deep fluid: second sound in a stormy sea. Phys. Rev. A 41(6), 3144–3155 (1990)
L.D. Landau, E.M. Lifshitz, Fluid Mechanics, 2nd edn. (Butterworth-Heinemann, 1987). See Eq. 86.1; ISBN 0 7506 2767 0
I. Rudnick, On the attenuation of a repeated sawtooth shock wave. J. Acoust. Soc. Am. 25(5), 1010–1011 (1953)
I. Rudnick, On the attenuation of finite amplitude waves in a liquid. J. Acoust. Soc. Am. 30(6), 564–567 (1958)
J.A. Shooter, T.G. Muir, D.T. Blackstock, Acoustic saturation of spherical waves in water. J. Acoust. Soc. Am. 55(1), 54–62 (1974). See Fig. 1
S. Earnshaw, On the mathematical theory of sound. Phil. Tran. Roy. Soc. (London) 150, 133–148 (1860)
G.B. Airy, On a difficulty in the problem of sound. Phil. Mag. (Series 3) 34, 401–405 (1848). Also available in R. T. Beyer, Nonlinear Acoustics in Fluids (Van Nostrand Reinhold, 1984). pp. 37–41
L.E. Hargrove, Fourier series for the finite amplitude sound waveform in a dissipationless medium. J. Acoust. Soc. Am. 32(4), 511–512 (1960)
E. Fubini-Ghiron, Anomalie nella propagazione di onde acustiche di grande ampiezza (Anomalies in acoustic wave propagation of large amplitude). Alta Frequenza 4, 530–581 (1935)
R.D. Fay, Plane sound waves of finite amplitude. J. Acoust. Soc. Am. 3(2A), 222–241 (1931)
D.T. Blackstock, Connection between the Fay and Fubini solution for a plane sound wave of finite amplitude. J. Acoust. Soc. Am. 39(6), 1019–1026 (1966)
J.L.S. Bellin, R.T. Beyer, Scattering of sound by sound. J. Acoust. Soc. Am. 32(3), 339–341 (1960)
P.J. Westervelt, Parametric acoustic array. J. Acoust. Soc. Am. 35(4), 535–537 (1963)
H. Lamb, Dynamical Theory of Sound, 2nd edn. (E. Arnold & Co., 1931). See §63 and §95; reprinted (Dover, 1960)
A.L. Thuras, R.T. Jenkins, H.T. O’Neill, Extraneous frequencies generated in air carrying intense sound waves. J. Acoust. Soc. Am. 6(3), 173–180 (1935)
T.G. Leighton, Ultrasound in air – Guidelines, applications, public exposure, and claims of attacks in Cuba and China. J. Acoust. Soc. Am. 144(4), 2473–2489 (2018)
R.L. Swanson, S. Hampton, J. Green-McKenzie, R. Diaz-Arrastia, M.S. Grady, R. Verma, R. Biester, D. Duda, R.L. Wolf, D.H. Smith, Neurological manifestations among US Government personnel reporting directional audible and sensory phenomena in Havana, Cuba. J. Am. Med. Assoc. 319(11), 1125–1133 (2018)
J. Perlez and S. L. Myers, “U.S. issues alert to Americans in China in wake of sonic attack fears,” New York Times (June 8, 2018), https://www.nytimes.com/2018/06/08/world/asia/sonic-attack-china-guangzhouconsulate.html
Metals Handbook (Desk Edition), H. E. Boyer and T. L. Gall, eds. (Am. Soc. for Metals, 1985); ISBN 0-87170-188-X. Table 1, pg. 2–16.
G.L. Jones, D.R. Kobett, Interaction of elastic waves in an isotropic solid. J. Acoust. Soc. Am. 35(1), 5–10 (1963)
R.R. Rollins Jr., L.H. Taylor, P.H. Todd Jr., Ultrasonic study of three-phonon interactions. II. Experimental results. Phys. Rev. 136(3A), 597–601 (1964)
M.F. Hamilton, J.A. TenCate, Sum and difference frequency generation due to noncollinear wave interactions in a rectangular duct. J. Acoust. Soc. Am. 81(6), 1703–1712 (1987)
L.D. Landau, E.M. Lifshitz, Fluid Mechanics, 2nd edn. (Butterworth-Heinemann, 1987).; ISBN 0 7506 2767 0. §139
S. Garrett, S. Adams, S. Putterman, I. Rudnick, Resonant mode conversion in He II. Phys. Rev. Lett. 41(6), 413–416 (1978)
P.M. Gammel, A.P. Croonquist, T.G. Wang, A high-powered siren for stable acoustic levitation of dense materials in the Earth’s gravity. J. Acoust. Soc. Am. 83(2), 496–501 (1988)
F.H. Busse, T.G. Wang, Torque generated by orthogonal acoustic waves – Theory. J. Acoust. Soc. Am. 69(6), 1634–1638 (1981)
H.W.S. Clair, Electromagnetic sound generator for producing intense high frequency sound. Rev. Sci. Inst. 12(5), 250–256 (1941)
C.H. Allen, I. Rudnick, A powerful high-frequency siren. J. Acoust. Soc. Am. 19(5), 857–865 (1947)
B.L. Smith, G.W. Swift, Measuring second-order time-averaged pressure. J. Acoust. Soc. Am. 110(2), 717–723 (2001)
J. W. Strutt (Lord Rayleigh), “On the circulation of air observed in Kundt’s tubes, and on some allied acoustical problems,” Phil. Trans. Roy. Soc. (London) 175, 1-21 (1883); Collected Works, (Dover, 1964) Vol. II, §108.
H. Mukai, S. Sakamoto, H. Tachibana, Experimental study on the absorption characteristics of resonance-type brick/block walls. J. Acoust. Soc. Japan (E) 20(6), 433–438 (1999)
M. B. Barmatz, “Acoustic agglomeration methods and apparatus,” U.S. Pat. No. 4,475,921 (Oct. 9, 1984).
J.P. Dionne, B. Dutra, K.C. Chitale, G. Ghoshal, C. Leidel, B. Lipkens, A novel acoustic cell processing platform for cell concentration and washing. J. Acoust. Soc. Am. 141(5), 3741 (2017)
J. W. Strutt (Lord Rayleigh), Theory of Sound, Vol. II (Macmillan, 1896); (Dover, 1945). §253b
V. Dvořák, Ueber die ackustiche Abstoggung. Ann. Physik 239(3), 328–338 (1878)
V. Dvořák (with note by A. M. Mayer), “On acoustic repulsion,” Phil. Mag. 6, Series 5, 225-233 (1878); https://doi.org/10.1080/14786447808639500.
J. W. Strutt (Lord Rayleigh), Theory of Sound, Vol. II (Macmillan, 1896); (Dover, 1945). §253a.
W. König, Hydrodynamisch-akustische Untersuchungen. Wied. Ann. 43, 51 (1891)
J. W. Strutt (Lord Rayleigh), “On an instrument capable of measuring the intensity of aerial vibrations,” Phil. Mag. 14, 186-187 (1882); Collected Works (Dover, 1964) Vol. II, §91.
L.L. Beranek, Acoustic Measurements (Wiley & Sons, 1949), pp. 148–158
L.V. King, On the theory of the inertia and diffraction corrections for the Rayleigh disk. Proc. Roy. Soc. (London) A153, 17–40 (1935)
J.R. Pellam, W.B. Hanson, Thermal Rayleigh disk measurements in liquid helium II. Phys. Rev. 85(2), 216–225 (1952)
T.R. Koehler, J.R. Pellam, Observation of torque exerted by pure superflow. Phys. Rev. 125(3), 791–794 (1962)
S.L. Garrett, Butterfly-valve inductive orientation detector. Rev. Sci. Inst. 51(4), 427–430 (1980)
L.D. Landau, E.M. Lifshitz, Fluid Mechanics, 2nd edn. (Butterworth-Heinemann, 1987). §8; ISBN 0 7506 2767 0
L. D. Landau and E. M. Lifshitz, Mechanics, (Pergamon, 1960); See §1 – §5.
I. Rudnick, Measurements of the acoustic radiation pressure on a sphere in a standing wave field. J. Acoust. Soc. Am. 62(1), 20–22 (1977)
L.D. Landau, E.M. Lifshitz, Fluid Mechanics, 2nd edn. (Butterworth-Heinemann, 1987). §49 ISBN 0 7506 2767 0
S. L. Garrett, R. W. M. Smith and M. E. Poese, “Eliminating nonlinear acoustical effects from thermoacoustic refrigeration systems,” Proc. 17th International Symposium on Nonlinear Acoustics (ISNA 17), pg. 407-415 (Am. Inst. Physics, 2006); ISBN 0-7354-0330-9.
Y.A. Ilinskii, B. Lipkens, T.S. Lucas, T.W. Van Doren, E.A. Zabolotskaya, Nonlinear standing waves in an acoustical resonator. J. Acoust. Soc. Am. 104(5), 2664–2674 (1998)
S. Putterman, J. Rudnick, M. Barmatz, Acoustic levitation and the Boltzmann-Ehrenfest principle. J. Acoust. Soc. Am. 85(1), 68–71 (1989)
E. Leung, C.P. Lee, N. Jacobi, T.G. Wang, Resonance frequency shift of an acoustic chamber containing a rigid sphere. J. Acoust. Soc. Am. 72(2), 615–620 (1980)
S.J. Putterman, Adiabatic invariance, the cornerstone of modern physics. J. Acoust. Soc. Am. 83(1), S39 (1988)
M. Barmatz, Overview of containerless processing technologies, in Materials Processing in the Reduced Gravity Environment of Space, ed. by G. E. Rindone, (Elsevier, 1982), pp. 25–37
J. Rudnick, M. Barmatz, Oscillational instabilities in single-mode acoustic levitators. J. Acoust. Soc. Am. 87(1), 81–92 (1990)
M. B. Barmatz and S. L. Garrett, “Stabilization and oscillation of an acoustically levitated object,” U.S. Pat. No. 4,773,266 (Sep. 27, 1988).
S. Chu, Laser manipulation of atoms and particles. Science 253(5022), 861–866 (1991)
S.L. Garrett, S. Backhaus, The power of sound. Am. Scientist 88(6), 11–17 (2004)
G.W. Swift, Mixture separation, in Handbook of Acoustics, ed. by T. D. Rossing, (Springer, 2007). ISBN 978-0-387-30446-7. See §7.6
W.L. Nyborg, Acoustic streaming, in Nonlinear Acoustics, Acoust. Soc. Am, ed. by M. F. Hamilton, D. T. Blackstock, (2008). See Ch. 7; ISBN 978-0-123-21860-5
S.J. Putterman, Sonoluminescence: Sound into light. Scientific American 272(2), 46–51 (1995)
R.T. Beyer, Nonlinear Acoustics (Acoust. Soc. Am., 1997). §4.7, ISBN 1-56396-724-3
D. J. Maglieri and K. J. Plotkin, Sonic Boom, NASA Tech. Report RP-1258 (1991).
A. B. Pippard, The Physics of Vibration (Cambridge, 1989). See Ch. 8, ISBN 0 521 37200 3
Author information
Authors and Affiliations
Rights and permissions
Open Access This chapter is licensed under the terms of the Creative Commons Attribution 4.0 International License (http://creativecommons.org/licenses/by/4.0/), which permits use, sharing, adaptation, distribution and reproduction in any medium or format, as long as you give appropriate credit to the original author(s) and the source, provide a link to the Creative Commons license and indicate if changes were made.
The images or other third party material in this chapter are included in the chapter's Creative Commons license, unless indicated otherwise in a credit line to the material. If material is not included in the chapter's Creative Commons license and your intended use is not permitted by statutory regulation or exceeds the permitted use, you will need to obtain permission directly from the copyright holder.
Copyright information
© 2020 The Author(s)
About this chapter

Cite this chapter
Garrett, S.L. (2020). Nonlinear Acoustics. In: Understanding Acoustics. Graduate Texts in Physics. Springer, Cham. https://doi.org/10.1007/978-3-030-44787-8_15
Download citation
DOI: https://doi.org/10.1007/978-3-030-44787-8_15
Published:
Publisher Name: Springer, Cham
Print ISBN: 978-3-030-44786-1
Online ISBN: 978-3-030-44787-8
eBook Packages: Physics and AstronomyPhysics and Astronomy (R0)