
Abstract
A product design elements evaluation model was proposed, which was constructed by eye tracking experiments, using eye movement indicators such as first gaze time, gaze order, and number of times of return, to accurately and effectively analyze product model and quantify users’ emotion. The purpose of sorting the product model contribution was achieved through the weight calculation of the design elements. The soymilk machine shape was used as a case to verify the rationality of the evaluation model. The results showed that the “cup” part of the soymilk machine was the most concerned by the subjects, while the “handle” part was the least concerned. At the same time, the further research direction of design elements evaluation in eye movement experiment and the coupling between design elements, and product modeling image were discussed at the end of the article. The further research directions and experimental design methods were clarified.
You have full access to this open access chapter, Download conference paper PDF
Keywords
1 Introduction
With the upgrading of the consumer market, product design gradually takes the user as the center instead of the product as the center, and develops in the direction of reflecting the user’s emotional needs [1]. Product model is an important carrier to express product design ideas and disseminate spiritual and cultural significance [2]. The model of the product consists of design elements, including feature elements and platform elements. The feature elements are the main emotional demand representation of the consumer when selecting and using the product. Therefore, designers can quickly and accurately unearth the needs of consumers by sorting the contribution of product design elements to complete product design. At present, in the evaluation stage of product design elements, subjective questionnaires are combined with data calculation [3], the little research was directed at systematic objective evaluation.
The temporal and spatial characteristics of eye movements are the physiological and behavioral manifestations in the process of visual information extraction. As a feedback of physiological awakening, it has been widely used in the fields of psychology and medicine. Judging the psychological state of consumers based on visual trajectory has become a hot topic in the field of product design, Li et al. [4] established a mathematical model between subjective scoring and multiple eye movement data, which solved the problem of poor reliability of subjective selection results in product modeling schemes and lack of comprehensive quantitative research on objective selection results. Tang et al. [5] conducted a correlation analysis between EEG, eye movement data and subjective evaluation values, and established a program of car user experience selection model combining physiological and psychological evaluation indicators; At the same time, physiological data is playing an increasingly important role in the identification and evaluation of elements, Kristian et al. [6] search for the best combination of packaging elements through orthogonal design and physiological measurement; Cheng et al. [7] unearthed user preferences in interface design by using eye tracking experiments. The above eye movement physiology data is mainly used to evaluate the product plan, and the method used in the extraction evaluation study of the design element is subjective and lacks of quantitative method verification [8].
An evaluation model of product design elements contribution driven by eye tracking data is proposed. The physiological awakening amount of the user is used as the evaluation basis, and the eye movement index calculation data is used as the evaluation result of the design elements weight, and the product design elements contribution ranking is obtained to guide product design scientifically and quantitatively.
2 Unearthing the Target Image of Product Model
Target image often represents the user’s main evaluation of product model. At present, the interview method, the oral analysis method, the image scale method, etc. are used by the main tester to explore the image of the product model target. Entropy is used as an important indicator to measure system stability, information entropy [9] is a negative entropy used to indicate the degree of order of the system, which can be used to theoretically construct a product modeling image evaluation model based on the composite cognitive space of users, designers and engineers to guide the selection of typical case libraries [10]. The principle of information entropy is used as the method to unearth the most representative product model image, as the theoretical basis of eye tracking experiment.
Product image evaluation value characterized by entropy:
In the formula: Ij represents the image entropy value; Fij represents the jth target image probability of the i-th sample; i represents the research sample, i = 1, 2, …, m; j represents the target image, j = 1, 2, …, q; k represents a constant, \( k = {1 \mathord{\left/ {\vphantom {1 {\ln m}}} \right. \kern-0pt} {\ln m}} \).
Through the semantic differential method, the target image probability is obtained after normalization. Applying the formula (1) to obtain the entropy value Ij of the target image of the jth item, the weight of the target image in the evaluation process is \( w_{j} \):
According to the weight value of each image, the largest as the target image will be chosen.
3 Visual Cognition of Product Imagery
-
(1)
Visual cognition
Visual cognition refers to the physiological response of the eye after receiving external stimuli. Through the stimulation of product styling, the image information is transformed into a visual signal and transmitted for the brain to form a psychological stimulus. The whole process is the mutual confirmation of physiological response and psychological stimulation, which is shown in Fig. 1. It can be summarized as overall organization, constant memory, simple adjustment and selection resolution [11]. The indicators mainly include physiological parameters such as gaze, follow, and saccade. The visual tracking experiment focuses on the average pupil diameter, gaze time, gaze order, and number of times of return.

Schematic diagram of visual cognition process
Assume that the subjects are gathered during the experiment as P = {p1, p2, …, pn}, the sample set is S = {s1, s2, …, sm}, various eye movement indicator data sets E = {e1, e2, …, ek}. Then, the product image design elements evaluation experiment data set is:
Where \( y(p_{i} ,s_{h} ,E) \) represents the eye movement index data of the subject sh to the subject pi.
-
(2)
Eye movement index
-
①
Average diameter of the pupil
It refers to the average diameter of the pupil, which is mainly used to detect the psychological activity of the sample to be observed. The size of the pupil diameter is related to the mood of the subject. Under normal circumstances, the pupil is enlarged when the mood is high, and the pupil is reduced when the mood is low [12].
-
②
Time of gaze
It refers to the time difference between the first time the subject is gazing at the departure of a certain area of the sample. Combined with the eye movement data analysis software, the visual center distribution of the subject during the experiment can be understood.
-
③
Order of gaze
It refers to the order in which the subjects look at all areas of the sample during the experiment. The analysis of the data can indirectly obtain the subject’s interest in all areas of the sample.
-
④
Number of times of review
It refers to the number of times the subject repeatedly looks at the local area after the sample is observed and re-watches the area that has already been watched. It represents the degree of which the subject pays attention to the area being looked back.
In the course of this experiment, because the test time is short, it can’t cause the subject’s emotional fluctuations. Therefore, the gaze time, the gaze order, and the number of times of return are used as the basis for evaluation and analysis.
-
①
-
(3)
Eye movement experiment
The general flow of eye movement experiment is shown in Fig. 2.
-
①
The main tester formulates the eye movement experiment plan and tasks, pre-commissions the eye movement experiment equipment, etc., and introduces the designed experimental materials into the eye movement experiment software system.
-
②
The main tester explained the purpose of the experiment and the precautions to the subject, and obtained the consent of the subject.
-
③
Perform eye movement test calibration on the subject under the guidance of the main tester.
-
④
After confirming the calibration, perform the experimental phase. First, the subject should watch the instruction, then press “Space” or “→” to enter the next page until the experiment is completed. During the experiment, the subject can make appropriate visual adjustments or rest according to the requirements, this process is not included in the statistics of the research results.

Eye movement experiment flow chart
4 Product Design Elements Evaluation Model Under Target Image
According to the literature [13], the subject’s gaze time for the design element g is defined as t, Where x is the order in which the subject is gazing; v1 is a sequence factor that distinguishes the importance of the order, and its value ranges from [1, 2]. When the first gaze, the gaze factor takes a value of 2. The elements are sequentially reduced by x/u after each gaze; u is the number of all effective fixation points for each test sample experiment, and the gaze time \( t(2 - {x \mathord{\left/ {\vphantom {x u}} \right. \kern-0pt} u}) \) of each design element g is obtained according to the order of gaze.
When a design element has a time of return \( t^{{\prime }} \) in the test, the number of times the subject has returned to the design element g is defined as α. v2 is the review factor in the experimental process, and the value range is [1, 2], wherein the value of the first back view is 1, and as the number of review increases, the review factor is gradually increased by 1/20. Each design element g may have multiple views, so the return time of each design element g should include the sum of multiple back time, and each time \( t^{{\prime }} (1 + {{(\alpha - 1)} \mathord{\left/ {\vphantom {{(\alpha - 1)} {20}}} \right. \kern-0pt} {20}}) \) of each design element is obtained.
Finally, the weight of each design element g is
In the formula: Weight represents the weight value of a design element, which is ranged from [0, 1]; i represents the research sample, i = 1, 2, …, m; h represents the subject, h = 1, 2, …, n; β represents the total number of times the design element g is viewed back; Total represents the sum of all valid gaze times for completing a sample experiment.
In the ranking contribution of the whole design elements, the higher the front, the greater the weight value, which indicated that needs to be valued in the product image design.
5 Case Study
5.1 Identify Research Samples and Initial Emotional Images
As an experimental research sample, 85 initial samples of soymilk machine were collected from websites, periodicals, newspapers and other fields totally. Through expert discussion, similar samples were removed, and 15 final research samples were obtained. In order to eliminate interference from other factors, remove the elements such as sample color and logo, then obtain the research sample set S = {s1, s2, …, s15}, as shown in Fig. 3. Using network data survey and cluster analysis, the experimental sample modeling image set B = {Atmospheric, Succinct, Exquisite, Stylish} is obtained.

Research sample set
5.2 Identify the Target Image
Combine the sample dataset with the modeling image set to create a SD 5 rating questionnaire, in the form of semantic difference method, 14 postgraduates and 2 undergraduates in product design are surveyed, take the “atmosphere” as an example. The most atmospheric feeling is 5 points, and the least atmospheric feeling is 1 point. After the questionnaire was completed, the interviewees were interviewed by oral interview. The invalid questionnaire was removed, and 15 results were obtained. After the average value was processed, the formula (2) was used to calculate the weight of the modeling image as shown in Table 1.
According to the data in the table, the “Fashionable” has the largest weight, which is 0.3437. Therefore, the Stylish will be taken as the target image of the research sample in the subsequent research.
5.3 Specific Experimental Process
According to the sample picture, it is made into eye tracking research material, the purpose of evaluating the sample design elements is achieved through the eye tracking experiment. Taking sample 1 as an example, the experimental material 1 is obtained as shown in Fig. 4.

Experimental material 1
-
(1)
Set the experimental instruction: press “→” on the keyboard to enter the next page, use the “fashionable” as the evaluation basis, and score 5 points on the sample picture. The most fashionable is 5 points, the least fashion is 1 point, press “→” Go to the next page.
-
(2)
Commissioning of experimental equipment by the main tester.
-
(3)
Adjust the image material resolution to 1366 * 768 pixels and import it into the ErgoLAB software device along with the instructions. In order to reduce the influence of the previous sample evaluation, the test results were credible, and the set samples appeared randomly, but all of them appeared only one time, as shown in Fig. 5. Test the entire experimental process, observe the experimental environment, and enter the experimental stage after confirmation.
Fig. 5. 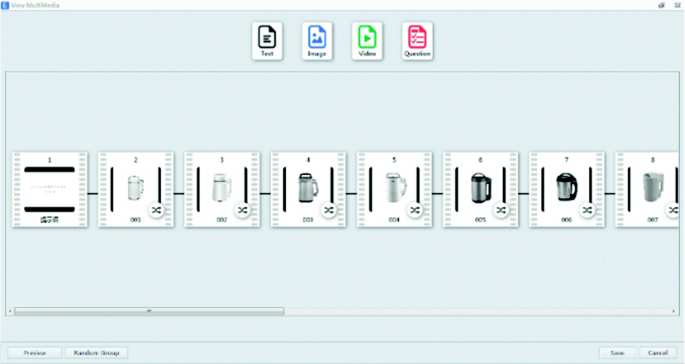
Map of experimental material import
-
(4)
Subjects
The purpose of this experiment is to evaluate the sample of the study based on the image, and to achieve the purpose of evaluating the design elements through the calculation of eye movement data. In this experiment, there were 13 students in the school, including 2 undergraduates, 10 postgraduates, and 1 doctoral student. All the subjects were design-related majors, and they had a certain understanding of the Kansei Engineering. They were familiar with the research and development of the soymilk machine in terms of function and model. Through the explanation of the main tester, the subjects indicated that the experiment could be successfully completed, and all subjects had corrected visual acuity of 1.0 or above, right hand.
-
(5)
Eye movement calibration
The main tester informed the subject to start the calibration test before the experiment, the first is sitting posture and distance adjustment. The two spots are presented in the software interface after the eyes of the subject were captured by the eye tracker as shown in Fig. 6. When the two strips on the right and the bottom are stably green, the eye tracker can detect the visual information to the subject and the signal is stable.
Fig. 6. 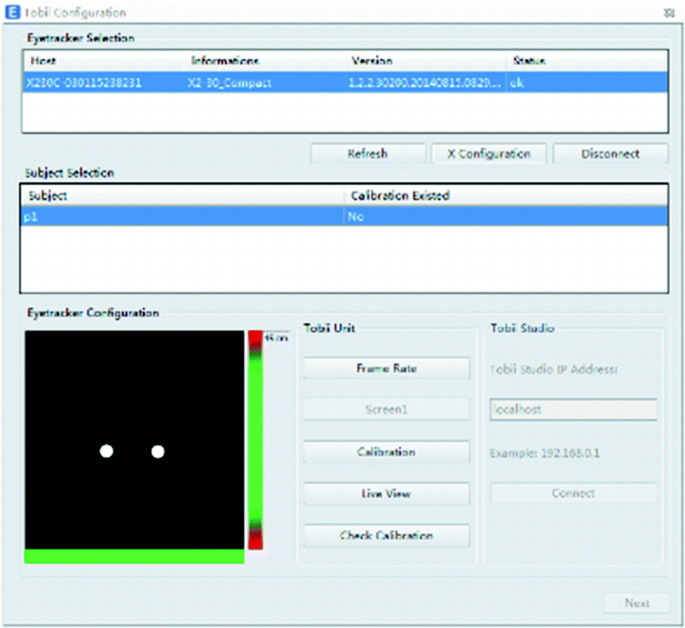
Calibration interface for eye movement experiments
Next process is the calibration, the subject will see a moving red dot, the line of sight follows the point of movement, the result after the end of the calibration as shown in Fig. 7, showing the error vector of the calibration, each the size of the red line segment represents the difference between the calculated gaze point and the actual rendered calibration point. If the red line segment of a point is long or there is no line segment, it needs to be rescaled. After the calibration is completed, start the experiment.
Fig. 7. 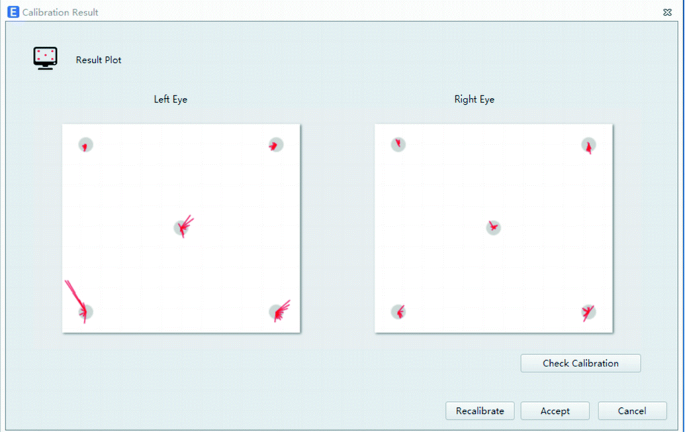
Eye movement calibration
-
(6)
After the preparation of the pre-experiment, the main tester guides each subject to sit in the fixed seat and informs the purpose of the experiment, which is to calculate the eye tracking data through analysis and to achieve the purpose of the product elements evaluation.
-
(7)
13 subjects underwent eye tracking experiments in sequence until the end.
-
(8)
Statistical analysis of experimental results
The experimental data output interface as shown in Fig. 8. The data was statistically analyzed by ErgoLAB software. According to the purpose and requirements of the experiment, unreasonable experimental data is removed (eye movement information is not on the sample or eye tracker does not collect eye movement information, etc.), the statistical data includes the subject’s first gaze time, number of gaze, and time of return, and the order of viewing, etc.
Fig. 8. 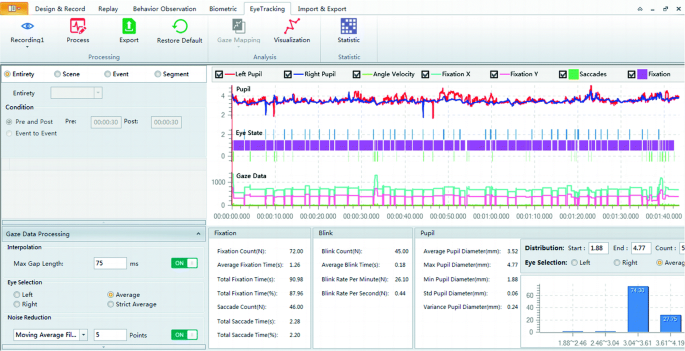
Output interface of eye movement data


5.4 Output Experiment Results
After all the subjects completed the experiment in turn, the main tester used the ErgoLAB eye movement data processing software to output the eye movement data, and the output content included the subject’s gaze time, blink frequency, pupil change, eye movement heat map and the like. The main tester conducted statistical analysis on the data and obtained experimental conclusions.
The soymilk machine model is divided into: handle (g1), nose (g2), cup (g3) and grip (g4) through the morphological analysis method and expert discussion method, taking sample 1 as an example, the distribution of design elements as shown in Fig. 9. According to the calculation of formula (4), the proportion of each design element of the sample is obtained, as shown in Table 2.

Distribution map of design elements
6 Discussion
Eye movement information is a representation of physiological signals, as well as a reflection of psychological cognition. It is a driving force for the evolution of product model. In the course of our interview, all the subjects said that when evaluating the product model image, the first concern is the overall shape of the sample. After having a preliminary grasp of the whole, we will consider the details of the product, it is the evaluation of product design elements. Among them, 84.6% of the subjects indicated that the focus was the cup, and 69.2% of them indicated that the second was the nose, which is consistent with the calculated results. At the same time, relevant research shows that the consumer’s psychological cognition and physiological response are consistent [14], so the eye movement tracking product design elements evaluation model is reasonable.
Of course, there may be other reasons for this. When we interviewed other designers, including the subjects, part of them thought that in almost every sample, the area of the “cup” would be larger than other design elements, which would make the eye movement information fall in the area. The chance of being physically will be significantly higher than other design elements, resulting in the presentation of results. Similarly, part of them said that during the experiment, the cup is often in the middle of the screen, which will first attract visual attention. It will mislead to such experimental results.
In the follow-up study, we will divide into two experiments. The first is to explore the correlation between area and eye movement information. The area of the design element is used as an independent variable, and the eye movement information is used as a dependent variable. The second part is to randomly change the position of the sample on the screen to explore the relationship between the position of the design elements and the eye movement information. Combining the above two experimental results, the rationality of eye movement information and design factor evaluation model is discussed again.
Product design element is an important part of product model. In terms of function, any design element is indispensable. In terms of form, the design elements and the correlation between them constitute the overall model of the product, and there is a coupling relationship between them. Generally, we think that the more coupling between the elements, the better, because it represents the integrity of the product model, but the degree of coupling is too high, which often makes the product lack of uniqueness, so that it loses the beauty of model design. What is the optimal range of coupling between design elements to ensure the integrity and aesthetics of the product model? Therefore, the evaluation of the coupling degree between product design elements and the correlation include the coupling between design elements and product model images will be the hot issues of subsequent research.
References
Chen, C.H., Sato, K., Lee, K.P.: Editorial: human-centered product design and development. Adv. Eng. Inform. 23(2), 140–141 (2009)
Su, J.N., Wang, P., Zhang, S.T., et al.: Research progress on key technologies of product image model design. J. Mech. Des. 30(1), 97–100 (2013)
Niu, W.P., Yao, J., Li, X.Z., et al.: Interior design of medium-sized excavator facing to driver security needs. J. Mech. Des. 33(7), 125–128 (2016)
Li, Y., Guo, G.: Selection model of product shape schemes based on multiple eye movement data. J. Comput. Integr. Manuf. Syst. 22(3), 658–665 (2016)
Tang, B.B., Guo, G., Wang, K., et al.: User experience evaluation and selection of automobile industry design with eye movement and electroencephalogram. J. Comput. Integr. Manuf. Syst. 21(6), 1449–1459 (2015)
Kristian, P., Tanel, M., Andres, K.: Considering emotions in product package design through combining conjoint analysis with psycho physiological measurements. Procedia Soc. Behav. Sci. 148(25), 280–290 (2014)
Cheng, S.W., Liu, Y.: Eye-tracking based adaptive user interface: implicit human-computer interaction for preference indication. J. Multimodal User Interfaces 5(2), 77–84 (2012)
Wang, Z.Y., Li, H.W.: Automotive styling feature extraction and cognition based on the eye tracking technology. Packag. Eng. (20), 54–58 (2016)
Gray, R.M.: Entropy and Information Theory, 2nd edn. Springer, NewYork (2011). https://doi.org/10.1007/978-1-4419-7970-4
Su, J.N., Zhang, X.X., Jing, N., et al.: Research on the entropy evaluation of product styling image under the cognitive difference. J. Mech. Des. 33(3), 105–108 (2016)
Koffka, K.: The Principle of Gestalt Psychology. Zhejiang Education Publishing House, Hangzhou (1997)
Antonio, L., Gaetano, V., Enzo, P.S.: Eye gaze patterns in emotional pictures. J. Ambient Intell. Humaniz. Comput. 4(6), 705–715 (2013)
Chen, X.J., Yan, H.X., Xiang, J.: Study of decoding mental state based on eye tracks using SVM. Comput. Eng. Appl. 47(11), 39–42 (2011)
Zhang, X.W.: Research of modeling theory and method in computational psychophysiology. Lanzhou University (2016)
Acknowledgments
The authors would like to extend our sincere thanks to all those who contributed to this study, especially the subjects who took the trouble to take part in experiments. The project is sponsored by National Natural Science Foundation of China (51465037), Hongliu Outstanding Talent Development Program of Lanzhou University of Technology (J201406).
Author information
Authors and Affiliations
Corresponding author
Editor information
Editors and Affiliations
Rights and permissions
Copyright information
© 2019 Springer Nature Switzerland AG
About this paper

Cite this paper
Yang, W., Su, J., Qiu, K., Zhang, X., Zhang, S. (2019). Research on Evaluation of Product Image Design Elements Based on Eye Movement Signal. In: Harris, D. (eds) Engineering Psychology and Cognitive Ergonomics. HCII 2019. Lecture Notes in Computer Science(), vol 11571. Springer, Cham. https://doi.org/10.1007/978-3-030-22507-0_17
Download citation
DOI: https://doi.org/10.1007/978-3-030-22507-0_17
Published:
Publisher Name: Springer, Cham
Print ISBN: 978-3-030-22506-3
Online ISBN: 978-3-030-22507-0
eBook Packages: Computer ScienceComputer Science (R0)