
Abstract
Objective
We aimed to estimate the changes to the delivery of routine immunizations and well-child visits through the pandemic.
Methods
Using linked administrative health data in Ontario and Manitoba, Canada (1 September 2016 to 30 September 2021), infants <12 months old (N=291,917 Ontario, N=33,994 Manitoba) and children between 12 and 24 months old (N=293,523 Ontario, N=33,001 Manitoba) exposed and unexposed to the COVID-19 pandemic were compared on rates of receipt of recommended a) vaccinations and b) well-child visits after adjusting for sociodemographic measures. In Ontario, vaccinations were captured using physician billings database, and in Manitoba they were captured in a centralized vaccination registry.
Results
Exposed Ontario infants were slightly more likely to receive all vaccinations according to billing data (62.5% exposed vs. 61.6% unexposed; adjusted Relative Rate (aRR) 1.01 [95% confidence interval (CI) 1.00-1.02]) whereas exposed Manitoba infants were less likely to receive all vaccines (73.5% exposed vs. 79.2% unexposed; aRR 0.93 [95% CI 0.92-0.94]). Among children exposed to the pandemic, total vaccination receipt was modestly decreased compared to unexposed (Ontario aRR 0.98 [95% CI 0.97-0.99]; Manitoba aRR 0.93 [95% CI 0.91-0.94]). Pandemic-exposed infants were less likely to complete all recommended well-child visits in Ontario (33.0% exposed, 48.8% unexposed; aRR 0.67 [95% CI 0.68-0.69]) and Manitoba (55.0% exposed, 70.7% unexposed; aRR 0.78 [95% CI 0.77-0.79]). A similar relationship was observed for rates of completed well-child visits among children in Ontario (aRR 0.78 [95% CI 0.77-0.79]) and Manitoba (aRR 0.79 [95% CI 0.77-0.80]).
Conclusion
Through the first 18 months of the pandemic, routine vaccines were delivered to children < 2 years old at close to pre-pandemic rates. There was a high proportion of incomplete well-child visits, indicating that developmental surveillance catch-up is crucial.
Résumé
Objectif
Nous avons voulu estimer les changements dans l’administration des vaccins de routine et dans les consultations pédiatriques pendant la pandémie.
Méthode
À l’aide des données administratives sur la santé couplées de l’Ontario et du Manitoba, au Canada (1er septembre 2016 au 30 septembre 2021), nous avons comparé les taux de réception : a) des vaccins recommandés et b) des consultations pédiatriques recommandées pour les nourrissons de < 12 mois (N = 291 917 en Ontario, N = 33 994 au Manitoba) et pour les enfants de 12 à 24 mois (N = 293 523 en Ontario, N = 33 001 au Manitoba) exposés et non exposés à la pandémie de COVID-19, après ajustement en fonction de mesures sociodémographiques. En Ontario, les vaccins ont été saisis à l’aide de la base de données des factures des médecins; au Manitoba, ils ont été saisis dans un registre de vaccination centralisé.
Résultats
Les nourrissons exposés en Ontario étaient légèrement plus susceptibles de recevoir tous les vaccins selon les données de facturation (62,5 % pour les nourrissons exposés c. 61,6 % pour les nourrissons non exposés; risque relatif ajusté [RRa] 1,01 [intervalle de confiance (IC) de 95 % 1,00-1,02]), tandis que les nourrissons exposés au Manitoba étaient moins susceptibles de recevoir tous les vaccins (73,5 % pour les nourrissons exposés c. 79,2 % pour les nourrissons non exposés; RRa 0,93 [IC de 95 % 0,92-0,94]). Chez les enfants exposés à la pandémie, le total des vaccins reçus était un peu plus faible que chez les enfants non exposés (RRa en Ontario 0,98 [IC de 95 % 0,97-0,99]; RRa au Manitoba 0,93 [IC de 95 % 0,91-0,94]). Les nourrissons exposés à la pandémie étaient moins susceptibles d’avoir eu toutes les consultations pédiatriques recommandées en Ontario (33 % pour les nourrissons exposés, 48,8 % pour les nourrissons non exposés; RRa 0,67 [IC de 95 % 0,68-0,69]) comme au Manitoba (55 % pour les nourrissons exposés, 70,7 % pour les nourrissons non exposés; RRa 0,78 [IC de 95 % 0,77-0,79]). Une relation semblable a été observée pour les taux de consultations pédiatriques complètes chez les enfants en Ontario (RRa 0,78 [IC de 95 % 0,77-0,79]) et au Manitoba (RRa 0,79 [(IC de 95 % 0,77-0,80]).
Conclusion
Au cours des 18 premiers mois de la pandémie, les vaccins de routine ont été administrés aux enfants de < 2 ans à des taux proches de ceux d’avant la pandémie. Il y a eu une forte proportion de consultations pédiatriques incomplètes, ce qui indique qu’il est essentiel de rattraper la surveillance du développement.
Introduction
The coronavirus disease 2019 (COVID-19) pandemic contributed to disruption of the delivery of core preventive child health services including routine immunizations and well-child visits (Causey et al., 2021). Disruptions of immunizations services, even for discrete time periods, can result in increased likelihood of vaccine-preventable disease outbreaks (WHO, 2020). An under-vaccinated population related to vaccination disruption from COVID-19 has been a cause of concern for re-emerging vaccine-preventable diseases such as polio (Rigby, 2022). In addition, routine well-child visits provide health supervision, anticipatory guidance, screening, and management of acute and chronic conditions, and care coordination. Early identification and intervention is important in many childhood conditions such as in developmental delays whereby missed or delayed diagnosis can have long-term health consequences (Canadian Task Force on Preventive Health Care, 2016). When routine appointments are not accessible or delivered virtually, parents may defer care or seek health services in emergency departments with consequences to the healthcare system and child health outcomes.
Globally, marked disruptions to routine immunizations were documented in the first year of the pandemic, with measles and tetanus vaccination coverage reduced by over 7% (Causey et al., 2021). In Canada, studies from different provinces have shown a similar reduction in vaccine uptake within the first year of the pandemic (Dong et al., 2022; Ji et al., 2022; Kiely et al., 2021; Lee et al., 2022; MacDonald et al., 2022; Sell et al., 2021). Reports of delayed and missed vaccinations caused public health concerns resulting in Canada’s National Advisory Committee on Immunization recommending prioritizing primary immunization series up to 18 months old during the pandemic, and provinces and territories implementing vaccine catch-up programs (NACI, 2020; Allan et al., 2021).
In both Ontario and Manitoba, we have previously observed a large shift to virtual primary care during the pandemic and an initial decline with some recovery in the rates of well-child visits (Glazier et al., 2021; Saunders et al., 2021). The effects of such large shifts from office to virtual care on routine immunizations and recommended well-child visits are unknown, particularly after allowing for a period of catch-up (Saunders et al., 2021).
We aim to quantify differences in immunization and preventive care visits completed before 12 months of age, and between 12 and 24 months of age, for children post COVID-19 pandemic onset, compared to children before pandemic onset in two Canadian provinces, Manitoba (population ~1.4 million) and Ontario (population ~15 million). We capture immunization and well-child visit rates up until September 2021. Due to the disrupted delivery of services, we hypothesized that the proportion of infants and children who received all vaccines or well-child visits would be lower if they were exposed to the pandemic compared to unexposed infants and children. Our secondary objective was to describe and quantify changes in the receipt of individual vaccines and well-child visits.
Methods
Study design, setting, and population
This was a population-based cohort study of children 0 to 24 months old, born between 2016 and 2020 in Ontario and Manitoba, using linked health and administrative data. The exposed cohort had all vaccines and visits after the pandemic onset and was exposed to at least 6 months of the pandemic, as defined from 1 March 2020 to 30 September 2021, and therefore born between 1 September 2018 and 30 September 2020. The unexposed cohort had all visits and vaccinations prior to the pandemic onset and completed prior to 17 March 2020, thus were born between 1 September 2016 and 30 September 2018. The last date of data collection was 30 September 2021. Pre-pandemic (unexposed) and post-pandemic (exposed) infant and child cohort definitions by birth date are illustrated in Fig. 1.
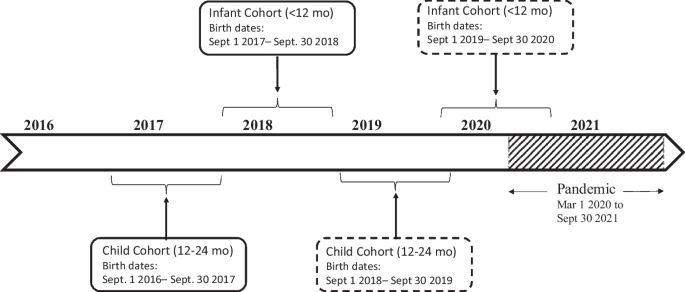
Definition of infant (< 12 months old) and children (12-24 months old) cohorts. Exposed cohort (subjects with recommended immunizations and visits post-pandemic onset) are in dashed lines. Unexposed cohort (subjects with all recommended immunizations and visits pre-pandemic onset) are in continuous lines. Exposure to the pandemic defined as 6 months or more (COVID-19 pandemic defined as 1 March 2020 to 30 September 2021)
Cohort numbers and exclusions are shown in Fig. 2. Infants were excluded if their demographic information (birthdate and sex) was unknown, if they were not Ontario/Manitoba residents at the time of birth and therefore not eligible for coverage through the Ontario/Manitoba Health Insurance Plan, if they were hospitalized at birth for greater than 6 weeks, if their birth records could not be reliably linked (invalid sex or linkage number), or if there was less than 12 months of follow-up.
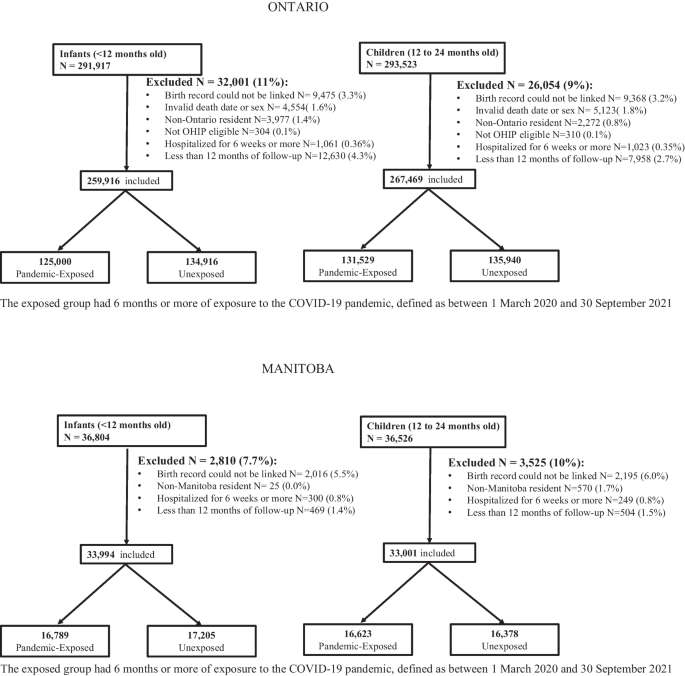
Flowsheet of participant inclusions and exclusions
Data sources
We utilized health administrative and demographic databases housed and linked at ICES in Ontario and the Manitoba Centre for Health Policy. See Supplementary Table 1 for databases and their content. Individual-level records were linked by unique encoded identifiers derived from the health care numbers of individuals eligible for provincial health insurance coverage. We used demographic information (date of birth, sex and postal code) from provincial health insurance registries (Ontario’s Registered Persons Database, Manitoba Health Insurance Registry) and physician billings databases (Ontario Health Insurance Plan, Manitoba Medical Services) to ascertain outpatient physician visits to family physicians and pediatricians.
Childhood immunizations and well-baby visits are largely administered in outpatient settings through family physicians/general practitioners and pediatricians in Ontario. In Manitoba, vaccinations and well-baby visits are additionally administered by public health nurses, particularly in rural health regions (Hilderman et al., 2011). In Ontario, vaccination data are captured by billing claims. In September of 2011, vaccine-specific billing codes were introduced. A validation study showed high positive predictive value and high specificity, with moderate sensitivity (Schwartz et al., 2015). Unlike in Ontario, Manitoba’s immunization data are in a centralized immunization registry and thus not dependent on provider billing completeness and accuracy. In Manitoba, vaccination rates were defined using the Public Health Information Management System (PHIMS) data. See Supplementary Table 2 for codes used for Ontario and Manitoba.
Outcomes
Vaccinations
As per the Ontario Immunization Schedule, infants should receive 3 doses of the diphtheria, tetanus, pertussis, polio, and haemophilus influenzae type B (DTaP-IPV-HiB) vaccines and 2 doses of the pneumococcal conjugate 13 (Pneu-C-13) vaccine in the first 6 months of life. The recommendations are that children receive one additional dose of Pneu-C-13, measles, mumps and rubella (MMR) and meningococcal type C (Men-C-C) at 12 months, along with a dose of varicella at 15 months and DTap-IPV-HiB at 18 months. The Manitoba vaccine schedule recommended by Manitoba Health has the same recommendations with the following exception: the MMR vaccine is combined with the varicella vaccine (MMRV). Manitoba immunization data include data on Rotavirus immunization, but these data were not available in Ontario and thus not reported.
For infants, our primary outcome was receipt of 3 doses of DTaP-IPV-HiB and 2 doses of Pneu-C-13 by the age of 12 months. For children, our primary outcome was receipt of 1 dose of Pneu-C-13, MMR or MMRV (in Manitoba), and Varicella (in Ontario), Men-C-C, and DTap-IPV-HiB between 12 and 24 months. In Ontario, only vaccinations that were billed by a physician were captured. No minimum time period was required between vaccine doses. Supplementary Figures 1 and 2 illustrate distribution of age of receipt for each vaccine. In both age groups, we allowed 6 months from the last recommended dose timing to allow for vaccine catch-up. Secondary outcomes were the proportion of recommended doses for individual vaccines.
Well-child visits
In Ontario, well-child visits occur at 2, 4, 6, 9, 12, 15, and 18 months of age as recommended by the Rourke Baby Record (Rourke & Rourke, 1985), along with recommendations for an ‘enhanced’ 18-month visit (Williams et al., 2008). Enhanced 18-month visits in Ontario occur in lieu of a well-baby visit, and contain a more comprehensive developmental assessment and have a unique billing code. In Manitoba the recommendations are similar, but without a routine recommendation for a 15-month visit nor the option for an ‘enhanced’ 18-month visit (Doctors Manitoba, 2021). From both primary and secondary outcomes, well-child visits that occurred within the first 30 days of life were excluded as these were considered newborn visits, which vary in frequency and indication. In Ontario, a small proportion (<1%) of primary care is provided through community health centres, salaried physicians and/or nurse practitioners who may shadow bill. Due to data limitations, these visits were not included. In Manitoba, although vaccinations by public health nurses were captured, well-baby visits by the same public health nurses were not captured in physician billing databases and thus not reported in this study.
For infants, our primary outcome was receipt of 4 well-child visits by 12 months of age in Ontario and Manitoba.
For children 12 to 24 months in Ontario, we defined the primary outcome as completion of 3 well-child visits (including the 18-month enhanced visit) and in Manitoba, this primary outcome was defined as 2 well-child visits between 12 and 24 months of age. We also report the average number of visits completed. Any well-baby visit, whether virtual or not, was captured.
Covariates
Demographic data captured included maternal age and parity, area of residence (urban vs rural), socioeconomic measures such as neighbourhood income quintile, and provincial health region. The primary care practitioner who provided the majority of primary care to the child was determined using the physician billing codes listed in Supplementary Table 2. Primary care affiliation was classified as family physician/general practitioner, pediatrician, primary care nurse, and no assigned primary care provider. Continuity of care was provided for descriptive purposes but not used in the model, and was defined as those where ≥ 76% of all visits were to their assigned provider. Covariates included in the model were chosen that had a known association with receipt of health services such as vaccination (Chiem et al., 2022; Glazier et al., 2015; Saunders et al., 2021; Walton et al., 2022).
Analysis
We conducted Ontario and Manitoba analyses separately because individual-level information cannot be combined across provinces. Demographic and baseline characteristics were reported using percentages, mean, median, standard deviations and inter-quartile range (IQR).
We generated Poisson models to compare infants who received their vaccinations and well-child visits during the pandemic compared to those pre-pandemic. Relative risks (aRR, 95% confidence intervals, CI) were estimated. Models were adjusted for maternal age at delivery, parity, neighbourhood income, rurality, health region, and type of health care provider.
Missing neighbourhood income was merged with the lowest income quintile as these neighbourhoods are mostly marginalized.
We performed a sensitivity analysis excluding infants eligible for immunizations or well-child visits prior to their exposure period, restricting the analysis to infants who were a maximum of 2 months old at the start of the pandemic, and children a maximum of 12 months old at the start of the pandemic. Please see Supplementary Tables 3, 4 and 5 for sensitivity analysis results and definitions. In addition, to explore if there were differences in Canada’s largest metropolitan area, we performed a sensitivity analysis utilizing a variable that identified infants and children living in the Greater Toronto Area (GTA). Please see Supplementary Tables 6, 7, 8 and 9 for results.
All statistical analyses were done in SAS ® version 9.4 (SAS Institute, Cary, NC).
Results
This study included 259,916 infants in Ontario and 33,994 in Manitoba (after exclusions), and 267,469 children in Ontario and 33,001 in Manitoba (after exclusions) (Figure 2). In Manitoba, maternal age was younger, with a greater proportion having had previous pregnancies, and living rurally (Table 1). In both provinces, a high proportion of individuals had a primary care provider, although in Manitoba, children between the ages of 12 and 24 months were least likely to have a primary care provider assigned, especially if exposed to the pandemic.
Figures 3 and 4 illustrate relative risks and 95% confidence intervals for vaccinations and well-child visit outcomes for the infant and child cohorts, respectively.
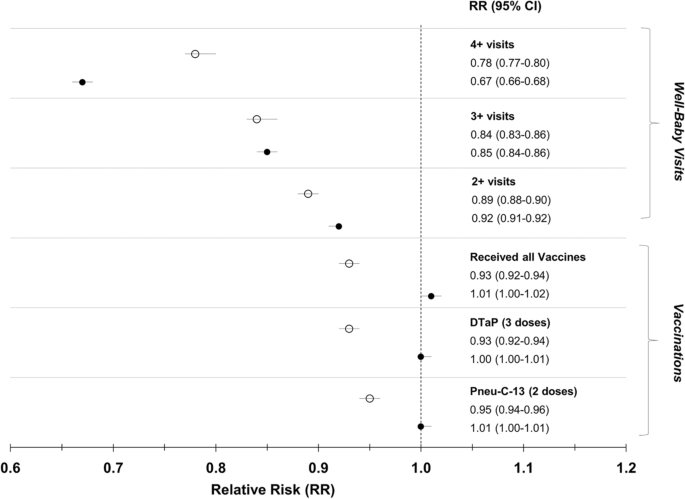
Receipt of vaccinations and well-child visits in Ontario, and Manitoba, comparing infants less than 12 months of age post-pandemic to infants pre-pandemic. The black circles represent Ontario, the white circles represent Manitoba. The Poisson model was adjusted for maternal age at delivery, parity, neighbourhood income, rurality, health region, and health care provider. Received all vaccinations refers to having received 3 doses of DTaP and 2 doses of Pneu-C-13 for infants < 12 months. DTaP = diphtheria, tetanus, pertussis, polio, and haemophilus influenzae type B, Pneu-C-13 = pneumococcal conjugate 13
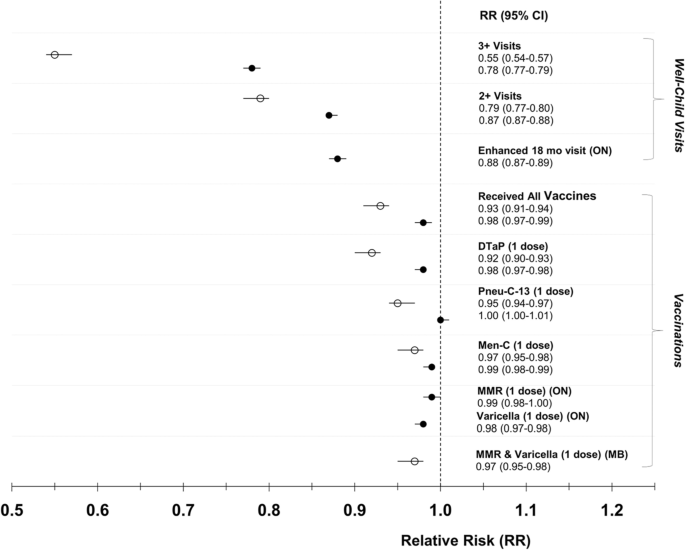
Receipt of vaccinations and well-child visits in Ontario and Manitoba, comparing children between 12 and 24 months old post-pandemic to children pre-pandemic. The black circles represent Ontario, the white circles represent Manitoba. The Poisson model was adjusted for maternal age at delivery, parity, neighbourhood income, rurality, health region, and health care provider. In Ontario, received all vaccinations refers to having received 1 dose each of DTaP, Pneu-C-13, Men-C-C, MMR, and Varicella between the ages of 12 and 24 months. In Manitoba, received all vaccinations refers to having received 1 dose each of DTaP, Pneu-C-13, Men-C-C, MMR, and Varicella between the ages of 12 and 24 months. DTaP = diphtheria, tetanus, pertussis, polio, and haemophilus influenzae type B; Pneu-C-13 = pneumococcal conjugate 13; Men-C-C = meningococcal type C; MMR = measles, mumps and rubella; MMR-V = measles, mumps, and rubella and varicella
Vaccinations
In Ontario, according to billing data there was an increase of 0.9% in receipt of all vaccinations in children 0-12 months of age during the pandemic compared to prior [62.5% (N=78,175) vs 61.6% (N=83,068), aRR 1.01 (95% CI 1.00-1.02)] (Table 2, Figure 3). In Manitoba, there was a decline of 5.7% [73.5% (N=12,343) vs 79.2% (N=13,621), aRR 0.93 (95% CI 0.92-0.94)] (Figure 3). The proportion of infants who received the recommended number of doses of the individual vaccines was similar to the overall proportion who received all vaccines for both provinces (Table 2).
In Ontario, there was a decline of 0.8% in receipt of all vaccinations in children 12-24 months of age during compared to prior to the pandemic [48.9% (N=64,290) vs 49.7% (N=67,604), aRR 0.98 (95% CI 0.97-0.99)] (Table 3, Figure 4). In Manitoba, this decline was 5.4% [(67.1% (N=11,160) vs 72.5% (N=11,876), aRR 0.93 (95% CI 0.91-0.94)] (Table 3, Figure 4). In both provinces, across pre- and post-pandemic groups, there was a similar rate of receipt of single dose of recommended vaccines.
Supplementary Figures 1 and 2 show the distribution of vaccination doses received by age in months in infants and children. Distributions were similar before and during the pandemic, as well as between provinces.
Well-child visits
In Ontario, of infants less than 12 months of age post-pandemic, 33.0% (N=41,247) completed at least 4 well-child visits, compared to 48.8% (N=65,810) pre-pandemic [difference = 15.8%, aRR of 0.67 (95% CI 0.66-0.68)] (Table 2, Figure 3). Of those, 17.9% (N=22,415) of infants did not receive any well-child visits compared to 14.4% (N=19,492) pre-pandemic. In Manitoba, 55.0% (N=9235) of infants less than 12 months of age post-pandemic had received 4 or more well-child visits, compared to 70.7% (N=12,168) pre-pandemic [difference = 15.7%, aRR 0.78 (95% CI 0.77-0.80)] (Figure 3). Similar to Ontario, more post-pandemic infants did not have any well-child visits (15%, N=2514) compared to pre-pandemic (8.3%, N=1425).
Children in Ontario post-pandemic were less likely to have received at least 3 well-child visits between 12 and 24 months of age compared to those pre-pandemic (30.2% [N=39,758] vs 38.4% [N=52,157], difference = 8.2%) corresponding to an aRR 0.78 (95% CI 0.77-0.79) (Table 3, Figure 4). Of those post-pandemic, 54.9% (N=72,182) received the enhanced 18-month well-child visit compared to 62.1% (N=84,395) pre-pandemic aRR 0.88 (95% CI 0.87-0.89) (Table 3, Figure 4). In Manitoba, 55.0% (N=9143) of children post-pandemic had received at least 2 well-child visits as recommended in this province between 12 and 24 months of age, compared to 70.1% (N=11,476) pre-pandemic, a decline of 15.1% and aRR 0.79 (95% CI 0.77-0.80) (Table 3, Figure 4).
Sensitivity analyses revealed similar results and there were no clinically important differences between the main and sensitivity analyses results (Supplementary Tables 3, 4, 5, 6, 7, 8 and 9).
Discussion
In this large population-based study of infants and children across two provinces in a single payer healthcare system, we observed a modest reduction in completion of vaccine series during the COVID-19 pandemic up to September 2021. In contrast, there was a large reduction in completion of recommended well-child visits in both provinces (an absolute difference of 8-15% in Ontario and 15-16% in Manitoba). These findings are important to understand the impact of the pandemic on preventive care delivery, which in turn can inform a tailored response to catch up on missed preventive opportunities.
The change in vaccination rates during the pandemic compared to pre-pandemic was a 0.8% decline in children and a 0.9% increase in infants in Ontario based upon billing data, whereas it was a 5.4-5.7% decline in Manitoba. This interprovincial difference was not anticipated. In Manitoba, public health nurses contribute substantially to rates of childhood immunization, and also perform well-baby visits, where they are responsible for 99.6% of childhood vaccinations in rural Manitoba (Hilderman et al., 2011). During the pandemic, public health nurses were reassigned to case and contact management of COVID-19 (Daly, 2022). About 40% of Manitobans live in non-metropolitan areas, compared to 15% in Ontario. Other factors affecting a lag in catch-up vaccinations could include enforcement of stay-at-home orders, caregiver perception that vaccinations are non-essential, fears of contracting COVID-19 in a healthcare facility, and barriers to accessing well-child visits (Piché-Renaud et al., 2021). Manitoba issued extensive public health restrictions until May 2020 and re-instituted them in August 2020 (Blake-Cameron et al., 2021). First Nations communities in Manitoba, often rural, continued to implement restrictions beyond the provincial mandates. Gradual restrictions in Ontario occurred starting in March 2020 with gradual re-opening by region in May 2020. It is unclear how timing or severity of restrictions between the provinces could have affected access to or uptake of routine childhood vaccination (Blake-Cameron et al., 2021). In addition, Ontario issued personal protective equipment (PPE) at no cost to community family physicians by August 2020, while physicians in Manitoba voiced concerns over the availability of PPE (CPSM, 2020). Both Ontario and Manitoba had public health or expert roundtables call for maintaining routine vaccination in children, resulting in targeted vaccine catch-up programs (Allan et al., 2021; NACI, 2020). Given these dynamic changes during the pandemic, the strength of our study is that it measures the receipt of vaccinations and well-baby visits by September 2021 providing a catch-up period after the period of strict public health restrictions.
Across North America, incomplete and delayed immunization for children under 24 months of age increased in 2020 with some indications for recovery late in 2020 (DeSilva et al., 2022; Dong et al., 2022; Ji et al., 2022; Kujawski et al., 2022; Piché-Renaud et al., 2021; Lee et al., 2022; Saini et al., 2017). This raised concerns over how small changes in vaccine coverage have potentially increased the population risk for vaccine-preventable diseases (Payne, 2022; Piché-Renaud et al., 2021; Sell et al., 2021). Overall, vaccinations after 12 months of age decreased to a greater extent than those prior to 12 months of age (Kiely et al., 2021; Saini et al., 2017). Vaccination coverage (doses of vaccine administered) showed recovery in Quebec with vaccination coverage for MMR below 2019 rates by 2-3% in November 2020 (Kiely et al., 2021). In Alberta, MMR coverage declined by 9.9% in April 2020 compared to 2019, but showed recovery by July 2020 (MacDonald et al., 2022). Rates of immunization uptake vary by parental concerns about visiting health facilities, socioeconomic status, staff shortages, and clinic model (Dong et al., 2022; Ji et al., 2022; Sell et al., 2021). A large cross-sectional study in the United States using commercial healthcare claims databases reported rates of vaccination and well-child visits and showed a persistent decline of 14.3% for the MMR vaccination for 12-month-olds up to May 2021 (Kujawski et al., 2022). Using data from two large provinces, and extending the study period beyond the intensive pandemic measures, we show a modest gap in vaccination, particularly in Ontario, suggesting catch-up mechanisms and decreased pandemic restrictions increased the number of children receiving vaccinations.
Well-child visits are considered the cornerstone of primary care for child health, providing essential screening and opportunity for provision of preventive services and other essential clinical services (Fischer et al., 1984). Delays in providing such essential care causes concerns for delays to needed treatments, particularly developmental interventions. We found a substantial decline in well-child visits in infants and children beyond the first year of the pandemic. Our results are similar to the large cross-sectional study in the USA which also showed a well-child visit decline of 14.2% for children 0-2 years old by January 2021 compared to 2018-2019 (Kujawski et al., 2022). Our results are in keeping with findings of a study in Toronto, Ontario, Canada showing well-child visits reduced by 16% in the first year of the pandemic (Stephenson et al., 2021). However, studies on different health systems or populations have shown inconsistent results, with one study in the USA showing relative stability in the well-child visits below the age of 12 months in a Midwest health care system; and similarly in surveys of parents and practitioners, illustrating the importance of age, race, ethnicity, healthcare model and health insurance considerations when considering the disparities caused by the pandemic with respect to health service use (Salas et al., 2022; Teasdale et al., 2022, Piché-Renaud et al., 2021; DeSilva et al., 2022).
Persistent suboptimal well-child visits rates, and a lower vaccination rate in Manitoba, highlight a need for catch-up or a shift in preventive care provision, such as leveraging sick visits for vaccinations and developmental surveillance (DeSilva et al., 2022).
Limitations of the study
Our study has several strengths related to the use of administrative data in two large provinces in Canada with varying pandemic restrictions. However, our study has several limitations. In Ontario, there is no established comprehensive and linkable immunization registry and the use of vaccine-specific immunization billing codes has specificity ranging from 81% to 92% and sensitivity ranging from 70% to 83% (Schwartz et al., 2015). Vaccination coverage rates for at least 4 doses of DTaP by 24 months was estimated to be 75.7% in Ontario and 67.5% in Manitoba by the Canadian National Childhood Immunization Survey (NCIS) in 2017 (Public Health Agency of Canada, 2020). In our study, Manitoba estimates of vaccination rates were consistent with the estimates by the NCIS. The Ontario immunization rates reported in our study are likely underestimates as vaccine data in this province are dependent on completeness and accuracy of physician billing (Schwartz et al., 2015, Saunders et al., 2021). Children receiving vaccines without associated billing in Ontario, such as through nurse practitioners and salaried physicians, or nurses associated with physicians who did not bill for the procedure, would not have been included in the Ontario data. However we do not anticipate there would be differences in billing practices prior to the pandemic compared to during the pandemic causing a bias across the exposure. In Manitoba, although vaccinations by public health nurses were captured, well-baby visits by the same public health nurses were not, potentially causing a larger underestimation of the visit rate measured during the pandemic.
Conclusion
Through the first 18 months of the pandemic, we found that routine childhood vaccines were delivered to infants and children at close to pre-pandemic rates in Ontario and Manitoba. In contrast, we document a significant decrease in well-child visits for infants and children, indicating that developmental surveillance catch-up for infants and children is crucial.
Contributions to knowledge
What does this study add to existing knowledge?
-
In two provinces in Canada, the reduction in vaccine uptake was modest beyond the first year of the pandemic, however well-child visits were significantly reduced within the same time period.
What are the key implications for public health interventions, practice or policy?
-
Differences in vaccination rates changes pre and during the pandemic demonstrate how routine vaccinations were disrupted differently in a mixed rural/urban compared to a predominantly urban province.
-
A decrease in well-child visits underscores the need for catch-up visits for developmental surveillance.
Data availability
Parts of this material are based on data and information compiled and provided by MOH and the Canadian Institute for Health Information, current to September 30, 2021. Geographical data are adapted from Statistics Canada, Postal Code Conversion File +2011 (Version 6D) and 2016 (Version 7B). The analyses, conclusions, opinions and statements expressed herein are solely those of the authors and do not reflect those of the funding or data sources; no endorsement is intended nor should be inferred.
Code availability
The dataset from this study is held securely in coded form at ICES and the Manitoba Centre for Health Policy (MCHP). While data sharing agreements prohibit ICES and MCHP from making the dataset publicly available, access may be granted to those who meet pre-specified criteria for confidential access, available at www.ices.on.ca/DAS and https://www.umanitoba.ca/faculties/health_sciences/medicine/units/chs/departmental_units/mchp/resources/access.html. The full dataset creation plan and underlying analytic code are available from the authors upon request, understanding that the computer programs may rely upon coding templates or macros that are unique to ICES and MCHP.
References
Allan, K., Piché-Renaud, P.-P., Bartoszko, J., Bucci, L. M., Kwong, J., Morris, S., Pernica, J., & Fadel, S. (2021). Maintaining Immunizations for School-Age Children During COVID-19. https://www.dlsph.utoronto.ca/wp-content/uploads/2021/09/Maintaining-Immunizations-for-School-Age-Children-During-COVID-19-Report-1.pdf
Blake-Cameron, E., Breton, C., Sim, P., Tatlow, H., Hale, T., Wood, A., & Tyson, K. (2021). Variation in the Canadian provincial and territorial responses to COVID-19. BSG Working Paper Series (BSG-WP-2021/039).
Canadian Task Force on Preventive Health Care. (2016). Recommendations on screening for developmental delay. Canadian Medical Association Journal, 188(8), 579–587. https://www.cmaj.ca/content/188/8/579
Causey, K., Fullman, N., Sorensen, R. J. D., Galles, N. C., Zheng, P., Aravkin, A., Danovaro-Holliday, M. C., Martinez-Piedra, R., Sodha, S. V., Velandia-González, M. P., Gacic-Dobo, M., Castro, E., He, J., Schipp, M., Deen, A., Hay, S. I., Lim, S. S., & Mosser, J. F. (2021). Estimating global and regional disruptions to routine childhood vaccine coverage during the COVID-19 pandemic in 2020: a modelling study. The Lancet, 398(10299), 522–534. https://doi.org/10.1016/S0140-6736(21)01337-4
Chiem, A., Olaoye, F., Quinn, R., & Saini, V. (2022). Reasons and suggestions for improving low immunization uptake among children living in low socioeconomic status communities in Northern Alberta, Canada - A qualitative study. Vaccine. (1873–2518 (Electronic)).
Daly, M. (2022). Public Health Nurses a vital part of the fight against COVID-19. Retrieved from https://wrha.mb.ca/2021/05/10/public-health-nurses-a-vital-part-of-the-fight-against-covid-19/
DeSilva, M. B., Haapala, J., Vazquez-Benitez, G., Daley, M. F., Nordin, J. D., Klein, N. P., & Kharbanda, E. O. (2022). Association of the COVID-19 pandemic with routine childhood vaccination rates and proportion up to date with vaccinations across 8 US health systems in the vaccine safety datalink. (2168–6211 (Electronic)).
Doctors Manitoba. (2021, April 8). Well Baby Care. https://doctorsmanitoba.ca/managing-your-practice/remuneration/billing-fees/visits/well-baby-care
Dong, A., Meaney, C., Sandhu, G., De Oliveira, N., Singh, S., Morson, N., & Forte, M. (2022). Routine childhood vaccination rates in an academic family health team before and during the first wave of the COVID-19 pandemic: a pre-post analysis of a retrospective chart review. (2291–0026 (Electronic)).
Fischer, P. J., Strobino, D. M., & Pinckney, C. A. (1984). Utilization of child health clinics following introduction of a copayment. American Journal of Public Health, 74(12), 1401–1403.
Glazier, R., & Rayner, J., & Kopp, A. (2015). Examining Community Health Centres According to Geography and Priority Populations Served 2011/12 to 2012/13 (p. 2015). Institute for Clinical Evaluative Sciences.
Hilderman, T., Katz, A., Derksen, S., McGowan, K., Chateau, D., Kurbis, C., & Reimer, J. (2011). Manitoba Immunization Study. http://mchp-appserv.cpe.umanitoba.ca/deliverable.php?referencePaperID=76539
Ji, C., Piché-Renaud, P. P., Apajee, J., Stephenson, E., Forte, M., Friedman, J. N., & Tu, K. (2022). Impact of the COVID-19 pandemic on routine immunization coverage in children under 2 years old in Ontario, Canada: A retrospective cohort study. (1873–2518 (Electronic)).
Kiely, M., Mansour, T., Brousseau, N. A.-O., Rafferty, E., Paudel, Y. A.-O., Sadarangani, M., & MacDonald, S. A.-O. (2021). COVID-19 pandemic impact on childhood vaccination coverage in Quebec, Canada. (2164–554X (Electronic)).
Kujawski, S., Yao, L., Wang, H., Carias, C., & Chen, Y. (2022). Impact of the COVID-19 pandemic on pediatric and adolescent vaccinations and well child visits in the United States: A database analysis. Vaccine, 40(5), 7.
Lee, D. I. D., Vanderhout, S., Aglipay, M., Birken, C. S., Morris, S. K., Piché-Renaud, P. P., Keown-Stoneman, C. D. G., & Maguire, J. L. (2022). Delay in childhood vaccinations during the COVID-19 pandemic. Can J Public Health, 113(1):126–134. https://doi.org/10.17269/s41997-021-00601-9
MacDonald, S. E., Paudel, Y. R., Kiely, M., Rafferty, E., Sadarangani, M., Robinson, J. L., Driedger, S. M., & Svenson, L. W. (2022). Impact of the COVID-19 pandemic on vaccine coverage for early childhood vaccines in Alberta, Canada: a population-based retrospective cohort study. BMJ Open, 12, e055968. https://doi.org/10.1136/bmjopen-2021-055968
National Advisory Committee on Immunization (NACI). (2020, May 13). Interim guidance on continuity of immunization programs during the COVID-19 pandemic. National Advisory Committee on Immunization (NACI). https://www.canada.ca/en/public-health/services/immunization/national-advisory-committee-on-immunization-naci/interim-guidance-immunization-programs-during-covid-19-pandemic.html
Payne, E. (2022, September 20). Dropping childhood immunization rates are putting children at risk: Dr. Vera Etches. Ottawa Citizen. https://ottawacitizen.com/news/local-news/dropping-childhood-immunization-rates-are-putting-children-at-risk-dr-vera-etches
Piché-Renaud, P. P., Ji, C., Farrar, D. S., Friedman, J. N., Science, M., Kitai, I., Morris, S. K. (2021). Impact of the COVID-19 pandemic on the provision of routine childhood immunizations in Ontario, Canada. (1873–2518 (Electronic)).
Public Health Agency of Canada. (2020). Vaccine Coverage in Canadian Children: Results from the 2017 Childhood National Immunization Coverage Survey (cNICS). https://www.canada.ca/en/public-health/services/publications/healthy-living/2017-vaccine-uptake-canadian-children-survey.html
Rigby, J. (2022). Why has polio been found in London, New York and Jerusalem, and how dangerous is it? CTV News.
Rourke, J. T., & Rourke, L. L. (1985). Well baby visits: screening and health promotion. Canadian Family Physician, 31, 997–1002.
Saini, V., MacDonald, S. E., McNeil, D. A., McDonald, S. W., Kellner, J. D., Edwards, S. A., Stagg, V., & Tough, S. (2017). Timeliness and completeness of routine childhood vaccinations in children by two years of age in Alberta, Canada. Can J Public Health, 108(2), e124–e128.
Salas, J., Hinyard, L., Cappellari, A., Sniffen, K., Jacobs, C., Karius, N., Grucza, R. A., & Scherrer, J. F. (2022). Infant, pediatric and adult well visit trends before and during the COVID-19 pandemic: a retrospective cohort study. BMC Health Services Research, 22(1), 328. https://doi.org/10.1186/s12913-022-07719-7
Saunders, N., Guttmann, A., Brownell, M., Cohen, E., Fu, L., Guan, J., & Stukel, T. (2021). Pediatric primary care in Ontario and Manitoba after the onset of the COVID-19 pandemic: a population-based study. CMAJ Open, 9(4), E1149–E1158.
Schwartz, K. L., Tu, K., Wing, L., Campitelli, M. A., Crowcroft, N. S., Deeks, S. L., Wilson, S. E., Wilson, K., Gemmill, I., & Kwong, J. C. (2015). Validation of infant immunization billing codes in administrative data. Hum Vaccin Immunother, 11(7):1840–1847. https://doi.org/10.1080/21645515.2015.1043499
Sell, H., Assi, A., Driedger, S. M., Dube, E., Gagneur, A., Meyer, S. B., & MacDonald, S. (2021). Continuity of routine immunization programs in Canada during the COVID-19 pandemic. Vaccine., 39(39), 5.
Stephenson, E., Butt, D., Gronsbell, J., Ji, C., O’Neill, B., & Crampton, N. (2021). Changes in the top 25 reasons for primary care visits during the COVID-19 pandemic in a high-COVID region of Canada. PLoS One, 16(8), e0255992.
Teasdale, C. A., Borrell, L. N., Shen, Y., Kimball, S., Zimba, R., Kulkarni, S., Rane, M., Rinke, M. L., Fleary, S. A., & Nash, D. (2022). Missed routine pediatric care and vaccinations in US children during the first year of the COVID-19 pandemic. Preventive Medicine, 158, 107025. https://doi.org/10.1016/j.ypmed.2022.107025
The College of Physicians & Surgeons of Manitoba (CPSM). (2020). Personal Protective Equipment during COVID-19. https://cpsm.mb.ca/assets/COVID19/PPE%202020%2004%2006.pdf
Walton, S., Cortina-Borja, M., Dezateux, C., Griffiths, L. J., Tingay, K., Akbari, A., Bedford, H. (2022). Linking cohort data and Welsh routine health records to investigate children at risk of delayed primary vaccination. (1873–2518 (Electronic)).
Williams, R., Clinton, J., & Biscaro, A. (2008). Ontario and the enhanced 18-month well-baby visit: Trying new approaches. Paediatrics & Child Health, 13(10), 850–856. https://doi.org/10.1093/pch/13.10.850
World Health Organization (WHO). (2020). Guiding principles for immunization activities during the COVID-19 pandemic: interim guidance. World Health Organization. https://apps.who.int/iris/bitstream/handle/10665/331590/WHO-2019-nCoV-immunization_services-2020.1-eng.pdf?sequence=1&isAllowed=y
Acknowledgments
The authors acknowledge the Manitoba Centre for Health Policy for use of data contained in the Manitoba Population Research Data Repository under project #2020-044 (HIPC No. 2020/2021-34). The results and conclusions are those of the authors and no official endorsement by the Manitoba Centre for Health Policy, Manitoba Health, or other data providers is intended or should be inferred. Data used in this study are from the Manitoba Population Research Data Repository housed at the Manitoba Centre for Health Policy, University of Manitoba and were derived from data provided by Manitoba Health and Seniors Care.
Funding
This study was supported by ICES, which is funded by an annual grant from the Ontario Ministry of Health (MOH) and the Ministry of Long-Term Care. This study was also supported by the Canadian Institutes of Health Research Grant #VR4—172730 awarded to Drs. Guttmann, Saunders, Cohen, Mahar and Brownell and a Creative Professional Activity Grant from the Department of Pediatrics at the Hospital for Sick Children awarded to Drs. Saunders, Guttmann and Cohen.
Author information
Authors and Affiliations
Contributions
NS was the principal investigator and was responsible for the study concept and design, interpretation, technical or material support and study supervision. AE contributed to study concept and design, and interpretation of data and was responsible for drafting the manuscript. AM contributed to the study concept and design, analysis, interpretation of data, and manuscript draft. BD and TR contributed to the manuscript draft, tables and figures, study concept and design. MB, JS, NE, AG, EY, TS and AK contributed to study design, analysis and interpretation. AB and NE and JS were responsible for the dataset creation and have data access. NS and AB had full access to all the Ontario data in the study and take responsibility for the integrity of the data and the accuracy of the Ontario portion of the data analysis. MB had full access to all the Manitoba data in the study and takes responsibility for the integrity of the data and the accuracy of the Manitoba portion of the data analysis. NS, EC, AM, MB and AG secured funding for the study. All authors were responsible for the acquisition and interpretation of the data and for critical revision of the manuscript for important intellectual content.
Corresponding author
Ethics declarations
Ethical approval
All Ontario datasets were linked and analyzed at ICES, an independent, non-profit research institute whose legal status under Ontario’s health information privacy law allows it to collect and analyze health care and demographic data, without consent, for health system evaluation and improvement. The use of data in this project was authorized under section 45 of Ontario’s Personal Health Information Protection Act, which does not require review by a Research Ethics Board. Ethics approval for this study was granted by the University of Manitoba Health Research Ethics Board (HS24226 (H2020:397)) and was reviewed for data privacy and approved by the Government of Manitoba’s Health Information and Privacy Committee (File No. 2020/2021-34).
Consent to participate
Not applicable.
Consent for publication
Not applicable.
Conflict of interest
See funding section. In addition, Astrid Guttmann holds a Tier 1 Canada Research Chair. All decisions regarding study design, publication, and data analysis were made independent of the funding agencies.
Additional information
Publisher's note
Springer Nature remains neutral with regard to jurisdictional claims in published maps and institutional affiliations.
Supplementary Information
Below is the link to the electronic supplementary material.
Rights and permissions
Open Access This article is licensed under a Creative Commons Attribution 4.0 International License, which permits use, sharing, adaptation, distribution and reproduction in any medium or format, as long as you give appropriate credit to the original author(s) and the source, provide a link to the Creative Commons licence, and indicate if changes were made. The images or other third party material in this article are included in the article's Creative Commons licence, unless indicated otherwise in a credit line to the material. If material is not included in the article's Creative Commons licence and your intended use is not permitted by statutory regulation or exceeds the permitted use, you will need to obtain permission directly from the copyright holder. To view a copy of this licence, visit http://creativecommons.org/licenses/by/4.0/.
About this article

Cite this article
Evans, A., Mahar, A.L., Deb, B. et al. Gaps in childhood immunizations and preventive care visits during the COVID-19 pandemic: a population-based cohort study of children in Ontario and Manitoba, Canada, 2016–2021. Can J Public Health 114, 774–786 (2023). https://doi.org/10.17269/s41997-023-00797-y
Received:
Accepted:
Published:
Issue Date:
DOI: https://doi.org/10.17269/s41997-023-00797-y
Keywords
- COVID-19
- Immunization coverage
- Health systems
- Pediatrics
- Primary care
- Preventive care
- Family medicine
- Cohort study
- Well-child care