
Abstract
The volatility of returns is probably the most widely used risk measure for real estate. This is rather surprising since a number of studies have cast doubts on the view that volatility can capture the manifold risks attached to properties and corresponds to the risk attitude of investors. A central issue in this discussion is the statistical properties of real estate returns—in contrast to neoclassical capital market theory they are mostly non-normal and often unknown, which render many statistical measures useless. Based on a literature review and an analysis of data from Germany we provide evidence that volatility alone is inappropriate for measuring the risk of direct real estate.
We use a unique data sample by IPD, which includes the total returns of 939 properties across different usage types (56% office, 20% retail, 8% others and 16% residential properties) from 1996 to 2009, the German IPD Index, and the German Property Index. The analysis of the distributional characteristics shows that German real estate returns in this period were not normally distributed and that a logistic distribution would have been a better fit. This is in line with most of the current literature on this subject and leads to the question which indicators are more appropriate to measure real estate risks. We suggest that a combination of quantitative and qualitative risk measures more adequately captures real estate risks and conforms better with investor attitudes to risk. Furthermore, we present criteria for the purpose of risk classification.
1 Introduction
Since the development of Modern Portfolio Theory volatility has become the standard measure of risk for any kind of investment. For a long time this concept was widely accepted by both academics and practitioners in securities markets. However, almost from the beginning doubts were raised as to the appropriateness of volatility (or annualised standard deviation) as the measure for risk, especially for real estate.Footnote 1 In particular, Webb and Pagliari (1995) identified various reasons why volatility as a risk measure for real estate should be seen with some scepticism: the poor quality of the direct real estate data, the cyclicality of real estate returns, high transaction costs, and appraisal-based returns which lead to unrealistic volatility values for direct real estate compared with stocks and bonds. In addition, recent studies have provided evidence that real estate returns are not normally distributed which invalidates the standard deviation as an appropriate measure of risk (see, King and Young 1994; Young and Graff 1995; Graff et al. 1997; Brown and Matysiak 2000; Maurer et al. 2004; Young et al. 2006; Morawski and Rehkugler 2006; Young 2008; Richter et al. 2011; among others).
Nonetheless, whilst academics are aware that standard deviation is not appropriate for direct real estate many still use the volatility as their measure of risk anyway (see, Cheng and Roulac 2007; Heydenreich 2010; Cheng et al. 2010; Kaiser and Clayton 2008; Lee 2003; Lee and Stevenson 2006; Hoesli et al. 2004; Pagliari and Scherer 2005; among others). This is not the case for real estate practitioners. For instance, in a survey of 180 major German real estate companies (housing companies, commercial real estate investors, corporates, and others), Schwenzer (2008), found that only 35% of all respondents use the standard deviation as a risk measure, with the vast majority of real estate managers employing qualitative measures instead. In the UK, Booth et al. (2002) and Frodsham (2007) found that most real estate fund and investment managers use qualitative risk measures. In a similar vein, Dhar and Goetzmann (2005) found that US investors were more concerned about the uncertainty of input data in an investment decision model rather than with the properties’ volatility.
Given the importance of the debate as to whether volatility is an appropriate risk measure for direct real estate this paper examines the issue from a theoretical and empirical perspective and contributes to the literature in a number of ways. First, we examine whether volatility is a statistically coherent measure of risk by examining whether it satisfies the axioms of Artzner et al. (1999). Second we use the categorisation of Webb and Pagliari (1995) to see if the assumptions on which volatility is based, to be an acceptable measure of risk, apply in a direct real estate market. Next, we test empirically whether individual and market data in the German direct real estate are normally distributed, and we identify the distribution shape of the data. Lastly, we make some suggestions as to which alternative measures would improve the measurement of real estate risks.
The remainder of our paper is structured as follows. The next section will examine whether volatility can theoretically be seen as an appropriate risk measure. Sect. 3 reviews the conditions needed for standard deviation to be acceptable as a measure of risk in the direct real estate context. The next section presents the results of normality tests on a sample of individual and index data in the German direct real estate market. The last section concludes the study and questions whether qualitative risk measures might be more appropriate to estimate future real estate risk. It suggest some requirements regarding more appropriate risk measures and offers a classification scheme.
2 Related literature and hypotheses
2.1 The appropriateness of volatility from a theoretical viewpoint
To assess the appropriateness of risk measures, several authors have developed a set of axioms that a well-behaved risk measure should satisfy.Footnote 2 One that is widely used in the literature was developed by Artzner et al. (1999). The authors consider a risk measure acceptable, or coherent, if it satisfies four specific axioms: subadditivity, homogeneity, translation invariance, and monotonicity. Later, requirements such as elicitability and robustness were added by Emmer et al. (2015).
Volatility satisfies the basic properties of subadditivity and positive homogeneity. However, it does not satisfy the axiom of monotonicity (Tihiletti 2006), violating an increase in risk exposure for hierarchal density functions across the entire distribution. Bradley and Taqqu (2003) also suggest that volatility fails to satisfy translation invariance because the volatility measure does not decrease when an additional amount is prudently invested.Footnote 3 Therefore, according to Artzner et al. (1999), volatility cannot be considered an appropriate risk measure. Nonetheless, if an investor percieves fluctuations as risky and therefore defines risk as the deviation of returns from an expected return, volatility is indeed appropriate, according to Pedersen and Satchell (1998).
2.2 The appropriateness of volatility from an empirical viewpoint
This section deals with the question whether the assumptions on which the use of volatility is based, do apply in a real estate context. For this, Webb and Pagliari (1995) define four conditions: the existence of a significant data base, the efficiency of the real estate market, investors’ understanding of risk as the variation of returns, and normally distributed returns.
2.2.1 Significant data base
An important preposition regarding the appropriateness of volatility as a risk measure for real estate is that the data is sufficient in terms of quality as well as quantity. However, this is often doubted, especially for the individual property level. In this context it is frequently argued that historical return series are not long or frequent enough to serve as a basis for risk estimations.Footnote 4 Additionally the probability of partial selection bias increases with a small number of observations (Arboleda et al. 2016).
Another problem with the real estate return data that does exist is its accuracy and its smoothing of appraisal-based data. According to Geltner (1993), this smoothing effect is “due to the combined effects of appraisers’ partial adjustments at the disaggregate level plus temporal aggregation in the construction of the index at the aggregate level”, which results in appraisers failing to fully capture the actual movement of the property value, and understate the volatility of price movements.Footnote 5
To solve the problem of the smoothing effect, de-smoothing the appraisal-based data as well as using a transaction-based real estate index are discussed in the literature. De-smoothing techniques typically use smoothing-factors which express the ratio of volatility of de-smoothed return data compared to the volatility of original appraisal-based data.Footnote 6 However, de-smoothing appraisal-based data is highly dependent on the smoothing method as well as factors and their calibration.Footnote 7 Secondly, transaction-based indexes are problematic as well due to a limited and time-varying number of data points. This applies especially to market segments with little transaction volumes and speed.Footnote 8
2.2.2 Market efficiency
The next assumption for using the volatility as a proxy for real estate risk is that real estate markets are efficient and that returns are not predictable. However, there is ample evidence that direct real estate markets are, at best, weak form efficient.Footnote 9 The reason is in the nature of real estate markets which “are typically characterized by high transaction costs, low turnover volumes, carrying costs, specific tax issues, asymmetric information, and unstandardised heterogeneous commodities, compared in particular to assets on financial markets” (Schindler 2010). As a consequence, real estate markets show significant autocorrelation as such property returns are somewhat predictable and the random-walk hypothesis does not hold.Footnote 10 To check for random walk behavior, Payne and Sahu (2004) name the Dickey-Fuller-, the Philipps-Perron-, and the Cochrane-Variance-Tests.
2.2.3 Investor’s definition of risk as the variation of returns
The third assumption as to whether volatility is an appropriate measure of risk depends on the investor’s definition of risk. In other words, the definition of risk as a positive or negative deviation from an expected return is increasingly questioned. In particular, Prospect Theory asserts that for many investors loss aversion is more suitable to characterise their attitude to risk than risk aversion per se. Because of the usual capital intensity for direct real estate investments and various emotional factors, this phenomenon may even be more prevalent for real estate investors.Footnote 11 Therefore, employing volatility as a risk measure that captures upside as well as downside potential will lead to results that are not in line with most investors’ actual understanding of risk. Accordingly, asymmetric downside risk measurements appear to be more feasible for common risk understanding.
2.2.4 Normality of real estate returns
Finally, from a theoretical perspective volatility can only be an appropriate measure of risk if the direct real estate returns data is normally distributed. In the mid-1980s authors such as Miles and McCue (1984) and Hartzell et al. (1986) first suggested that real estate returns are not normally distributed. Hartzell et al. (1986), for example, stated that “the measures of skewness and kurtosis for the quarterly returns indicate that the distribution of the returns is not normal”. However, these studies did not delve deeper into this issue, and it was not until the early 1990s that the normal distribution of direct real estate returns was fundamentally questioned by authors such as Myer and Webb (1992) and Liu et al. (1992). In the following years various studies were published that focused on the distribution of real estate returns.Footnote 12 Following Young et al. (2006), these studies can be classified as either time-series analyses or cross-sectional analyses.
Using data on 2000 properties in the Russell-NCREIF Property Index between 1978 and 1992, King and Young (1994) concluded that real estate returns are not normally distributed. For the same data set Young and Graff (1995) used a distributional quantile-based estimation technique and found that annual property returns are not normally distributed for the period 1980–1992 on the annual cross-section of real estate returns. Thus, the authors stated, that standard risk measures are inapplicable for direct real estate investments. Using the same methodology studies in other countries support this conclusion (Young (2008) in the US, Graff et al. (1997) in Australia, Young et al. (2006) in the UK, and Richter et al. (2011) in Germany).
Brown and Matysiak (2000) were the first to analyse return distributions of individual properties. Based on monthly IPD (Investment Property Databank) data, the authors demonstrated that monthly returns are also skewed and leptokurtic, and thus non-normal. However, the authors found that the return distributions of individual properties are much closer to being normal when using quarterly or annual return data or when aggregated on a portfolio or index level. They concluded that “combining properties into portfolios also increases the probability that the distribution of returns will approach normality”.
Regarding German real estate returns three studies have examined their distribution: Maurer et al. (2004), and Richter et al. (2011) and Stein et al. (2015). Maurer et al. (2004) argued that the IPD index history is relatively short and so only allows for analyses of annual returns. Consequently, the authors used publicly available information from German open-ended real estate funds to construct a synthetic real estate index. Then using the quarterly and annual returns data for the period from 01/1987 to 12/2002 the authors tested for distribution using the Jarque-Bera (J-B), the Anderson-Darling (A-D) and the Shapiro-Wilk (S-W) normality tests. The authors found that there was no evidence of non-normality in annual returns but that the quarterly return series differed significantly from normality. When further accounting for smoothing of real estate returns as well as for inflation, they found that normality of quarterly and yearly returns could not be rejected in both cases.
Richter et al. (2011) used data from the IPD on 8938 individual German properties from 2000 to 2009 and tested the normality of total returns, capital returns, and income returns for three property-types—retail, office, and residential. The authors found that the assumption of normal distribution can be rejected for virtually all sub-samples of all property-types and for all years. Nonetheless, Richter et al. (2011) noted that the kurtosis values of the income returns were less pronounced than those for the capital returns, due to the stable nature of rental income compared with capital values.
Stein et al. (2015) used global IPD data for their study. They fitted stable distributions of the same target variables as Richter et al. (2011) for various usage types. As a result for the total return the authors show general time variability of distributions across their global data sample. Germany appears to have rather small α‑values as well as a high variation in tailedness of the annual stable distributions. Thus, German returns are more tailed in comparison to the US and UK.
Turning towards our own empirical approach, the present study will formulate the relevant hypotheses in the following section. The article then analyses individual German data similar to Richter et al. (2011), however, there are important differences from their study and ours. First, we use data on individual and index data over a longer period with data from 1996 to 2009. Second, we use various normality tests to see if the results are robust to the different methods employed. Lastly, Richter et al. (2011) argue that “investors can benefit from the knowledge about distribution shapes” since “[i]nvestors pursuing buy-and-hold strategies might need to incorporate different asset-specific risk parameters compared to opportunistic investors”, yet provide no evidence as to the distributional shape of German real estate returns. Instead, we use the same approach as Lizieri and Ward (2001) to identify the distributional shape of German real estate data.
2.3 Hypotheses
Based on the literature review, the following hypotheses are used as a framework for the subsequent empirical study:
Hypothesis 1
Direct real estate returns are not normally distributed.
Hypothesis 2
Alternative risk measures are necessary for a holistic risk management of direct real estate investments.
Hypothesis one reflects the above-mentioned theoretical drivers as well as empirical results of other studies. Hypothesis two can be interpreted as a logic conclusion if real estate returns are not normally distributed. This would mean that volatility and similar measures are at least not fully appropriate to measure real estate risk and that alternative risk measures should be applied.
3 Data description and statistical moments
The dataset was made available by IPD in 2010 and contains data of properties of institutional investors from 1996 to 2009.Footnote 13 We used the total returnsFootnote 14 of all 939 properties that were located in Germany and covered at least 10 years over the period from 1996 to 2009. There are 523 office properties, 189 retail properties, 152 residential properties and 75 classified as “others” in the sample. Due to data confidentiality we did not receive any information on smaller sectors such as industrial properties. Therefore the breakdown of properties in our sample does not equal the breakdown of properties in the whole IPD databank.
Subsequently, the time-series and cross-sectional distributional characteristics of two German real estate market indices were analysed in order to provide some information regarding the distribution of market returns. For that purpose, BulwienGesa AG provided the German Property Index (GPI) data for 1995–2010 and IPD the German IPD index (also known as Deutscher Immobilienindex, (DIX)) for 1996–2010. The IPD index is a performance index which is constructed from data delivered by institutional investors. The GPI is also a performance index, but based on collected market data instead of individual properties. This makes it less representative for direct property investments but more representative for the whole market than the IPD index. The above-outlined data quality is the decisive point to justify the end of the data set since the analysed data is of higher quality and market coverage than data sets from other providers. Alternative approaches to use other data or to mix data sources in order to extend the data set were intentionally refused in order to estimate moments and risk metrics for high quality data with high explanatory power.
3.1 Descriptive statistics of individual properties returns
To analyse the distributional characteristics of the properties’ time-series returns, we estimated the annual average return, standard deviation (SD), skewness, and kurtosis statistics of the 939 properties. Then we performed the above-mentioned normality tests. Tables 1 and 2 provide a summary of the results.
As can be seen from Table 1, the values of the average skewness and kurtosis measures are relatively close to zero and three respectively. Furthermore, the average statistics for most normality testsFootnote 15 and most property types indicate measures below the respective critical values.Footnote 16 Hence, for the majority of return distributions, normality cannot be rejected. This result is supported by the following table that indicates the number of properties for which normality cannot be rejected at the 5% significance level.
Table 2 shows that although the number of properties with normally distributed returns varies depending on the chosen test, the table indicates that for all normality tests and sectors, normality cannot be rejected in more than 50% of the cases. Methodically, these tests however entail some statistical issues, since they differ with respect to their tail sensitivity.Footnote 17
Even though these results are in line with results of other studies that investigated annualized or annual return distributions at the property level, the significance of these results is questionable, due to the relatively short time period which does not necessarily cover a full market cycle.
3.2 Cross-sectional analysis of returns
In order to arrive at more meaningful results, we conducted a cross-sectional analysis to determine the distribution of the total returns for each year. A major advantage of the cross-sectional analysis over the time-series analysis is the increase in data points, with up to 939 return observations in some years. In order to employ a cross-sectional analysis, we followed Young et al. (2006) and assumed “that expected variations in annual property returns due to differences in property type account for all of the differences in returns on individual properties”. The results are presented in Table 3.
With few exceptions Table 3 shows that normality can be rejected for each of the fourteen years. All normality tests indicate that German total returns are not normally distributed when all properties are considered. Furthermore, for each year the statistical measures indicate that the distributions are negatively skewed, are more peaked near the mean, and have weaker shoulders as well as fatter tails than a corresponding normal distribution.Footnote 18 This is also supported by Fig. 1 and Fig. 2 showing the distribution of the entire return time-series as well as its QQ plot. In sum, the cross-sectional analysis shows typical fat tails across the entire sample duration, illustrated by the heavy kurtosis of the returns as reported above as well as by the heavy deviations from the normal quantiles. Thus, fat tails appear to be a persistent feature of German direct real estate returns.

Density function of total returns of all properties in the sample, 1996–2009

QQ plot of total returns of all properties in the sample, 1996–2009
3.3 German real estate market return distributions
Following the same approach we also analysed the distributional characteristics of the two major German real estate market indices: the German IPD index and the GPI by BulwienGesa using continuously compounded annual total returns.Footnote 19 Table 4 shows that, when employing the different normality tests, normality could not be rejected for the IPD all property index as well as for the GPI index. Also, when the IPD sub-indices were analysed, normality could not be rejected for all property types except for the industrial segment.
In summary, the results of the analysis indicate that although normality cannot be rejected for annual German market returns, strong evidence was found that normality is likely to be rejected at the individual property level. These results are in line with those reported by Maurer et al. (2004), Morawski and Rehkugler (2006), and Richter et al. (2011) and Stein et al. (2015).
From an analytical point of view, the question for potential reasons of differing distributional shapes across the property types arise. Table 4 reports the highest mean returns and the highest standard deviation for industrial properties, which is in line with the expectations for this asset class characterized by opaqueness and heterogeneous properties. Interestingly, industrial properties also have the highest values regarding skewness, kurtosis, and normality tests. Another interesting finding are the distributional characteristics of German retail properties since they represent the only asset class with positive skewness. In combination with the lowest kurtosis, retail properties are characterized by the least volatile and tailed distribution. A reason for that may be the relatively stable demand for retail space until e‑commerce started to change this market fundamentally.
Next to these drivers of heterogeneity across usage types, the potential dynamics after the analyzed timeframe, i.e., during and after the global financial crisis should be discussed. Stein et al. (2015) show decreasing α‑values in times of overheating markets and increasing values after the burst of the bubble, for example for residential real estate in the USA from 2002 to 2010 and for office properties in the UK from 2005 to 2010. This fits with the results from Orlowski (2012), who provides evidence for tailedness in several financial markets prior to and throughout the crisis. From the combination of both studies we hypothesize for Germany an even further derivation from normality compared with the period from 1996 to 2010 because most German real estate markets were fairly stable during the world financial crisis and have experienced an extraordinary boom since then.
4 The distributional shape of German real estate returns
If real estate returns are not normal, what are they? Very little work has been undertaken in order to fit more appropriate theoretical distributions to observed frequency distributions. A notable exception is work of Lizieri and Ward (2001) who found out that a logistic distribution fitted best the UK real estate returns. As mentioned above, Stein et al. (2015) turn towards stable distributions. A notable number of articles in the financial literature also use extreme value theory and its distributions (McNeil and Frey 2000). These articles however, mainly target securitized markets. A transfer to direct real estate markets may be subject to large data availability constraints, as pointed out by Stein et al. (2015).
The individual data showed that the logistic distribution appears to be the most likely theoretical distribution for direct German properties, whereas the normal distribution is ranked as the most likely distribution in less than 10% of the cases, see Table 5.Footnote 20 The result was also widely confirmed for the cross-sectional return data. For the year 2000 the data most likely followed a log-logistic distribution and for 2005 a Weibull distribution. This finding in combination with the above-mentioned literature should be a motivation to conduct further research on extreme value distributions of real estate market data.
Finally we examined the theoretical distribution of the real estate market return data. The results are presented in Table 6.
In line with the results by Lizieri and Ward (2001), the Chi-Square statistic as well as the Anderson-Darling test suggest that the logistic distribution is most likely to be the best fit for the all property index and most appropriately fits the sub-indices for residential, industrial, and other properties. According to Lizieri and Ward (2001) this might be due to the high proportion of returns that are close to zero which “is a result of the thinly traded market and slow arrival of information, resulting in static individual valuations”. Slightly different results can be obtained using the K‑S test which ranks the triangular distribution as the best fit for the all property index. In contrast, the Weibull distribution best fits the GPI Index according to the A‑D and the K‑S test while the Chi-Square test suggests that a triangular distribution is the best fit for this index.
In summary, the findings are somewhat inconclusive as to the “true” distributional shape of the German real estate index data. Nonetheless, it appears that German real estate returns are closer to a logistic distribution than to a normal distribution.
With regard to the first hypothesis it can be summarized that the present study supports previous studies showing the non-normality of direct real estate returns. Thus, hypothesis one can be confirmed. Accordingly, volatility alone is unsuitable due to the named statistical problems to express the risk exposure of a direct real estate investment. Automatically the question arises what drivers may cause non-normality in real estate returns. According to Lizieri and Ward (2001, p. 70) “the heterogeneity, indivisibility, and large lot size of the assets, the thinly traded market, the importance of valuations […] and the high transaction costs […] all have an impact on the return structure”. More specifically, these well known and perhaps several unknown characteristics of real estate investments seem to cause a distribution with most returns within a fairly narrow range (high kurtosis) as well as some extremely low and extremely high returns (fat tails). Since alternative measurement tools are necessary for this type of distribution, the following section will present alternative risk measures that capture the specific features of direct real estate and do not necsessarily correspond to the conditions of Webb and Pagliari (1995), Artzner et al. (1999), and others.
5 Alternative risk measures
Volatility may be the best known and most widely researched risk measure, but is by no means the only one. In fact, the authors compiled 96 different risk measures from the literature and from practitioners as a first step to a comprehensive catalogue, which may later become an industry standard issued by the German Society of Property Researchers (Gesellschaft für immobilienwirtschaftliche Forschung, gif). At this stage we do not attempt to provide a systematic overview or clear-cut definitions. Instead, we report the results of a survey among members of gif e. V., carried out in September 2017. Then we introduce criteria to classify risk measures and discuss the benefits and shortcomings of exemplary alternative risk measures.
The link to the online survey was sent via e‑mail to the 157 members and former members of the gif competence group “Real Estate Risk Management”—all of them real estate professionals or academics and in some way involved or interested in risk management. The questionnaire proposed a number of risk measures and asked for their usage and knowledge. It also asked the questions how to measure the risk of specific situations in the life cycle of a property and what other real estate risk ratios the participants knew. 42 persons participated in the survey. Of course the sample is not representative at all, but at least the results give a first impression of the knowledge and use of real estate risk measures. The ratios that are used most frequently are WALT (weighed average lease term), vacancy ratio, and worst case scenario. Stochastic risk measures are rarely used, although many participants know them.
From an academic viewpoint the results are somewhat surprising. The WALT, for instance, is a pragmatic and intuitive ratio that has not been in the center of risk research (and that’s putting it nicely!). Furthermore, the vacancy ratio is not a risk measure (it measures a state), nor is the worst case scenario (it is a method). Not surprising was that all participants used more than just one risk measure. We conclude that real estate professionals have accepted that there is no “super risk ratio”, which is able to cover all risks of a direct real estate investment. Instead, risk measurement is based on the combination of several risk indicators that need to be analysed, validated, and monitored over time.
Several authors have suggested classifications for risk measures, but so far there is no generally accepted order, at least not for real estate. Maybe there will never be a uniform standard because the use and classification of risk measures depend so much on the purpose of measurement. For instance, if the intention is to analyse the real estate market risk, other measures are employed than in a property purchase process. In the first case it is useful to classify according to the distributional characteristics of the time series, but in the latter case typically no time series are available and, thus, no distributions for measuring legal, tenant, and other property-specific risks. Therefore, in the remainder of the article we propose 13 criteria to classify risk measures. Each is illustrated with exemplary ratios (Fig. 3a–m).
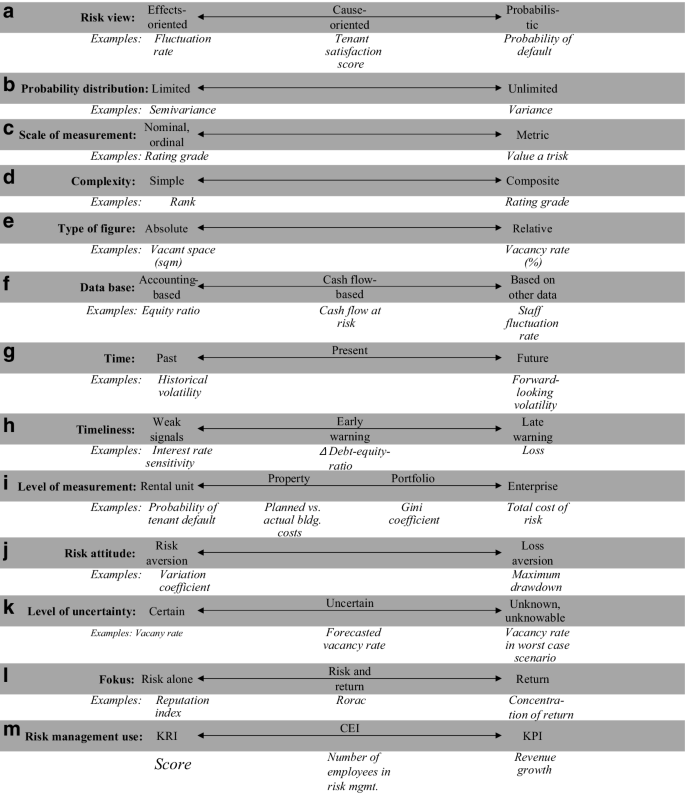
Criteria to classify real estate risk measures
Over the centuries risk management has evolved from an effects-oriented to a more cause-oriented and probabilistic task (Fig. 3a). There is evidence for popular risk measures that fit to either of the three risk views. The fluctuation rate, for example, is used by housing companies to monitor the operating cost risk, which is a natural effect of a more frequent change of tenants. To learn something about the risk causes, other measures need to be used, e.g., a tenant satisfaction score. A problem of this qualitative measure is that it is difficult to incorporate in a cash flow calculation because a deteriorating satisfaction score, for instance, does not necessarily translate into a higher vacancy rate. This is easier with a probabilistic measure such as the probability of default, which can be used to calculate the expected loss of a rental contract. The biggest problem with probabilistic measures is that the probability distribution of many input variables is unknown to the investor—because of missing data, high costs for obtaining the data, or many other reasons. Sometimes the risks and their distributions are even unknowable, which is why risk measures that are not based on probabilites are still indispensable for real estate (Fig. 3b).
There are two broad groups of probabilistic measures, the first group uses the whole distribution curve, the second just parts of it, i.e., the downside or the tails. Typical representatives of the first category are volatility, curtosis, and skewness. They have their merits, but many real estate professionals and academics regard downside risk measures such as the semivariance as more appropriate, mainly because they better fit with investor’s view of risk as a negative outcome.Footnote 21 However, the downside risk measures are not without their problems: almost all fail one or more of the axioms that risk measures should satisfy to be a coherent measure of risk, are typically difficult to interpret, and are difficult to implement in practice. For instance, value at risk (VaR) relies on normally distributed returns and does not satisfy the axiom of subadditivity defined by Artzner et al. (1999). Although the modified value at risk (MVaR), suggested by Signer and Favre (2002), overcomes the problem of non-normal returns by penalizing assets with negative skewness and excess kurtosis, it is incoherent as well. In addition, as Lee (2007) points out, the MVaR is difficult to use on prospective future returns because various scenarios have to be simulated for a non-normal return-generating process. In contrast, the conditional value at risk (CVaR), which is defined for a confidence level α as the negative expected value in the worst α ⋅ 100% cases, is a coherent risk measure. It is an appropriate risk measure for logistic distributions, but according to Booth et al. (2002) it is difficult to interpret. Recently, Toma and Dedu (2014) introduced a new “at risk measure” for logistic return distributions. In their paper the authors present the limited value at risk (LVaR), which essentially defines a threshold below which observations are not incorporated into the calculation of the risk metric. That way, for instance, heavy outliers of extremely unusual properties could be eliminated to paint a more realistic picture of a market.
Very often risk measures are divided into qualitative and qualitative, based on their scale (Fig. 3c). This division is clear and useful for many risk measures, e.g., the rating grade on an ordinal scale from AAA to D and the value at risk in Euro on an unlimited metric scale. For other risk measures it is not that easy. For instance, a scoring system is usually regarded as a qualitative risk instrument because it is ideal for capturing location quality, building conditions, and other features that are difficult to quantify. However, a scoring system can be constructed in a quantitative way, and the score can be transformed into a quantitative measure (such as the probability of default), which enhances its validity and versatility.
Although the academic literature on this topic is limited,Footnote 22 great progress was made in the early 2000s after many banks had put huge effort into their rating systems in order to comply with the rules of Basel II. For instance, Hutchison et al. (2005) put forward an alternative approach for the reporting of real estate risk.
On a different scale, rating grades can be regarded as highly complex because they often combine a multitude of quantitative and qualitative elements (Fig. 3d). Lausberg and Wiegner (2009) report on a rating system that is used by a group of European banks for their commercial real estate loans. It combines, among others, downside risk measures derived from a property cash flow projection with scores of the location quality based on the analyst’s opinion.
A different approach, the so-called Risk Web, was suggested by Blundell et al. (2011) who updated the earlier work of Blundell et al. (2005). The authors argue that portfolio risk should be depicted in terms of scores for various factors believed to influence overall risk, e.g., asset concentration, vacancy rate, lease length, etc. Other examples for composite risk measures are the Global Real Estate Risk Index by Chen and Hobbs (2003) and the Extended Risk Rating by Bürkler and Hunziker (2008).
To improve real estate risk measurement it seems promising to continue developing composite measures instead of looking for the “one-size-fits-all” ratio. However, simple risk measures should not be forgotten. Simple, often heuristic risk measures such as the rank of a particular property in terms of riskiness serve important purposes, e.g., quick information for busy board members.
A classic way to organize controlling measures is to divide them into absolute and relative figures (Fig. 3e). In real estate, the vacant space in square metres and the vacancy ratio in percent are typical examples. As mentioned above, these measures are often used by practitioners although they are not risk measures in a narrow sense because the risk of a vacant unit to fall vacant is zero. Vacancy risk measures would be, for example, the probability of vacancy, the forecasted change of the vacancy rate, or the vacancy at risk. According to our survey, however, those are almost unknown. Absolute measures can be further divided into individual figures, sums, differences, and means, relative measures into structure, relation, and index figures (Küting and Weber 2006). For all of them examples from real estate can be found.
General controlling figures are also classified by the underlying database (Fig. 3f). This could be useful for real estate, too, because it forces to think about the reliability of the measures. A typical risk measure is the equity ratio of a company or a project. As accounting-based figures have some disadvantages, measures such as the free cash flow or the cash flow at risk are employed. Both types cannot cover all risks of a real estate company or investment. Operational risks such as the loss of key personnel cannot be derived from profit-and-loss statements or cash flow projections. Therefore it is important to incorporate risk measures based on survey data such as the tenant satisfaction score or on other data such as the staff fluctuation rate.
The WALT is an example for a good accounting-based measure. It is based on the following data: total annual rent of a property or portfolio, contractual annual rent of each leasing contract, expiration of each lease contract including break options, and the reference dates. By using target rents for vacant space for determining the total annual rent, the weighted average maturi-ty can be calculated for the entire property or portfolio. For lease contracts with indefinite or undetermined duration the contractual notice period is applied.
Time and timeliness are two more useful criteria (Fig. 3g, h). Many risk measures rely on data from the past, for example the historical volatility described in the main part of this article. But there are alternatives, such as the forward-looking volatility or the difference (or span) between the worst case and the best case scenario.
Timeliness is connected, but has a different goal. For instance, interest rate sensitivity as the result of a sensitivity analysis is a weak signal for interest rate risk. It may or may not lead to problems that later result in a loss, which is a late warning before insolvency. In the middle are early warning signals such as the change of the debt-to-equity ratio over time.
A classification which is unique for real estate follows the level of measurement, from the rental unit to the enterprise (Fig. 3i). Some risk measures such as the deviation of actual from planned costs can be used on any level and aggregated to higher levels; others such as the concentration risk measures Gini Coefficient and Herfindahl Index are used on particular levels.
The next three criteria deal with the nature of risk (Fig. 3j–l). As we know from Kahnemann and Tversky’s Prospect Theory, humans are not only risk averse, but also loss averse. Typical risk measures for risk aversion are all variation measures such as the variation coefficient or the volatility. For the other type of risk attitude loss measures such as the maximum drawdown or tail measures such as the CVaR must be used.
The level of uncertainty for the given situation is another criterion which seems theoretical at first glance, but has major practical implications. As mentioned above, the vacancy rate is a ratio which is often used by practitioners yet useless as a risk measure. It should be replaced by the forecasted vacancy rate or similar measures that reflect the uncertainty of many decision situations. However, in many cases, the future is not even uncertain, it is unknown or unknowable. Scenario analyses and risk measures as a result of particular scenarios are a useful method to deal with such an environment.
Risk and return are naturally tied together, which is why many risk measures are based on returns, for instance volatility. But there are other risk measures that focus either on risk alone, such as a reputation index as a measure of reputation risk, or on the relation of risk and return, such as the Sharpe Ratio, the variation coefficient, and the return on risk-adjusted capital (RORAC).
Our last suggestion concerns the use of the risk measure within risk management (Fig. 3m). Most of the risk measures discussed so far can be used as key risk indicators (KRI). But a company also needs information about the effectiveness of its risk management system. This class is called CEI (Control Effectiveness Indicators). In the end, a company is interested in the effect of risk on its key performance indicators (KPI), which is why deviations of these measures can also help to detect risks.
To summarize, it can be stated that alternative risk measures are available and necessary to capture the risk exposure of direct real estate investments. The presented multidimensional classification pattern should replace the traditional two dimensional thinking in terms of volatility and return for most purposes, e.g., to calculate the optimal portfolio composition. As Byrne and Lee (2004) show, the composition varies greatly with the risk measures employed, and the choice of the “optimal” risk measure depends on the risk attitude of the investor. Adding alternative and combined risk measures does not change this principle, but it makes the choice more complex.
6 Conclusions and practical implications
This paper has examined whether volatility is an appropriate measure of risk for direct real estate investments from a theoretical and an empirical perspective. On theoretical grounds we argue that firstly, volatility cannot be considered a coherent measure of risk and does not comply with the common understanding of risk of most investors. Of course it is not completely without use, but it may yield erroneous results when used for risk control, constructing portfolios in a classic mean-variance-optimization framework, or other purposes. Secondly, several fundamental assumptions for the use of volatility as a risk measure do not apply in the direct real estate context. In particular our study and other studies of German individual and market data find that the assumption of normality does not hold for direct real estate returns. The present study revealed empirically that a logistic distribution can better describe real estate returns. Regarding the statistical characteristics of the distribution this is particularly interesting since the distribution is symmetric and yields identical mean and median. Accordingly, the downturn probability is as large as the likelihood of a positive deviation.
The practical implication—especially for investors—is the necessity to model the expected returns in line with empirical findings, reporting requirements, benchmarking measures, and risk attitudes. Additionally, acquisition and allocation decisions based on mean-variance analysis should be reconsidered, since results were biased. Finally, due to the fat tails of the distribution of total returns, tail risk hedging on the property level should be of particular interest in order to avoid extremely negative returns.
In our view alternative approaches will need to be expanded in the future with the tightening in regulation, the increase in the professionalization of the industry, and improvements in data quality. Furthermore, we expect that volatility will not be followed by another “one-size-fits-all” super measure, but instead by several systems which integrate various risk measures in various ways depending on such factors as investor’s understanding for and attitude towards risk, the purpose of measuring risk, and the availability of property data. It is important to consider those ratios over time and in connection with the current market situation and other aspects. After all, a comprehensive analysis of several indicators is the key for transferring ratios into informative findings.
Future research may target further risk measures for direct real estate investments. Empirical studies on risk exposure reduction based on different metrics in direct investments are imaginable, but subject to a large data set, covering a long time frame. Additionally, classification of risk measures could be an interesting field for future research as every classification should be examined, for instance regarding the coherence of the resulting risk measures. Finally, we can conclude that real estate returns are non-normally distributed by nature—independent of time, country, or type of real estate; but to understand the nature of real estate returns and, thus, the reasons for the non-normality of real estate returns will require much further research.
Notes
Neither does volatility fulfil the criteria summarized by Emmer et al. (2015).
Originally, it was planned to compare it with a later sample to examine the effects of the financial crisis. Unfortunately, MSCI—who acquired IPD in 2012—refused to provide an update. Other institutions that collect time series of German real estate portfolios are either inaccessible (e.g., rating agencies), not representative (e.g., asset managers) or for other reasons unsuitable for this kind of research. Therefore, only the relatively old data can be presented here. In our opinion this justified by the uniqueness of the sample and the comparison with other studies.
We also examined capital growth and income returns with similar results but due to space limitations we do not report the results.
Normality tests: J‑B = Jarque-Bera, K‑S = Kolmogorov-Smirnov, L = Lilliefors, S‑W = Shapiro-Wilk, A‑D = Anderson-Darling, C‑vM = Cramer-von-Mises, W = Watson test.
For an overview of critical values see, for example, D’Agostino and Stephens (1986).
See, for example, Arboleda et al. (2016) for a discussion of tail sensitivity of normality tests, such as the K‑S-test.
Similar distributional characteristics are apparent for the various property types but due to space limitations we do not report the results.
We did not correct the annual data for possible smoothing following Coleman and Mansour (2005, p. 38) who concluded that “the application of a statistical model to ‘unsmooth’ returns—has the effect of increasing the size of the second moment (variance). In effect, this will ‘widen’ the distribution of returns, increasing the volatility. But it will not, in general, transform a non-normal return distribution into a normal one”.
The goodness of fit test of the various property sectors produces similar results but due to space limitations we do not report the results.
References
Adair A, Hutchison NE (2005) The reporting of risk in real estate appraisal property risk scoring. J Prop Invest Finance 23(5):254–268
Arboleda P, Bagheri S, Khakzad F (2016) Model risk—in the context of the regulatory climate change. Risk.net 11/2016. https://tinyurl.com/yxjbr6gq. Accessed 23 May 2019
Artzner P, Delbaen F, Eber J‑M, Heath D (1999) Coherent measures of risk. Math Finance 9(3):203–228
Bell DE (1995) Risk, return, and utility. Manage Sci 41(1):23–30
Blundell GF, Fairchild S, Goodchild RN (2005) Managing portfolio risk in real estate. J Prop Res 22(2/3):115–136
Blundell GF, Frodsham M, Martinez Diaz R (2011) RISK WEB 2.0—an investigation into the causes of portfolio risk. Report for the IPF. Investment Property Forum (IPF), London
Bokhari S, Geltner D (2010) Loss aversion and anchoring in commercial real estate pricing: empirical evidence and price index implications. Real Estate Econ 39(4):635–670
Booth P, Matysiak G, Ormerod P (2002) Risk measurement and management for real estate portfolios. Report for the IPF. Investment Property Forum (IPF), London
Bradley B, Taqqu M (2003) Financial risk and heavy tails. In: Rachev ST (ed) Handbook of heavy tailed distributions in finance. Elsevier, Amsterdam
Brown GR, Matysiak GA (2000) Real estate investment—a capital market approach. Financial Times Prentice Hall, Harlow
Bürkler N, Hunziker S (2008) Risikomessung verschiedener Asset- und Subassetklassen – ein weitergehender Ansatz. IFZ working paper series/performance measurement, vol 2. IFZ/Hochschule Luzern, Luzern
Byrne P, Lee SL (1997) Real estate portfolio analysis under conditions of non-normality—the case of NCREIF. J Real Estate Portfolio Manag 3(1):37–46
Byrne P, Lee SL (2004) Different risk measures: different portfolio compositions? J Prop Invest Finance 22(6):501–511
Chen J, Hobbs P (2003) Global real estate risk index—to capture different levels of market risk. J Portfolio Manag 30:66–75 (Special Issue Real Estate)
Chen Z, Khumpaisal S (2009) An analytic network process for risks assessment in commercial real estate development. J Prop Invest Finance 27(3):238–258
Cheng P, Roulac SE (2007) Measuring the effectiveness of geographical diversification. J Real Estate Portfolio Manag 13(1):29–44
Cheng P, Lin Z, Liu Y, Zhang Y (2010) Real estate allocation puzzle in the mixed-asset portfolio: fact or fiction? Working paper. https://papers.ssrn.com/sol3/papers.cfm?abstract_id=1583952. Accessed 23 May 2019
Coleman MS, Mansour A (2005) Real estate in the real world—dealing with non-normality and risk in an asset allocation model. J Real Estate Portfolio Manag 11(1):37–54
Cook ED Jr (1971) Real estate investment and portfolio theory: discussion. J Financial Quant Anal 6(2):887–889
Corgel JB, deRoos JA (1999) Recovery of real estate returns for portfolio allocation. J Real Estate Finance Econ 18(3):279–296
D’Agostino RB, Stephens M (1986) Goodness-of-fit-techniques. Marcel Dekker, New York
Dhar R, Goetzmann WN (2005) Institutional perspectives on real estate investing: the role of risk and uncertainty, New Haven (US): Yale ICF working paper no. 05-20. https://papers.ssrn.com/sol3/papers.cfm?abstract_id=739644. Accessed 23 May 2019
Ducoulombier F (2007) EDHEC European real estate investment and risk management survey. EDHEC Risk and Asset Management Research Centre, Nice
Emmer S, Kratz M, Tasche D (2015) What is the best risk measure in practice? A comparison of standard measures. J Risk 18(2):31–60
Feldman BE (2003) Investment policy for securitized and direct real estate. J Portfolio Manag 30:112–121 (Special Issue Real Estate)
Findlay MC, Hamilton CW, Messner SD, Yormark JS (1979) Optimal real estate portfolios. J Am Real Estate Urban Econ Assoc 7(3):298–317
Fisher J, Geltner D, Pollakowski H (2007) A quarterly transactions-based index of institutional real estate investment performance and movements in supply and demand. J Real Estate Finance Econ 34(1):5–34
Fourt R, Matysiak G, Gardner A (2006) Capturing UK real estate volatility. Real estate & planning working papers, vol 08/06. Henley Business School, Reading University, Reading, p 806
Frodsham M (2007) Risk management in UK property portfolios: a survey of current practice. Report for the IPF. Investment Property Forum (IPF), London
Gardner A, Matysiak G (2006) Systematic property risk: quantifying UK property betas 1983–2005. Real estate & planning working papers, vol 13/06. Henley Business School, Reading University, Reading
Geltner D (1993) Estimating market values from appraised values without assuming an efficient market. J Real Estate Res 8(3):325–346
Geltner D, MacGregor BD, Schwann GM (2003) Appraisal smoothing and price discovery in real estate markets. Urban Stud 40(5/6):1047–1064
Goodman J, Scott B (1997) Rating the quality of multifamily housing. Real Estate Finance 14(2):38–47
Gordon K (2003) Risk assessment in development lending. Brief Real Estate Finance 3(1):7–26
Graff RA, Harrington A, Young MS (1997) The shape of Australian real estate return distributions and comparisons to the United States. J Real Estate Res 14(3):291–308
Hamelink F, Hoesli M (2004) Maximum drawdown and the allocation to real estate. J Prop Res 21(1):5–29
Har NP, Eng OS, Somerville T (2005) Loss aversion: the reference point matters. Working paper series. Centre for Urban Economics and Real Estate, Sauder School of Business, Vancouver https://doi.org/10.14288/1.0052288
Hartzell D, Hekman J, Miles M (1986) Diversification categories in investment real estate. J Am Real Estate Urban Econ Assoc 14(2):230–254
Herath S, Maier G (2015) Informational efficiency of the real estate market: a meta-analysis. J Econ Res 20(2):117–168
Heydenreich F (2010) Economic diversification: evidence for the United Kingdom. J Real Estate Portfolio Manag 16(1):71–85
Hoesli M, Lekander J, Witkiewicz W (2004) International evidence on real estate as a portfolio diversifier. J Real Estate Res 26(2):161–206
Hoesli M, MacGregor B, Adair A, McGreal S (2002) The role of property in mixed asset portfolios. RICS foundation research review series. RICS Foundation, London (UK)
Hutchison NE, Adair A, Leheny I (2005) Communicating investment risk to clients: property risk scoring. J Prop Res 22(2/3):137–161
Kaiser RW, Clayton J (2008) Assessing and managing risk in institutional real estate investing. J Real Estate Portfolio Manag 14(4):287–306
Kijima M, Ohnishi M (1993) Mean-risk analysis of risk aversion and wealth effects on optimal portfolios with multiple investment opportunities. Ann Oper Res 45(1):147–163
King DA Jr, Young MS (1994) Why diversification doesn’t work—flaws in modern portfolio theory turn real estate portfolio managers back to old-fashioned underwriting. Real Estate Rev 24(2):6–12
Küting K, Weber C‑P (2006) Die Bilanzanalye. Beurteilung von Abschlüssen nach HGB und IFRS, 8th edn. Schäffer-Poeschel, Stuttgart
Lausberg C, Wiegner A (2009) Market data and methods for real estate portfolio ratings. Presented at the 16th European Real Estate Society Conference, Stockholm. https://www.researchgate.net/publication/335235359_Market_Data_and_Methods_for_Real_Estate_Portfolio_Ratings. Accessed 19 August 2019
Lee SL (2003) When does direct real estate improve portfolio performance? Real estate & planning working papers, vol 17/03. Henley Business School, Reading University, Reading
Lee SL (2007) Modified VAR and the allocation to real estate in the mixed-asset portfolio. Presented at the Regensburg Conference on Real Estate Economics and Finance in Regensburg, Germany. https://www.researchgate.net/publication/237252385_Modified_VAR_and_the_Allocation_to_Real_Estate_in_the_Mixed-asset_Portfolio_Presented_at_the_Regensburg_Conference_on_Real_Estate_Economics_and_Finance. Accessed 23 May 2019
Lee SL, Stevenson S (2006) Real estate in the mixed-asset portfolio: the question of consistency. J Prop Invest Finance 24(2):123–153
Liu CH, Hartzell DJ, Grissom TV (1992) The role of co-skewness in the pricing of real estate. J Real Estate Finance Econ 5(3):299–319
Lizieri C, Ward C (2001) The distribution of commercial real estate returns. In: Knight J, Satchell S (eds) Return distributions in finance. Butterworth-Heinemann, Oxford (UK), pp 47–74
Marcato G, Key T (2007) Smoothing and implications for asset allocation choices. J Portfolio Manag 33:85–98 (Special Real Estate Issue)
Maurer R, Reiner F, Sebastian S (2004) Characteristics of German real estate return distributions: evidence from Germany and comparison to the U.S. and U.K. J Real Estate Portfolio Manag 10(1):59–76
McNeil AJ, Frey R (2000) Estimation of tail-related risk measures for heteroscedastic financial time series: an extreme value approach. J Empir Finance 7(3/4):271–300
Miles M, McCue T (1984) Commercial real estate returns. J Am Real Estate Urban Econ Assoc 12(3):355–377
Morawski J, Rehkugler H (2006) Anwendung von Downside-Risikomaßen auf dem deutschen Wohnungsmarkt. Kredit Kapital 39(1):11–42
Myer FCN, Webb JR (1992) Return properties of equity REITs, common stocks, and commercial real estate: a comparison. J Real Estate Res 8(1):87–106
Newell G, Webb JR (1996) Assessing risk for international real estate investments. J Real Estate Res 11(2):103–116
Orlowski LT (2012) Financial crisis and extreme market risks: evidence from Europe. Rev Financial Econ 21(3):120–130
Pagliari JL Jr, Scherer KA (2005) Public versus private real estate equities: a more refined, long-term comparison. Real Estate Econ 33(1):147–187
Payne J, Sahu A (2004) Random walks, cointegration, and the transmission of shocks across global real estate and equity markets. J Econ Finance 28(2):198–210
Pedersen CS, Satchell SE (1998) An extended family of financial-risk measures. Geneva Pap Risk Insur Theory 23(2):89–117
Richter J, Thomas M, Füss R (2011) German real estate distributions: is there anything normal? J Real Estate Portfolio Manag 17(2):161–179
Rockafellar TR, Uryasev S, Zabarankin M (2002) Deviation measures in risk analysis and optimization. Research Report, vol 2002‑7. Risk Management and Financial Engineering Lab/Center for Applied Optimization, Gainsville
Sanders AB, Pagliari JL Jr, Webb JR (1995) Portfolio management concepts and their application to real estate. In: Pagliari JL Jr (ed) The handbook of real estate portfolio management. Irwin, Chicago, pp 117–172
Schindler F (2010) Further evidence on the (in-)efficiency of the U.S. housing market. Discussion paper, vol 10-004. ZEW—Centre for European Economic Research, Mannheim
Schwenzer J (2008) Untersuchung zur Bedeutung und Ausprägung des Risikomanagements von Immobilien in Deutschland. Studienarbeit, TU Braunschweig, Institut für Geodäsie und Photogrammetrie
Signer A, Favre L (2002) The difficulties of measuring the benefits of hedge funds. J Altern Invest 5(1):31–42
Sing TF, Ong SE (2000) Asset allocation in a downside risk framework. J Real Estate Portfolio Manag 6(3):213–223
Sivitanides PS (1998) A downside-risk approach to real estate portfolio structuring. J Real Estate Portfolio Manag 4(2):159–168
Stein M, Piazolo D, Stoyanov S (2015) Tail parameters of stable distributions using one million observations of real estate returns from five continents. J Real Estate Res 37(2):245–279
Tihiletti L (2006) Higher order moments and beyond. In: Jurczenko E, Maillet B (eds) Multi-moment asset allocation and pricing models. John Wiley & Sons, Chichester, pp 67–78
Toma A, Dedu S (2014) Quantitative techniques for financial risk assessment: a comparative approach using different risk measures and estimation methods. Procedia Econ Finance 8:712–719
Wang P (2006) Errors in variables, links between variables and recovery of volatility information in appraisal-based real estate return indexes. Real Estate Econ 34(4):497–518
Webb JR, Pagliari JL Jr (1995) The characteristics of real estate returns and their estimation. In: Pagliari JL Jr (ed) The handbook of real estate portfolio management. Irwin, Chicago, pp 173–240
Wheaton WC, Torto RG, Sivitanides PS, Southard JA, Hopkins R, Costello JM (2001) Real estate risk: a forward-looking approach. Real Estate Finance 18(3):20–28
Wheaton WC, Torto RG, Southard JA, Sivitanides PS (1999) Evaluating risk in real estate. Real Estate Finance 16:15–22
Young MS (2008) Revisiting non-normal real estate return distributions by property type in the U.S. J Real Estate Finance Econ 36(2):233–248
Young MS, Graff RA (1995) Real estate is not normal: a fresh look at real estate return distributions. J Real Estate Finance Econ 10(3):225–259
Young MS, Lee SL, Devaney SP (2006) Non-normal real estate return distributions by property type in the UK. J Prop Res 23(2):109–133
Acknowledgements
This paper is based on work undertaken by Moritz Müller, submitted in partial fulfilment of the requirements of the degree of Master of Science in Real Estate Investment at Cass Business School, London.
Author information
Authors and Affiliations
Corresponding author
Rights and permissions
Open Access This article is distributed under the terms of the Creative Commons Attribution 4.0 International License (http://creativecommons.org/licenses/by/4.0/), which permits unrestricted use, distribution, and reproduction in any medium, provided you give appropriate credit to the original author(s) and the source, provide a link to the Creative Commons license, and indicate if changes were made.
About this article

Cite this article
Lausberg, C., Lee, S., Müller, M. et al. Risk measures for direct real estate investments with non-normal or unknown return distributions. Z Immobilienökonomie 6, 3–27 (2020). https://doi.org/10.1365/s41056-019-00028-x
Received:
Revised:
Accepted:
Published:
Issue Date:
DOI: https://doi.org/10.1365/s41056-019-00028-x