
Abstract
Analytical methods are utilized throughout the biopharmaceutical and vaccines industries to conduct research and development, and to help control manufacturing inputs and outputs. These analytical methods should continuously provide quality data to support decisions while managing the remaining of risk and uncertainty. Analytical quality by design (AQbD) can provide a systematic framework to achieve a continuously validated, robust assay as well as life cycle management. AQbD is rooted in ICH guidelines Q8 and Q9 that were translated to the analytical space through several white papers as well as upcoming USP 1220 and ICH Q14. In this white paper, we expand on the previously published concepts of AQbD by providing additional context for implementation in relation to ICH Q14. Using illustrative examples, we describe the AQbD workflow, its relation to traditional approaches, and potential pathways for ongoing, real-time verification. We will also discuss challenges with respect to implementation and regulatory strategies.
INTRODUCTION
Analytical methods are utilized throughout the biopharmaceutical and vaccines industries to conduct research and development, and to help control manufacturing inputs and outputs. Like the materials they measure, analytical methods should be fit for use.
At the fundamental level, analytical methods are used to provide data, or more broadly information, to make decisions. The decision-making process requires the acknowledgment of the risk of making the wrong decision. This acknowledgment of risk, and more precisely the control of risk, brings analytical methods into the realm of risk-based development and highlights the need for the application of quality by design (QbD) to analytical methods (AQbD).
This paper follows on concepts presented in a joint EFPIA and PhRMA publication on “Implications and Opportunities of Applying QbD Principles to Analytical Measurements” [1]. Using an example, the paper will outline how different AQbD tools work in concert towards a validated, robust assay and how the validated status may be continuously confirmed. We will also point out several challenges to the ideal AQbD process where scientists across the industry and regulatory authorities will need to collaborate to develop strategies that maintain quality while reducing hurdles on the way of medicines to the patient. Also, while AQbD offers many advantages, the traditional approach has resulted in quality medicines for many years and will continue to support drug development [2]. A thorough scientific understanding of the analytical environment, for example, the sample matrix, the process that generated the samples, the characteristics of the analyte, or the characteristics of the measurement, is critical to both the traditional and the AQbD approach. AQbD can enhance this body of knowledge further by providing a systematic and networked framework.
One key concept of the AQbD process is that the steps, tools, and approaches developed for application of QbD for manufacturing processes (and described in ICH Q8, Q9, and Q10, [3,4,5]) have analogous application to the development and use of analytical methods [6]. This includes the concept of an analytical target profile (ATP), which is viewed “as having the potential to reduce the burden of post-approval variations.” In fact, the ATP should be aligned with the decision rule (acceptance criterion) associated with a use of a method to meet the expected critical quality attribute (CQA) range, and thereby linking analytical measurement requirements, method performance, and CQA requirements. Often, many method conditions may be able to meet the requirements set forth in the ATP and sometimes multiple techniques, thereby allowing flexibility to choose or even switch methods if warranted.
The similarities to approaches developed for QbD for manufacturing processes were further laid out in a textbook chapter on Quality by Design: As Related to Analytical Concepts [6]. In that chapter, an analytical method was likened to a pharmaceutical process. A pharmaceutical process makes final product which must be “fit for use.” That is, the final product must meet the requirements of the customer, the patient. Those requirements are typically related to impact on safety and efficacy. An analytical method produces reportable values which must likewise be “fit for use.” The reportable value must meet the requirements of the customer and balance risk from residual measurement uncertainty with the decision that is made based on the data. The uncertainty is related to the total analytical error (TAE, combining accuracy, and precision) of the reportable value whereas the risk is related to the impact of an inaccurate decision based on the measurement data. For example, if a direct patient impact can be related to a measurement difference of 5%, then the TAE must be much lower to accommodate process variability and measurement uncertainty. On the other hand, if a measurement difference of up to 20% could be safely tolerated, the associated measurement TAE could be for instance 5–10%. Acceptable residual risk from data uncertainty to make decisions is the driver to define method performance requirements in the ATP [7,8,9,10]. In addition to the TAE (or accuracy and precision separately), the ATP defines other critical method performance characteristics that are essential to the test such as range, sensitivity, and specificity. In some cases, business drivers may be captured in the ATP as well. Different technologies might be able to support ATP requirements, while business drivers such as cost, maintenance, or throughput could drive the choice. For example, protein concentration measured by fixed pathlength UV absorbance could easily be implemented in any laboratory worldwide whereas variable pathlength UV absorbance or refractive index measurements might be more limited.
While the specific examples above are mainly related to directly measurable and adjustable method parameters, the ATP ideally should capture all critical aspects of method performance. However, different paths could be taken to capture the scientific method background such as general analyte or sample characteristics versus the method performance requirements such as accuracy, precision, or LLOQ. Both, the systematic scientific understanding as well as the method performance requirements could potentially be leveraged to support different types of downstream method changes. For example, characterization of the type and nature of impurities of interest together with related performance parameters such as LLOQ could potentially support chromatographic method changes if the accuracy, precision, and selectivity remain the same. In another example application, more complex cell-based or immunological methods could potentially be updated within the ATP and scientific framework if the mechanism of the measurements, e.g., the use of specific antibodies, and resulting data remain the same.
The philosophy behind and strategies for implementation of AQbD and associated life cycle management of an analytical method can be deduced from approaches and requirements for pharmaceutical processes and products [9,10,11,12,13,14]. The parallels associated with this analogy are summarized in Table I.
The progress of AQbD in small- and large-molecule companies was reported from the IQ Analytical Leadership Group [15]. In that paper, the authors summarized the results from a survey conducted over 16 pharmaceutical and biopharmaceutical companies. The survey indicated that most companies engage in AQbD in later phases of development, with primary emphasis on drug substance (API) and drug product testing and less on in process monitoring and compendial methods. Efficiencies were realized from generic risk assessments and standardized approaches to method development, while all companies used statistics, particularly design of experiments (DOE) to improve the efficiency of AQbD implementation. Most cited more robust methods and improved knowledge about their methods as being drivers for AQbD implementation, while some cited additional investment costs as a barrier to its use. It is noteworthy to point to a challenge cited in the paper: “During development, specifications may change and consequently ATPs may change to ensure that methods remain suitable for their intended use,” which particularly applies to biologics and vaccines. However, the basic concept of the decision rule outlined above still applies; i.e., method performance requirements are not driven by method capability but by the decision risk (impact) as affected by the TAE. Understanding and controlling method uncertainty should align with decision/patient risk as it changes throughout the drug development cycle.
AQbD represents a systematic framework to align method requirements with product requirements to balance decision and patient risk with method performance. While AQbD is not the only approach to achieve this goal [2], the systematic framework allows integrating efforts more efficiently across the entire method life cycle. Hybrid approaches may also provide benefits by balancing risk, existing knowledge, a sound control strategy, and resources. Knowledge of method risk factors can then be leveraged to target investment to mitigate the greatest risks across the life cycle as opposed to optimizing or “gold-plating” every aspect of a method. For example, the company may invest more resources in design and development to have better knowledge about a method, institute a strategic continuous performance plan, and rely less on formal method validation. In addition to the benefits in knowledge and robustness, this could help expedite later development and accelerate licensure. The company balances time, cost, and risks to manage method robustness, while the enhanced method understanding may also lead to regulatory benefits or flexibility within the systematic AQbD framework. It should be noted that the potential regulatory flexibility will be assessed when systematic implementation of these principles will be in place in industry. Below we outline some examples of potential paths towards such external benefits of AQbD:
One path to potential regulatory flexibility is the use of a method design space or method operating design region (MODR) which could allow for method adjustments within the MODR space. The MODR allows modeling method performance around ATP requirements such as accuracy and precision (or TAE) associated with the settings of method parameters such as concentrations or times.
For method characteristics beyond the MODR model, systematic, thorough, and documented scientific understanding of critical method attributes should be considered by regulators as a basis for potential regulatory flexibility. For example, a chromatographic impurity method may need to be switched from an UPLC to an HPLC to accommodate a global deployment. The method performance still would need to demonstrate similar resolution of the impurities between both methods. Meanwhile, enhanced understanding may be used to balance other risks to method performance; for example, there would be a low risk stemming from changes in the sample nature since the manufacturing process and sample preparation steps do not change in this example, and all the impurities have been well characterized and documented previously. In another hypothetical example, a ligand-binding method might need to be changed from an ELISA to a bead-based method. Again, method performance meeting ATP requirements of accuracy, precision, or LLOQ would still be demonstrated. Enhanced understanding would evaluate risks associated with other factors such as the nature of the measurement. In this example, the risk to the method would be low since the same antibodies and the same analytical mechanism (antibody-antigen binding) are used as a foundation of the method.
In such cases, the AQbD framework should allow leveraging scientific experience and expertise thorough documented understanding of the scientific background, risk management, ongoing verification, and/or control strategies to allow updating the method with limited regulatory oversight such as a notification rather than a prior approval. While the AQbD framework and value extend well beyond the MODR to support the entire life cycle management, the extent of potential regulatory flexibility in the examples described above still is not fully embraced by both regulators and the industry. New and evolving guidelines (ICH Q12 and upcoming Q14, [2, 16]) and ongoing discussions between regulators and industry will be needed to provide a path to integration of AQbD and regulatory flexibility.
In this white paper, we expand on the previously published concepts of AQbD by providing additional context of how AQbD can be implemented. Here, we provide additional definition of the concepts using a hypothetical example to illustrate an ATP covering several technologies. We will focus on the use of the MODR as one of the paths to support method characterization and potential changes. We will also touch upon alternatives to the MODR within the AQbD framework but will limit those discussions in the interest of space. We also expand on the concept of ongoing verification by detailing its many components and how assay controls can be strategically used to guide this concept through the life cycle of the method.
Traditional Versus QbD Approaches
Traditional approaches to method development and validation have been implemented and refined over recent decades and regulated through guidelines such as ICH Q2(R1) [17]. This has resulted in reliance on a one-time method validation to demonstrate fitness for use, sometimes without fully integrating experience from method development, validation, and method deployment. As validation tends to be a “well-rehearsed demonstration of method performance,” it does not necessarily lend itself to effective risk management, in particular considering individual implementations of ICHQ2.
While the traditional approach does apply sound scientific principles and has resulted in decades of safe and efficacious medicines, there are also shortcomings. In particular, the reliance of assessing method performance mainly during well-controlled validation exercises limits knowledge of actual method performance at the time of testing. It should be noted that AQbD does not represent entirely new concepts but rather integration of sound science into a systematic framework to better connect product and method requirements allowing one to better leverage knowledge across the life cycle [2].
The main advantage of a QbD approach to analytical method validation comes from “designing quality into the method,” and thereby the overall control strategy for a product. If executed properly, this could lead to significant benefits including a reduction in method variability and development of a robust method operable design region (MODR, or formerly “design space”) that should lead to fewer manufacturing investigations due to poor method performance. Additional benefits would come from a standardized paradigm for method development, improved method transfers, adoption of continuous method improvement, and more rapid adoption of innovative technologies. A QbD approach also provides the potential for improved regulatory filings through enhanced method understanding and risk-based regulatory flexibility during life cycle management [14, 18, 19]. The application of AQbD will also allow the accumulation of data and knowledge about the method which can be used to define efficient and scientifically driven analytical control strategy.
One of the major risks surrounding an AQbD approach to method validation revolves around the lack of an accepted path and case studies from multiple modalities that would provide a blueprint for the industry and regulators to follow. Some early stage and theoretical AQbD examples have been published [6, 20] and a hypothetical example is also included in this manuscript, but implementation is not widespread and consistent across industry and regulatory authorities. This risk coupled with the seeming complexity could lead to companies electing to forego the investment in planning and coordination that is required to successfully implement an AQbD approach.
Terminology
While most terms will be defined in their respective sections of the paper, some terminology will be used throughout.
For purposes of this paper, the term analytical method or method will refer to the “wet chemistry” comprising sample preparation, instrumentation, reagents, standards, calibrations, controls, and calculations used to obtain a measurement [21]. In this regard, a measurement is an individual output from the implementation of the method and is governed by a method protocol.
By contrast, the term analytical procedure or procedure will refer to a use of the method, which might be governed by a separate procedure protocol, and results in a reportable value [21]. This value is subjected to the procedure decision rule or acceptance criterion; i.e., can the reportable value support the associated product decision such as release or disposition?
The dichotomy of method and procedure provides a basis for implementing AQbD and for considering different requirements (ATPs) for different decisions associated with the same (wet chemistry) method (e.g., release, stability, process development).
This paper will also adopt terminology introduced in USP’s draft chapter on A Life Cycle Approach to Analytical Methods [10, 13]. Specifically, the traditional concept of validation will be placed in the context of risk-based life cycle management through integrated method understanding across stages that traditionally tend to be separated: (1) definition of method requirements; (2) technology selection, method design and development; (3) method validation; and (4) method ongoing performance verification including bridging.
Besides traditional accuracy and precision as measures of method performance, we will also use the combined term of total analytical error (TAE). In this paper, we will focus on AQbD of parameter requirements and use the TAE concept instead of the typical separation of accuracy and precision [7, 8, 18] as the requirement which is acceptable for a measurement. Use of the combined uncertainty is supportive information aiding with rationale for individual criteria on accuracy or precision and allowing holistic risk assessment associated with the reportable value.
We will outline each of the stages and their interactions with applicable background and theoretical examples starting with the definition of the requirements in the ATP (1), followed by method development through the establishment of the MODR (2), and validation, bridging, and ongoing verification (3 and 4)
ANALYTICAL TARGET PROFILE
A well-defined analytical target profile is fundamental to the successful application of QbD tools to analytical procedures. Like the QTPP, which describes the desired attributes of a therapeutic with respect to patient needs, the ATP can include both the critical analyte attributes or performance characteristics to be measured and the associated parameter requirements of the reportable result [8]. Critical analyte attributes focus on what scientific aspects need to be measured, for example, the type of impurities, the sample matrix, or the biology of the analyte. Parameter requirements focus on (1) allowable TAE, a combination of bias and precision, and (2) allowable risk of the criteria not being met or the proportion of the results expected to be within the acceptance criteria.
In addition, other performance requirements may be captured, such as limit of detection (LOD), limit of quantitation (LOQ), and specificity. Method robustness and ruggedness targets technically could also be captured in the ATP but are better suited to be derived from the MODR.
Linking allowable method risk as derived from product requirements with method uncertainty offers both an opportunity and an expectation. The opportunity lies in limiting investment to what is needed to meet the acceptable risk profile, i.e., avoid “gold-plating” methods. At the same time, the expectation is meeting ATP requirements as a foundation of the method, i.e., if the minimal ATP requirements are not met, the method cannot be deployed and may require greater than usual investment. Thus, at least the minimum method performance criteria are defined upfront based on method needs rather than setting acceptance criteria after development based on method capability.
The ATP therefore serves as a reference point for assessing the fitness of a selected analytical procedure (Figure 1). While the procedure requirements, such as the TAE (accuracy and precision), range, and LOD/LOQ, are the critical operating parameter-related aspects of the ATP. While the critical task of the ATP is the definition of method performance requirements around the measurement, it could also include other attributes related to method deployment such as throughput or turn-around time. For example, it may be argued that a method that meets all the performance requirements but has unrealistically high time, resource, quality, regulatory, or cost requirements, is just as unfit for deployment as a method that does not measure well. Of course, these factors do not always clearly link to patient risk as managed by ICH Q8 and Q9. It will be a choice whether to manage these aspects through an extended ATP as we suggest even though not required from a regulatory perspective or through other separate processes and documents. In addition, the ATP should capture analyte attributes that are critical for the method to resolve or maintain upon changes during the life cycle. The ATP is not necessarily a one-time activity but may evolve together with evolving product knowledge and specifications during development. Particularly biologics and vaccines often undergo several iterations of product and thus method performance expectations. However, the ATP and the method requirements are always driven by product requirements as outlined in the QTPP (for example, but not limited to specifications), rather than traditional method capability.
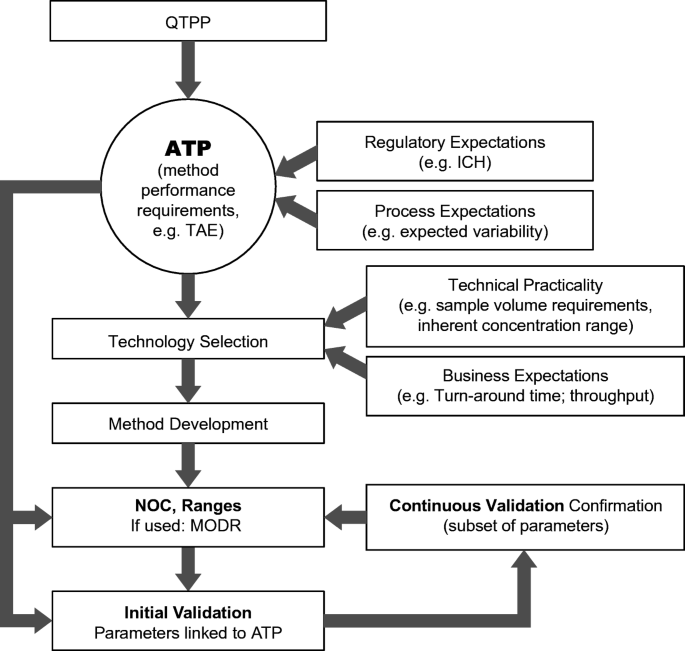
Role of the ATP to collect method input information as well as guide development and validation. NOC, normal operating conditions; MODR, method operable design region
During initial method development, the ATP can be used to guide the selection of appropriate technology. When more than one technology fulfills the ATP requirements, business expectations (e.g., throughput) and best fit with ATP expectations are considered for final decision before method development. When changes occur during the program or analytical life cycle, or where specifications are changed and improved performance may be required of a reported result, the ATP should be updated to reevaluate method selection. As such, an ATP should be agnostic of the technology (e.g., electrophoresis versus chromatography) but rather focus on critical analyte attributes and performance parameters. The ATP can be applied both prospectively to new procedures and retrospectively to existing procedures.
In our hypothetical example, the method objective is the determination of protein concentration both as in-process and as release test (Table II). The ATP in this example captures both performance expectations that are driven by the product such as the TAE (total analytical error), comprised of both accuracy and precision. Once the TAE is defined, accuracy and precision may also be included in the ATP, depending on the specific testing needs. For instance, in Table II, TAE was first identified, based on product specifications and clinical experience; accuracy (bias) was then defined, considering the testing purpose; precision was finally assessed, based on pre-defined TAE and accuracy. A similar approach was followed in the reference by pre-defining TAE and precision and then calculating bias with a given confidence level [8].
Multiple benefits can be realized by using an ATP: (1) to ensure that an analytical procedure is suitable throughout the life cycle of the product; (2) the performance requirements of the method are clearly stated; (3) any technique or procedure that meets the requirements stated in the ATP is suitable; and (4) change is assessed through the ability of the modified procedure to meet the requirements of the ATP. Building quality into a method using the ATP will result in greater confidence in the reportable result and thus lower risk. This should allow for regulatory flexibility when making method changes [1].
However, industry and regulators are still exploring the implementation, and potential opportunities for flexibility towards changes of fully integrated AQbD including changes within the knowledge space around critical attributes and mutually beneficial application of MODR models. From an industry perspective, flexibility could go towards updating methods and/or expanding sample matrices within the ATP framework rooted in thorough understanding and characterization of the science underlying analytical methods. In addition, benefits of enhanced method understanding could be gained even with a combination of AQbD tools and “traditional” approaches.
Prospective Use of Analytical Target Profile
Ideally, the ATP should be defined in the early stage of the life cycle of a product/process, to drive technology selection and method development. However, there is still value in defining an ATP for legacy methods that already went through traditional development, which is discussed in more detail in the next section.
The inputs for the ATP are related to product and/or process requirements which in turn are linked to patient safety and product efficacy. The ATP defines method performance expectations that ensure meeting product or process requirements. In some cases, such as in our example (Table II), a CQA may be assessed at different stages (in-process versus release) resulting in different associated method requirements. This might be handled by establishing separate ATPs for each application or by using a single ATP for a given CQA with application-specific addenda. While the logistical solution is a matter of preference, it is important to establish a holistic analytical strategy.
The ATP defines both critical analyte attributes and method parameter requirements such as the TAE (or accuracy and precision), the associated required range for the tested attribute (e.g., specification or other internal ranges, process performance-driven limits), range etc. When prior knowledge is available on a given attribute (e.g., compendial specifications, platform information leading to clear expectations for process control), the ATP definition can be implemented in early development with minimal expected changes. When prior knowledge is not available, the ATP will evolve as more information is gained on product and process requirements. Typically, the purpose is articulated from the very beginning. The TAE is defined as early as possible in the process, while expectations for accuracy and precision are being finalized. When the ATP is changed (due to evolution of product and process requirements), selected analytical method suitability should be re-assessed, with potential optimization or replacement of the procedure. It is therefore advisable to ensure that ATP content is locked before method validation, as ATP expectations are typically used to define the acceptance criteria [22].
Retrospective Use of Analytical Target Profile
The current literature and guidance documents emphasize the importance of defining the ATP and using it to guide all subsequent method development decisions and evaluation of a method’s fitness for intended use [8, 10, 23, 24]. This is the ideal situation but raises the question of what to do with legacy methods developed and validated according to more traditional approaches.
In this scenario, the ATP can function as the reference point when performing bridging studies between a legacy method and a revised or orthogonal method. The ATP in this context serves to bring the focus to the main purpose of the legacy method (e.g., to make a measurement and report a result) and makes explicit what the requirements are. This would need to be accompanied by a justification that shows how the existing method satisfies the newly defined ATP criteria.
In the example method later in the paper, we illustrate potential bridging from an initial fixed pathlength UV-based method to a variable pathlength UV method and a refraction index method.
Retrospectively defining the ATP and calculating the TAE does not necessarily require additional validation studies or data. Historical method performance data (e.g., based on specific system suitability or assay control charts) together with thorough scientific understanding gathered over time may be used, and many examples have been reported in the literature where traditional method validation data (precision, bias, etc.) were used to calculate the TAE [25,26,27,28].
If the method details were previously listed as part of a regulatory application/filing for an approved product, these may be considered as established conditions per ICH Q12 that would be expected to satisfy the requirements of the newly established ATP to serve as a starting point for future method life cycle management and potential updates. The ATP can support two potential routes per ICH Q12 [9, 18]: (1) a post-approval change management or (2) product life cycle management.
Rather than traditional bridging against the established conditions, the ATP can be used to justify the post-approval change protocol against product-/purpose/driven requirements rather than historic data. Introducing the ATP retrospectively, as part of a post-approval method change protocol, along with appropriate data clearly showing how the old method and the new method both satisfy the ATP, could potentially ease the regulatory burden for any future changes to the method.
Alternatively, the ATP and the established conditions could be incorporated into a product life cycle management. The ATP would then also be used to outline how method updates are handled against method risk, ATP requirements, and if applicable, established conditions.
While an ATP that is well integrated into downstream method validation and verification should technically be sufficient to manage method and associated product/patient risk, regulatory authorities currently still expect traditional data and often associated change management against historical performance. However, demonstration of enhanced method understanding using AQbD tools such as the ATP can increase regulator trust and facilitate change approvals.
Technology Selection
Once the ATP is established, it can be leveraged to drive technology selection. Based on our ATP example from Table II, several technologies could potentially meet the requirements (Table III). While UV is the most obvious choice, we will use the example throughout the manuscript to demonstrate principles of method updates as well.
METHOD OPERABLE DESIGN REGION (MODR)
The MODR or design space is the combination of method parameter (at minimum but not necessarily limited to all critical parameters) ranges which have been evaluated and verified as meeting both the ATP criteria and the specific method performance criteria. The MODR is always strictly related to a specific method. While multiple programs might utilize a shared method, the MODR is defined to meet the ATP criteria. If the project criteria are different and thus, the ATP criteria differ as well, the MODRs of shared methods are not readily transferable.
Below, we will outline establishment and usage of the MODR. However, the MODR can be challenging, and other AQbD tools are still beneficial even without an ideal MODR.
The elements that are pre-requisites to the establishment of the MODR are (1) QTPP and ATP, (2) technology selection, (3) risk assessment, and (4) method development. Figure 2 outlines a potential workflow.
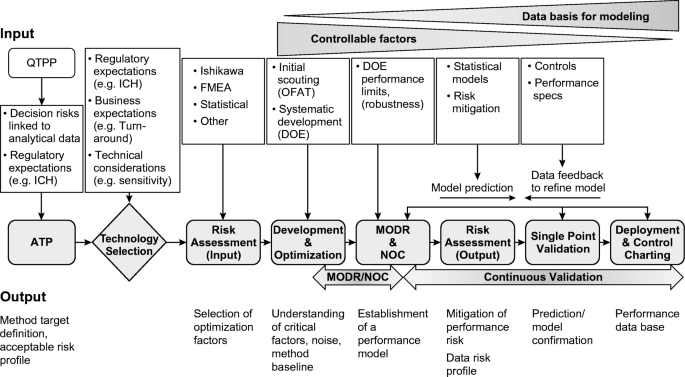
Development of the MODR in relation to the AQbD workflow. QTPP, quality target product profile; ATP, analytical target profile; MODR, method operating design region; NOC, normal operating conditions; O-FAT, one-factor-at-a-time; DOE, design of experiments
Risk assessment tools such as Ishikawa or Fishbone diagrams (Figure 3) and failure mode effect analysis (FMEA) [29,30,31] can be used to identify which method parameters need studying and require control to be able to deliver a method capable of meeting the requirements stated in the ATP.
MODR Generation
Scientific understanding of critical analyte attributes such as impurity profiles or analyte biology goes together with characterization of method parameter performance such as TAE or LLOQ. Method parameter performance should start with an assessment of the impact of varying the ranges of the inputs (method parameters) determined to have the highest risk from the risk assessment. The responses assessed during method development should link method performance to ATP requirements. ATP requirements such as accuracy and precision might be assessed directly, or indirectly through surrogate responses such as standard slope or background.
Experimental factors might be assessed one factor at a time (OFAT), multifactor design of experiments (DoE) approaches, or a hybrid approach depending on the balance of risk, quality requirements, and resources/constraints. In particular, multifactor DoEs combined with advanced statistical models allow for efficient experimentation to gain an in-depth understanding of the interactions and criticality of method parameters with respect to their impact on specific method performance criteria. The assessment of criticality on method performance can include determining if the degree of variability seen across the normal operating conditions (NOCs) is greater than a preset limit, e.g., historical method variability, which can then be used to assist in defining a region in which the ATP will be satisfied. We will outline this strategy with examples further below in the DOE and MODR sections as well as Table IV.
This enhanced approach is building quality into the method from the beginning of the development process by placing method parameters into a well-defined performance space in alignment with expected/required method performance needs. The establishment of the MODR needs to be supported by sound risk assessments and DoE along with analysis tools, in particular the establishment of predictive risk models. However, it should be noted that statistical models cannot always take all factors into consideration, for example, lot differences in raw materials or chromatography columns. The MODR is also limited to method parameters. In our protein concentration example, changing the method from UV absorption to refractive index measurement could not be accomplished within the same MODR. However, the critical analyte attributes would remain the same, and other tools in the AQbD framework could be leveraged to support method changes beyond the MODR. In another hypothetical example, changing the chromatographic parameters of an impurity method might still satisfy a certain critical impurity profile defined in the ATP but the two methods could not be linked through an MODR model. Thus, predictive modeling is not the only and not a complete tool to support method changes but rather needs to work hand-in-hand with sound scientific understanding of the measured analyte(s), risk management, and applicable control strategies.
Where scientifically demonstrable, method performance proxies, e.g., reference curve parameters could be used to determine a suitable MODR in place of the reportable result as a measure of method performance.
In our example, a fishbone diagram is used to map out potential method inputs (Figure 3) that can then be rank-ordered through systematic risk assessment tools such as a failure-mode-effects analysis (FMEA) or a simpler cause-effect analysis (CEA) [29,30,31].

A fishbone diagram of method inputs for a UV method to determine protein concentration
Design of Experiments
Statistical design of experiments (DoE) is a systematic approach that integrates multi-factor experimentation, mitigation of the impact of variability, and response modeling to efficiently use resources and to maximize the information gained from experimental data [32]. DoE can be used to:
-
Evaluate the effect of critical method parameters on the reportable result or of method proxies if applicable
-
Identify the interactions between critical method parameters
-
Optimize the method operating conditions
-
Demonstrate robustness of the analytical procedure [33]
Different types of DoE can be used to support these aims:
-
Screening designs [34] to identify which parameters from a large set of parameters are effectively critical. For example, Placket-Burman designs allow the selection of main effects, or slightly larger fractional factorial designs can also detect key interactions of factors.
-
Response surface designs [35] to establish a mathematical model which predicts outputs as a function of the inputs. These designs can be used to establish MODR ranges.
-
Robustness and ruggedness [36] designs to evaluate a large number of factors with a minimal number of experiments, often in highly fractionated designs. Typically, no effects are expected during robustness testing. When using less fractionated designs, robustness testing in some cases could also be used to establish method ranges for NOCs.
A robustness study is a measure of the insensitivity of method performance to changes in controllable factors and the undertaking of a standalone robustness study is synonymous with following the traditional approach to method development, implementation, and validation. The effective use of systematic design and development tools allows defining an MODR as part of development optimization that delivers results that meet the ATP requirements. This approach automatically builds robustness into the method by defining the MODR associated with critical parameter ranges.
The fishbone brain-storming exercise (Figure 3) and subsequent risk ranking as well as scientific experience and prior knowledge can help to select an initial set of factors for studying in DoEs. Although DoEs can efficiently be applied to study many factors, DoEs do not always have to be complex. For our protein concentration example, potential DoE factors are shown in Table IV.
Some factors may be critical to control but do not necessarily require DoE assessment, for example, the volume range (any volume > minimal technical requirements) or the extinction coefficient (experimentally determined versus calculated).
MODR and Normal Operating Conditions (NOCs)
Ideally, the MODR combines the ATP requirements and the probability of the method being able to satisfy these criteria using predictive models based on the DoEs. The MODR can be confirmed and if necessary refined during the method life cycle as new knowledge is gained. Model verification can be performed through the results of ongoing performance verification or, if necessary, via method validation.
The MODR is defined as the boundaries of a multidimensional space in which the critical method parameters have been assessed for suitable method performance as defined by the ATP. While the NOCs reside within the MODR, any MODR setting should result in acceptable method performance.
Different approaches can be taken to define the MODR. Below, we describe the use of DoEs and predictive modeling. However, alternative approaches might be more economical depending on a case-by-case basis [37]. Even in the absence of predictive models, an MODR might be established by thorough exploration of method ranges, for example by using robustness studies for range finding (see DoE section above) or by extending validation ranges beyond NOCs.
It should be noted that the MODR mainly establishes the settings of controllable factors. Noise factors such as equipment model and column series cannot readily be modeled. In some cases, a measurable factor may be extractable, for example, column age or lamp age, but more often, the exact mode of noise impact is unknown and cannot be modeled. A potential approach is the inclusion of as many expected noise factors as reasonably feasible when establishing the MODR. Through interactions, the impact of some noise factors can be reduced by adjusting controllable factors. Also, MODR models of method parameters do not replace but rather add to thorough scientific understanding and characterization of the underlying method principles.
Although analytical methods are usually run at a given set point as defined by the standard operating procedure (SOP), utilizing a traditional one factor at a time (OFAT) approach to define the set points can result in the final conditions being at the edge of failure. This can then increase the risk of method failure over time and/or during method transfers as other (noise) factors might shift slightly, e.g., equipment performance, environmental conditions, or analyst training. In contrast, by utilizing DoE for method development, we gain a greater level of method understanding through evaluating factor ranges and their interactions and defining “optimal” target method set points. Furthermore, through the DoE model, we can assess the impact of any changes in the method parameters within the design space on the reportable result and the ability of the method to meet the ATP requirements.
While our discussion focuses on the application of DOEs, method understanding obviously includes the mode of action or mechanistic modeling as the foundation. Both approaches go hand-in-hand and can be used to set up the MODR more efficiently and effectively than when using either in isolation.
In turn, the limits of the normal operating conditions (NOCs) have been determined to be representative of a region within the MODR and are associated with a high probability of measurements meeting the ATP criteria. While the ATP sets performance requirements and represents the over-arching framework across the life cycle, it is not sufficient in itself to demonstrate or manage method performance.
The MODR could be utilized as one of several paths to regulatory flexibility within the AQbD framework. As an example, it is similar to relatively traditional regulatory routes: If the MODR is included in the regulatory filing, changes of NOCs within the MODR should require limited regulatory oversight, while one could validate the MODR space similar to a traditional validation resulting in no need for regulatory oversight in line with current practices for validated conditions. However, this approach is resource-prohibitive and does not leverage the power of MODR models. Instead, a validation could focus on the confirmation of the model without validating the entire MODR space. Building further on the flexibility of performance models, a confirmation of method performance, for example through ongoing verification, and a low-risk regulatory notification might be sufficient if method conditions are adjusted within the MODR model but beyond the validated ranges.
On the other hand, changes outside of the MODR would not be supported by the performance model and associated data. Additional AQbD tools may need to be leveraged to ensure that the method still meets the ATP requirements. For example, when new data are available, including data beyond the NOC, e.g., from the validation and subsequent ongoing performance verification from long-term use of the method, these data could potentially be used to verify or update the MODR using the established MODR models. While specific experiments may be needed in some cases, ideally, routine data will feed into the MODR on an ongoing basis and confirm or potentially expand the model (see also Figure 4).
Alternatively, thorough scientific understanding and characterization of analytical performance requirements, for example, impurity profiles of interest, the biology of the method, and the nature of the sample, could potentially be leveraged through the ATP to justify changes that result in similar measurements even when using different methods or parameter settings.
It should be noted that these example concepts around method changes with regulatory flexibility are not yet realized and face a number of regulatory and technical challenges as outlined in the next section.
The MODR may be more applicable to enhance the data package supporting traditional changes or to support the use of more limited ongoing verification data through the comparison of real-life data against predictive models.
For our protein concentration method example, Table V shows simple comparison of existing conditions (NOC) versus MODR. Although a simple UV method may not warrant the investment in defining the MODR, we use the less complex example to illustrate AQbD concepts and make the strategy more accessible. A more complex example was described by [6]. While the replication strategy technically is not directly part of the MODR, both go hand-in-hand to meet accuracy and precision (or TAE) requirements [38].
While the establishment of a well-defined MODR requires an upfront investment, downstream returns may be gained through method robustness and as one of the paths towards potential regulatory flexibility. A holistic risk assessment of method, product, and clinical risks may inform the level of investment and scrutiny. For example, an early-stage drug development program may not warrant extensive MODR investment as expected returns may fail to materialize if the program is discontinued. On the other hand, a late-stage development program with a high possibility of success would have line-of-sight to invest into a thorough understanding of the MODR. As MODR development and validation go together, investment can be balanced across the space. With a well-established MODR around the NOCs, validation could be designed to simply confirm a method performance model derived from the MODR rather than establishing method performance during validation. However, these approaches to the validation of method parameters do not replace characterization of critical method performance characteristics that are included in the ATP but that may not fall under the scope of MODR models. In addition, similar to other AQbD tools, the MODR does not replace traditional scientific understanding of the method, its inputs, the analyte, and its critical attributes.
Challenges to the Idealized MODR Concept
Although the MODR can be a very powerful tool, it is not the only path to an enhanced AQbD approach, and implementation of the MODR as described above can face a number of technical and logistical challenges:
-
Return on investment: establishment and confirmation of the MODR can represent a significant amount of investment while the return is not necessarily clear or given. Regulatory flexibility currently is lacking. While thorough method understanding might facilitate regulatory discussions, method changes are still evaluated by adherence to traditional concepts.
-
Validation: Should validation concentrate on the MODR or the NOC? Either approach could be justified but they will result in different downstream benefits. While other aspects of the AQbD framework could be leveraged to support method changes (ATP, thorough understanding of critical method/analyte characteristics, systematic risk management, etc.), the MODR could be one path towards regulatory flexibility. A validated MODR, for example, could justify method changes within the validated space similar to traditional approaches to validation. Focus on the NOC on the other hand would represent less upfront investment and complexity but instead, downstream changes may also be more complex to justify and implement. The decision between different paths to implement and leverage AQbD could be driven by method risk and business requirements as defined in the ATP. For example, a method that is only run in a single laboratory at the manufacturer might only need NOC validation whereas a method performed in multiple locations might benefit from a full MODR validation and/or additional aspects of the AQbD framework. This could also be envisaged as an incremental approach by first qualifying the NOC and later extending to MODR, taking the opportunity of a change for instance. This should be a business decision based on the expected return on investment. In many cases, a validation of the MODR may be too complex and costly while still limiting changes to factors that can be modeled statistically. Method quality is best achieved by thorough scientific understanding and characterization of performance requirements, sound risk management, ongoing verification, and control strategies. This foundation of AQbD in turn may also lead to regulatory flexibility besides enhanced analytical control. The MODR plays into these strategies as one of the tools to provide the underlying knowledge base besides other development studies and scientific expertise, while an MODR validation could provide additional flexibility when implementing future changes of model parameters.
-
Life cycle management: Once a method reaches the late-stage production phase, it is likely to run at its set-point. Normal variation will be covered by the established ranges that are part of the MODR. In this stage, applications of the MODR may be limited to impact investigations when deviating from the set-points. Regular confirmation therefore may not add benefit in late-stage production.
In earlier stages when the method evolves with the project, it could be beneficial to leverage a continuum of data across the development to add to the MODR. However, there are challenges to consider: If the basic method does not change, early-stage data could be expanded throughout development. But what types of bridging studies are needed when moving to a new method that fits the ATP? How do we leverage historical knowledge especially for proteins from the same structural family, and then allow flexibility to modify the MODR as experience and data increase? Strategies to these challenges are still being worked out as the concepts mature.
-
Technical complexity: Also, MODR modeling only applies to continuous variables whereas there are many critical factors that do not easily lend themselves to modeling such as the impact of column or reagent lot changes on MODR settings of other factors. Lastly, confirmation of MODR models can also represent significant investment compared to traditional validation while at the same time, typical method adjustments tend to fall well beyond MODR factors, for example, equipment and reagent changes.
Given the complexity of the details between different methods and types of drugs, again, a partnership across industry and regulators to address these questions would be needed to provide an acceptable framework. The approaches will obviously vary between pharmaceuticals, biologics, or vaccines as well as for biochemical methods versus cell-based or biological methods. However, a more detailed discussion is beyond the scope of this manuscript. Nevertheless, the AQbD framework still offers many benefits including building of regulatory trust and potential flexibility even outside of an MODR.
METHOD VALIDATION USING AQbD PRINCIPLES
Validation in the Method Life Cycle
Traditionally, validation has been viewed as a “well-rehearsed demonstration of method performance.” Often, validations are run at a single point in time after which method performance is considered acceptable as long as system suitability criteria pass (ICH Q2, [17]). Thus, validation serves as a stage-gate between development and deployment. This stage-gate approach to validation tends to disregard knowledge from both development and subsequent deployment. At the same time, validations tend to be carried out under well-controlled conditions with respect to laboratory, analysts, materials, and other factors making findings less predictive of real-world method performance. The disconnect between method development and method deployment often is increased even further if acceptance criteria are based on method capability rather than QbD-based limits related to the risk when making program decisions using data with a certain degree of uncertainty [39,40,41].
AQbD-based specifications are founded in managing product risk related to analytical data. Greater method capability reflected by a reduced TAE will result in less method and product risk. However, this is not associated with setting the acceptance specifications. It should be noted that often, regulatory agencies are not entirely aligned with this concept of setting specifications and require lining up method specifications with method capability. In addition, when process and method variability are viewed as interconnected, tightening the TAE would allow for greater process variability which may be deemed unacceptable, in particular for vaccines and some biologics.
In AQbD, the method life cycle is treated as a continuum that determines the validated state of a method. This includes essentially three stages: (1) Definition of method performance characteristics and parameters: This step combines a thorough scientific understanding of analytical inputs such as the nature of the sample and its associated manufacturing process, method, and analyte principles (performance characteristics) with experimental data and if feasible, models of parameter ranges/MODR. For example, understanding of impurity profiles or analyte and measurement chemistry/biology may be combined with models around parameter/factor ranges such as flow rate and concentrations which guarantee sustainable method performance. The key is to define the framework conditions in which consistent method performance is achieved. (2) Validation in the AQbD framework is equivalent to the traditional method validation, i.e., a single-point-in-time performance evaluation in line with ICH recommendations as applicable. The initial validation activity will look similar to the traditional validation but it could potentially be limited in scope and only focused on the attributes directly linked to the ATP such as accuracy and precision while leveraging the development continuum for other aspects such as demonstration of specificity. The initial validation serves as a verification of method performance under NOC as it continues from development and moves forward to deployment. While the validation of method parameters is essentially a confirmation of the MODR model, the validation also formally establishes performance characteristics as a basis for potential future changes. It is worth noting here that ICH Q2 (rev01) [17] is specific to uses of chromatographic chemical analysis and may not be appropriate for other methods or uses. (3) Ongoing verification ensures that method performance remains in a validated state. System suitability criteria are one but not the only aspect of ongoing verification in AQbD. Ideally, a combination of approaches of system suitability, method controls, and statistical control charting is used to verify the validated state in real time. Therefore, the term “validation” in AQbD integrates a greater knowledge space and goes beyond a single-point performance check.
For example, in the traditional validation of the protein concentration case study, the UV technology would be initially optimized, then validated by ensuring the comprehensive set of attributes, such as accuracy, precision, range, LOQ, and robustness, are all determined to ensure the method is fit for purpose. This traditional upfront validation becomes a pass or fail event versus what is in the protocol with very little room to account for any potential “real” diversion from the expected conditions. As all the NOCs are locked in during the validation, the single-point validation not only makes future assay improvements difficult, but it also does not allow real-time conclusions whether the method remains in a validated state during deployment. For instance, the “gold standard” which was used in the validation to establish the accuracy of the method may become purer at a later time and thus yield a more accurate readout in the future. In this case, the traditional validation would not allow for the realization of the improved accuracy of the method or in the performance criteria.
When applying AQbD-based validation to our protein concentration example, method parameters or the performance of a control would continuously verify assay performance against the ATP in each experiment beyond the single point traditional validation. This continuous validation would potentially be able to pick up on this difference in the quality of the reference standard and through use of assay control charts as the new/more accurate gold standard would be immediately reflected in the assay control chart trends. In this case, it would be possible to reset the assay control chart by bridging with the new gold standard. This would give confidence in the performance of the method in real time and avoid re-validation of the method.
Moreover, assume we needed to switch to a new technology such as RI (refractive index) to measure protein concentration. With AQbD, once the ATP is defined, ATP criteria are not altered. The performance criteria of the measurement as defined in the ATP needs to be translated to validation criteria for a given technology. In our example, the ATP criteria would be translated into either the UV method or the newer RI method and dictate the associated validation protocol. In order to change from UV to RI, prior knowledge informs which validation criteria can be maintained and which would need to be updated. The switch in technologies is a matter of meeting the performance requirements set forth in the ATP. A new assay control chart will be implemented after the method parameters and/or the MODR are established and initial validation is carried out followed by method deployment. The assay control is likely to have a slightly different mean and error range, but it will continue to serve as a real-time measure of the performance of the RI-based method.
The biggest difference in the AQbD and traditional approach is that maintenance of the same ATP criteria and risk management across the method life cycle should facilitate regulatory change control [2]. Also, less effort might be placed on the initial validation by leveraging the systematic development data and knowledge together with greater emphasis weighed on the ongoing validation. For example, independent test occasions might be designed to reduce the emphasis on initial single point-in-time initial validation in favor of combining fewer validation and more routine testing performance data to assess the accuracy and precision/TAE. While such an approach may appear to carry a greater risk of uncertainty in the initial TAE value, one must, on the other hand, be aware of the uncertainty of traditional validation that is often run by more experienced scientists over a shorter period of time than routine testing.
There are certain cases within an analytical strategy where not all elements of the AQbD approach may be utilized. Some methods such as a mass spectrometry method where the routine instrument tunings will affect most of the MODR measurements (e.g., sensitivity), the actual MODR results may be limited. In those cases, a higher dependence on method understanding, initial validation, and ongoing validation will be necessary.
Validation Objectives
Validation is intended to provide assurance that the data are fit for use such as patient dosing or lot release. Mitigation of decision risks associated with method data dictates method requirements such as accuracy, precision (or TAE), LOD/LOQ, or linearity which are defined in the ATP.
A stage-gate approach as used traditionally does not adequately mitigate these decision risks because past method performance does not directly reflect real-time assay performance. While ICH Q2(R1) has merits in outlining a framework for performance evaluation (whether a formal validation or an informal performance assessment), there are also significant shortcomings.
The guideline was written for the validation of methods used for chemical analysis, where some of the parameters are specific to HPLC, and acceptance criteria are set according to typical performance of that technology. This leaves little opportunity for more innovative approaches to validation and has relegated this to a regulatory formality with only incremental knowledge gain.
A method may have more fundamental measures of performance which relate to accuracy and precision but are easier to optimize, validate, and monitor. Thus, for example, linearity of a separation method may be related to resolution of the target peak, specificity to shape of the peak. In addition to being attributes for optimization, these associations provide a basis for ensuring validity in routine testing, through system suitability.
In the alternative AQbD life cycle approach, ongoing, real-time verification works hand-in-hand with a one-time validation, definition of the MODR during development, and documented thorough scientific method understanding. The ongoing verification places a greater emphasis on the use of system suitability and control trending data to provide a holistic, real-time view of method performance. While ICH Q2(R1) principles still govern method validation [17], their implementation in an AQbD continuous framework expands the concepts beyond a one-time controlled study [2]. Also, the ICH Q14 concept paper outlines paths for both the traditional and the enhanced AQbD approach [2].
The life cycle approach of AQbD offers both opportunities for a phase-appropriate validated status of methods as well as appropriate mitigation of real-time decision risks associated with the data generated.
During development, establishment of the MODR and an associated prediction model may be one of the tools to set the parameter framework within which the method is considered fit for use. Validation can then either confirm the MODR model(s) at target settings, i.e., the NOC, or potentially across the entire MODR using DOEs. In case of a validation of the entire MODR, the NOC setting would be included as a design point. In addition, the validation confirms performance targets that may not be directly linked to method parameters but that are critical to method performance and aligned with the ATP and other AQbD tools. During method deployment, the performance prediction model(s) is continuously verified. Depending on the complexity, several different models may be needed to account for various scenarios for implementation.
For example, in the protein concentration ATP case study, a validation would be performed for both the UV absorbance and RI technologies. The validation for protein concentration can leverage data across the method life cycle so that the formal validation study might be limited to a few attributes detailed in the ATP such as accuracy, precision, and TAE. The total data set still will need to provide assurance that the method is fit for purpose in line with ICH Q2 requirements as applicable. The method validation would include several lots of material from each process step to be tested, and it will sample a few target points within the ranges (for example, material of different starting concentrations) determined in the MODR (see MODR Table V). Any findings that are not consistent with the MODR or with method performance requirements outside of the MODR scope would need to be investigated to understand and if needed mitigate root causes.
AQbD Life Cycle: Validation and Ongoing Verification
Control of Assay Performance
The AQbD framework uses multiple tools and approaches to ensure method control within the ATP limits. In the following discussion, we will mainly focus on concepts surrounding method parameters such as TAE or LLOQ. Method control through characterization of critical analyte attributes is equally important but its discussion will be limited in the interest of space.
In the AQbD paradigm, once the ATP has been defined, and (if applicable) the MODR/method development completed and found to be fit for purpose, the initial method validation is performed, and an ongoing verification strategy is put in place. The ongoing verification strategy will serve in several ways to ensure that the method performance remains in a state of control over the entire lifespan of the method through a combined implementation of well-designed assay controls, control charting/monitoring of assay parameters, and control strategies around critical method steps. In particular, assay controls and statistical control charting facilitate the continuum from method development through validation into ongoing verification during method deployment. Together with thorough ruggedness assessment and knowledge management through documentation, this facilitates the detection of assay trends and maintain a controlled state of performance by enabling applicable adjustments before performance is impacted as well as long-term method improvements.
Ongoing assay monitoring and verification could utilize a tiered approach based on risk to the reportable result (Table VI). The reaction to control chart events could be tiered according to the predetermined risk of not meeting ATP performance requirements. While high-risk events would lead to failing the method’s ongoing verification status whereas medium risks may just lead to a pause, and low-risk events might just need an investigation in parallel to continued testing.
-
1.
Monitoring of ATP requirements in the control chart, for example through control samples: Performance of the control samples would relate to a direct valid/invalid decision of the assay, i.e., ongoing verification conditions are or are not met. Carefully chosen method proxies may be monitored as well if a link to the reportable result performance is established.
-
2.
Monitoring statistical control chart trends [30, 42,43,44]: Data can still be used as long as ATP requirements (bullet #1) are still met. Investigate root causes and adjust to bring the assay back into control.
While statistical control strategies extend beyond traditional assay control samples, the strategic use of such assay control(s) ideally would be a critical part of the ongoing verification concept of AQbD. The assay control(s) will serve both as a real time monitor of assay performance, as well as a historical marker and a regulator of assay performance throughout the life cycle of a method. However, the availability of representative material early in the drug development process is a current challenge. It will be important to consider strategies for bridging such controls across the life cycle to accommodate shifts while still evaluating common continuous trends.
In an additional dimension, the assay control(s) will also be used to assess multiple attributes of method performance, such as assessing accuracy through the measurement of resolution for a chromatography assay. These additional attributes need to be established upfront during assay deployment. If applicable, controls should cover the MODR space, or at minimum, the ATP performance ranges. An analogy would be in addition to the use of assay controls which may be focused on the accuracy and/or precision, there is an opportunity to enhance method understanding by tracking method parameters such as peak resolution in chromatography, signal ratios, or other performance parameters and compare them to either trending charts or a “gold standard.”
The first function of the assay control(s) is continuously monitoring assay performance with each experimental run over the lifespan of the assay. With the use of control charts and strategic rules, the assay control value from each experiment is added to the control chart and performance criteria such as variability and accuracy become a living trend. The control chart allows real-time identification of method runs that are not in line with typical performance [42, 43]. Over the life cycle of the assay, it is likely to experience several areas where potential changes in things such as the environment, instruments, or testing sites can lead to the assay performance attributes drifting from their original values. These factors could include such things as different instruments, different sites, and different analysts. Depending on the provoking factors, this may lead to a corresponding adjustment in the assay to ensure ruggedness or to ensure the ATP criteria of method performance are still met and the method parameters remain within the MODR.
Secondly, the assay control will include additional measurable attributes that will allow translating the performance measurement from the initial validation to the time the assay is performed. The additional measured attributes can be all incorporated into the same assay control if possible or use multiple assay controls. For example, in chromatography, the LOQ of the method can be built into the assay control in a manner where additional performance attributes can be detected in the chromatogram to measure the LOQ. In this case, these attributes can also be used directly as system suitability criteria. Control charts typically go beyond to collect additional information. Another instance is where the main measurable peaks in a chromatogram may be used to not only assess variability but also method resolution or peak tailing. These attributes can all be tracked in control charts. For example, if the peak resolution starts to decrease, it may signal that a column is deteriorating and may need to be changed and this can be addressed before failure rather than having to wait until there is a method failure and the subsequent required investigation. In this example, these multi-attribute measurements would depend on and require an assay control to have multiple peaks that will allow us to measure all the attributes specified such as resolution, which is measured between two peaks.
Thirdly, the use of assay control charting and timely documentation practices allows capturing and documenting all the changes that have occurred over the lifetime of the product. In certain cases where such issues as ruggedness evolve, a further evaluation of the method performance using QbD tools such as risk analysis and root cause analysis may lead to improved documentation and the implementation of corrective actions. Those documented changes can be used in a quality assurance manner that incorporates, for example, a change control process, annual product review documentation, or any other quality process that will ensure that the essay is not only understood but also remains under control in a feedforward manner.
For example, in the protein concentration case study, the same assay control could be used in both UV and RI technology modes to monitor ATP-related parameters such as TAE or accuracy and precision separately. However, each technology would also have its own separate assay control charts for assay technology-specific performance parameters. The control charts for ATP-related parameters might exhibit shifts at the time of switch because there could be slight differences in the absolute values (concentration values in this case) readout from each technology. However, method performance still will need to trend within the requirements as defined in the ATP.
Trends in themselves also provide useful data. For example, trend differences might occur when comparing different technologies or assay performance before and after adjustments. Altogether, the various data sets lead to an enhanced understanding of method performance as well as underlying impact factors.
Accuracy, Precision, Linearity
Accuracy, also referred to as bias, reflects the ability of the method to return the expected result when measuring a known sample.
When assessing accuracy during validation, prepared validation samples are often used. During the later ongoing verification phase, assay controls as described above can be used to assess accuracy in real-time. These controls can come in different forms depending on what aspect of accuracy or which risk of inaccuracy is being controlled. For example, many chromatography methods feature internal standards whereas bioassays tend to have separate, indirect controls.
Initial validation of the accuracy of control samples (with pre-known values) and validation of the method precision could be designed to further evaluate and confirm the performance of the assay within the MODR model in a simulated “real-life” setting. Typically, validation will confirm method performance to meet the ATP requirements at the NOC settings and the associated ranges. If one chooses to validate the MODR model, method settings during the validation may be carefully designed to enable such confirmation while limiting the associated resources. Control samples reflecting regular samples as closely as possible play a critical role in both approaches as an unambiguous read-out of method performance.
Ongoing verification combined with prior validation, documented scientific understanding of critical method attributes, and an MODR model of method parameters if applicable work in concert to obtain a validated state of the method. In turn, deviations beyond this framework of the controlled state of a method would invalidate the method. Procedural details could be included in the operating procedure to define clearly when a method is not considered validated anymore and what data would be needed to bring the method back to a validated state.
Method bridging would also be a part of the ongoing validation model. In addition to technology-dependent parameters, accuracy, and precision data from controls could be added to create continuous, comprehensive trending charts that may be broken up into phases based on method deployment. If the new method performs within the limits of the trend chart, the method should be considered validated. For example, if protein concentration is originally validated by UV VIS spectroscopy using fixed pathlength, and later another protein concentration method needs to be implemented such as the UV VIS spectroscopy using variable pathlength then bridging the two assays together may be accomplished through migrating the original assay control chart or starting a new one. This example also illustrates some of the limitations of the MODR concept at which point, the integrated AQbD framework can be leveraged to manage risk and maintain method performance.
If a new method results in a shift, the impact should be assessed with respect to ATP requirements and potential risks to decisions made from the data. A formal risk assessment may be used. Method performance within the ATP targets and with only limited or with no risk could then result in a reset of the performance baseline and continuous trending. If significant risks despite performance within the ATP targets are determined, a restart at the ATP and a new validation, i.e., life cycle, may be required. While strict risk limits may be difficult to set upfront, it can inform and guide the necessary regulatory interactions.
In addition, shifts beyond the ATP requirements make by definition a potential method unfit for deployment. This AQbD approach will not be able to address all of the current challenges, for example with specificity, specifically where certain matrix interference may be due to newly appearing degradants that may not be resolved from the main species intended to be measured.
Specificity and Selectivity
Specificity represents the ability of a method to uniquely measure the analyte. For some methods such as immunoassays and many bioassays, specificity is not expected to change as long as no significant assay changes such as antibody clone replacements are made. In these cases, a one-time specificity assessment during MODR establishment should be sufficient.
Selectivity represents the ability of a method to measure the analyte free of interference from matrix components. If the matrix does not change and is confirmed by other methods, for example as is the case for many drug product assays, then selectivity assessment could also be limited to the MODR establishment. Unknown matrix changes remain a risk regardless of whether using a traditional or an enhanced approach. The enhanced approach may have an advantage if such unknown matrix changes lead to changes in control charts.
It is important to consider potential interactions between specificity/selectivity and some factor settings. Thus, it is not sufficient to only assess these parameters at the target factor levels. At the same time, a thorough understanding of the drivers for specificity/selectivity could be leveraged to justify changes. For example, if antibody specificity was demonstrated across a wide range of concentrations and potential cross-reactivities, a switch from an ELISA to a multiplexed immunoassay method could potentially be justified based on a well-understood method principle, i.e., in this case, the antibody-antigen interactions.
For assays with potentially varying sample matrices such as clinical samples, both specificity and selectivity potentially would ideally be a component of ongoing verification through carefully designed controls. Controls spiked into a sample at different levels could confirm the absence of interference of either matrix components or cross-reactivity. However, this approach may only be applicable with a low sample load since the testing workload would be multiplied. Assays with internal controls might be able to accommodate limited spikes that, at minimum, could serve as a worst-case failure check.
LOD and LOQ
Assay sensitivity is reflected in both LOD and LOQ. While the LOD is critical to qualitative limit tests such as residual assessment, the LOQ impacts quantitative methods. Both parameters often are linked to technical aspects of the method.
The parameter more applicable to the specific method should be included in ongoing validation. For example, assay controls can be used to monitor LOD or LOQ on a real-time basis. Given that LOQ/LOD may shift slightly with the performance of the assay on any single day, an assay control may be used that contains a peak or response that is right above the threshold of the determined LOQ/LOD during initial validation/MODR. In this manner, this peak/response in the assay control will need to be “detected”/or “quantitated” above a certain limit for the assay run to be acceptable.
In some cases, the actual assay LOD/LOQ may not be needed when aligning assay performance with ATP requirements. For example, the technical limitations of an assay may lie beyond the limits defined in the ATP. In that case, it should be sufficient to demonstrate assay sensitivity per ATP requirements rather than per technical feasibility.
In an AQbD framework, systematic assessment of variability across the MODR including the LOD/LOQ would allow setting method-appropriate ranges around the LOD/LOQ limits aligned with ATP expectations and associated decision risks. Such an assessment would likely require the addition of controls or simulated samples across the evaluated MODR within a DOE framework. The performance of these controls/samples would be monitored and modeled against the ATP requirements. Challenges of this approach include the scale of the associated studies as well as the availability of representative controls or samples early in the development cycle. Ongoing verification data could be used to update early-stage (i.e., at the start of the development of the method) preliminary acceptance limits to further reduce decision risks if needed per ATP.
Challenges occur when bridging to new technologies that may offer greater sensitivity with lower LODs/LOQ. Particularly when measuring newly detectable signals in residual methods, it is necessary to understand their impact. For example, is an additional peak on a chromatogram representative of a previously unknown CQA, or could it represent a safety concern, or is it simply additional information with no link to product quality? The degree of necessary bridging work and additional validation will depend on the nature of the new information. Ideally, representative, banked samples with link to clinical product performance will be tested on both methods to demonstrate that the “new” peak essentially was always present but previously just undetected with prior, less sensitive methods. A downside of this approach is the need to store such samples for extended periods of years and sometimes decades which can place a burden on manufacturing and quality organizations. Potentially, new samples could be generated by side-by-side comparison with established samples, but appropriate risk assessment should then be conducted to evaluate whether new samples are still considered representative. This can be performed in a similar fashion as we traditionally validate new reference standards with former reference standards.
If such a comparison is not feasible, the ATP and risk assessments could inform the risk to the product and the patient. The question at hand is whether the more sensitive method reveals any new risks and their severity as related to the requirements set forth in the ATP. Based on scientific understanding of the impurity, the associated patient risk needs to be assessed as with any other impurity earlier in the development space. If warranted from the risk assessment, a new ATP may need to be established to monitor the impurity even if it was always present but previously not detected.
Range
The method range defines the lower and upper levels of analyte that can be reliably measured. Initial validation could be sufficient to determine the range, while system suitability through well-distributed assay controls can serve to determine the valid range on a daily basis.
If assay controls are used to determine the assay range in real-time as part of ongoing validation, the assay range could potentially be determined in the development space as part of MODR assessment instead of validation. Technically, the MODR should demonstrate fit-for-purpose method performance for all parameters, including range. However, such an assessment may be resource-intensive. As a compromise, MODR assessment could be carried out only at the expected low and high range limits of the method. This could inform a preliminary model that is then matured further by adding ongoing verification data at the target levels through assay controls. While a well-defined MODR is recommended to leverage the AQbD framework, this can be challenging as discussed earlier, for example when facing noise factors or when accommodating evolving product characteristics over the course of method development. However, even without a formal MODR, a thorough exploration of factors that can impact method performance can contribute to a method that consistently meets ATP requirements. It should be emphasized that AQbD tools do not replace prior knowledge from scientific experience and sound scientific method understanding. The tools rather enhance and work in conjunction with so-called “traditional” approaches in leveraging a systematic framework and additional statistical tools. Within this framework, well-designed controls across the assay range can further enhance method understanding and provide real-time, ongoing range assessment.
Robustness and Intermediate Precision
Robustness is reflected by insensitivity of method performance to changes in controllable factors, whereas intermediate precision, or formerly ruggedness, is reflected by insensitivity of method performance to changes in uncontrollable factors, often referred to as noise factors. From a practical perspective, the method should provide similar data for the same samples regardless of the MODR conditions under which the method is performed (robustness) , and the MODR should be unaffected by intermediate precision/noise factors.
In the protein concentration example, it is possible that the assay control chart may start yielding values that are outside of the MODR that was established during the initial deployment of the assay. There may be several potential reasons for such data: (a) The run performance might be truly unacceptable, i.e., outside the ATP limits, and thus, the data should be discarded. Alternatively, values outside of the established MODR could result from new knowledge beyond the conditions tested during MODR development. As methods are deployed, the underlying data base and experience grows which in some cases might warrant adjustment of the MODR. In this case, the run data were outside of the known MODR but not outside of the ATP performance limits. In this case, the MODR may be expanded by taking the additional data into an account provided that the ATP requirements are still satisfied. In the tree analogy for Figure 4, the tree shape (MODR) would adjust based on the data fed from the roots.
Exploration and optimization of the MODR can be used to confirm method robustness at the same time. Essentially, the MODR encompasses the critical robustness ranges so that dedicated robustness experiments should not be needed. Alternatively, robustness assessment may be limited to the ranges listed in the method SOP which represents a sub-set of the MODR. This approach often is easier to confirm and more closely linked to regular method use but it provides less flexibility to adjust if needed.
True ruggedness often is difficult to simulate within the limited scope of validation since the tested noise factors may still be too closely related, for example, different instruments in the same laboratory. Intermediate precision across multiple groups, analysts, or a longer timeframe may be a better reflection of ruggedness factors.
Ideally, the late-stage method development space would start building a control charting database of critical method parameters that could then be expanded during MODR assessment, validation, and ongoing verification. For example, a set of controls could be included at a fixed method setting to accumulate long-term trending data across many factors that can impact noise conditions such as time, analyst, and instrument.
These data can inform models of method variability more adequately than a limited set of validation data alone. In extension, the database and the models can be compared to ongoing verification data to determine the validated state of the method by confirming consistent method performance within limits of the ATP requirements.
As a more visual analogy to the AQbD process, Figure 4 represents a schematic analogy relating the method development and deployment to the growth of a tree. The ATP space is represented by the fenced plot in which a tree representing the method could be planted anywhere. As long as the tree/method is located within the ATP fence, the method can meet requirements. The ATP also specifies the type of fruit (reportable results) that the tree should bear, i.e., the apples in our analogy. Initial method inputs including the QTPP (see Figure 2) and potential technology options are represented by the seeds which result in several germ options. As some germs are more viable than others, the strongest or best-located one might be chosen as the method to move forward. Early on, only limited data sets may be available to generate an early-stage method (small tree) that is not as robust as the final method (fully grown tree). The tree roots represent data that allow the knowledge space and MODR to grow (green above a surface region of the tree). While the NOC is represented by the tree’s stem, the method may diversify as different instruments, labs, environmental conditions, materials, or analysis software are deployed across labs and sites (represented by the branches). A well-developed method (tree) will provide flawless study data (fruits) that can be used to make project decisions. With life cycle management, additional methods (trees) could be grown within the same ATP fence resulting in options for bridging (similar to an orchard).

Schematic analogy of AQbD and the MODR to the growth of a tree. Roots feed method data into the NOC and help shape the tree. Note that the fenced area remains the same size
Traditional or Enhanced Approach?
Method validation has long been exclusively governed by ICH Q2 since the 1990s [17]. With the introduction of QbD through ICH Q8 and Q9 [3, 5], concepts of enhanced method development were transferred from these process-focused guidelines into the analytical space. As ICH Q2 is being revised, ICH Q14 is intended to pull the traditional and enhanced approaches together into an overarching framework for analytical methods [2].
Both approaches intend to ensure method performance to meet the needs for product decisions related to safety, potency, purity, and efficacy, for example, disposition, limits on stability specifications, or lot rejection. Importantly, both approaches are built on sound scientific principles and thorough method understanding. While the enhanced approach extends scientific knowledge through systematic tools and enhanced leveraging of available data, the traditional approach also has a proven track record of achieving quality methods that allow sound decision-making.
The traditional approach relies on stage gates of development, robustness, one-time validation, and control of method conditions within the validated conditions. The enhanced approach places greater emphasis on a life cycle continuum with ideally an ongoing validation throughout method deployment rather than a single point in time validation.
While the two approaches are often contrasted against each other, they are rather a continuum with common scientific, documentation, and regulatory principles. Even when the idealized scenario utilizing all the tools to their fullest extent cannot be realized due to scientific, technical, or resource constraints, there is still great value in the application of AQbD tools to enhance aspects of the traditional approach across the method life cycle.
CHALLENGES
Implementation of an AQbD approach based on a well-defined, comprehensive ATP should be an important part of the QbD process. AQbD supports the development and implementation of methods focusing on the product attributes that must be controlled to assure safety and efficacy. However, several challenges stand in the way of the full realization of the potential of this approach, including cultural, regulatory, strategic, and technical concerns.
The cultural challenges are in some ways the most difficult to solve. Developers can be reluctant to transition to newer technologies and approaches when it is not clear if they will receive an increase in flexibility and the streamlined validation that the strategy promises. This can be especially true if the strategy requires the expenditure of resources at an earlier stage in development. However, the risk-based paradigm of AQbD can offer opportunities to balance the level of investment with the degree of risk while systematic method understanding can reduce unexpected failures.
Regulators may also be reluctant to approve a new approach where the risks have not been captured historically. The current regulatory guidance from different jurisdictions is also conflicting in this space, making it difficult to determine the best path forward. Typically, strict adherence to ICH Q2(R1) is expected with only limited attention given to the implications of ICH Q8, Q9, and Q10. The perceived risks of delays in filing and clinical trials make individual companies reluctant to be the first to try this approach. Lack of an accepted path and case studies from multiple modalities that would provide a blueprint for the industry and regulators to follow is a significant hurdle. Acceptance by regulators of the ATP as an established condition and a path to regulatory flexibility based on integrated and documented enhanced scientific understanding could be a key to harvesting many of AQbD’s advantages and in turn would significantly lower one of the barriers to more widespread adoption of AQbD approaches. While traditional bridging between two approaches may appear to resolve these issues, we do not recommend bridging since there are neither clear patient nor business benefits leading to needless cost increases that ultimately are reflected in the medicine’s price.
The upcoming ICH Q14 may provide some guidance around regulatory flexibility [2]. It will be important for the enhanced approach not to be viewed as an exclusive and/or inherently “better” approach to method development. Sound application of strong scientific expertise will continue to allow the development of robust methods also with the traditional approach. The enhanced approach has the potential to further improve upon the traditional one by systematically integrating sound scientific knowledge and understanding with risk management.
In addition to the concerns raised above, there are still technical challenges that need to be solved, including the development of databases that allow tracking and use of data throughout the product life cycle without extensive resource investment. Initiatives in that direction are ongoing across the industry as evidenced by the 21st Century Lab initiative that is coming of age [45, 46]. The data collected during early product development must be accessible for interpretation by scientists working on the later stages of product development and the commercial phase such that the accumulated experience can be used to continue updating the ATP and MODR. Granularity in the data, allowing one to tie results obtained to lots of raw material, analyst, and facility also should be stored and accessible. Use of statistics to define the MODR will also require the availability of skilled statisticians, and an understanding of how to apply statistics to define the ATP. These risks coupled with the seeming complexity could lead to companies electing to forego the investment in planning and coordination that is required to successfully implement an AQbD approach.
Most of these challenges cannot be resolved by an individual company or agency but require more global cooperation to move forward. We suggest for developers, manufacturers, and regulators to develop common definitions of terms and more detailed strategies for implementation of AQbD.
References
Schweitzer M, Pohl M, Hanna-Brown M, Nethercote P, Borman P, Hansen G, et al. Implications and opportunities of applying QbD principles to analytical measurements. Pharm Technol. 2010;34:52–9.
International Conference for Harmonization. ICH Q14: analytical procedure development and revision of Q2(R1) analytical validation. In: ICH Final Concept Pap [Internet]; 2018. Available from: https://database.ich.org/sites/default/files/Q2R2-Q14_EWG_Concept_Paper.pdf.
International Conference for Harmonization. Quality risk management Q9. In: ICH Harmon. Guidel: Tripart; 2005. p. 1–23.
International Conference for Harmonization. Pharmaceutical quality system (Q10). 2008.
International Conference for Harmonization. Pharmaceutical Development Q8(R2): ICH Harmon Tripart Guidel; 2009. p. 1–24.
Junker B, Zablackis E, Verch T, Schofield T, Douette P. Quality-by-design: as related to analytical concepts, control and qualification. In: Nunnally BK, Turula VE, Sitrin RD, editors. Vaccine Anal Strateg Princ Control [Internet]. Berlin, Heidelberg: Springer Berlin Heidelberg; 2015. p. 479–520. https://doi.org/10.1007/978-3-662-45024-6_12.
Barnett K, McGregor PL, Martin GP, Blond DJ, Weitzel J, Ermer J, et al. Analytical target profile: structure and application throughout the analytical lifecycle. Pharmacopeial Forum. 2016;42.
Jackson P, Borman P, Campa C, Chatfield M, Godfrey M, Hamilton P, Hoyer W, Norelli F, Orr R, Schofield T. Using the analytical target profile to drive the analytical method lifecycle. Anal Chem [Internet]. 2019/02/08. United States. 2019;91:2577–85 Available from: https://pubmed.ncbi.nlm.nih.gov/30624912.
Parr MK, Schmidt AH. Life cycle management of analytical methods. J. Pharm. Biomed. Anal. Elsevier B.V. 2018:506–17.
United States Pharmacopeia. <1220> Analytical procedure Lifecycle - Draft. USP NF [Internet]. 2022; Available from: https://www.uspnf.com/notice-gc-1220-prepost-20210924
Burgess C. Evaluating risk-based specifications for pharmaceuticals: the author discusses the purpose of analysis and testing and the implications for specifications and their underlying statistical distribution. Pharm Technol. 2013.
Burgess C. Using the guard band to determine a risk-based specification: how to calculate and apply a guard band. Pharm Technol. 2014.
Martin GP, Barnett KL, Burgess C, Curry PD, Ermer J, Gratzl GS, et al. Lifecycle management of analytical procedures: method development, procedure performance qualification, and procedure performance verification. Pharmacopeial Forum. 2013.
Voltae Sousa L, Gonçalves R, Menezes JC, Ramos A. Analytical method lifecycle management in pharmaceutical industry: a review. AAPS PharmSciTech [Internet]. 2021;22:128 Available from: 10.1208/s12249-021-01960-9.
Argentine M, Barnett K, Chatfield M, Hewitt E, Jackson P, Karmarkar S, et al. Evaluating progress in analytical quality by design. Pharm Technol. 2017;41:52–9.
International Conference for Harmonization. Final concept paper Q12: technical and regulatory considerations for pharmaceutical product lifecycle management. Int Conf Harmon. 2014.
International Conference for Harmonization. Validation of analytical procedures Q2(R1). Fed Regist. 1997;62(96):27463–7.
International Conference for Harmonization. Technical and regulatory considerations for pharmaceutical product life cycle management. ICH Harmon Tripart Guidel [Internet]. 2019:1–31 Available from: https://database.ich.org/sites/default/files/Q12_Guideline_Step4_2019_1119.pdf.
Ermer J, Aguiar D, Boden A, Ding B, Obeng D, Rose M, et al. Lifecycle management in pharmaceutical analysis: how to establish an efficient and relevant continued performance monitoring program. J Pharm Biomed Anal [Internet]. 2020;181:113051 https://www.sciencedirect.com/science/article/pii/S0731708519319089.
Yarovoi H, Frey T, Bouaraphan S, Retzlaff M, Verch T. Quality by design for a vaccine release immunoassay: a case study. Bioanalysis [Internet]. 2013;5:2531–45. https://doi.org/10.4155/bio.13.198.
Borman P. Distinguishing the analytical method from the analytical procedure to support the USP analytical procedure life cycle paradigm © 2019 The U.S. Pharmacopeial Convention (USP): Pharmacopeial Forum; 2019. p. 45.
Borman P, Campa C, Delpierre G, Hook E, Jackson P, Kelley W, et al. Selection of analytical technology and development of analytical procedures using the analytical target profile. In: Anal Chem [Internet]: American Chemical Society; 2021. https://doi.org/10.1021/acs.analchem.1c03854.
Medicines & Healthcare Products Regulatory Agency (MHRA). Technical review of MHRA analytical quality by Design Project. 2019.
(MHRA) M& HPRA. MHRA response and strategy for the application of analytical quality by design concepts to pharmacopoeial standards for medicinese [Internet]. 2020. Available from: https://www.gov.uk/government/consultations/consultation-on-the-application-of-analytical-quality-by-design-aqbd-principles-to-pharmacopoeial-standards-for-medicines
Barwick VJ, Ellison SLR. The evaluation of measurement uncertainty from method validation studies. Accredit Qual Assur [Internet]. 2000;5:47–53. https://doi.org/10.1007/s007690050010.
Barwick VJ, Ellison SLR, Rafferty MJQ, Gill RS. The evaluation of measurement uncertainty from method validation studies Part 2: measurement uncertainty in chemical analysis. In: De Bièvre P, Günzler H, editors. . Berlin, Heidelberg: Springer Berlin Heidelberg; 2003. p. 187–96. https://doi.org/10.1007/978-3-662-05173-3_34.
Ceriotti F. Deriving proper measurement uncertainty from Internal Quality Control data: an impossible mission? In: Clin. Biochem: Elsevier Inc.; 2018. p. 37–40.
Separovic L, Saviano AM, Lourenço FR. Using measurement uncertainty to assess the fitness for purpose of an HPLC analytical method in the pharmaceutical industry. Measurement. 2018;119:41–5.
Ishikawa K, 石川馨, Asian productivity organization. Guide to quality control. Asian Productivity Organization; 1986.
Tague NR. The quality toolbox: ASQ Quality Press; 2005.
Kovacs E, Ermer J, McGregor PL, Nethercote P, LoBrutto R, Martin GP, et al. Stimuli to the revision process: analytical control strategy. 2016;42.
Montgomery DC. Design and analysis of experiments. 10th ed: Wiley; 2019.
Vander Heyden Y, Nijhuis A, Smeyers-Verbeke J, Vangdeginste BGM, Massart DL. Guidance for robustness/ruggedness tests in method validation. J Pharm Biomed Anal. 2001:723–53.
Plackett RL, Burman JP. The design of optimum multifactorial experiments. Biometrika. JSTOR. 1946;33:305.
Box GEP, Wilson KB. On the experimental attainment of optimum conditions. Source J. R. Stat. Soc. Ser. B. 1951.
Borman PJ, Chatfield MJ, Damjanov I, Jackson P. Method ruggedness studies incorporating a risk based approach: a tutorial. Anal Chim Acta [Internet]; 2011;703:101–113. Available from: https://pubmed.ncbi.nlm.nih.gov/21889624
Peraman R, Bhadraya K, Padmanabha RY. Analytical quality by design: a tool for regulatory flexibility and robust analytics. In: Marini R, editor. Int J Anal Chem [Internet]: Hindawi Publishing Corporation; 2015. p. 868727. https://doi.org/10.1155/2015/868727.
Borman PJ, Schofield TL, Lansky D. Reducing uncertainty of an analytical method through efficient use of replication. Pharm Technol. 2021.
Deidda R, Orlandini S, Hubert P, Hubert C. Risk-based approach for method development in pharmaceutical quality control context: a critical review. J Pharm Biomed Anal. Elsevier. 2018;161:110–21.
Nethercote P, Ermer J. Quality by design for analytical methods: implications for method validation and transfer. Pharm Technol [Internet]. 2012;36:74–9 Available from: https://www.pharmtech.com/view/quality-design-analytical-methods-implications-method-validation-and-transfer.
Nethercote P, Bornman P, Bennett T, Martin G, McGregor P. Pharmaceutical quality by design | QbD for better method validation and transfer | Pharmaceutical Manufacturing [Internet]. In: Pharm. Manuf; 2010. Available from: https://www.pharmamanufacturing.com/articles/2010/060/.
Deming SN. Statistics in the laboratory: control charts, Part 1. Am. Lab. 2016.
Deming SN. Statistics in the laboratory: control charts, Part 2. Am. Lab. 2016.
Deng H, Runger G, Tuv E. System monitoring with real-time contrasts. In: J Qual Technol [Internet], vol. 44: Taylor & Francis; 2012. p. 9–27. https://doi.org/10.1080/00224065.2012.11917878.
Wills S. The 21st century laboratory: information technology and health care. Clin Leadersh Manag Rev. United States. 2000;14:289–91.
Ray CA, Ahene AB. Ligand binding assays in the 21st century laboratory-a call for change. In: AAPS J [Internet], vol. 14: Springer US; 2012. p. 377–9. Available from: https://pubmed.ncbi.nlm.nih.gov/22476913.
Acknowledgements
The authors would like to acknowledge the support of the International Consortium for Innovation and Quality in Pharmaceutical Development (IQ, www.iqconsortium.org) for the work on this topic as well as the review of this manuscript. IQ is a not-for-profit organization of pharmaceutical and biotechnology companies with a mission of advancing science and technology to augment the capability of member companies to develop transformational solutions that benefit patients, regulators, and the broader research and development community. The authors would like to thank the reviewers from the IQ Consortium and the associated companies for their valuable feedback including Mark Argentine, Kimber Barnett, Christof Finkler, John Stults, Lance Smallshaw, Arnick Gervais, Jean Francois Dierick, Christopher Strulson, Alice Newman, Mette Ottoson, and others. All authors are involved in commercial development of pharmaceuticals, biopharmaceuticals, and/or vaccines as indicated in the author affiliations.
Author information
Authors and Affiliations
Contributions
All authors collaboratively contributed to the manuscript through active writing, discussion, reviews, and editing.
Corresponding author
Ethics declarations
Conflict of interest
All authors are employed by commercial companies involved with the development of pharmaceuticals, biologics, or vaccines as stated in the author affiliation.
Additional information
Publisher’s Note
Springer Nature remains neutral with regard to jurisdictional claims in published maps and institutional affiliations.
The authors are listed in alphabetical order except for the corresponding author.
Rights and permissions
Open Access This article is licensed under a Creative Commons Attribution 4.0 International License, which permits use, sharing, adaptation, distribution and reproduction in any medium or format, as long as you give appropriate credit to the original author(s) and the source, provide a link to the Creative Commons licence, and indicate if changes were made. The images or other third party material in this article are included in the article's Creative Commons licence, unless indicated otherwise in a credit line to the material. If material is not included in the article's Creative Commons licence and your intended use is not permitted by statutory regulation or exceeds the permitted use, you will need to obtain permission directly from the copyright holder. To view a copy of this licence, visit http://creativecommons.org/licenses/by/4.0/.
About this article

Cite this article
Verch, T., Campa, C., Chéry, C.C. et al. Analytical Quality by Design, Life Cycle Management, and Method Control. AAPS J 24, 34 (2022). https://doi.org/10.1208/s12248-022-00685-2
Received:
Accepted:
Published:
DOI: https://doi.org/10.1208/s12248-022-00685-2