
Abstract
This work is intended to understand the variation of pressure and flow at the pump inlet of liquid rocket engine. The opening and closure of the valve upstream of the pump features complex phenomenon. The opening and closing of the valve cause pressure and flow variations at the pump inlet which may lead to combustion instabilities in combustion chamber of engine, hydraulic transients in feedlines, and off-design operation of turbo-pumps which are fundamental to the efficient testing and operation of engine. A numerical model to predict the pressure and flow transients across a control valve for different rate of opening in fluid feed systems has been developed using first-order finite difference technique. In case of flow in pipes, the velocity and pressure is governed by momentum and continuity equations. A computer code for the prediction of fluid transients is developed based on method of characteristics for one-dimensional fluid flow in pipelines and compared with test data for validation. The control valve is considered to be in-line with the feed line and modeled based on the valve coefficient vs. percent opening of valve. This model can subsequently be used to predict the effect of opening/closing time of the valve on pressure surges across the control valve and corresponding flow rate in the feedline for different opening of the valve.
Introduction
Characterization of pressure and flow transients is an area of immense interest to researchers in the field of fluid dynamics since flow transients may result in performance degradation due to variation in most critical parameters like flow or pressure. The most popular manifestation of this phenomena is combustion instability in case of liquid propellant engines or bursting of water supply lines around the city due to sudden surges in pressure which can be attributed to valve opening or closure, pump starts/stoppages, and by abnormal condition, such as power failure.
Several numerical methods have been reported in literature for hydraulic hammer effects in fluid lines when a valve is subjected to closure. The algebraic method, proposed by Allievi [1] solved the differential equation for a non-visous flow but the results were found to be inaccurate. The Graphical method, proposed by Löwy [2], and later extended for use by Bergeron [3] and Parmakian [4] assumes quasi-steady friction model. The results from this method were found to be accurate only for first wave-period only. It was in 1950, when Gray [5] proposed an algorithm to solve transient problem using method of characterisitcs. This work was later improved by Streeter and Lai [6]. Many studies have been carried out in the past to solve the transient state problems, but Method of Charateristics is the most widely used method for the solution to such problems.
Streeter [7] derived the equations for the numerical solution of transient liquid flow in a conduit using method of characteristics. He presented some applications to show the general adaptability of equations and boundary conditions. He assumed some closing characteristics of a valve as a function of time and validated the data with his experimental work.
Lohrasbi and Attarnejad [8] presented a study on pressure oscillations in water networks. They developed a mathematical model for the hydraulic circuits and studied the effect of valve opening/closing on pressure oscillations. They modeled various pipe networks and observed the effects of water hammer. They concluded that slow opening/closing of valve results in less pressure surge.
Shani et al. [9] summarized the work of many researchers over the past years towards the solution of transient state problem in fluids. The paper stated the purpose and importance of previous works evolved over time. The paper also presented a mathematical model for transient state problem starting with the assumptions involved in classical transient theory and presented in all the previously formulated mathematical models. The results of numerical model based on method of characteristics was compared with experimental data as published by M.S. Ghidaoui et al. [10] for validation, which was found to be within an average relative error of 1.5% of maximum pressure head.
Berrier, Jr. [11] presented his thesis on dynamics of propellant lines and developed simple code to solve equations of motion using finite difference method to solve for pressure and velocity field within a pipe. Simulations were run for known boundary conditions, results were analyzed and compared with published data. The model was able to predict the flow field for different sets of conditions for complex systems like multi-pipe models, valve closure, cavitation, reservoir and accumulator with sufficient accuracy. The model also took into account the courant condition to consider the stability of solution. This model was also able to verify the discreet vapor model to validate cavitation problems.
Sirvole [12] presented his thesis on transient analysis in pipe networks to study pressure and velocity variation by sudden closure of valve. The maximum pressure heads on comparison with Joukowski’s equation was found to be comparable. Few other simulations were run to analyze gaseous cavitation in pipes by developing a 2D numerical model using MATLAB. The results from the study presents a significant increase in fluid temperature along with high pressures during transients. As a result, some of the fluid gets vaporized and pockets of air are formed in distribution systems.
Most of the previously mentioned works/researches focused on hydraulic transients in a conduit due to valve closure as a function of time only. Very few/limited studies have been done so far to study the perturbations in flow parameters expressed as a function of percentage opening and response time of the valve. The transients encountered in fluid transfer lines due to installed characteristics of the valve represented as a function of percentage opening and time are still a subject to be studied in more detail. The present work highlights the effect of percentage opening, response time and valve characteristics of the valve on flow and pressure fluctuations in transfer lines.
Methods/experimental
This research focuses primarily on the development of a numerical model of a feed line with a single control valve in operation. The control valve is modeled using its installed characteristics followed by its validation with Test data. Water is used as a medium to carry out the analysis owing to its ease of availability, non-toxicity, stability at room temperature, and less susceptibility to cavitation.
The current analysis aims at minimizing the variation in flow-rates and pressure at the upstream of test article to ensure required flow parameters within permissible range of variation. A mathematical model of a feed line is developed and presented in this paper which includes flow components like constant pressure tank, feed line, Control valve, elbows and fittings. This model, upon successful validation, will be used to simulate some predetermined process test conditions like pressure and flow rate at the inlet of turbo-pumps of rocket engine during its testing. Based on the agreement of test results and numerical model, as discussed in this paper, this model shall be used further to model the pressure and flow characteristics during flow transition from one tank to other using simultaneous operation of two valves. It is expected that the change-over of flow from one from one feed circuit to another will cause pressure and flow transients at the engine inlet which are detrimental to the performance of the engine.
Modeling principles and classical assumptions
The analysis is carried out by solving the 1-D equations obtained by applying the conservation of mass and momentum principles to a control volume. The solution involves following steps:
-
1.
Derivation of the partial differentiation equation.
-
2.
Parameters affecting the flow transients in a pipeline.
-
3.
Solving the equation through partial differential equation using “method of characteristics”.
-
4.
Characterization of the boundary conditions.
-
5.
Modeling the feed line circuit with control valve and assigning proper boundary conditions.
-
6.
Analysis of the results derived from above steps.
The existing fundamental theory for the transient flows in pipelines is drawn from classical assumptions: [13, 14]
-
1.
One-dimensional flow, with pipe full of incompressible fluid at all times.
-
2.
Dynamic liquid-pipe interactions are neglected and a quasi-steady interaction [15] between pipe and liquid is assumed and friction factors obtained under steady conditions applied to unsteady flows.
-
3.
Liquid velocity is much less than wave velocity.
-
4.
Rigid feed lines, which is merely an approximation as the feed line has expansion joints and flexible hoses.
Governing equations and numerical solution [16]
Newton second law of motion can be applied to the case of unsteady flow of a compressible fluid to an infinitesimal mass of fluid in an elastic pipe, as illustrated in Fig. 1, to get momentum equation, as follows:

Control volume used to derive continuity and momentum equations [16]
As wall shear stress τ can be written as \( \boldsymbol{\tau} =\frac{\boldsymbol{\rho} \boldsymbol{fV}\left|\boldsymbol{V}\right|}{\mathbf{8}} \) ,
Thus, Eq. (1) can be re-written as:
Considering conservation of mass, the continuity equation can be obtained from the flow element and can be written as:
The method of characteristics proceeds by making a linear combination of Eqs. (2) and (3) using a Lagrangian multiplier λ which, by appropriate substitution, results in two characteristic equations [17]
C+ equation:
Equation (4) is applicable if \( \frac{dx}{dt} \) = v + a
C− equation:
Equation (5) is applicable if \( \frac{dx}{dt}=\mathrm{v}-\mathrm{a} \)
The above equation forms the basis for the finite difference approach to compute the numerical solution of the transient characteristics in feed lines of fluids.
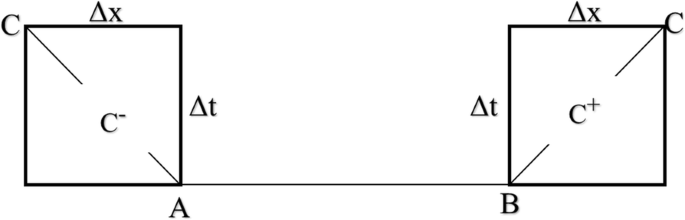
\( \frac{\boldsymbol{dx}}{\boldsymbol{dt}} \) = v ± a represents a pair of straight lines between t and x on which C+ and C− equations are valid, as shown in given Fig. 2.

Representation of characteristics lines
Equations (4) and (5) are non-linear coupled equation in flow velocity and pressure; therefore, first order first-order finite difference method is used to solve the system of equations and compute the numerical solution.
A pipe of length L is discretized into N number of elements, giving N + 1 number of nodes. For every time step Δt, the pressure and flow velocity is computed at each node. The time step is determined by the pipe length and the wave speed according to Δt = Δx/a.
The MOC requires viscous flow in pipes to satisfy the Courant condition in Eq. 6. The Courant number (Co), is defined as the ratio of the actual wave speed and the numerical wave speed (Δx/Δt).
Based on the analytical studies and procedures proposed by O’brien [18] and considering linearized equation, Perkins [19] has proved that for the process to be stable, the time step Δt should be calculated such that the Courant number should be less than or equal to 1 for better stability and faster convergence of the model. This shows that characteristics through the point C, as shown in Fig. 2 shall not fall outside segment AB [20].
The C+, hereafter mentioned as CP is valid upstream, i.e., when using information from the previous node in the previous time step, represented by the characteristic line with positive slope in Fig. 2. The C−, hereafter mentioned as CM is valid downstream, i.e., when using information from the next node in the previous time step, represented by the characteristic line with negative slope in Fig. 2. Integration of equations followed by first order approximation, results in following equations.
Rewriting above equations in terms of flow rate Q and solving Eqs. (7) and (9) for QC and PC,
where
Solution to Eqs. (11) and (12) gives
Equation (18) can be substituted in Eqs. (11) or (12) to get pressure Pc at that node.
Flowchart for computation of solution [11]
This section describes the steps involved in calculating the Pressure and flow rate for the pipeline transient problem. Corresponding steps involved in modeling process in the form of flowchart, as illustrated in Fig. 3.

Flowchart to solve transient problem
Boundary conditions [20]
The finite difference equations, as defined in above equations, are applicable when the end boundary equations remain same, which is usually the case with steady-state flows. As soon as the boundary conditions start varying, it start influencing the interior points in the subsequent time step. Thus, in order to compute the pressure and flow at every time step, proper boundary conditions become necessary to be defined.
At the inlet and outlet of pipe, only one equation is available at either end. Thus, with respect to the previous time step, Eq. (13) is used to compute positive characteristic line at the upstream end of pipe while Eq. (14) can be used to get negative characteristic equation on the downstream side of the pipe, as shown in Fig. 4. With known pressure or flow conditions at the inlet or outlet of pipe, Eqs. (11) and (12) are used to calculate the other flow parameters on either end.
Characteristic lines at the pipe ends
The simplest boundary conditions are specified values of the relevant variables, the pressure or flow in this case. At the inlet,
Pc = Preservoir = constant.
Thus, using Eq. (14), negative characteristic equation is derived.
With pressure known at the inlet, Eq. (12) is used to compute flow at inlet.
Similarly, Eqs. (11) and (13) can be used to derive pressure/flow boundary condition at the outlet, provided either of one property out of flow or pressure is known.
It is to be noted that Eq. (18) and its associated equations are valid for interior points of the solution space, 2 ≤ i ≤ N.
Boundary conditions, valid for all values of t ≥ 0, must be imposed on the two points at either end. Initial conditions must be specified at t = 0.
Modeling of control valve [11]
The process of valve modeling defined in the present and subsequent sections is just a variation of the work by Berrier, Jr. [11] wherein the valve characteristics are defined as a function of valve response time and percentage lift of the valve. Berrier, Jr. [11] in his work presented valve pressure-discharge characteristic which follows exponential law and it is a function of time only and not a function of percentage lift of the valve. Moreover, the present work considers installed characteristics of the valve for analysis which evaluates flow and pressure transients across the valve based on variation of flow coefficient with percentage lift which is again a function of time.
Any flow component like a valve-in-line, as shown in Fig. 5, can be considered to be composed of two pipes connected by a valve. In this case, Eqs. (11) and (12) are valid for inlet and outlet of two pipes. Additional variables at valve inlet calls for additional auxiliary equations to obtain the complete solution. The continuity equation provides one such equation
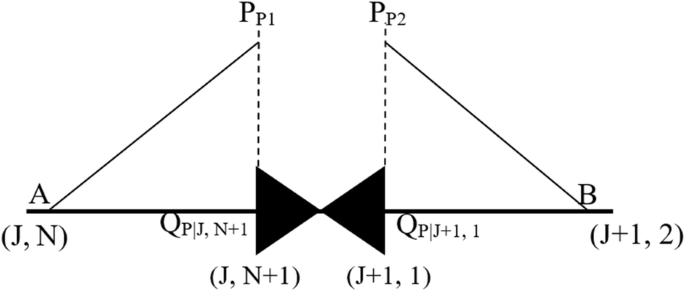
Modeling of valve in-line with pipe
while the fourth equation is deduced from the valve characteristic curve representing its flow coefficient vs. % lift of the valve.
Writing Eqs. (11) and (12) across the valve at nodes (J,N + 1) and (J + 1,1),
where
When the valve is discharging into the downstream of the valve at some pressure, then for steady-state conditions at fully open condition, the flow rate through the valve can be written as:
The flow rate and pressure drop across the valve during the transient state conditions can be written as
Dividing Eqs. (24) by (25), we get
Rearranging the terms in Eq. (26),
Taking square on both sides and writing CV as a function of CVN
where,
Rewriting,
The solution of above quadratic equation is based on the direction of flow which is decided by the value of \( \frac{C_P}{B_1}-\frac{C_M}{B_2} \) if it is greater or less than 0.
Making substitutions and solving above equation for QP|J,N + 1, gives
Above equation is applicable for positive flow where Eq. (26) is applicable and \( \frac{{\boldsymbol{C}}_{\boldsymbol{P}}}{{\boldsymbol{B}}_{\mathbf{1}}}-\frac{{\boldsymbol{C}}_{\boldsymbol{M}}}{{\boldsymbol{B}}_{\mathbf{2}}} \) >0
For negative flow, Eq. (27) can be written as
In this case, Eq. (27) can be written as
With QP|J,N + 1 known, it can be substituted in continuity Eqs. (19), (20), (21) to compute QP|J + 1,1, PP1 and PP2.
System analysis
In this section, the equations developed in the above sections by the method of characteristics followed by the application of relevant boundary conditions are used to model flow components like control valve in a feed line. Pressure and flow parameters are calculated at each time step along the feed line. The results of the mathematical model are subsequently verified with the experimental data.
Valve characteristics
The system used for the analysis is shown in Fig. 8. For current investigation, water is used as a working fluid. In the given system, a control valve has been introduced in the feed line for the calibration of flow component FLC (see Fig. 8). The system consists of a constant pressure reservoir at 26 bar. Flow components like flow-meter, pressure transmitters, electro-pneumatic valve and control valve are installed in the feed line, in addition to the Control valve IVC-101. The flow component FLC has been kept at a constant opening of 24%, which acts as a source of high pressure drop at this opening. The outlet of the feed circuit is connected to the collection tank kept at a constant pressure of 1.6 bar. Based on the inlet and outlet boundary conditions, the technical specifications of control valve IVC-104 are given in Table 1. Further, the installed characteristics of the IVC-104 are given in Table 2 and Fig. 6.

Installed characteristic curve for IVC-104
Figure 6 shows the variation of flow coefficient of the valve with percentage opening. These are the installed characteristics of the valve specific to the system with maximum inlet pressure of 30 bar. The maximum theoretical Cv* corresponds to CVN*=38. The valve pressure-discharge coefficient,
is defined by above equation. The use of coefficient as a fraction makes the system independent of the units of Cv*.
Mathematical modeling and numerical analysis
The pipeline is modeled as consisting of two pipes of equal diameter in series, where both the upstream and downstream ends of the system are connected to constant pressure reservoirs. The pressure drop across the system caused due to various flow components is taken into account by modeling the feed line of appropriate length upstream and downstream of the valve.
A line of suitable length is considered to account for the same pressure drop under steady-state conditions during the modeling in order to reduce the computational power for the numerical simulation involving the modeling of all flow components. Under steady-state conditions during the full opening of the valve, the equivalent length of pipe upstream and downstream of the valve was evaluated to be around 320 m and 20 m respectively for a friction factor of approx. 0.015.
The solution starts begins with steady flow until t = 0.1 s, when the control valve begins to close in steps. The pressure wave velocity a is calculated as
where
Initialization of parameters and boundary conditions
Fluid medium: Water
Diameter of pipe: 2.5” 10S, or 0.0669 m
Inlet pressure: 26 bar
Outlet pressure: ambient 1.6 bar
Length of feed line from ITK-01 to valve: 320 m
Length of feed line from valve to ITK-02: 20 m
Number of nodes considered in feed line: 122 (120 on feed line + 2 on valve inlet and outlet)
Duration of analysis: 13 s
Steady-state flow rate Q o (lit/s): 11.75 L/s
Time step (s): 3.62e−04 (based on Courant condition)
Methodology for numerical analysis
During steady flow, the flow across the system is evaluated. Also, the pressure drop ∆Po across the valve IVC-104 is calculated and substituted in Eq. (29) to evaluate CVN for the given system.
Starting with the upstream end of the pipeline, a constant pressure reservoir is modeled, allowing the volumetric flow rate to be calculated by Eq. (12). Moving downstream, the next boundary condition encountered was the Control valve IVC-104. In this case, the flow rate is calculated in accordance with Eq. (31), where the valve pressure-discharge characteristic is defined by Eq. (31) and Table 2. The pressure on the upstream and downstream of the valve can then be calculated from Eqs. (11) and (12).
The control valve IVC-104 is initially closed until t = 0.1 s, correspondingly, τ is equal to 0. The valve begins to open at t = 0.1 sec when the % opening increases to 10% in 0.25 s and maintains this position for 1 s. The interval of 1 s is chosen between two successive openings so that there is sufficient time for the flow to get stabilized and there is no noticeable fluctuations in pressure and flow during experimental trials. If this time interval is too less, then the flow may not get stabilized before opening the valve further. If this time interval is too high, then more computational power is required to run the simulation. Moreover, the average of stabilized flow and pressure data during experimental trails is taken for calculation of valve flow-coefficient Cv*. After t = 1.35 s, the valve opens to 20% in 0.25 s and maintains its position for 1 s. This continues till the valve is completely opened, as shown in Fig. 7. At each time step, the value of τ is evaluated and used to evaluate the required value of Cv, in accordance with Eq. 28. This value of Cv is then substituted in Eq. (31). The final boundary condition occurs at the pipe outlet which is pressure reservoir at 1.6 bar. The flow condition here is evaluated by substituting the pressure in Eq. (11).

Variation of percent opening of IVC-104 vs. time
Results and discussion
The results of numerical analysis performed for a particular case of opening a control valve with a given set of boundary conditions are compared with that of experimental data, as obtained from Cold flow Test Facility, IPRC. The numerical analysis is done for the following experimental setup:
Experimental setup
The numerical model is based on the experimental setup, as shown in Fig. 8, which consists of two run tanks, mainly DM water run tank, ITK-01 maintained at a constant pressure of 2.6 MPa and DM water collection Tank ITK-02, at ambient pressure. Flow meter FFQ-101 is connected in-line in closed loop with IVC-103. All other flow components including IVP-103 and IVC-103 are kept at full-open condition. The flow component being modeled is IVC-104. IVC-104 is opened in steps as shown in Fig. 7. The complete setup is a part of calibration of flow component FLC (classified) at different opening. One such experimental data at an opening of 24% is considered for the numerical validation of our model, which is also a source of high pressure drop in the feed line. Pressure transducers/transmitters are installed at various points along the feed line to understand the variation of pressure during the opening of IVC-104 and simultaneous comparison with numerical data.

Experimental setup for model validation
Model validation
The results of the numerical simulations are compared with the measured data during the calibration of the flow component FLC, when the valve IVC-104 is opened from 0 to 100% in steps. As the initial boundary conditions of the experimental setup are known, they are used as an input for the validation of numerical analysis. The sampling rate of the data acquisition system is 500 ms, while that of the numerical model is 3.6e−04 s. The sequence of opening of valve IVC-104 is given in Fig. 7.
Figure 9 shows the comparison of the numerical data (blue) with the experimental data (red) for a given set of boundary conditions across the control valve IVC-104 in the feed line.

Comparison of numercal and experimental results. a: Comparison of flow rate vs. time. b: Comparison of flow vs. valve opening. c: Comparison of inlet pressure of IVC-04. d: Comparison of outlet pressure of IVC-104. e: Comparison of pressure drop across IVC-104
-
1.
As the valves is fully closed till t = 0.1 s, the flow-rate (Fig. 9.a, 9.b) is monitored to be 0. As the valve begins to open at t = 0.1 s, the flow-rate across the flow-meter FFQ-101 and hence, the control valve IVC-101, gradually increases with time, as shown in Fig. 9a. The flow-rate begins to stabilize after 0.35 s till t = 1.35 sec when again flow begins to increase till t = 1.6 s when the valve opens from 10 to 20%. It can be seen from Fig. 9.a that the model is able to accurately capture the variation in flow rate for different opening of Control valve in the feed line. Although the model is unable to predict the flow-rate initially to sufficient accuracy, the numerical results match closely with experimental results after 10% opening.
-
2.
The flow across any valve is a function of valve coefficient Cv* and increases with increase in Cv*. The variation of Cv* as a function of percentage opening is shown in Fig. 6. As control valve continues to open as described in Fig. 7, the flow-rate continues to increase in-line with increase in Cv* (or percentage opening), as shown in Fig. 9.b.
-
3.
In closed position of valve IVC-104 till t = 0.1 s, the pressure at the inlet of IVC-104 is same as tank pressure ITK-101, as shown in Fig. 9.c. As the valve begins to open at t = 0.1 s, there is a lot of fluctuations initially in pressure. Since, the flow increases with increase in valve opening, the inlet pressure to the control valve IVC-104 decreases due to the pressure drop in the system.
-
4.
The pressure of the collection tank ITK-102 is constant and is equal to 1.6 bar. As the flow-rate increases with valve opening and in order to maintain constant pressure at the inlet of tank, the pressure at the outlet of IVC-104 continues to increase, as shown in Fig. 9.d. The magnitude of the fluctuations also matches appropriately as can be seen from the plot.
-
5.
As the valve continues to open as depicted in Figs. 6 and 7, the inlet pressure continues to decrease as shown in Fig. 9.c. Also, the valve coefficient Cv* is inversely proportional to pressure drop across the valve therefore the pressure drop across across the valve continues to decrease. This is very clearly evident from the plot given in Fig. 9.e.
-
6.
It may be noted that the pressure and flow transients in Fig. 9 do not exactly match each other during initial transients. There is a pressure and flow variation during the initial opening of control valve as observed in the numerical model, when compared to experimental data. This is the result of a sudden change in velocity, and hence inertia from 0 to a finite value, causing a temporary separation of liquid column at the valve. Moreover, larger pressure gradient during the initial opening of the valve cause a variation of pressure and flow.
Conclusions
A numerical model is developed to analyze fluid transients in order to predict the variation of pressure and flow in the feed line for different opening of control valve. The derivation of the equations of motion used in the numerical analysis are based on method of characteristics. The model is used to determine the effect of valve opening in steps on pressure and flow transients. The present work defines a more realistic approach where change in flow pattern by virtue of valve plug design is incorporated in the mathematical model. The model use actual flow coefficient vs. percent opening characteristics for the control valve as an input. Numerical predictions of model is validated against experimental data. There is a close agreement of the numerical and experimental data. The predictions of flow and pressure matched very closely, when compared point by point. The numerical results also predicts the variation of pressure and flow for the valve opening values less than 10% when the controllability in case of control valves is quite less. The model can be subsequently used to analyze some real-time situations which involve propellants like liquid oxygen and kerosene at higher flow rates and pressure. The effects of opening time of control valve on the downstream transients are studied. These studies are important for maintaining the actual inlet conditions of engine under special conditions, when the flow from one propellant feed line has to be switched over to the other switched feed line in order to ensure flow-rate and pressure conditions within permissible limits.
Availability of data and materials
The datasets (experimental as well as numerical results) used and/or analyzed during the current study are available from the corresponding author on reasonable request.
Abbreviations
- MoC:
-
Method of characteristics
- Co:
-
Courant number
- C VN :
-
\( \frac{{\boldsymbol{Q}}_{\boldsymbol{o}}^{\mathbf{2}}}{2\mathbf{\Delta }{\mathbf{P}}_o} \) (known constant in valve equation at 100% valve opening, based on steady state value)
- C v :
-
Theoritically derived valve coefficient for a given valve opening
- C VN * :
-
\( \frac{{\boldsymbol{Q}}_{\boldsymbol{o}}}{\surd \mathbf{\Delta }{\mathbf{P}}_o} \) (Max. flow coefficient of the valve at 100 % opening); in this case, CVN* = 38
- Cv* :
-
Experimentally derived valve coefficient for a given valve opening
- ρ :
-
Density of fluid
- A :
-
Cross-sectional area of fluid element (control volume)
- dx :
-
length of fluid element (control volume)
- dt :
-
Time step
- z :
-
Elevation of fluid element from datum
- v:
-
Velocity of flow in control volume of pipe
- Q:
-
Flow rate through control volume of pipe
- D:
-
Diameter of pipe
- g :
-
Acceleration due to gravity
- a :
-
Wave velocity
- K:
-
Bulk modulus of fluid
- E:
-
Young’s modulus of feedline
- f:
-
Coefficient of friction
- B, FF :
-
Pipeline constants
- N :
-
Number of nodes in a pipe
- J :
-
Counter to indicate the pipe
- τ:
-
Dimensionless valve pressure-discharge characteristic
- Q o :
-
Steady-state flow rate through the fully open valve
- ∆P o :
-
Pressure difference across the valve in steady-state conditions at full opening
- O :
-
Steady-state condition
References
Allievi L (1902) Teoria generale del moto perturbato dell’acqua nei tubi in pressione (colpo d’ariete). (“General theory of the variable motion of water in pressure conduits”). Annali della Società degli Ingegneri ed Architetti Italiani 17(5):285–325
Löwy R (1928) Druckschwankungen in Druckrohrleitungen. Mit 45 Abb. Cham: Springer
Bergeron L (1932) Variations in flow in water conduits. Soc Hydrotechnique de France 47:605
Parmakian J (1955) Waterhammer analysis. prenticehall, linc., Englewood Cliffs
Gray CAM (1953) The analysis of the dissipation of energy in water hammer. In: Proc. ASCE, vol 119, pp 1176–1194
Streeter VL, Lai C (1962) Water-hammer analysis including fluid friction. J Hydraulics Div 88(3):79–112
Streeter VL (1962) Water hammer analysis with nonlinear frictional resistance, Proeedings of 1st Australasian Conf. on Hydraulics and Fluid Mechanics, vol 1963. Pergamon Press, Oxford, p 431. https://doi.org/10.1016/B978-0-08-010291-7.50032-X
Lohrasbi AR, Attarnejad R (2008) Water hammer analysis by characteristic method. Am J Eng Appl Sci. 1(4):287–94.
Tushar S, Tinish G, Nitish (2017) Hydraulic transient flow analysis using method of characteristics. Int J Innov Res Sci Eng Technol 6(7):14813–14827
Ghidaoui MS, Mansour S (2002) Efficient treatment of the vardy–brown unsteady shear in pipe transients. J Hydraulic Eng 128(1):102–112
Berrier WF Jr (1987) First Lieutenant, USAF, “Dynamics of Propellant Feedline Systems”, Rept. AFIT/GA/AA/85D-2
Sirvole K (2007) Transient analysis in pipe networks, Master of Science Dissertation, Department of Civil Engineering, Virginia Polytechnic Institute & State University
Chaudhry MH (1979) Applied hydraulic transients. Springer-Verlag, New York
Wylie EB, Streeter VL (1978) Fluid transients, vol 401. McGraw-HillInternational Book Co., 1978, New York, p 1
Pezzinga G (1999) Quasi-2d model for unsteady flow in pipe networks. J Hydraulic Eng 125(7):676–685
Rick Sellens, Water hammer: differential equations”, URL: http://www.aq.upm.es/Departamentos/Fisica/agmartin/webpublico/docencia/amplifis/fluidos-queens/hammer3.htm
Std 1207-2004 (2004) IEEE Guide for the Application of Turbine Governing Systems for Hydroelectric Generating Units. IEEE, New York
O’Brien GG, Hyman MA, Kaplan S (1951) A study of the numerical solution of partial differential equation. J Math Physics 29:223–251
Perkins FE, Tedrow AC, Eagleson P.S, Ippen AT (1964) Hydro-Power Plant Transients, Part II; Report No. 71. Cambridge: Department of Civil Engineering, School of Engineering, Massachusetts Institute of Technology.
Chaudhry, M Hanif, “Boundary Conditions for analysis of Water Hammer in Pipe Systems”, Master of Applied Science Dissertation, Department of Civil Engineering, The University of British Columbia, 1968.
Acknowledgements
I wish to express my deep sense of gratitude and profound thanks to my supervisors Mr. Rahul Chaurasia, Mr. Ashish Shukla, Mr. Venkateswaran K.S., and Dr. Ramesh T. from ISRO Propulsion Complex for their interest, guidance, and providing me with all the necessary resources to successfully conduct the experiment. I am also thankful to Mr. Sanu Meena, Asst. Professor, M.B.M. Engineering College,Jodhpur for providing his valuable inputs for successfully writing this paper.
Funding
It is declared that all the equipment and resources were provided by ISRO Propulsion Complex.
Author information
Authors and Affiliations
Contributions
VKS conceived of this study. NS carried out the experimental trials, numerical simulation, and data analysis under the guidance and supervision of VKS and TR. The author(s) read and approved the final manuscript.
Corresponding author
Ethics declarations
Competing interests
The authors declare the following financial interests/personal relationships which may be considered as potential competing interests:
-
i.
That equipment and writing assistance were provided by ISRO Propulsion Complex.
-
ii.
That authors/co-authors have a relationship with ISRO Propulsion Complex that includes employment.
Additional information
Publisher’s Note
Springer Nature remains neutral with regard to jurisdictional claims in published maps and institutional affiliations.
Rights and permissions
Open Access This article is licensed under a Creative Commons Attribution 4.0 International License, which permits use, sharing, adaptation, distribution and reproduction in any medium or format, as long as you give appropriate credit to the original author(s) and the source, provide a link to the Creative Commons licence, and indicate if changes were made. The images or other third party material in this article are included in the article's Creative Commons licence, unless indicated otherwise in a credit line to the material. If material is not included in the article's Creative Commons licence and your intended use is not permitted by statutory regulation or exceeds the permitted use, you will need to obtain permission directly from the copyright holder. To view a copy of this licence, visit http://creativecommons.org/licenses/by/4.0/. The Creative Commons Public Domain Dedication waiver (http://creativecommons.org/publicdomain/zero/1.0/) applies to the data made available in this article, unless otherwise stated in a credit line to the data.
About this article

Cite this article
Suri, N., K. S., V. & T., R. Numerical validation of pressure and flow characteristics across a control valve in a feed line. J. Eng. Appl. Sci. 68, 49 (2021). https://doi.org/10.1186/s44147-021-00033-9
Received:
Accepted:
Published:
DOI: https://doi.org/10.1186/s44147-021-00033-9