
Abstract
Background
Point of care ultrasonography (POCUS) is a real time examination that can be used in the emergency room and intensive care unit (ICU). It can provide low-cost modality in short period of time that can help the clinician in better management the ICU patients. The aim of the current work was to evaluate the impact of POCUS (focused heart, lung, IVC and Doppler lower limb) in improving the outcome of deteriorating patients in the respiratory intensive care unit (RICU), via narrowing differential diagnosis and earlier start of target therapy.
Methods
This prospective study included 126 deteriorated patients in the RICU. The POCUS was performed to all included patients, together with the indicated laboratory and radiological investigations (Chest x-ray, computerized tomography, and conventional echocardiography) to detect the agreement between POCUS and the gold standard techniques to assess the POCUS effectiveness. The impact of applying POCUS on the outcome of the studied patients was evaluated regarding ICU and in hospital length of stay and the 30-day mortality.
Results
The included patients were 51 males (40.5%) and 75 females (59.5%) with a mean ±SD of age 45.4 ± 15.7 years. POCUS showed a good agreement with the gold standard techniques. There was significant improvement in outcome of the studied patients as regard ICU and in hospital stay with early using of POCUS examination but no significant difference in 30 days mortality rate of the studied patients.
Conclusion
POCUS is an effective modality in the management of deteriorating patients in the RICU with a good impact on the patient outcome.
Introduction
Rapid and accurate diagnosis for proper treatment is mandatory for intensive care admitted patients. Various methods of diagnostic imaging were developed, but each has some limitations like low sensitivity, lack of availability, high cost or increased radiation exposure. Bedside chest X-ray (CXR) is frequently used for many diagnostic applications in the Intensive Care Unit (ICU). However, this imaging technique has important methodological limitations and often shows low accuracy. Computed tomography (CT) scans remain the gold standard imaging technique for thoracic evaluation, but transportation of patients outside the ICU is difficult and potentially harmful [1].
Point of care ultrasonography (POCUS) is advanced diagnostic ultrasonography that is performed and interpreted by the attending
physician as a bedside test [2]. POCUS has been widely used as a rapid diagnostic tool, especially in emergency medicine, to aid the diagnosis of multiple medical conditions ranging from acute appendicitis, airway compromise, abdominal aortic aneurysm and traumatic injury assessment [3].
There is increasing evidence supporting lung ultrasound, emergency echocardiography, and IVC assessment using ultrasound as a diagnostic tool in different specialty and clinical settings. Due to the need for prompt diagnosis in the ED, focused multifaceted ultrasound as a point of care tool is increasingly researched and incorporated by Emergency physicians. However, most of these studies have focused on identifying cardiovascular causes of acute dyspnea [4, 5]. This work aimed to evaluate the impact of POCUS (focused heart, lung, IVC and Doppler lower limb) in improving the outcome of deteriorating patients in RICU via narrowing differential diagnosis and start target therapy early.
Patients and methods
Study design and settings
This prospective study was conducted in the Chest Department ICU of Zagazig University Hospitals between May 2020 and May 2022 after approval of Institutional Review Board-Zagazig University (IRB-ZU) (#6142/31-5/2020), and after taking patient consent when it was applicable.
Selection of patients
Inclusion criteria
ICU admitted patients who developed deterioration in their clinical conditions as evidenced by:
-
A.
Deterioration in physiological parameters like HR, RR, blood pressure, temperature, oxygen saturation, conscious level, and urine output
-
B.
Laboratory deterioration as (CBC, ESR, CRP, cardiac enzymes).
-
C.
Radiological deterioration (increased the shadow or appearance of new shadows).
Exclusion criteria
-
1.
Patients who deteriorated due to non-cardio-respiratory cause.
-
2.
Morbid obese patients.
Sample size
All patients admitted to the ICU with clinical deterioration according to general and local examination, investigation, imaging deterioration were included if they met the inclusion criteria during the study’s recruitment period. A total of 126 patients were enrolled.
Study Protocol
The following was done for all patients:
-
1.
Full medical history
-
2.
Clinical examination including:
-
a)
General examination (HR, RR, blood pressure, temperature, oxygen saturation, conscious level, and urine output) [6].
-
b)
Local chest examination.
-
a)
-
3.
Plain chest and heart x-ray (postero-anterior and lateral views).
-
4.
Arterial blood gases analysis (ABGs).
-
5.
Routine Lab investigations such as:(CBC, LFT, KFT, ESR, CRP, PCT, FBS and other investigation according to the case (Coagulation profile, D-dimer &Cardiac enzymes).
-
6.
Electrocardiography (ECG) and Echocardiography (ECHO) was done to all cases (Vivid E9.GE Healthcare).
-
7.
CT chest when indicated (HRCT was done to 18 cases, CT with contrast was done to 8 cases and CT pulmonary angiography was done to 34 cases).
Any patient who developed deterioration according to physiological parameters (HR, RR, blood pressure, temperature, oxygen saturation, conscious level, and urine output), the following were done as indicated [7]:
-
1)
POCUS ((Sonoscape medical Corp, model: SSI-4000).
-
2)
Blood sample for routine and as indicated other laboratory investigations.
-
3)
Radiology (plain chest x-ray and CT).
-
4)
Echocardiography (standard echocardiography).
The point of care ultrasound protocol
Lung ultrasound
-
A)
Pleural sliding was evaluated on 2D and M-mode at the anterior lung fields, starting at the apex of both lungs. A high frequency linear probe was used. Pneumothorax was identified by the absence of lung sliding and horizontal A-lines, that resembled the stratosphere (the barcode sign) on M-mode [8].
-
B)
We determined whether there was primarily an A-line or B-line pattern using the bilateral anterior lung windows and sides of the chest wall (B lines suggesting abnormal pulmonary fluid).
-
C)
Patients with acute cardiogenic pulmonary edema will show "B-lines" on a POCUS scan. There may be interstitial pulmonary fluid present if there are more than three B-lines per rib space [9].
-
D)
Pleural effusions and consolidation were checked for on the lateral-posterior chest imaging [10] (Figs. 1 and 2).

An area of consolidation by lung ultrasound (defined by an area of hypoechoic hepatized tissue) (shred) sign

Encysted pleural fluid with marked septation
Echocardiography
A standard parasternal long axis (PLAX) view and parasternal short axis (PSAX), subxiphoid (SX), and/or apical four-chamber views (A4C) were obtained as needed. We assessed:
-
1)
Left ventricular ejection fraction (EF), classified as either normal, reduced, or hyperdynamic, measured by visual estimation; (Fig. 3)
Fig. 3 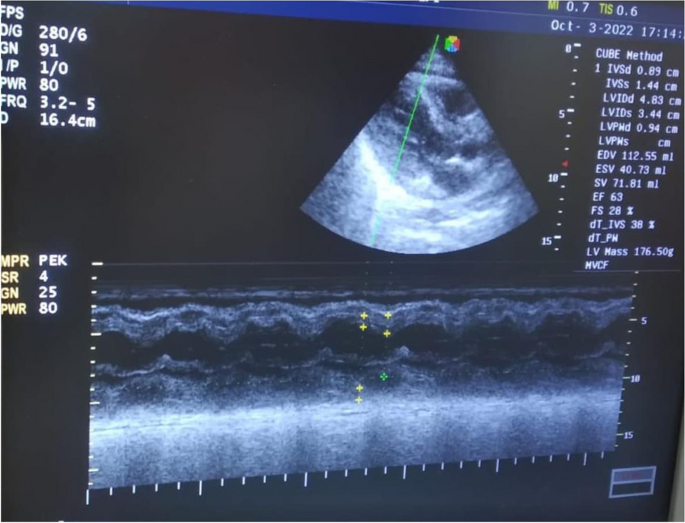
M mode showing the Left ventricular function including (EF Ejection fraction and FS Fractional shortening mainly) in the studied patients
*Left ventricular ejection fraction (LVEF) [11]:
Severely impaired LVEF = ≤35%
Impaired LVEF= 36-49%
Borderline Low LVEF= 50-54%
Normal LVEF= ˃55%
-
2)
Assessment of pericardial effusion:
Pericardial effusion was assessed in studied patients and signs of cardiac tamponade, was preferred to be assessed in sub costal view because free pericardial effusion was dependent on gravity and dominant in the inferior aspect (Fig. 4).
Fig. 4 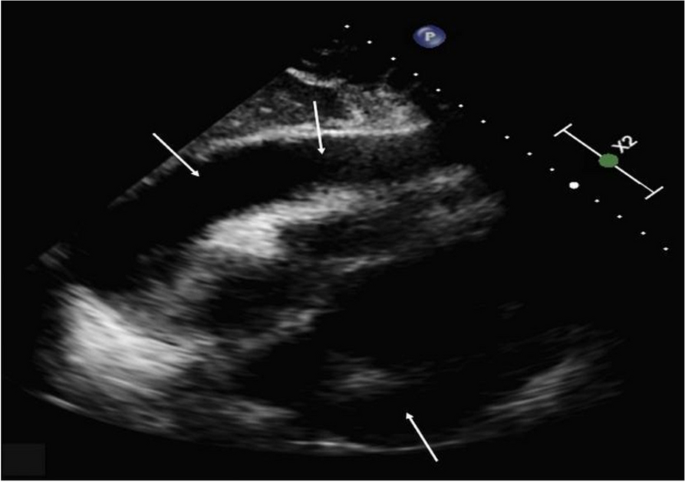
Subcostal view showing large pericardial effusion in the studied patient
-
3)
Assessment of Right side of the heart:
-
A)
Right ventricular enlargement was assessed to exclude acute pulmonary embolism signs (right ventricle size equal to or bigger than left ventricle size) [12, 13].
-
B)
Assessment of acute RV dysfunction (e.g. pulmonary embolism) [14]:
-
C)
On the parasternal short axis view (PSAX), we evaluated the RV size and presence of D-sign. The D-sign was seen as the interventricular septum flattening, as the LV was D shaped rather than a circle.
-
D)
McConnell’s sign was seen as RV mid free wall hypokinesis with preserved of RV apex movement.
-
E)
‘60/60’ sign: the combination of pulmonary ejection acceleration time (measured in the RV outflow tract) <60 ms with a peak systolic tricuspid valve gradient <60 mmHg.
-
F)
Decreased tricuspid annular plane systolic excursion (TAPSE) may also be present in PE patient.
-
A)


Inferior Vena Cava (IVC)
We obtained either a subxyphoid view rotate the probe 90°, probe marker pointed to patient head as IVC enter the right atrium, for the IVC approximately 2cm proximal to the hepatic vein confluence and assessed for IVC collapse during inspiration. The IVC was either plethoric (less than 15% collapse), flat (>90% collapse), or normal (15%-90% collapse), using gross visual estimation [15].
The IVC collapsibility index is calculated by the following formula: The IVC collapsibility index = [maximum diameter on expiration- (minimum diameter on inspiration/maximum diameter on expiration)].
The IVC distensibility index is calculated using the formula: [(maximum diameter on inspiration - minimum diameter on expiration) / minimum diameter on expiration].
Duplex ultrasound for the lower limb
Extended compression ultrasound (ECUS), which consists of a limited examination with compression from the thigh to the knee utilizing a three-point protocol, was used [16].
Statistical methods
For continuous variables, this study evaluated the means, standard deviations (SD), median, and interquartile range (IQR). The proportions for categorical variables were estimated in this study. The t-test was used to compare the means of the two groups, and the Mann Whitney U test was applied to non-parametric data. The chi square test was used to compare the proportions. We determined the ideal lung ultrasonography score cut-off for patient mortality using receiver operator characteristic (ROC) curves. This study calculated the sensitivity, specificity, positive predictive value (PPV), and negative predictive value (NPV) for the prediction of mortality after determining the ideal cut-off.
Results
This study included 126 adult patients 51 males (40.5%) and 75 females (59.5%) with a mean ±SD of age 45.4 ± 15.7 years. mean ±SD of BMI 24.4 (4.7) kg/m2. About 61.1% of studied patients were non-smokers, 33.3% were smokers and 5.6% were ex-smokers (Table 1).
The POCUS lung finding; it was found that focal B-lines (34.9%) was the most common finding followed by pleural effusion 31% of which 69.2% were unilateral and 79.5% were simple pleural effusion (Table 2).
In this work as shown in (Table 3) the sensitivity, specificity, positive predictive value (PPV), Negative predictive value (NPV) and area under the curve (AUC) of POCUS detection of pleural effusion versus CT were 94.8%, 96.5%, 92.3%, 94.2% and 0.92 respectively (excellent quality of test), the sensitivity, specificity, PPV and NPV of POCUS detection of pneumonia versus CT were 95%, 92%, 84% and 97.6% respectively with AUC 0.93 (excellent quality of test),the sensitivity, specificity, PPV and NPV of POCUS detection of pneumothorax versus CT were 77.8%, 95.7%, 58% and 98% respectively with AUC 0.89 , the sensitivity, specificity, PPV and NPV of chest x-ray detection of pulmonary edema versus CT were 75%, 87.7%, 39.1% and 97.1% respectively with AUC 0.81.
POCUS was showed excellent agreement with CT in diagnosis of pleural effusion and pneumonia with kappa value of 0.85 and 0.84 respectively. While POCUS was showed moderate agreement with CT in diagnosing of pneumothorax and pulmonary edema with kappa coefficient value 0.64 and 0.671 respectively (Table 4).
Regarding POCUS Echocardiography findings of the studied patients RV dilatation was present in 10.3% and pericardial effusion was present in 4.8% of the studied patients. Mean ± SD of EF was 57±11 %, while mean ±SD of IVCCI were 39±9.2 %, mean ±SD of IVCDI were 17.5±4.2 %, (Table 5) (Fig. 5).

Bar c hart showed the EF classification in the studied cases
Regarding the concordance between POCUS Echocardiography diagnosis and final diagnosis as shown in (Table 6), there was a good agreement for diagnosis of RV dilatation with kappa coefficient 0.793, and a good agreement for LV systolic dysfunction with kappa value of 0.801. Pericardial effusion showed strong agreement with kappa value of 0.905, while pulmonary embolism showed small agreement with kappa value of 0.259.
This work illustrated that about 9.5% of studied patients in ICU have DVT, most of them of partial occlusion was 75% and commonest site was the femoral vein 50% (Table 7).
In this work, the outcome of the studied patients was assessed. The percentage of studied patients who spent 7-14 days in ICU was 76.2%. The frequency of died cases was 23 patients (18.3%), while the frequency of improved cases was 103 patients (81.7%) (Table 8).
There was statistical significance decrease in ICU stay regarding true positive cases diagnosed by POCUS in the following diseases; acute pulmonary edema, pneumothorax, pleural effusion, pneumonia, LV systolic dysfunction and pericardial effusion with P values <0.001, 0.011, 0.004, 0.006, <0.001 and 0.032 respectively (Table 9).
There was no statistical significance in intermediate and ward stay regarding POCUS diagnosis in all diseases. There was no statistically significant difference between degree of POCUS diagnosed groups (true positive, true negative and fail to diagnose) and outcome except for LV dysfunction with more favorable outcome (Table 10).
Discussion
This work was carried out to evaluate the impact of POCUS technique (focused heart, lung, IVC, Doppler) in improving the outcome of deteriorating patients in RICU via narrowing differential diagnosis and start target therapy early.
This study is a prospective cohort study conducted in respiratory ICU at Chest Department, Zagazig University Hospitals in the period from May 2020 to May 2022.
126 patients were included in the current work. The enrolled patients were 51 males (40.5%) and 75 females (59.5%). Age of patients ranged from 20 to 83 years with mean ±SD of 45.4 ±15.7 years old. Mean ± SD of BMI was 24.4 ± 4.7 kg/m2 that ranged from 16 to 42 kg/m2
As regard age distribution, Baid et al., [17] found that median age was 53 years ranging from 18–82 years, was higher than this work with median age 46 ranging from 20-83 years, this difference in median age could be attributed to difference in number of studied populations in Baid et al., [17] 237 patients vs 126 patients in this work. Also different as regard sex distribution men 60% Vs 40.5% in this work and females 40% Vs 59.5% in this work. But Barman et al., [18] was comparable to this work as regard age, mean age was 45.7 ± 20.4 years vs 45.4± 15.7 years but differ from us in sex distribution, males were 63% Vs 40.5% and females were 37% Vs 59.5%.
As regard smoking habit in the current work, the number of non-smokers were 77 (61.1%), current smokers were 42 (33.3%) and ex-smoker were 7 (5.6%) (Table 1). This result was different from that of Riishede et al., [19], the number of never smoker patients were 28%, Current smokers were 25%, ex-smokers were 23%. This difference could be attributed to 24% of patients were unknown status.
Baid et al., [17] result was different from this work in their study the percentage of absent lung sliding was 0.84%, unilateral pleural effusion was 5.91%, bilateral pleural effusion was 8.12%, Diffuse B lines (by counting) was 29.96%, Grouped B lines (by counting) was 29.54%, irregular pleura was 66.24% and pleural shredding was 55.7%.
El mahalawy et al., [20] study was slightly different from this current work as regarding US versus CT in diagnosing the pleural effusion, chest US showed a sensitivity of 94% vs 87.8%, specificity of 96% vs 96.5% , PPV of 97% vs 92.3% and NPV of 90% vs 94.2% & area under the curve 0.95 vs 0.92 as lung ultrasound is usually useful in confirming pleural effusion in a patient with normal or abnormal chest radiographs as it can detect very little amount 5-50 ml of pleural fluid with 100% sensitivity for effusions of 100 ml or more.
In contrast to this work results, El ziat et al., [21] illustrated the efficacy of TUS in diagnosis of pleural effusion, it illustrated that sensitivity was higher than this work was 93.75% Vs 87.8%, specificity was higher 85.7% Vs 96 %, PPV was lower 75% Vs 92.3% and NPV was comparable 96.8% Vs 94.2%.
Qureshi et al., [22] study stated that US correctly diagnosed pleural effusion with an overall sensitivity of 79%, and specificity of 100%.
Also, El mahalawy et al., [20] study as regard chest POCUS as a predictor for consolidation (pneumonia) relating to CT as a gold standard were in harmony with this work a sensitivity was 93%, specificity was 95% and AUC was 0.94, but PPV was 98% and NPV was 87%. Also, Barman et al., [18] found that the sensitivity of lung focused ultrasound in detection of pneumonia was lower 88% than that of the current work but with the same specificity 92%.
Also, in contrast to this study results, Bitar et al., [23] who evaluated diagnostic accuracy of chest ultrasound in patients with pneumonia in the intensive care unit. It revealed low CXR sensitivity in diagnosis of pneumonia that was 54.79%, NPV of 26.67%, specificity of 63.16% and PPV of 85%.
El mahalawy., et al., [20] study was in accordance with this current work as regard POCUS in diagnosing pneumothorax specificity was 98% vs 95.7% and NPV was 99% vs 98% and AUC was 0.97 vs 0.89, but they were different from this study in sensitivity was 96% vs 77.8%, PPV was 93% vs 58%.
Also, with that of Elziat et al., [21] study who showed that the sensitivity of TUS for diagnosis of pneumothorax was higher 85.7% than that of the current work, the specificity was 97.7% near to that of the current work, the PPV was higher 85.7% than that of the current work and NPV was 97.7% near to that of the current work.
Also, with Azad et al .,[24] who showed higher sensitivity of Chest POCUS to pneumothorax diagnosis 88%- 91%% than that of our results but specificity reached 98%- 99% that was nearer to that of our results.
Baid et al., [17] found that transthoracic US in the diagnosis of acute pulmonary edema showed sensitivity slightly lower than this study 88.5% vs. 91.7%, while specificity was higher than this work (97.7% vs 93%).
Also, El mahalawy., et al., [20] study showed that the sensitivity of chest US in diagnosis of pulmonary edema was 93%, specificity was 93%, PPV was 62% and NPV was 99% and AUC was 0.93.
In Baid et al., [17], the concordance between POCUS lung diagnosis and final diagnosis in pneumonia with K value was 0.634 vs 0.84 in this current work, 0.836 vs 0.67 in acute pulmonary edema and 1.00 vs 0.64 in pneumothorax, but in accordance with the current work in pleural effusion 0.85 vs 0.85.
Taylor and Moore [25] demonstrated the sensitivity of RV dilatation in detecting pulmonary embolism was 90% with a specificity of 26% when the point-of-care echocardiogram was done by 69 emergency physicians.
In contrast to the pervious results, the study of Baid et al., [17] showed concordance between POCUS echocardiography diagnosis and final composite diagnosis with K value was 0.590 vs 0.801 in LV dysfunction that is less than that of the current study, 0.798 vs 0.905 in pericardial effusion and higher than this current study 1.000 vs 0.259 in pulmonary embolism.
There is harmony between our results and Fischer, et al., [26], the 6.4% observed extremity prevalence of DVT resulted in a low positive predictive value 61.5%. The Compressible veins (without DVT) were 89%.
The study of Umuhire, et al., [27] demonstrated that positive deep venous thrombosis scans were infrequent 5.1%. DVT exam was normal compressible in 94.9% and non-compressible (DVT present) in 5.1%.
While in Riishede et al., [19], the proportion of POCUS diagnoses in agreement with final diagnoses at 4 h in the intervention group is increased compared to the control group for the diagnoses of exacerbation of COPD 89% vs 75%, pulmonary edema 53% vs 33% and para-pneumonic effusion 77% vs 38% but with overlapping CIs. The proportion of correctly diagnosed pneumonia is equal among the groups 88% vs 88%.
Riishede et al., [19] showed a significantly increased proportion of patients in the intervention group spent less than 1 day in hospital 39.6%; “95% CI” 25.8–38.4 compared to the control group 23.8%; "95% CI" 16.5–33 with p value 0.01 clarified by an absolute increase of 15.8%. Patients with time spent 4–7 days in intervention group were 15.1%; "95% CI"14.2–24.9, %; 95% CI versus in control group were 22.9%; 15.7–32.0 with relative effect (95% CI) 0.66, 0.37–1.17. Also, patients who spent > 7 days were 14.2%; 11.3–21.2 in intervention group versus 17.4%; 11.0–25.7 in control group. Patients readmitted ≤30 days from discharge were 21.7%; "95% CI" 14.8–30.7 in intervention group versus 21.9%; 14.9–31.0 in control group.
In this current work, there was statistical significance decrease in ICU stay regarding true positive cases diagnosed by POCUS in the following diseases; acute pulmonary edema, pneumothorax, pleural effusion, pneumonia, LV systolic dysfunction and pericardial effusion with P values <0.001, 0.011, 0.004, 0.006, <0.001 and 0.032 respectively.
This study showed that there was no statistical significance in Intermediate and ward stay regarding POCUS diagnosis in all diseases. There was no statistically significant difference between degree of POCUS diagnosed groups (true positive, true negative and fail to diagnose) and outcome except for LV dysfunction with more favorable outcome with (p value 0.045)
POCUS was helpful, bedside, real time and non-invasive diagnostic tool in RICU. Also, by integration of LUS findings with clinical and laboratory data, it can diagnose different pulmonary diseases in critically ill patients within twenty –four hours of admission. It could help to start proper regimen of treatment rapidly with improving outcomes in respiratory ICU.
POCUS is a rapid, real time, low cost, noninvasive, no radiological exposure and easy applicable to critical ill patients, improving their outcome. POCUS shows promise in deteriorating patients in RICU as an initial investigating tool as it has significant diagnostic and therapeutic impact.
Availability of data and materials
The database used and analyzed during the current study are available from the corresponding author on reasonable request.
Abbreviations
- POCUS:
-
Point of care ultrasound
- LV:
-
Left ventricle
- ICU:
-
Intensive care unit
- MV:
-
Mechanical ventilation
References
Dunn MJ, Gwinnutt CL, Gray AJ (2007) Critical care in the emergency department: patient transfer. Emerg Med J 24(1):40–4
Moore CL, Copel JA (2011) Point-of-care ultrasonography. N. Engl J Med 364:749–757. https://doi.org/10.1056/NEJMra0909487
M. Wagner, J. Shen-Wagner, K.X. Zhang, T. Flynn, K. Bergman (2018): Point-of-Care ultrasound applications in the outpatient clinic, South. Med. J. 111; 404–410, https://doi.org/10.14423/SMJ.0000000000000835.
Kajimoto K, Madeen K, Nakayama T, et al. (2012): Rapid evaluation by lung-cardiac- inferior vena cava (LCI) integrated ultrasound for differentiating heart failure from pulmonary disease as the cause of acute dyspnea in the emergency setting. Cardiovasc Ultrasound.;10(1):49. https://doi.org/10.1186/1476-7120-10-49 . PMID: 23210515; PMCID: PMC3527194.
Russell FM, Ehrman RR, Cosby K, Ansari A, Tseeng S, Christain E, et al.(2015): Diagnosing acute heart failure in patients with undifferentiated dyspnea: a lung and cardiac ultrasound (LuCUS) protocol. Acad Emerg Med.;22(2):182–91. https://doi.org/10.1111/acem.12570 . Epub. PMID: 25641227.
Subbe CP, Kruger M, Rutherford P et al (2001) Gemmel L. Validation of a modified early warning score in medical admissions. QJM 94:521–6
Zwank MD, Gordon BD, Truman SM (2017) Refining the wild wild west of point-of- care ultrasound at an academic community hospital. J Am Coll Radiol 14:1574–1577. https://doi.org/10.1016/j.jacr.2017.04.002
Lichtenstein DA, Mezière G, Lascols N, Biderman P et al (2005) Ultrasound diagnosis of occult pneumothorax. Critical care medicine 33(6):1231–1238
Lichtenstein DA, Meziere GA (2008) Relevance of lung ultrasound in the diagnosis of acute respiratory failure: The BLUE protocol. Chest 134:117–25 (PMID: 18403664)
Volpicelli G, Caramello V, Cardinale L et al (2008) Diagnosis of radio-occult pulmonary conditions by real-time chest ultrasonography in patients with pleuritic pain. Ultrasound Med Biol 34(11):1717–23
Kanagala P, Squire IB (2020) Latest British Society of Echocardiography recommendations for left ventricular ejection fraction categorisation: potential implications and relevance to contemporary heart failure management. Echo Res Pract 7(3):L1–L4. https://doi.org/10.1530/ERP-20-0029. (PMID: 32788421; PMCID: PMC7487180)
Labovitz AJ, Noble VE, Bierig M et al (2010) Focused cardiac ultrasound in the emergent setting: a consensus statement of the American Society of Echocardiography and American College of Emergency Physicians. J Am Soc Echocardiogr 23(12):1225–30
Weekes AJ and Quirke DP (2011): Emergency echocardiography. Emerg Med Clin North Am.29(4):759-87, vi-vii.
Wong M, Thavanathan R, Woo M, Hecht N et al (2020) Point- of- care Echocardiography, The Department of Emergency Medicine, Ottawa University Hospitals, A primer, 1st edition 33(1):107–115
Mantuani D, Frazee B, Fahimi J et al (2016) Point-of-care multiorgan ultrasound improves diagnostic accuracy in adults presenting to the emergency department with acute dyspnea. West J Emerg Med 17(1):46–53. https://doi.org/10.5811/westjem.2015.11.28525
Needleman L, Cronan J, Lilly M et al (2018) Ultrasound for Lower Extremity Deep Venous Thrombosis. Circulation 137:1505–1515
Baid H, Vempalli N, Kumar S, Arora P (2022) Point of care ultrasound as initial diagnostic tool in acute dyspnea patients in the emergency department of a tertiary care center: diagnostic accuracy study. Int J Emerg Med. 15(1):27. https://doi.org/10.1186/s12245-022-00430-8. (PMID: 35698060; PMCID: PMC9190130)
Barman B, Parihar A, Kohli N, Agarwal A, et al., (2020): Impact of Bedside Combined Cardiopulmonary Ultrasound on Etiological Diagnosis and Treatment of Acute Respiratory Failure in Critically Ill Patients. Indian J Crit Care Med. 24(11):1062-1070. https://doi.org/10.5005/jp-journals-10071-23661. PMID: 33384512; PMCID: PMC7751041.
Riishede M, Lassen AT, Baatrup G, Pietersen PI, (2021): Point-of-care ultrasound of the heart and lungs in patients with respiratory failure: a pragmatic randomized controlled multicenter trial. Scand J Trauma Resusc Emerg Med. 29(1):60. https://doi.org/10.1186/s13049-021-00872-8. PMID: 33902667; PMCID: PMC8073910.
Elmahalawy I, Nagwa MD, Osama ME et al (2017) Role of thoracic ultrasound in diagnosis of pulmonary and pleural diseases in critically ill patients. Egypt J Chest Dis Tuberc 66:261–266
Elziat T, Maklad S, Ali S, Mohammed S (2020) Role of Ultrasonography in Diagnosis of Pleuropulmonary Diseases in Adults. Egypt J Hosp Med 81(5):1937–1947. https://doi.org/10.21608/ejhm.2020.122715
Qureshi NR, Rahman NM, Gleeson FV. (2009): Thoracic ultrasound in the diagnosis of malignant pleural effusion. Thorax Feb;64(2):139-43. doi: https://doi.org/10.1136/thx.2008.100545. Epub 2008 Oct 13. PMID: 18852159.
Bitar ZI, Maadarani OS, El-Shably AM, Al-Ajmi MJ et al (2018) Diagnostic accuracy of chest ultrasound in patients with pneumonia in the intensive care unit: a single-hospital study. Health Sci Rep 2:e102. https://doi.org/10.1002/hsr2.102
Azad A, Saad A, Junaid A et al (2015) CJEM Journal Club Validity of ultrasonography to diagnosing pneumothorax: a critical appraisal of two meta-analyses. CJEM 17(2):199–201
Taylor RA, Moore CL (2014) Accuracy of emergency physician-performed limited echocardiography for right ventricular strain. Am J Emerg Med 32(4):371–4
Fischer EA, Kinnear B, Schnobrich D et al (2019) Hospitalist-Operated Compression Ultrasonography: a Point-of-Care Ultrasound Study (HOCUS-POCUS). J Gen Intern Med 34(10):2062–2067. https://doi.org/10.1007/s11606-019-05120-5
Umuhire OF, Henry MB, Levine AC, et al., (2019): Impact of ultrasound on management for dyspnea presentations in a Rwandan emergency department. Ultrasound J. 11(1):18. https://doi.org/10.1186/s13089-019-0133-8. PMID: 31432282; PMCID: PMC6702246.
Acknowledgments
The authors express their gratitude to all of the study participants and investigators.
Disclosure
There are no conflicts of interest reported by the authors in this work.
Funding
No financial support or sponsorship.
Author information
Authors and Affiliations
Contributions
All authors share in conception, design of work and acquisition, analysis and interpretation of the data. The authors read and approved the final manuscript.
Corresponding author
Ethics declarations
Ethics approval and consent to participate
This study was approved by the administrative council of the chest department and institutional board review of Zagazig University (ZU-IRB #6142/31-5-2020). Patients included in this study gave their informed and signed consent.
Competing interests
The authors declare that they have no competing interests.
Additional information
Publisher’s Note
Springer Nature remains neutral with regard to jurisdictional claims in published maps and institutional affiliations.
Rights and permissions
Open Access This article is licensed under a Creative Commons Attribution 4.0 International License, which permits use, sharing, adaptation, distribution and reproduction in any medium or format, as long as you give appropriate credit to the original author(s) and the source, provide a link to the Creative Commons licence, and indicate if changes were made. The images or other third party material in this article are included in the article's Creative Commons licence, unless indicated otherwise in a credit line to the material. If material is not included in the article's Creative Commons licence and your intended use is not permitted by statutory regulation or exceeds the permitted use, you will need to obtain permission directly from the copyright holder. To view a copy of this licence, visit http://creativecommons.org/licenses/by/4.0/.
About this article

Cite this article
Elgabry, M., Shebl, E., El-Shetry, M. et al. Role of point of care ultrasound in management of deteriorating respiratory intensive care unit patients and its impact on outcome. Egypt J Bronchol 18, 5 (2024). https://doi.org/10.1186/s43168-024-00256-3
Received:
Accepted:
Published:
DOI: https://doi.org/10.1186/s43168-024-00256-3