
Abstract
This study is to identify the positive association of food quality, restaurant service quality, physical environment quality, and customer satisfaction with revisit intention of customers at fast food restaurants. Additionally, word of mouth is investigated as moderator on the relationship of customer satisfaction with revisit intentions of customers at fast food restaurants. Data were collected through a questionnaire survey from 433 customers of fast food restaurants through convenience sampling. Hypotheses of proposed model were tested using structural equation modeling with partial least squares SEM-PLS in SMART PLS 3. The results confirmed the positive association of food quality, restaurant service quality, physical environment quality, and customer satisfaction with revisit intentions of customers at fast food restaurants. However, word of mouth does not positively moderate the relationship of customer satisfaction with revisit intentions of customers at fast food restaurants. This study emphasizes the importance of revisit intention as a vital behavioral reaction in fast food restaurants. This study reveals revisit intention’s positive association with food quality, restaurant service quality, physical environment quality, and customer satisfaction based on stimulus-organism-response (S-O-R) theory. Furthermore, it is identified that social conformity theory does not hold its assumption when consumers experience quality and they are satisfied because word of mouth does not moderate the relationship of customer satisfaction with revisit intention of customer.
Introduction
Background of the study
Hospitality industry is observing diversified changes in highly competitive environment for restaurants [1]. Consumers are becoming conscious of food quality (FQ), restaurant service quality (RSQ), and physical environment quality (PEQ) of the fast food restaurants. Consumers switch easily in case of just one evasive experience [2, 3]. Fast food restaurants must attract new customers and retain the existing customers. There is a growing trend in Pakistani culture to dine out at fast food restaurants with family, friends, and colleagues [4]. Restaurants focus to provide a dining experience by combining tangible and intangible essentials [5]. Decisive objective is to achieve customer satisfaction (CS), word of mouth (WOM), and future revisit intention (RVI) at fast food restaurant.
Restaurants differ in offerings, appearance, service models, and cuisines; this classifies restaurants as downscale and upscale [6, 7]. Revisit intention is the willingness of a consumer to revisit a place due to satisfactory experience. Customer satisfaction generates a probability to revisit in presence or absence of an affirmative attitude toward the restaurant [8]. Revisit intention is a substantial topic in hospitality research [8,9,10]. To date there has been little agreement on that word of mouth can affect revisit intention after experience of customer satisfaction. For instance, when a customer is satisfied at a fast food restaurant experience, however, the customer’s family and friends do not share the same satisfying experience. Will this word of mouth affect the customer’s revisit intention? Food quality is acknowledged as a basic component of the restaurant’s overall experience to affect consumer revisit intention. Fast food quality is substantially associated with customer satisfaction and it is an important predictor of behavioral intention [11]. Service quality is an essential factor to produce consumers’ revisit intentions [12]. Furthermore, physical environment quality affects behavior of consumers at restaurants, hotels, hospitals, retail stores, and banks [13]. Physical environment quality is a precursor of customer satisfaction [9]. This suggests that customer satisfaction is associated with fast food quality, restaurant service quality, physical environment quality, and revisit intention.
Aims of the study
This study is to investigate the association of fast food quality, restaurant service quality, physical environment quality with customer’s revisit intention through mediation of customer satisfaction using S-O-R theory and moderation of word of mouth on the relationship of customer satisfaction with revisit intention based on social conformity theory. This study empirically tests a conceptual research framework based on S-O-R and social conformity theory adding value to the knowledge. Objectives of the study are given below.
-
To investigate the association of fast food quality, restaurant service quality, and physical environment quality with revisit intention through customer satisfaction based on S-O-R theory in the context of Pakistani fast food restaurants.
-
To investigate moderation of WOM on relationship of customer satisfaction with revisit intention based on social conformity theory in the context of Pakistani fast food restaurants.
Furthermore, little empirical evidence is present about customer satisfaction with respect to fast food restaurant service quality [14]. Customer satisfaction is a post-consumption assessment in service industry. Customer satisfaction acts as the feedback mechanism to boost consumer experience [15]. Customer satisfaction brings competitive advantage to the firm and produces positive behavioral revisit intention [16]. Marketing literature emphasizes customer satisfaction in anticipation of positive word of mouth, revisit intention, and revisit behavior [5]. Behavioral intention is assessed through positive WOM, and it is important in service industry [15], whereas social influence in shape of WOM affects the behavior of individuals toward conformity leading to a driving effect based on social conformity theory [17].
Food quality
Food quality plays a central role in the restaurant industry. Food quality is essential to satisfy consumer needs. Food quality is a substantial condition to fulfill the needs and expectations of the consumer [18]. Food quality is acknowledged as a basic component of the restaurant’s overall experience. Food quality is a restaurant selection’s most important factor, and it is considerably related to customer satisfaction [11]. Food quality affects customer loyalty, and customer assesses the restaurant on the basis of food quality [19]. Food quality entails food taste, presentation, temperature, freshness, nutrition, and menu variety. Food quality influences customers’ decisions to revisit the restaurant [20]. Academic curiosity is increasing in the restaurant’s menus, as variety of menu items is considered the critical characteristic of food quality [11]. Taste is sensual characteristic of food. Taste is assessed after consumption. Nonetheless, customers foresee taste before consumption through price, quality, food labels, and brand name. Taste of food is important to accomplish customer satisfaction. Presentation of food enhances dining customer satisfaction [21, 22]. Customer’s concerns of healthy food substantially affect customer’s expectations and choice of a restaurant [23]. Freshness is assessed with the aroma, juiciness, crispness, and fresh posture of the food. Food quality enhances customer satisfaction [24].
Restaurant service quality
Quality as a construct is projected by Juran and Deming [25, 26]. Service quality is comparatively a contemporary concept. Service quality assesses the excellence of brands in industry of travel, retail, hotel, airline, and restaurant [27]. Restaurant service quality affects dining experiences of customers. Service quality creates first impression on consumers and affects consumers’ perception of quality [28]. Service industry provides good service quality to the customers to attain sustainable competitive advantage. Customer satisfaction depends on quality of service at the restaurant [29]. Service quality entails price, friendliness, cleanliness, care, diversity, speed of service, and food consistency according to menu. Customer satisfaction also depends on communication between restaurant’s personnel and the customers [30]. Consumer’s evaluation of service quality is affected by level of friendliness and care. Service quality leads to positive word of mouth, customer satisfaction, better corporate image, attraction for the new customers, increase revisits, and amplified business performance. Service quality increases revisits and behavioral intentions of customers in hospitality industry [12].
Physical environment quality
PEQ is a setting to provide products and services in a restaurant. Physical environment quality contains artifacts, decor, spatial layout, and ambient conditions in a restaurant. Customers desire dining experience to be pleasing; thus, they look for a physical environment quality [31]. Physical environment quality satisfies and attracts new customers. PEQ increases financial performance, and it creates memorable experience for the customers [9]. Consumers perceive the quality of a restaurant based on cleanliness, quirky, comfortable welcoming, physical environment quality, and other amenities that create the ambiance [32]. Effect of physical environment quality on behaviors is visible in service businesses such as restaurants, hotels, hospitals, retail stores, and banks [33]. Physical environment quality is an antecedent of customer satisfaction [34]. Thus, restaurants need to create attractive and distinctive physical environment quality.
Customer satisfaction
Customer satisfaction contains the feelings of pleasure and well-being. Customer satisfaction develops from gaining what customer expects from the service. Customer satisfaction is broadly investigated in consumer behavior and social psychology. Customer satisfaction is described “as the customer’s subjective assessment of the consumption experience, grounded on certain associations between the perceptions of customer and objective characteristics of the product” [35]. Customer satisfaction is the extent to which an experience of consumption brings good feelings. Customer satisfaction is stated as “a comparison of the level of product or service performance, quality, or other outcomes perceived by the consumer with an evaluative standard” [36]. Customer satisfaction constructs as a customer’s wholesome evaluation of an experience. Customer satisfaction is a reaction of fulfilling customer’s needs.
Customer satisfaction brings escalated repeat purchase behavior and intention to refer [37]. Dissatisfied consumers are uncertain to return to the place [38]. Satisfactory restaurant experience can enhance revisit intention of the consumer. Positive WOM is generated when customers are not only satisfied with the brand but they demand superior core offering and high level of service [15].
Word of mouth
Word of mouth is described as “person-to-person, oral communication between a communicator and receiver which is perceived as a non-commercial message” [39]. WOM is also defined as “the informal positive or negative communication by customers on the objectively existing and/or subjectively perceived characteristics of the products or services” [40]. Moreover, [41] defines it as “an informal person to person communication between a perceived non-commercial communicator and a receiver regarding a brand, a product, an organization or a service”. WOM is described as a positive or negative statement made by probable, actual or former customers about a product or a company, which is made available through offline or online channels [42, 43]. WOM is an important and frequent sensation; it is known for long time that people habitually exchange their experiences of consumptions with others. Consumers complain about bad hotel stays, talk about new shoes, share info about the finest way of getting out tough stains, spread word about experience of products, services, companies, restaurants, and stores. Social talks made more than 3.3 billion of brand impressions per day [44].
WOM has substantial impact on consumer’s purchasing decision; therefore, a vital marketing strategy is to initiate positive WOM [45]. However, negative WOM is more informative and diagnostic where customers express their dissatisfaction [38]. Word of mouth communications are more informative than traditional marketing communications in service sector. WOM is more credible than advertisement when it is from friends and family [46]. WOM is a vital influencer in purchase intention. WOM escalates affection that enhances commitment of consumer purchase intention. WOM is generated before or after the purchase. WOM helps the consumers to acquire more knowledge for the product and to reduce the perceived risk [47]. WOM in the dining experience is very important. People tend to follow their peers’ opinions when they are to dine out.
Revisit intention
To predicting and to explain human behavior is the key determination of consumer behavior research. Consumer needs differ and emerge frequently with diverse outlooks. Revisit intention is to endorse “visitors being willing to revisit the similar place, for satisfactory experiences, and suggest the place to friends to develop the loyalty” [48]. Consumer forms an attitude toward the service provider based on the experience of service. This attitude can be steady dislike or like of the service. This is linked to the consumer’s intention to re-patronize the service and to start WOM. Repurchase intention is at the core of customer loyalty and commitment. Repurchase intention is a significant part of behavioral and attitudinal constructs. Revisit intention is described as optimistic probability to revisit the restaurant. Revisit intention is the willingness of a consumer to visit the restaurant again. Furthermore, the ease of visitors, transportation in destination, entertainment, hospitability, and service satisfaction influence visitor’s revisit intention.
Consumer behavior encircles the upcoming behavioral intention and post-visit evaluation. Post-visit evaluation covers perceived quality, experience, value, and the satisfaction. Restaurant managers are interested to understand the factors of consumer revisit intention, as it is cost effective to retain the existing customers in comparison with attract new customers [49]. Substantial consideration is prevailing in literature for the relationship among quality attributes, customer satisfaction, and revisit intention. There is a positive association between customer satisfaction and revisit intention. Indifferent consumer, accessibility of competitive alternatives and low switching cost can end up in a state where satisfied consumers defect to other options [2]. Consumer behavior varies for choice of place to visit, assessments, and behavioral intentions [50]. The assessments are about the significance perceived by regular customers’ satisfactions. Whereas, future behavioral intentions point to the consumer’s willingness to revisit the similar place and suggest it to the others [51].
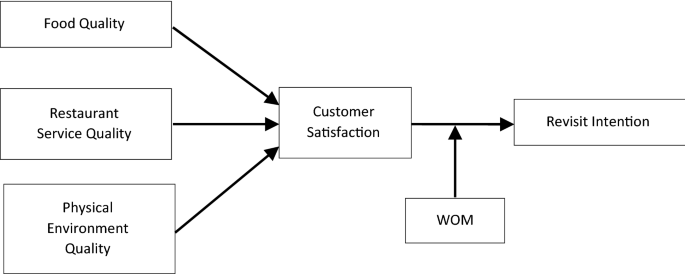
S-O-R model is primarily established on the traditional stimulus–response theory. This theory explicates individual’s behavior as learned response to external stimuli. The theory is questioned for oversimplifying ancestries of the behaviors and ignoring one’s mental state. [52] extended the S-O-R model through integrating the notion of organism between stimulus and response. S-O-R concept is embraced to reveal individual’s affective and cognitive conditions before the response behavior [53]. S-O-R framework considers that environment comprises stimuli (S) leading changes to the individual’s internal conditions called organism (O), further leading to responses (R) [52]. In S-O-R model, the stimuli comprise of various components of physical environment quality, organism indicates to internal structures and processes bridging between stimuli and final responses or actions of a consumer [9]. Behavioral responses of an individual in a physical environment quality are directly influenced by the physical environment quality stimulus [54]. S-O-R framework is implemented in diverse service contexts to examine how physical environment quality affects customer’s emotion and behavior [55]. The effect of stimulation in an online shopping environment on impulsive purchase is investigated through S-O-R framework [56]. The effects of background music, on consumers’ affect and cognition, and psychological responses influence behavioral intentions [57]. Perceived flow and website quality toward customer satisfaction affect purchase intention in hotel website based on S-O-R framework [58]. Therefore, this study conceptualizes food quality, restaurant service quality, and physical environment quality as stimuli; customer satisfaction as organism; and revisit intention as response.
Moreover, social conformity theory (SCT) is to support the logical presence of WOM in the conceptual framework as a moderator on the relationship of customer satisfaction and revisit intention. Social conformity influences individual’s attitudes, beliefs and behaviors leading to a herding effect [17, 59]. Thus, social influence (WOM) moderates the relationship of customer satisfaction and revisit intention. Following hypotheses are postulated, see Fig. 1.
Conceptual research framework
H 1
Food quality is positively associated with customer satisfaction in fast food restaurant.
H 2
Restaurant service quality is positively associated with customer satisfaction in fast food restaurant.
H 3
Physical environment quality is positively associated with customer satisfaction in fast food restaurant.
H 4
Customer satisfaction is positively associated with revisit intention of customer in fast food restaurant.
H 5
Customer satisfaction mediates between food quality and revisit intention of customer in fast food restaurant.
H 6
Customer satisfaction mediates between restaurant service quality and revisit intention of customer in fast food restaurant.
H 7
Customer satisfaction mediates between physical environment quality and revisit intention of customer in fast food restaurant.
H 8
WOM positively moderates the relationship between customer satisfaction and revisit intention of customer in fast food restaurant.
Methods
There are two research approaches such as deductive (quantitative) and inductive (qualitative). This study utilized the quantitative research approach as it aligns with the research design and philosophy. Quantitative research approach mostly relies on deductive logic. Researcher begins with hypotheses development and then collects data. Data are used to determine whether empirical evidence supports the hypotheses [60]. The questionnaires survey is used. This study chose the mono-method with cross-sectional time horizon of 6 months. Deductive approach is utilized in this study. Cross-sectional time horizon also known as “snapshot” is used when investigation is related with the study of a specific phenomenon at a particular time [61]. Questionnaire survey is mostly used technique for data collection in marketing research due to its effectiveness and low cost [62]. Data are collected through self-administered questionnaires. Following the footsteps of Lai and Chen [63] and Widianti et al. [64] convenience sampling is applied. Famous fast food restaurants in twin cities (Rawalpindi and Islamabad) of Pakistan were chosen randomly. Furthermore, 650 questionnaires (with consideration of low response rate) were distributed to the customers at famous fast food restaurants. Moreover, researchers faced difficulty in obtaining fast food restaurant’s consumers data.
It yielded a response rate of 68.92% with 448 returned questionnaires. Fifteen incomplete questionnaires are not included; thus, 433 responses are employed for data analysis from fast food restaurant customers. The obtained number of usable responses was suitable to apply structural equation modeling [65,66,67,68].
Sample characteristics describe that there are 39.7% females and 60.3% males. There are 31.4% respondents of age group 15–25 years, 48.3% of age group 26–35, 12.2% of age ranges between 36 and 45, 6.7% of age ranges between 46 and 55, and 1.4% of age group is above 56 years. The educational level of the respondents indicates that mostly respondents are undergraduate and graduate. Occupation of respondents reflects that 28.6% work in private organizations and 24.9% belong to student category. Monthly income of 29.3% respondents ranges between Rupees 20,000 and 30,000 and 25.6% have monthly income of Rupees 41,000–50,000. Average monthly spending in fast food restaurants is about Rupees 3000–6000, see Table 1.
Measures of the constructs
Food quality is adopted from measures developed by [69]. Food quality contains six items such as: food presentation is visually attractive, the restaurant offers a variety of menu items, and the restaurant offers healthy options. Restaurant service quality is adopted with six items [70]. This construct contains items such as: efficient and effective process in the welcoming and ushering of the customers, efficient and effective explanation of the menu, efficient and effective process in delivery of food. Physical environment quality is adopted with four items [71], and one item is adopted from measures developed by [70]. The items are such as: the restaurant has visually striking building exteriors and parking space, the restaurant has visually eye-catching dining space that is comfortable and easy to move around and within, and the restaurant has suitable music and/or illumination in accordance with its ambience. Revisit intention is measured through four adapted items [8]; such as: I would visit again in the near future and I am interested in revisiting again. Customer satisfaction is measured by three adopted items [29]; such as: I am satisfied with the service at this restaurant, and the restaurant always comes up to my expectations. Word of mouth is measured with four adopted items such as: my family/friends mentioned positive things I had not considered about this restaurant, my family/friends provided me with positive ideas about this restaurant [72]. Each item is measured on 5-point Likert scale, where 1 = strongly disagree, 3 = uncertain, and 5 = strongly agree.
Results and discussion
Validity and reliability
Validity taps the ability of the scale to measure the construct; in other words, it means that the representative items measure the concept adequately [73]. The content validity is executed in two steps; firstly, the items are presented to the experts for further modifications; secondly, the constructive feedback about understanding of it was acquired by few respondents who filled the questionnaires. Each set of items is a valid indicator of the construct as within-scale factor analysis is conducted.
The factor analyses allotted the items to their respective factor. Fornell and Lacker’s [74] composite reliability p is calculated for each construct using partial least squares (PLS) structural equation modeling and Cronbach’s coefficient α [75]. Cronbach’s α is used to evaluate the reliability of all items that indicates how well the items in a set are positively related to one another. Each Cronbach’s α of the instrument is higher than .7 (ranging from .74 to .91); see Table 2.
Common method bias
Same measures are used to collect data for all respondents; thus, there can be common method bias [76]. Firstly, questionnaire is systematically constructed with consideration of study design. Secondly, respondents were assured for the responses to be kept anonymous [77]. Common method bias possibility is assessed through Harman’s single factor test [78,79,80,81,82,83]. Principal axis factor analysis on measurement items is exercised. The single factor did not account for most of the bias and it accounted for 43.82% variance that is less than 50%. Thus, common method bias is not an issue [80, 81].
SEM-PLS model assessment
Survey research faces a challenge to select an appropriate statistical model to analyze data. Partial least squares grounded structural equation modeling (SEM-PLS) and covariance-based structural equation modeling (CB-SEM) are generally used multivariate data analysis methods. CB-SEM is based on factor analysis that uses maximum likelihood estimation. PLS-SEM is based on the principal component concept; it uses the partial least squares estimator [84]. PLS-SEM is considered appropriate to examine complex cause–effect relationship models. PLS-SEM is a nonparametric approach with low reservations on data distribution and sample size [84].
Measurement model assessment
To evaluate convergent validity measurement model (outer model) is assessed that includes composite reliability (CR) to evaluate internal consistency, individual indicator reliability, and average variance extracted (AVE) [85]. Indicator reliability explains the variation in the items by a variable. Outer loadings assess indicator reliability; a higher value (an item with a loading of .70) on a variable indicates that the associated measure has considerable mutual commonality [85]. Two items RSQ 14 and PEQ 24 are dropped due to lower value less than .60 [86]. Composite reliability is assessed through internal consistency reliability. CR values of all the latent variables have higher values than .80 to establish internal consistency [85]; see Table 2.
Convergent validity is the extent to which a measure correlates positively with alternative measures of the same variable. Convergent validity is ensured through higher values than .50 of AVE [74], see Table 2. Discriminant validity is the degree to which a variable is truly distinct from other variables. Square root of AVE is higher than the inter-construct correlations except customer satisfaction to hold discriminant validity [74]. Additional evidence for discriminant validity is that indicators’ individual loadings are found to be higher than the respective cross-loadings, see Table 3.
Structural model assessment
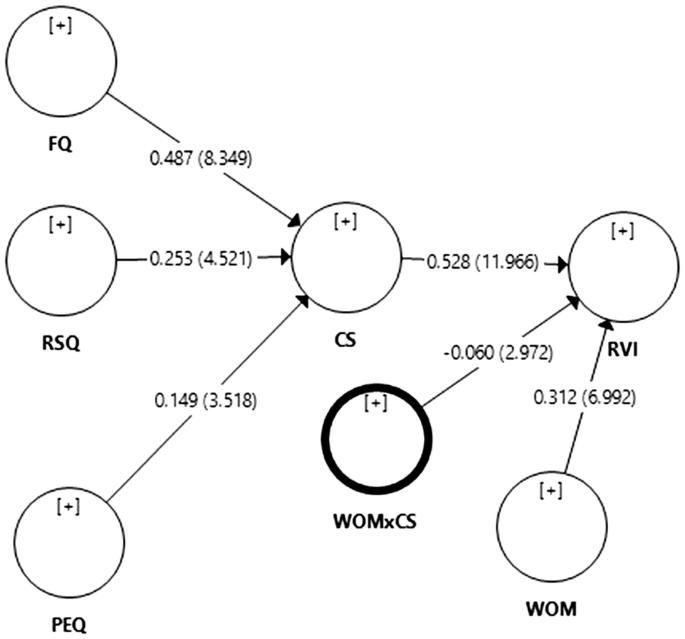
Structural model is assessed after establishing the validity and reliability of the variables. Structural model assessment includes path coefficients to calculate the importance and relevance of structural model associations. Model’s predictive accuracy is calculated through R2 value. Model’s predictive relevance is assessed with Q2, and value of f2 indicates substantial impact of the exogenous variable on an endogenous variable in PLS-SEM [85]. SEM is rigueur in validating instruments and testing linkages between constructs [87]. SMART-PLS produces reports of latent constructs correlations, path coefficients with t test values. The relationships between six constructs of food quality, restaurant service quality, physical environment quality, customer satisfaction, word-of-mouth, and revisit intention are displayed in Fig. 2 after bootstrapping. Bootstrapping is a re-sampling approach that draws random samples (with replacements) from the data and uses these samples to estimate the path model multiple times under slightly changed data constellations [88]. Purpose of bootstrapping is to compute the standard error of coefficient estimates in order to examine the coefficient’s statistical significance [89].
Bootstrapping and path coefficients
Food quality is positively associated to customer satisfaction in fast food restaurant; H1 is supported as path coefficient = .487, T value = 8.349, P value = .000. Restaurant service quality is positively associated with customer satisfaction; H2 is supported as path coefficient = .253, T value = 4.521, P value = .000. Physical environment quality is positively associated with customer satisfaction in fast food restaurant; H3 is supported as path coefficient = .149, T value = 3.518, P value = .000. Customer satisfaction is positively associated with revisit intention of customer in fast food restaurant; H4 is supported as path coefficient = .528, T value = 11.966, P value = .000. WOM positively moderates the relationship between customer satisfaction and revisit intention of customer in fast food restaurant; H8 is not supported as path coefficient = − .060, T value = 2.972, P value = .003; see Table 4.
Assessing R 2 and Q 2
Coefficient of determination R2 value is used to evaluate the structural model. This coefficient estimates the predictive precision of the model and is deliberated as the squared correlation between actual and predictive values of the endogenous construct. R2 values represent the exogenous variables’ mutual effects on the endogenous variables. This signifies the amount of variance in endogenous constructs explained by total number of exogenous constructs associated to it [88]. The endogenous variables customer satisfaction and revisit intention have R2 = .645 and .671, respectively, that assures the predictive relevance of structural model. Further the examination of the endogenous variables’ predictive power has good R2 values.
Blindfolding is to cross-validate the model’s predictive relevance for each of the individual endogenous variables with value of Stone–Geisser Q2 [90, 91]. By performing the blindfolding test with an omission distance of 7 yielded cross-validated redundancy Q2 values of all the endogenous variables [88]. Customer satisfaction’s Q2 = .457 and RVI’s Q2 = .501; this indicates large effect sizes. PLS structural model has predictive relevance because values of Q2 are greater than 0, see Table 5.
Assessing f 2
Effect size f2 is the measure to estimate the change in R2 value when an exogenous variable is omitted from the model. f2 size effect illustrates the influence of a specific predictor latent variable on an endogenous variable. Effect size f2 varies from small to medium for all the exogenous variables in explaining CS and RVI as shown Table 6.
Additionally, H5: CS mediates between food quality and RVI is supported as CS partially mediates between FQ and RVI. Variation accounted for (VAF) value indicates that 70% of the total effect of an exogenous variable FQ on RVI is explained by indirect effect. Therefore, the effect of FQ on RVI is partially mediated through CS. Similarly, the VAF value indicates that 70% of the total effect of an exogenous variable RSQ and 35% VAF of PEQ on RVI is explained by indirect effect. Therefore, the effects of RSQ and PEQ on RVI are also partially mediated through CS. H6 is supported as the effect of CS is partially mediated between RSQ and RVI of customer in fast food restaurant. H7 is supported as the effect of CS is partially mediated between PEQ and RVI of customer in fast food restaurant, see Table 7. This clearly indicates that customer satisfaction mediates between all of our exogenous variables (food quality, restaurant service quality and physical environment quality) and dependent variable revisit intention of customer in fast food restaurant [88, 92] (Additional files 1, 2 and 3).
Discussion
This is interesting to note that food quality, restaurant service quality, physical environment quality, and customer satisfaction are important triggers of revisit intention at fast food restaurants. However, surprisingly, word of mouth does not moderate the relationship of customer satisfaction with revisit intention of customer at fast food restaurant. The results of the study correspond with some previous findings [15, 29, 32, 69, 93]. Positive relationship between customer satisfaction and revisit intention is consistent with the findings of the previous studies [5, 8, 94,95,96]. Food quality is positively associated with revisit intention; this result as well corresponds to a previous study [24]. Furthermore, interior and amusing physical environment is an important antecedent of revisit intention at a fast food restaurant; this finding is congruent with previous findings [29, 70, 97, 98] and contrary to some previous studies [9, 15].
Intensified competition, industry’s volatile nature, and maturity of the business are some challenges that fast food restaurants face [5]. Amid economic crunch, competition becomes even more evident, driving fast food restaurants to look for unconventional ways to appeal the customers. In fact, these findings somehow show that significance of physical environment quality in creating revisit intention is probably lower in comparison with food quality and restaurant service quality. Nonetheless, fast food restaurant’s management should not underrate the fact that physical environment quality considerably affects the revisit intention. Due to this, the importance of physical environment quality must not be overlooked when formulating strategies for improving customer satisfaction, revisit intention and creating long-term relationships with customers.
Managerial implications
The results imply that restaurant management should pay attention to customer satisfaction because it directly affects revisit intention. Assessing customer satisfaction has become vital to successfully contest in the modern fast food restaurant business. From a managerial point of view, the results of this study will help restaurant managers to better understand the important role of food quality, restaurant service quality and physical environment quality as marketing tool to retain and satisfy customers.
Limitations
There are certain limitations with this study. This study is cross sectional, and it can be generalized to only two cities of Pakistan. Scope of research was limited as the data were collected from two cities of Pakistan (Islamabad and Rawalpindi) using convenience sampling.
Future research
A longitudinal study with probability sampling will help the researchers to comprehensively investigate the relationships among the constructs. Moreover, it would be useful for future research models to add information overload as an explanatory variable and brand image as moderating variable in the research framework. Additionally, moderation of WOM can be investigated in other relationships of conceptual model.
Conclusion
The study encircles the key triggers of customer satisfaction and revisit intention in fast food restaurants. It also offers a model that defines relationships between three factors of restaurant offer (food quality, restaurant service quality, and physical environment quality), customer satisfaction, word of mouth, and revisit intention at fast food restaurants. The model specially focuses the revisit intention as dependent variable of conceptual model despite behavior intentions. The findings suggest the revisit intention is positively associated with customer satisfaction, food quality, restaurant service quality, and physical environment quality in a fast food restaurant.
However, contrary to the findings of a previous study [99], WOM do not positively moderate between the relationship of customer satisfaction and revisit intention. The empirical findings confirm the significant impact of food quality, restaurant service quality, physical environment quality, and customer satisfaction which are important antecedents of revisit intention at fast food restaurant through mediation of customer satisfaction. Moreover, findings of the research support the assumptions of SOR theory strengthening our conceptual model which states the external stimuli (FQ, RSQ, PEQ) produced internal organism (CS) which led to the response (RVI). However; assumption of social conformity theory failed to influence the satisfied customer. In other words, customer satisfaction plays dominating role over social influence (i.e. WOM) in making revisit intention. Therefore, WOM was not able to influence the strength of relationship of CS and RVI.
Availability of data and materials
The datasets used and/or analyzed during the current study are available from the corresponding author on reasonable request.
Abbreviations
- CS:
-
Customer satisfaction
- FQ:
-
Food quality
- PEQ:
-
Physical environment quality
- RSQ:
-
Restaurant service quality
- RVI:
-
Revisit intention
- SCT:
-
Social conformity theory
- S-O-R:
-
Stimulus-organism-response
- SEM-PLS:
-
Structural equation modeling with partial least squares
- WOM:
-
Word of mouth
References
Rhou Y, Singal M (2020) A review of the business case for CSR in the hospitality industry. Int J Hosp Manag 84:102330
Berezina K, Cobanoglu C, Miller BL, Kwansa FA (2012) The impact of information security breach on hotel guest perception of service quality, satisfaction, revisit intentions and word-of-mouth. Int J Hosp Manag 24(7):991–1010
Shariff SNFBA, Omar MB, Sulong SNB, Majid HABMA, Ibrahim HBM, Jaafar ZB, Ideris MSKB (2015) The influence of service quality and food quality towards customer fulfillment and revisit intention. Can Soc Sci 11(8):138–144
Rana M, Lodhi R, Butt G, Dar W (2017) How determinants of customer satisfaction are affecting the brand image and behavioral intention in fast food industry of Pakistan. J Tour Hospit 6(316):2167-0269
Marinkovic V, Senic V, Ivkov D, Dimitrovski D, Bjelic M (2014) The antecedents of satisfaction and revisit intentions for full-service restaurants. Mark Intell Plan 32(3):311–327
Harun A, Prybutok G, Prybutok VR (2018) Insights into the antecedents of fast-food purchase intention and the relative positioning of quality. Qual Manag J 25(2):83–100
Qin H, Prybutok VR (2009) Service quality, customer satisfaction, and behavioral intentions in fast-food restaurants. Int J Qual Serv Sci 1(1):78–95
Chen JV, Htaik S, Hiele TM, Chen C (2017) Investigating international tourists’ intention to revisit Myanmar based on need gratification, flow experience and perceived risk. J Qual Assur Hosp Tour 18(1):25–44
Ali F, Amin M, Ryu K (2016) The role of physical environment, price perceptions, and consumption emotions in developing customer satisfaction in Chinese resort hotels. J Qual Assur Hosp Tour 17(1):45–70
Pareigis J, Edvardsson B, Enquist B (2011) Exploring the role of the service environment in forming customer’s service experience. Int J Qual Serv Sci 3(1):110–124
Ozdemir B, Caliskan O (2015) Menu design: a review of literature. J Foodserv Bus Res 18(3):189–206
Sadeghi M, Zandieh D, Mohammadi M, Yaghoubibijarboneh B, Nasrolahi Vosta S (2017) Investigating the impact of service climate on intention to revisit a hotel: the mediating role of perceived service quality and relationship quality. Int J Manag Sci Eng Manag 12(1):12–20
Blackston M, Lebar E (2015) Constructing consumer-brand relationships to better market and build businesses. In: Fournier S, Breazeale M, Avery J (eds) Strong brands, strong relationships. Routledge, Abingdon, p 376
Malik SA, Jaswal LH, Malik SA, Awan TM (2013) Measuring service quality perceptions of the customers of restaurant in Pakistan. Int J Qual Res 7(2):187–200
Sivadas E, Jindal RP (2017) Alternative measures of satisfaction and word of mouth. J Serv Mark 31(2):119–130
Ha Y, Im H (2012) Role of web site design quality in satisfaction and word of mouth generation. J Serv Manag 23(1):79–96
Zhang W, Yang J, Ding X-Y, Zou X-M, Han H-Y, Zhao Q-C (2019) Groups make nodes powerful: Identifying influential nodes in social networks based on social conformity theory and community features. Expert Syst Appl 125:249–258
Peri C (2006) The universe of food quality. Food Qual Prefer 17(1):3–8
Susskind AM, Chan EK (2000) How restaurant features affect check averages: a study of the Toronto restaurant market. Cornell Hotel Restaurant Adm Q 41(6):56–63
Jin N, Lee S, Huffman L (2012) Impact of restaurant experience on brand image and customer loyalty: moderating role of dining motivation. J Travel Tour Mark 29(6):532–551
Carins JE, Rundle-Thiele S, Ong DL (2020) Keep them coming back: the role of variety and aesthetics in institutional food satisfaction. Food Qual Prefer 80:103832
Josiam BM, Monteiro PA (2004) Tandoori tastes: perceptions of Indian restaurants in America. Int J Contemp Hosp Manag 16(1):18–26
Choi J, Zhao J (2010) Factors influencing restaurant selection in south florida: Is health issue one of the factors influencing consumers’ behavior when selecting a restaurant? J Foodserv Bus Res 13(3):237–251
Ryu K, Han H (2010) Influence of the quality of food, service, and physical environment on customer satisfaction and behavioral intention in quick-casual restaurants: moderating role of perceived price. J Hosp Tour Res 34(3):310–329
Deming WE (1982) Quality, productivity, and competitive position. Massachusetts Institute of Technology, Center for Advanced Engineering Study, Cambridge
Juran JM, Gryna FM, Bingham RS (1974) Quality control handbook. McGraw-Hill, Michigan
Dabholkar PA (2015) How to improve perceived service quality by increasing customer participation. Paper presented at the Proceedings of the 1990 Academy of Marketing Science (AMS) annual conference
Lai IK (2015) The roles of value, satisfaction, and commitment in the effect of service quality on customer loyalty in Hong Kong–style tea restaurants. Cornell Hosp Q 56(1):118–138
Jalilvand MR, Salimipour S, Elyasi M, Mohammadi M (2017) Factors influencing word of mouth behaviour in the restaurant industry. Mark Intell Plan 35(1):81–110
Wall EA, Berry LL (2007) The combined effects of the physical environment and employee behavior on customer perception of restaurant service quality. Cornell Hotel Restaurant Adm Q 48(1):59–69
Yuksel A, Yuksel F, Bilim Y (2010) Destination attachment: effects on customer satisfaction and cognitive, affective and conative loyalty. Tour Manag 31(2):274–284
Adam I, Adongo CA, Dayour F (2015) International tourists’ satisfaction with Ghanaian upscale restaurant services and revisit intentions. J Q Assur Hosp Tour 16(2):181–201
Baek E, Choo HJ, Yoon S-Y, Jung H, Kim G, Shin H, Kim H (2015) An exploratory study on visual merchandising of an apparel store utilizing 3D technology. J Global Fashion Mark 6(1):33–46
Wu H-C, Ko YJ (2013) Assessment of service quality in the hotel industry. J Qual Assur Hosp Tour 14(3):218–244
Pizam A, Shapoval V, Ellis T (2016) Customer satisfaction and its measurement in hospitality enterprises: a revisit and update. Int J Contemp Hosp Manag 28(1):2–35
Westbrook RA, Oliver RL (1991) The dimensionality of consumption emotion patterns and consumer satisfaction. J Consum Res 18(1):84–91
Prayag G, Hosany S, Muskat B, Del Chiappa G (2017) Understanding the relationships between tourists’ emotional experiences, perceived overall image, satisfaction, and intention to recommend. J Travel Res 56(1):41–54
Alegre J, Garau J (2010) Tourist satisfaction and dissatisfaction. Ann TTour Res 37(1):52–73
Arndt J (1967) Word of mouth advertising: a review of the literature. Advertising Research Foundation, New York
Bayus BL (1985) Word of mouth-the indirect effects of marketing efforts. J Advert Res 25(3):31–39
Harrison-Walker LJ (2001) The measurement of word-of-mouth communication and an investigation of service quality and customer commitment as potential antecedents. J Serv Res 4(1):60–75
Curina I, Francioni B, Hegner SM, Cioppi M (2020) Brand hate and non-repurchase intention: a service context perspective in a cross-channel setting. J Retail Consum Serv 54:102031
Hennig-Thurau T, Gwinner KP, Walsh G, Gremler DD (2004) Electronic word-of-mouth via consumer-opinion platforms: What motivates consumers to articulate themselves on the internet? J Interact Mark 18(1):38–52
Berger J, Schwartz EM (2011) What drives immediate and ongoing word of mouth? J Mark Res 48(5):869–880
Moliner-Velázquez B, Ruiz-Molina M-E, Fayos-Gardó T (2015) Satisfaction with service recovery: moderating effect of age in word-of-mouth. J Consum Mark 32(6):470–484
Royo-Vela M, Casamassima P (2011) The influence of belonging to virtual brand communities on consumers’ affective commitment, satisfaction and word-of-mouth advertising: the ZARA case. Online Inf Rev 35(4):517–542
Dhillon J (2013) Understanding word-of-mouth communication: a case study of banking sector in India. J Bus Manag 9(3):64–72
Chien M (2017) An empirical study on the effect of attractiveness of ecotourism destination on experiential value and revisit intention. Appl Ecol Environ Res 15(2):43–53
Abubakar AM, Ilkan M, Al-Tal RM, Eluwole KK (2017) eWOM, revisit intention, destination trust and gender. J Hosp Tour Manag 31:220–227
Chen C-F, Tsai D (2007) How destination image and evaluative factors affect behavioral intentions? Tour Manag 28(4):1115–1122
Allameh SM, Khazaei Pool J, Jaberi A, Salehzadeh R, Asadi H (2015) Factors influencing sport tourists’ revisit intentions: the role and effect of destination image, perceived quality, perceived value and satisfaction. Asia Pac J Mark Logist 27(2):191–207
Mehrabian A, Russell JA (1974) The basic emotional impact of environments. Percept Motor Skills 38(1):283–301
Zhang KZK, Benyoucef M (2016) Consumer behavior in social commerce: a literature review. Decision Support Syst 86:95–108. https://doi.org/10.1016/j.dss.2016.04.001
Lee H-J, Yun Z-S (2015) Consumers’ perceptions of organic food attributes and cognitive and affective attitudes as determinants of their purchase intentions toward organic food. Food Qual Prefer 39:259–267
Yeh C-H, Wang Y-S, Li H-T, Lin S-Y (2017) The effect of information presentation modes on tourists’ responses in Internet marketing: the moderating role of emotions. J Travel Tour Mark 34(8):1018–1032
Lim SH, Lee S, Kim DJ (2017) Is online consumers’ impulsive buying beneficial for e-commerce companies? An empirical investigation of online consumers’ past impulsive buying behaviors. Inf Syst Manag 34:85–100
Wang L, Baker J, Wakefield K, Wakefield R (2017) Is background music effective on retail websites? J Promot Manag 23(1):1–23
Ali F (2016) Hotel website quality, perceived flow, customer satisfaction and purchase intention. J Hosp Tour Technol 7(2):213–228
Wang Z, Du C, Fan J, Xing Y (2017) Ranking influential nodes in social networks based on node position and neighborhood. Neurocomputing 260:466–477
Saunders MN (2011) Research methods for business students, 5/e. Pearson Education India, Bengaluru
Flick U (2015) Introducing research methodology: a beginner’s guide to doing a research project. Sage, Thousand Oaks
Zikmund WG, Babin BJ, Carr JC, Griffin M (2013) Business research methods. Cengage Learning, Boston
Lai W-T, Chen C-F (2011) Behavioral intentions of public transit passengers—the roles of service quality, perceived value, satisfaction and involvement. Transp Policy 18(2):318–325
Widianti T, Sumaedi S, Bakti IGMY, Rakhmawati T, Astrini NJ, Yarmen M (2015) Factors influencing the behavioral intention of public transport passengers. Int J Qual Reliab Manag 32(7):666–692
Hair JF Jr, Sarstedt M, Hopkins L, Kuppelwieser VG (2014) Partial least squares structural equation modeling (PLS-SEM) An emerging tool in business research. Eur Bus Rev 26(2):106–121
Krejcie RV, Morgan DW (1970) Determining sample size for research activities. Educ Psychol Measur 30(3):607–610
Rahi S, Alnaser FM, Ghani MA (2019) Designing survey research: recommendation for questionnaire development, calculating sample size and selecting research paradigms. In: Economic and Social Development: Book of Proceedings, pp 1157–1169
Wahab S, bin Mohamad Shah MF, Faisalmein SN (2019) The relationship between management competencies and internal marketing knowledge towards internal marketing performance. Paper presented at the Proceedings of the Regional Conference on Science, Technology and Social Sciences (RCSTSS 2016)
Namkung Y, Jang S (2007) Does food quality really matter in restaurants? Its impact on customer satisfaction and behavioral intentions. J Hosp Tour Res 31(3):387–409
Liu C-H, Chou S-F, Gan B, Tu J-H (2015) How “quality” determines customer satisfaction: evidence from the mystery shoppers’ evaluation. TQM J 27(5):576–590
Meng JG, Elliott KM (2008) Predictors of relationship quality for luxury restaurants. J Retail Consum Serv 15(6):509–515
Cham TH, Lim YM, Aik NC, Tay AGM (2016) Antecedents of hospital brand image and the relationships with medical tourists’ behavioral intention. Int J Pharm Healthc Mark 10(4):412–431
Sekaran U (2006) Research methods for business: a skill building approach. Wiley, New York
Fornell C, Larcker DF (1981) Evaluating structural equation models with unobservable variables and measurement error. J Mark Res 18(1):39–50. https://doi.org/10.2307/3151312
Cronbach LJ (1951) Coefficient alpha and the internal structure of tests. Psychometrika 16(3):297–334
Simonin BL (1999) Ambiguity and the process of knowledge transfer in strategic alliances. Strateg Manag J 20(7):595–623. https://doi.org/10.1002/(sici)1097-0266(199907)20:7%3c595:aid-smj47%3e3.0.co;2-5
Robson MJ, Katsikeas CS, Bello DC (2008) Drivers and performance outcomes of trust in international strategic alliances: the role of organizational complexity. Organ Sci 19(4):647–665. https://doi.org/10.1287/orsc.1070.0329
Greene CN, Organ DW (1973) An evaluation of causal models linking the received role with job satisfaction. Adm Sci Q 18(1):95–103
Konrad AM, Linnehan F (1995) Formalized HRM structures: Coordinating equal employment opportunity or concealing organizational practices? Acad Manag J 38(3):787–820
Podsakoff PM, MacKenzie SB, Lee J-Y, Podsakoff NP (2003) Common method biases in behavioral research: a critical review of the literature and recommended remedies. J Appl Psychol 88(5):879–903. https://doi.org/10.1037/0021-9010.88.5.879
Podsakoff PM, Organ DW (1986) Self-reports in organizational research: problems and prospects. J Manag 12(4):531–544. https://doi.org/10.1177/014920638601200408
Scott SG, Bruce RA (1994) Determinants of innovative behavior: a path model of individual innovation in the workplace. Acad Manag J 37(3):580–607
Simonin BL (2004) An empirical investigation of the process of knowledge transfer in international strategic alliances. J Int Bus Stud 35(5):407–427
Lowry PB, Gaskin J (2014) Partial least squares (PLS) structural equation modeling (SEM) for building and testing behavioral causal theory: When to choose it and how to use it. IEEE Trans Prof Commun 57(2):123–146
Hair JF Jr, Hult GTM, Ringle C, Sarstedt M (2016) A primer on partial least squares structural equation modeling (PLS-SEM). Sage Publications, Thousand Oaks
Nunnally JC (1978) Psychometric theory. McGraw-Hill, New York
Gefen D, Straub D, Boudreau M-C (2000) Structural equation modeling and regression: guidelines for research practice. Commun Assoc Inf Syst 4(1):7
Hair J (2013) Using the SmartPLS software. Kennesaw State University. Powerpoint presentation/lecture
Vinzi VE, Chin WW, Henseler J, Wang H (2010) Handbook of partial least squares: concepts, methods and applications. Springer, Berlin
Geisser S (1974) A predictive approach to the random effect model. Biometrika 61(1):101–107
Stone M (1974) Cross-validatory choice and assessment of statistical predictions. J R Stat Soc Ser B (Methodol) 36:111–147
Carrión GC, Nitzl C, Roldán JL (2017) Mediation analyses in partial least squares structural equation modeling: guidelines and empirical examples. In: Latan H, Noonan R (eds) Partial least squares path modeling. Springer, Berlin, pp 173–195
Lockyer T (2003) Hotel cleanliness—How do guests view it? Let us get specific. A New Zealand study. Int J Hosp Manag 22(3):297–305
Ha J, Jang SS (2010) Perceived values, satisfaction, and behavioral intentions: the role of familiarity in Korean restaurants. Int J Hosp Manag 29(1):2–13
Ryu K, Han H, Jang S (2010) Relationships among hedonic and utilitarian values, satisfaction and behavioral intentions in the fast-casual restaurant industry. Int J Contemp Hosp Manag 22(3):416–432
Ryu K, Lee H-R, Gon Kim W (2012) The influence of the quality of the physical environment, food, and service on restaurant image, customer perceived value, customer satisfaction, and behavioral intentions. Int J Contemp Hosp Manag 24(2):200–223
Jang S, Liu Y, Namkung Y (2011) Effects of authentic atmospherics in ethnic restaurants: investigating Chinese restaurants. Int J Contemp Hosp Manag 23(5):662–680
Martín-Ruiz D, Barroso-Castro C, Rosa-Díaz IM (2012) Creating customer value through service experiences: an empirical study in the hotel industry. Tour Hosp Manag 18(1):37–53
Kuo Y-F, Hu T-L, Yang S-C (2013) Effects of inertia and satisfaction in female online shoppers on repeat-purchase intention: the moderating roles of word-of-mouth and alternative attraction. Manag Serv Qual Int J 23(3):168–187
Acknowledgements
The authors gratefully acknowledge the conducive research environment support provided by Department of Management Sciences at COMSATS University Islamabad, Wah Campus and Higher Education Commission Pakistan for provision of free access to digital library.
Funding
The authors declare that there was no source of funding for this research.
Author information
Authors and Affiliations
Contributions
RG conceptualized the study while corresponding author AR furnished the data analysis and finalized the manuscript for the submission. Both authors read and approved the final manuscript..
Corresponding author
Ethics declarations
Competing interests
The authors declare that they have no competing interests.
Additional information
Publisher's Note
Springer Nature remains neutral with regard to jurisdictional claims in published maps and institutional affiliations.
Supplementary information
Rights and permissions
Open Access This article is licensed under a Creative Commons Attribution 4.0 International License, which permits use, sharing, adaptation, distribution and reproduction in any medium or format, as long as you give appropriate credit to the original author(s) and the source, provide a link to the Creative Commons licence, and indicate if changes were made. The images or other third party material in this article are included in the article's Creative Commons licence, unless indicated otherwise in a credit line to the material. If material is not included in the article's Creative Commons licence and your intended use is not permitted by statutory regulation or exceeds the permitted use, you will need to obtain permission directly from the copyright holder. To view a copy of this licence, visit http://creativecommons.org/licenses/by/4.0/.
About this article

Cite this article
Rajput, A., Gahfoor, R.Z. Satisfaction and revisit intentions at fast food restaurants. Futur Bus J 6, 13 (2020). https://doi.org/10.1186/s43093-020-00021-0
Received:
Accepted:
Published:
DOI: https://doi.org/10.1186/s43093-020-00021-0