
Abstract
This article addresses the problem of pricing European options when the underlying asset is not perfectly liquid. A liquidity discounting factor as a function of market-wide liquidity governed by a mean-reverting stochastic process and the sensitivity of the underlying price to market-wide liquidity is firstly introduced, so that the impact of liquidity on the underlying asset can be captured by the option pricing model. The characteristic function is analytically worked out using the Feynman–Kac theorem and a closed-form pricing formula for European options is successfully derived thereafter. Through numerical experiments, the accuracy of the newly derived formula is verified, and the significance of incorporating liquidity risk into option pricing is demonstrated.
Introduction
Although the pioneering Black–Scholes model is still widely used in practice nowadays, it is actually far from being adequate to describe real markets because of some idealized assumptions. One typical example is the assumed perfect liquidity of the underlying financial market, which allows investors to trade the underlying very rapidly without or only at a minimal cost. However, it is widely acknowledged that not all securities are perfectly liquid, even if they are traded in a well-established financial market. In fact, every security suffers from the so-called liquidity risk, and this source of uncertainty is considered as one of the most critical risks in today’s finance industry. Although liquidity has multiple facets, a large amount of economic research has focused on investigating the effects of liquidity risk on asset prices (Acharya and Pedersen 2005; Liu 2006), while a robust model that appropriately captures the impact of liquidity risk on derivative pricing is yet to be proposed. Consequently, a significant challenge for risk managers is to understand how liquidity risk influences the pricing and hedging of derivatives.
Although exploring the effects of liquidity risk on derivative pricing has started gaining attention very recently, the relevant research is still at its infant stage, and there is even no consensus reached on the definition of liquidity risk. One strand of authors believe that liquidity risk mainly arises from the price impact caused by traders’ actions. For instance, Liu and Yong (2005) obtained a generalized Black–Scholes pricing equation under the assumption that the trader’s activity has an impact on the underlying price, and a similar non-linear pricing equation was also presented by Loeper (2018). Another popular approach to measure liquidity is to use the spread between the bid and ask prices, and the illiquid assets are deemed to be those with a high spread Leippold and Schärer (2017). Furthermore, illiquidity of stocks is also regarded by a few authors as the inability to trade at all Ludkovski and Shen (2013), while many others hold a different view that trading of illiquidity shocks is possible but the trading prices should be discounted (Subramanian and Jarrow 2001; Longstaff et al. 2005). A typical example was presented by Hyejin and Zhang (2018), who followed the utility maximization approach to price options using a discounting factor as a function of the trader’s trading speed, an approach firstly proposed by Cetin et al. (2004).
Recently, several empirical studies have demonstrated a common feature in liquidity, i.e., market-wide liquidity influences the stock returns. For example, under the assumption that the market plays the role of a central counterparty and trades with the investors, a single market stress parameter was introduced by Madan and Cherny (2010) to describe market illiquidity, based on which a theoretical framework was developed for derivative pricing. This framework was further extended by Corcuera et al. (2010) and Albrecher et al. (2013), who calibrated the market stress parameter with options written on S&P 500 index, and the results showed that the market stress parameter exhibits a term structure and displays a mean-reverting behavior.
Motivated by the importance of market liquidity, a number of authors have adopted a market-wide liquidity based discounting factor to investigate the impact of liquidity risk on derivative prices, with the discounting factor being a quantity that is to be multiplied by the liquid asset price to obtain the liquidity-adjusted asset price. This originates from the work of Mandelbrot’s (1963) and Fama’s (1965), using the idea that that the volatility of an asset changes over time and experiences jumps in an illiquid market. The framework was firstly proposed by Brunetti and Caldarera (2004), with liquidity risk modeled through a liquidity discounting factor which was incorporated into the so-called stock demand function, and it was further extended by Feng et al. (2014) through introducing a stochastic market-wide liquidity. In other words, their model is similar to a stochastic volatility model where the stochastic nature of the volatility is assumed to be driven by the market-wide liquidity. This framework was also adopted by Li et al. (2018a) and Li et al. (2018b) for the pricing of geometric Asian and quanto options, respectively, and a similar approach was used to investigate the impact of liquidity risk on discrete barrier option prices under a jump-diffusion model (Li et al. 2019). Recently, the pricing of various types of derivatives including American options under the same framework is further considered by Zhang et al. (2019).
Following Brunetti and Caldarera (2004) and Feng et al. (2014, 2016), the liquidity-adjusted underlying price in this paper, is assumed to be dependent on three random variables, i.e., the liquid underlying price, market-wide liquidity and liquidity discounting factor. A mean-reverting stochastic process is selected to describe market-wide liquidity, which is consistent with existing empirical evidence, and the liquidity discounting factor is made as a function of both market-wide liquidity and a parameter that governs the sensitivity of the underlying price to market liquidity. Our proposed model allows for a general correlation structure among different stochastic processes so that it is much more flexible and closer to reality, which distinguishes our work from those presented by Brunetti and Caldarera (2004) and Feng et al. (2014). Of course, although the introduction of a general correlation structure enhances the modeling quality, it poses a significant obstacle in seeking analytical solutions. Fortunately, we have managed to derive a closed-form pricing formula for European options, utilizing the characteristic function approach, which is derived using the Feynman–Kac theorem.Footnote 1 Finally, the newly derived formula is verified with Monte-Carlo simulation, and the impact of liquidity risk as well as the general correlation structure on option prices is also investigated through numerical experiments.
The organization of the rest of the paper is as follows. “The modeling framework” section introduces the modeling dynamics. In “A closed-form pricing formula” section, we express the option pricing formula in terms of a characteristic function, which is then analytically obtained utilizing the Feynman–Kac formula. “Numerical experiments and discussions” section presents the results of numerical experiments to demonstrate the validity and various properties of the new formula. “Conclusion” section concludes the article.
The modeling framework
We consider a filtered probability space \((\Omega ,\mathcal {F},P,\mathcal {F}_{t\in [0,T]})\) that models the uncertainty in the economy with P as a probability measure either statistical or empirical. T as a finite time horizon. All stochastic processes involved in this article are assumed to be \(\mathcal {F}_{t\in [0,T]}\) adapted. We assume that stocks are not perfectly liquid and this illiquidity arises due to short supply or surplus in the market.
Following Brunetti and Caldarera (2004) and Feng et al. (2014), we now present how to incorporate liquidity risk into the stock price dynamics utilizing a liquidity discounting factor \(\gamma _t\).
If we assume a fixed supply, \(\overline{S}\), for a stock, the demand function \(D(S_t,\gamma _t,I_t)\) for this stock is given by
where \(S_t\) is the stock price, \(I_t\) is the information process, and g is a smooth, strictly increasing function and \(\nu\) is a positive constant. Under the condition of market clearance, the market clearing price S of the stock should satisfy
which leads to the following market clearing price S for the stock
using the invertibility of g (Brunetti and Caldarera 2004). Clearly, when there is no discounting based on market illiquidity, i.e., \(\gamma =1\), the dynamics of S should degenerate to the Black–Scholes (B–S) model, i.e.,
Here, \(S_t^{BS}\) represents the B-S stock price, which we call the benchmark model, i.e., it is perfectly liquid, and is governed by the following stochastic process
with \(\mu _S\) denoting the drift and \(B_t^{S}\) denoting a Wiener process under the measure P. Therefore, the price of the underlying stock affected by market liquidity can be formulated as
Finally, with the price of the asset being sensitive to market liquidity, we should define a liquidity discounting factor \(\gamma _t\), which should be a function of market liquidity \(L_t\) and a factor modeling the sensitivity of the asset price to the level of market liquidity denoted by \(\beta\) with \(\beta >0\). The process \(\gamma _t\) captures the influence of liquidity on asset prices. We follow Brunetti and Caldarera (2006) to define the following dynamics of the liquidity discounting factor \(\gamma _t\),
with \(dB^{\gamma }_tdB^{S}_t=\rho _1dt\). From Equations (1), (2) and (3), we getFootnote 2 the following dynamics for the illiquid asset price \(S_t\):
Following Feng et al. (2014), we assume \(L_t\) is the level of market liquidity, governed by a mean-reverting stochastic process
where \(\tilde{\alpha }\), \(\tilde{\theta }\) and \(\xi\) are respectively the mean-reversion speed, equilibrium level and volatility of market liquidity, and \(B_t^{L}\) is a Wiener process under P measure.
It is clear that the proposed model is similar to a stochastic volatility model in the sense that the stochastic nature of the volatility is assumed to be driven by the market-wide liquidity. However, in contrast to stochastic volatility model, the key factor that makes our model different is that \(L_t\) can take negative values as well depending upon whether the underlying asset is in short supply or surplus.
Further, we assume a general correlation structure among the three Brownian motions
Remark 2.1
It should be particularly emphasized that our model dynamics are much more general than those discussed by Brunetti and Caldarera (2004) and Feng et al. (2014) in the sense that they assumed \(B_t^S\) to be independent of the other two Brownian motions while such correlation is captured by our model. Our model financially makes more sense from two aspects; a) it is customary to define an aggregate liquidity measure as an average of the specific liquidity measures of each stock in the sample. Since \(L_t\) is the level of market liquidity, i.e., a combination of liquidity levels of stocks, it should be correlated with each and every stock in the market, no matter the stock is perfectly liquid or illiquid. This motivates the inclusion of the coefficient \(\rho _2\), and b) as the liquidity discounting factor is a stock-specific factor, it should be correlated with the dynamics of that particular stock price. With a general dependence structure, it of course provides more flexibility, while it also adds significantly extra difficulty in deriving analytical solutions. Albeit difficult, we are still able to produce a closed-form European option pricing formula, and the details are presented in the next section.
To price options we need to determine an equivalent martingale pricing measure. Since the underlying asset is illiquid, the market is incomplete because an investor cannot quickly trade without any additional cost. There are infinitely many equivalent martingale pricing measures, since our market is incomplete. Following Bingham and Kiesel (1998) which illustrate that all possible martingale measures can be characterized by their Girsanov identities, we select a suitable equivalent martingale measure from set of all such measures. Using the Radon-Nikodym derivative, we can obtain an equivalent martingale pricing measure as follows
Consequently, Girsanov theorem implies that the Brownian motions are changed under the new measure Q as follows:
where \(\lambda _1\) and \(\lambda _2\) should satisfy
Therefore, the stock price dynamics can be written under Q as
with
Following the idea of Heston (1993), we assume that the market price of liquidity risk is proportional to liquidity, i.e., \(k\beta L_t\) as a means to achieve tractabilityFootnote 3. As a result, we can re-write the dynamics as followsFootnote 4:
with
where
A closed-form pricing formula
This section presents the specific procedures to derive an analytical formula for European option prices under the dynamics of the liquidity-adjusted underlying price proposed in Section 2.
A general pricing formula
Under the risk-neutral martingale measure Q, the price of a European call option with maturity T and strike price K, can be calculated as
where \(I_{A}\) is the indicator function of the set A. In order to simplify the first term in Eq. (8), we use \(S_t\) as a numeraire and introduce a new measure \(Q_1\) as follows:
Under the new measure \(Q_1\), the option price in Eq. (8) can be reformulated as
where \(F_1\) and \(F_2\) can further be simplified using the characteristic function as follows:
with \(j=\sqrt{-1}\) and,
where \(X_t=\ln (S_t)\) denote the log-price.
Further, note that
The only remaining unknown quantity to obtain a closed-form pricing formula is the characteristic function \(f_2(\eta ,T)\). We analytically work out the characteristic function of \(X_T\) by applying the Feynman–Kac theorem, the details of which are provided in the next subsection.
The characteristic function of \(X_T\)
Define \(h(\eta ,t,T,x_t,l_t)=E^{Q}(e^{i\eta X_T}\mid x_t,l_t)\). Using the Feynman–Kac theorem, the partial differential equation (PDE) governing \(h(\eta ,t,T,x_{t},l_{t})\) is given by
with the terminal condition \(h|_{t=T}=e^{i\eta x_{T}}\). We assume that \(h(\eta ,t,T,x_{t},l_{t})\) is of the following affine form,
Substituting (14) into (13) yields the following system of ordinary differential equations (ODEs) governing the functions \(A(t,T;\eta )\), \(B(t,T;\eta )\) and \(C(t,T;\eta )\),
with \(A(T,T)=B(T,T)=C(T,T)=0\). Obviously, the ODE governing C(t, T) is a Riccati equation with constant coefficients and hence can be solved easily, with the corresponding solution given by
where \(\delta _1=\sqrt{(\alpha -i\eta \rho _3\xi \beta )^2+\xi ^2\beta ^2(i\eta +\eta ^2)},~\delta _2=\frac{\alpha -i\eta \rho _3\xi \beta }{\delta _1}\). If we further substitute C(t, T) from Eq. (18) into Eq. (16), the resulting equation is a first-order linear homogeneous differential equation whose solution can be straightforwardly derived as
where \(\delta _3=-(2\alpha \theta +2i\rho _2\xi \sigma \eta )(\alpha -i\eta \rho _3\xi \beta )+2\xi ^2\rho _1\sigma \beta (i\eta +\eta ^2),~~\delta _4=-(2\alpha \theta +2i\rho _2\xi \sigma \eta )\). Finally, A(t, T) can be worked out by direct integration. It should be remarked that as the Ricatti equations admit analytical solutions, they are much more efficient to compute than using purely numerical approaches.
Till now, we have successfully derived a closed-form pricing formula for European options, when the underlying price needs to be adjusted due to liquidity issues. In the next section, the accuracy of the newly derived formula will be verified through numerical experiments, and the influence of liquidity on option prices will also be shown.
Greeks
Since the call option price is derived in closed-form, it is therefore possible to differentiate the price and obtain the closed-form expression for the Greeks. In this subsection, we derive the option sensitivities, the Greeks, for our modeling framework.
Note that the Greek with respect to any parameter y usually involves the first or second order derivative of \(F_1\) and \(F_2\), which are given by (for \(i=1,2\))
Delta for a European call is
since \(\frac{\partial f_1(\eta ,T)}{\partial x}=j\eta f_1(\eta ,T)=j\eta e^{-r(T-t)-x}f_2(\eta -j,T)\) implies \(\frac{\partial F_1}{\partial x}=\frac{Ke^{-r(T-t)}}{S}\frac{\partial F_2}{\partial x}\).
We can then express Gamma as
The Greek, Rho, is given by
where, for \(i=1,2\),
with
and
where \(\frac{\partial A(\eta ;t,T)}{\partial r}\) can be obtained by differentiating the solution of Eq. (17) with respect to r.
The Greek, Theta, is given by
where, for \(i=1,2\),
with
and
where \(\frac{\partial A}{\partial t},\frac{\partial B}{\partial t}\) and \(\frac{\partial C}{\partial t}\) are given in Eqs. (17), (16) and (15) respectively.
In the Heston model, both initial volatility \(v_0\) and long-term mean of the volatility, say \(\omega\), impacts variance. Therefore, to obtain sensitivities with respect to volatility, Zhu (2010) defined two vegas, one based on \(\sqrt{v_0}\) and the other based on \(\sqrt{\omega }\). On the same lines, we define two sensitivities to the liquidity level, namely,
The Greek, Vega1(\(\mathcal {V}_1\)), is given by
where \(\frac{\partial F_1}{\partial l_t}\) and \(\frac{\partial F_1}{\partial l_t}\) involve \(\frac{\partial f_1}{\partial l_t}\) and \(\frac{\partial f_2}{\partial l_t}\) which are given by
Similarly, the Greek, Vega2 (\(\mathcal {V}_2\)), is given by
where \(\frac{\partial F_1}{\partial \theta }\) and \(\frac{\partial F_1}{\partial \theta }\) involve \(\frac{\partial f_1}{\partial \theta }\) and \(\frac{\partial f_2}{\partial \theta }\) which are given by
with
and \(\frac{\partial A(\eta ;t,T)}{\partial \theta }\) can be obtained by differentiating the solution of Eq. (17).
It should be remarked here that although any mathematical model needs to go through a calibration process before it can be applied in practice, the main purpose of this paper is to derive an analytical option pricing formula when there is a more general correlation structure among different stochastic processes than that presented by Brunetti and Caldarera (2004) and Feng et al. (2014), so that the model is much more flexible and closer to reality, while the efficiency of the calibration process can still be maintained. Moreover, the empirical study carried out by Feng et al. (2014) has already demonstrated the usefulness of a simplified model, and thus our model should provide a better performance as the model adopted by Feng et al. (2014) is actually a special case of ours.
Numerical experiments and discussions
In this section, the results of numerical experiments are presented to illustrate various properties of the newly derived formula. Firstly, although the obtained pricing formula is in closed-form, a comparison of option prices produced by the formula (our prices) with those obtained from Monte–Carlo simulation (MC prices) is needed to give a sense of correctness of the formula. Also, our model will be compared with the Black–Scholes model and other existing models to demonstrate the significance and economic consequences of incorporating liquidity risk into the option pricing framework. The sensitivity of option prices to various parameters is also studied to show how these parameters affect option prices.
In the following, unless otherwise stated, the values of the parameters chosen to achieve the goals mentioned above are listed as follows. The long-term mean \(\theta\), the mean-reverting speed \(\alpha\) and the volatility \(\xi\) of the market liquidity level are set as 0.3, 0.2 and 0.9, respectively, while the initial level of liquidity, i.e., \(L_0\) is chosen to be 0.3. The parameter \(\beta\) that governs the sensitivity of the underlying asset to market liquidity is allocated a value of 0.5. Moreover, the risk-free interest rate r, the initial underlying price S0, and the strike price K for the option are respectively 0.01, 100, 110, with the time to expiry T being 1. All of the three correlation coefficients, \(\rho _i,~i=1,2,3\), default as 0.2.
Table 1 presents the comparison of our prices and MC prices accompanied by a 98% confidence interval across different values of moneyness \(\frac{K}{S_0}\) and maturity T. We observe that our pricing formula is accurate as the two prices are close to each other across all scenarios and the maximum relative error (RE) between the two prices is 0.69%, and all of our prices fall within the corresponding 98% confidence interval. Moreover, the correctness of our formula is further verified after observing that the average RE is 0.35%, 0.25% and 0.42% for at-the-money, in-the-money and out-of-money options, respectively.
With the confidence in our pricing formula, we now present the comparison of our model and the model considered by Feng et al. (2014) (Feng’s model) as well as the Black–Scholes model to demonstrate the impact of the general dependence structure and liquidity risk. Figure 1a shows the sensitivity of our price with respect to the correlation coefficient \(\rho\), where we select \(\rho\) such that \(\rho _1=\rho _2=\rho\). It shows that our price when \(\rho =0\) is equal to the price under Feng’s model, which is consistent with the fact that Feng’s model is a degenerate case of our proposed model. Further, Fig. 1b presents the comparison of option prices obtained from our model, Feng’s model, and the Black–Scholes model. Clearly, call option prices when taking into account liquidity risk are significantly higher than those under the Black–Scholes model when the underlying market is perfectly liquid, which can be explained as follows. Note that \(L_t>0\) (\(L_t<0\)) indicates that the market is in short supply (surplus) while \(L_t=0\) indicates the perfect level of liquidity. Hence, the value of \(|L_t|\) increases at lower levels of liquidity of the stock, which potentially depicts a substantial price response with only moderate trading volumes. Thus, holding an imperfectly liquid stock results in a premium (positive or negative depending on whether the stock is in short supply or surplus). Consequently, the writer of a call option would need to purchase the underlying asset; illiquid assets would cost him/her more compared to the case if the underlying is perfectly liquid. Therefore, the writer would naturally expect a higher option premium to compensate for liquidity risk of the underlying asset.

Comparison with existing models
To further check the statistical significance of the difference between our price and Feng’s price, we perform a one-sided Student’s t-test with the hypothesis, \(H_0: E= 0,~H_1: E\ge 0\), where E is the difference in our price and Feng’s price. We find that the sample mean is 1.269 and the test-statistic value is \(t = 30.391\) with 15 degrees of freedom, which results into a p-value nearly 0, with a 95% confidence interval being \((1.195754,\infty )\). Thus, this rejects the null hypothesis and confirms that our prices are significantly higher than Feng’s prices, demonstrating the importance to incorporate a general correlation structure to provide more flexibility.
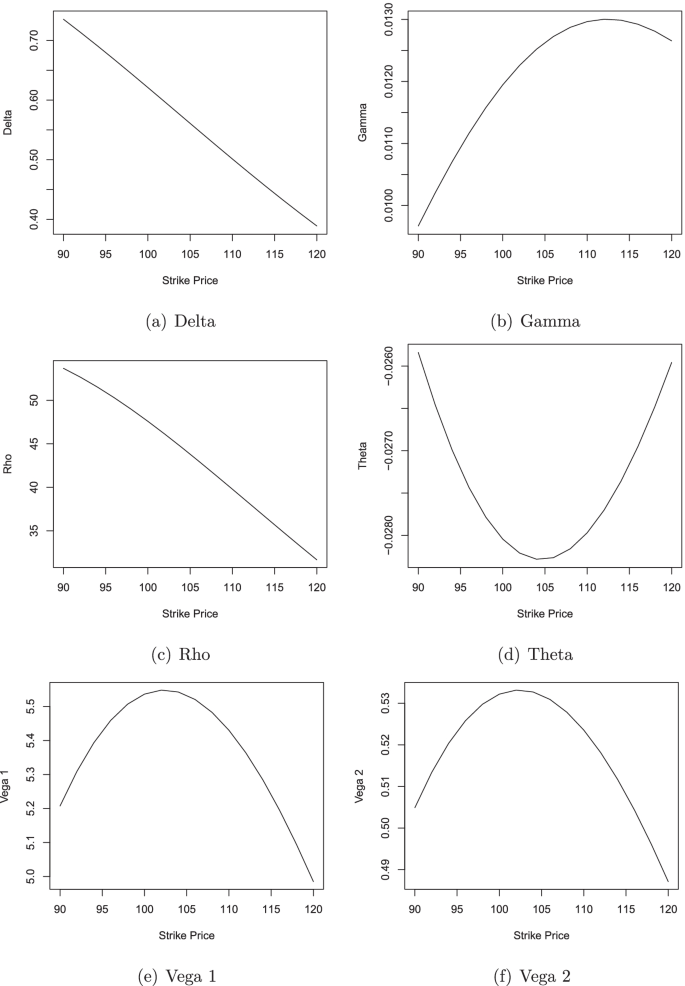
Figure 2 presents the variation of the various Greeks, namely Delta, Gamma, Rho, Theta, Vega1(\(\mathcal {V}_1\)) and Vega2(\(\mathcal {V}_2\)), of a call option with the strike price. In Fig. 2a, Delta is negative, which implies that a long (short) position in a call (put) option with liquidity risk must be hedged through holding a long (short) position in the underlying illiquid stock. Fig. 2b presents Gamma of the option and a small positive value of Gamma implies that Delta is changing slowly, which further implies that less frequent changes in the position are required to keep our position Delta neutral. As shown in Fig. 2c, Rho is actually a decreasing function of the strike price, which can be understood from the fact that the call option price would be closer to zero when the strike is large, implying that the influence of the interest rate on option prices would be small. In Fig. 2d, we present Theta per calendar day, i.e., the formula for Theta divided by 365. We observe that Theta is negative, which is usually the case for an option, since an option would lose its time value as time passes. It is also interesting to notice that both Vega1 and Vega2 are higher when the option is at the money, while they are lower when the option is either in the money or out of money. The main explanation for this phenomenon is that the payoff function would have a more significant impact on option prices when the option is in the money or out of money, since the call option is more likely to be exercised and expire worthless when the option is in the money and out of money, respectively.
Greeks

Sensitivity of the option prices with respect to correlation coefficients
Figure 3 illustrates how sensitive the liquidity-adjusted option prices are against the change of the correlation coefficients among the three stochastic factors, i.e., the underlying price, market liquidity, and liquidity discount factor. As expected, option prices increase with each of the correlation coefficients \(\rho _i,~i=1,2,3\). We observe that the impact of \(\rho _1\), i.e., the correlation coefficient between the stock price and the discount factor, is more significant as compared to the other two correlation coefficients, i.e., \(\rho _2\) and \(\rho _3\). A larger value of \(\rho _2\) means higher value of market liquidity \(|L_t|\) (which implies lower levels of liquidity) and higher stock price, which in turn increases the call option price since the writer of the option has to pay higher price to purchase the stock from the market. Finally, a larger value of \(\rho _3\) means higher value of market liquidity \(|L_t|\) (which implies lower levels of liquidity) and lower values of the discount factor, which leads to a higher option price since small \(\gamma _t\) gives a higher stock price compared to the perfectly liquid stock.
In contrast to Fig. 3, where we presented the sensitivity against each correlation coefficient when the other two correlation coefficients were non-zero, Fig. 4 displays the marginal impact of \(\rho _1\) and \(\rho _2\) for different values of moneyness when other correlation co-efficients are zero. Depicted in Fig. 4a is that \(\rho _1\) has a significant impact on option prices across all the scenarios that include at-the-money, in-the-money and out-of-money, while the option price appears to be stable with respect to \(\rho _2\) shown in Fig. 4b. Of course, this does not mean that the introduction of \(\rho _2\) is meaningless, as one can clearly observe from Fig. 3 that the effect of \(\rho _2\) can not be neglected when other correlation coefficients are non-zero. A similar conclusion could also be drawn from Fig. 5.

Marginal Impact of \(\rho _1\) and \(\rho _2\)

Sensitivity of the option prices with respect to correlation coefficients
Conclusion
In this article, the pricing problem of European options is studied when the underlying asset is subject to liquidity risk. By making market liquidity and liquidity discounting factor as random variables, the dynamics of liquidity-adjusted underlying prices are firstly obtained, and a general correlation structure among the random variables is specified. A closed-form pricing formula for European options is presented under the proposed liquidity-adjusted model. It is also demonstrated through numerical experiments that incorporating liquidity risk has a significant influence on option prices, and a general correlation structure among stochastic factors provides more flexibility.
Availability of data and materials
Not applicable.
Notes
The Fourier transform, i.e., the characteristic function of the density method is one of the widely used and well understood mathematical techniques used in finance. The use of this method in finance can be dated back to Heston (1993), who obtained an analytical pricing formula for the price of European options under stochastic volatility. Utilizing a variant of L\(\acute{e}\)vy’s inversion theorem, the resulting formula is in the form of the difference of two Fourier integrals involving the characteristic function, which is then derived by solving the PDE obtained using the Feynman–Kac theorem. Since then, Fourier inversion methods became a very active field of research in finance.
See “Appendix”.
The main reason for such an assumption is for the tractability. The analytical tractability is actually very essential in finance practice, since model calibration with a large amount of real market data is a time-intensive process and it is even not possible to carry out empirical studies without analytical solutions. The availability of an analytical pricing formula can be extremely important for the efficient application of the proposed model in practice, especially in the recent trend of algorithmic trading. On the other hand, by the definition of “market price of risk”, it is actually very reasonable to assume that it is proportional to a measure of liquidity itself, in addition to some other simple forms one may choose (Feng et al. 2014; Heston 1993; Zhang et al. 2019).
It should be pointed out here that our dynamics do not fall under the category of linear-quadratic diffusion models defined in Cheng and Scaillet (2007) because of the following two reasons; (a) Eq. (3) indicates that \(d\gamma _t=(-\beta L_t+\frac{1}{2}\beta ^2L_t^2)\gamma _tdt-\beta L_t\gamma _tdB_{t}^{\gamma }\) involves a cubic term in the drift factor, which violates the requirement of linear-quadratic diffusion models, and (b) the dynamics under the measure Q, i.e., Eqs. (6) and (7), contain more Brownian motions than the dimension of the dynamics, which does not meet the requirement for being a linear-quadratic diffusion model.
References
Acharya VV, Pedersen LH (2005) Asset pricing with liquidity risk. J Financ Econ 77(2):375–410
Albrecher H, Guillaume F, Schoutens W (2013) Implied liquidity: model sensitivity. J Empir Financ 23:48–67
Brunetti C, Caldarera A (2004) Asset prices and asset correlations in illiquid markets. Available at SSRN 625184
Cetin U, Jarrow RA, Protter P (2004) Liquidity risk and arbitrage pricing theory. Finance Stochast 8(3):311–341
Cheng P, Scaillet O (2007) Linear-quadratic jump-diffusion modeling. Math Financ 17(4):575–598
Corcuera JM, Guillaume F, Madan DB, Schoutens W (2010) Implied liquidity-towards stochastic liquidity modeling and liquidity trading. Available at SSRN 1761253
Fama EF (1965) The behavior of stock-market prices. J Bus 38(1):34–105
Feng S-P, Hung M-W, Wang Y-H (2014) Option pricing with stochastic liquidity risk: theory and evidence. J Financ Mark 18:77–95
Feng S-P, Hung M-W, Wang Y-H (2016) The importance of stock liquidity on option pricing. Int Rev Econ Finance 43:457–467
Heston SL (1993) A closed-form solution for options with stochastic volatility with applications to bond and currency options. Rev Financ Stud 6(2):327–343
Hyejin K, Zhang H (2018) Option pricing for a large trader with price impact and liquidity costs. J Math Anal Appl 459(1):32–52
Leippold M, Schärer S (2017) Discrete-time option pricing with stochastic liquidity. J Bank Finance 75:1–16
Li Z, Zhang W-G, Liu Y-J (2018) Analytical valuation for geometric asian options in illiquid markets. Physica A 507:175–191
Li Z, Zhang W-G, Liu Y-J (2018) European quanto option pricing in presence of liquidity risk. N Am J Econ Finance 45:230–244
Li Z, Zhang W-G, Liu Y-J, Zhang Y (2019) Pricing discrete barrier options under jump-diffusion model with liquidity risk. Int Rev Econ Finance 59:347–368
Liu H, Yong J (2005) Option pricing with an illiquid underlying asset market. J Econ Dyn Control 29(12):2125–2156
Liu W (2006) A liquidity-augmented capital asset pricing model. J Financ Econ 82(3):631–671
Loeper G et al (2018) Option pricing with linear market impact and nonlinear Black–Scholes equations. Ann Appl Probab 28(5):2664–2726
Longstaff FA, Mithal S, Neis E (2005) Corporate yield spreads: default risk or liquidity? New evidence from the credit default swap market. J Financ 60(5):2213–2253
Ludkovski M, Shen Q (2013) European option pricing with liquidity shocks. Int J Theor Appl Finance 16(07):1350043
Madan DB, Cherny A (2010) Markets as a counterparty: an introduction to conic finance. Int J Theor Appl Finance 13(08):1149–1177
Mandelbrot B (1963) The variation of certain speculative prices. J Bus 36:394–419
Subramanian A, Jarrow RA (2001) The liquidity discount. Math Financ 11(4):447–474
Zhang Y, Ding S, Duygun M (2019) Derivatives pricing with liquidity risk. J Futur Mark 39(11):1471–1485
Acknowledgements
The authors would like to gratefully acknowledge anonymous referees’ constructive comments and suggestions, which greatly help to improve the readability of the manuscript.
Funding
The second author gratefully acknowledges the financial support for a three-year project funded by the ARC (Australian Research Council funding scheme DP170101227), with which first author’s visiting fellowship was provided for his visit to UoW between Jan 2019 and Dec 2019. The third author would also like to gratefully acknowledge the financial support provided by the National Natural Science Foundation of China (No. 12101554) and the Fundamental Research Funds for Zhejiang Provincial Universities (No. GB202103001).
Author information
Authors and Affiliations
Contributions
PP helped to conceive and design the study, carried out the analysis and drafted the manuscript. SZ helped to conceive and design the study, and coordinated the research activities. XH helped to conceive and design the study as well as finalize the analysis. All authors read and approved the final manuscript.
Corresponding author
Ethics declarations
Competing interests
The authors declare that they have no competing interests.
Additional information
Publisher's Note
Springer Nature remains neutral with regard to jurisdictional claims in published maps and institutional affiliations.
Appendix
Appendix
Applying the product rule for stochastic differentiation together with Equation (2) yields
Using Eq. (3) and Ito’s lemma, we have
Substituting the above in Eq. (24) and using Eq. (1), we have
Rights and permissions
Open Access This article is licensed under a Creative Commons Attribution 4.0 International License, which permits use, sharing, adaptation, distribution and reproduction in any medium or format, as long as you give appropriate credit to the original author(s) and the source, provide a link to the Creative Commons licence, and indicate if changes were made. The images or other third party material in this article are included in the article's Creative Commons licence, unless indicated otherwise in a credit line to the material. If material is not included in the article's Creative Commons licence and your intended use is not permitted by statutory regulation or exceeds the permitted use, you will need to obtain permission directly from the copyright holder. To view a copy of this licence, visit http://creativecommons.org/licenses/by/4.0/.
About this article

Cite this article
Pasricha, P., Zhu, SP. & He, XJ. A closed-form pricing formula for European options in an illiquid asset market. Financ Innov 8, 30 (2022). https://doi.org/10.1186/s40854-022-00337-6
Received:
Accepted:
Published:
DOI: https://doi.org/10.1186/s40854-022-00337-6