
Abstract
The generation of synthetic data can be used for anonymization, regularization, oversampling, semi-supervised learning, self-supervised learning, and several other tasks. Such broad potential motivated the development of new algorithms, specialized in data generation for specific data formats and Machine Learning (ML) tasks. However, one of the most common data formats used in industrial applications, tabular data, is generally overlooked; Literature analyses are scarce, state-of-the-art methods are spread across domains or ML tasks and there is little to no distinction among the main types of mechanism underlying synthetic data generation algorithms. In this paper, we analyze tabular and latent space synthetic data generation algorithms. Specifically, we propose a unified taxonomy as an extension and generalization of previous taxonomies, review 70 generation algorithms across six ML problems, distinguish the main generation mechanisms identified into six categories, describe each type of generation mechanism, discuss metrics to evaluate the quality of synthetic data and provide recommendations for future research. We expect this study to assist researchers and practitioners identify relevant gaps in the literature and design better and more informed practices with synthetic data.
Introduction
Tabular data consists of a database structured in tabular form, composed of columns (features) and rows (observations) [1]. It is one of the most commonly used data structures within a wide range of domains. However, ML techniques developed for tabular data can be applied to any type of data; input data, regardless of its original format, can be mapped into a manifold, lower-dimensional abstraction of the input data and mapped back into its original input space [2, 3]. This abstraction is often referred to as embeddings, encodings, feature space, or latent space. In this paper, we will refer to this concept as latent space.
Synthetic data is obtained from a generative process based on properties of real data [4]. The generation of synthetic data is essential for several objectives. For example, it is used as a form of regularizing ML classifiers (i.e., data augmentation) [5]. One form of anonymizing datasets is via the production of synthetic observations (i.e., synthetic data generation) [6]. In settings where only a small portion of training data is labeled, some techniques generate artificial data using both labeled and unlabeled data with a modified loss function to train neural networks (i.e., semi-supervised learning) [7]. In imbalanced learning contexts, synthetic data can be used to balance the target classes’ frequencies and reinforce the learning of minority classes (i.e., oversampling) [8]. Some active learning frameworks use synthetic data to improve data selection and classifier training [9]. Other techniques employ data generation to train neural networks without labeled data (i.e., self-supervised learning) [10].
The breadth of these techniques spans multiple domains, such as facial recognition [11], Land Use/Land Cover mapping [12], medical image processing [13], Natural Language Processing (NLP) [14] or credit card default prediction [15]. Finding appropriate data generation techniques varies according to the domain and data type. In addition, several synthetic data generation methods are specific to the domain, data type, or target ML task. Generally, these methods rely on the domain data’s structure and are not easily transferable to tabular data.
Overall, synthetic data generation techniques for tabular data are not as explored as image or text data, despite their popularity and ubiquity [16]. Furthermore, these techniques are invariant to the original data format; they can be applied to both the latent space [3] or tabular data. On one hand, data generation in the latent space uses a generative model to learn a manifold, lower-dimensional abstraction over the input space [2]. At this level, any tabular data generation mechanism can be applied and reconstructed into the input space if necessary. On the other hand, synthetic data generation on tabular data can be applied to most problems. Although, the choice of generation mechanism depends on (1) the importance of the original statistical information and the relationships among features, (2) the target ML task, and (3) the role synthetic data plays in the process (i.e., anonymization, regularization, class balancing, etc.). For example, when generating data to address an imbalanced learning problem (i.e., oversampling), the relationships between the different features are not necessarily kept, since the goal is to reinforce the learning of the minority class by redefining an ML classifier’s decision boundaries. If the goal is to anonymize a dataset, perform some type of descriptive task, or ensure consistent model interpretability, statistical information must be preserved.
Depending on the context, evaluating the quality of the generated data is a complex task. For example, for image and time series data, perceptually small changes in the original data can lead to large changes in the Euclidean distance [4, 17]. The evaluation of generative models typically accounts primarily for the performance in a specific task, since good performance in one criterion does not imply good performance on another [17]. However, in computationally intensive tasks it is often impracticable to search for the optimal configurations of generative models. To address this limitation, other evaluation methods have been proposed to assist in this evaluation, which typically use statistical divergence metrics, averaged distance metrics, statistical similarity measurements, or precision/recall metrics [18, 19]. The relevant performance metrics found in the literature are discussed in Sect. "Evaluating the Quality of Synthetic Data".
Motivation, scope and contributions
We focus on data generation techniques in the tabular and latent space (i.e., embedded inputs) with a focus on classification and associated ML problems. Related literature reviews are mostly focused on specific algorithmic or domain applications, with little to no emphasis on the core generative process. For this reason, these techniques often appear “sandboxed”, even though there is a significant overlap between them. There are some related reviews published since 2019 [4]. Provides a general overview of synthetic data generation for time series data anonymization in the finance sector [20]. Reviews data generation techniques for tabular health records anonymization [21]. Reviews synthetic data anonymization techniques that preserve the statistical properties of a dataset. [22] reviews GAN-based oversampling methods for tabular data, with a focus on cybersecurity and finance [23]. Reviews data augmentation techniques for brain-tumor segmentation [24]. Distinguishes augmentation techniques for text classification into latent and data space, while providing an extensive overview of augmentation methods within this domain. However, the taxonomy proposed and latent space augmentation methods are not necessarily specific to the domain. [25, 26, 14] and [27] also review data augmentation techniques for text data [28]. Reviews GAN architectures for imbalanced learning in computer vision tasks. [13] review Generative Adversarial Network architectures for medical imaging [29]. Reviews face data augmentation techniques [30, 31] and [32]. Discuss techniques for image data augmentation [33] and [34] also review time series data augmentation techniques. Ref. [35] review data augmentation techniques for graph data. The analysis of related literature reviews .Footnote 1 is shown in Table 1.
This literature review focuses on generation mechanisms applied to tabular data across the main ML techniques where tabular synthetic data is used. We also discuss generation mechanisms used in the latent space, since the generation mechanisms in tabular data and latent space may be used interchangeably. In addition, we focus on the ML perspective of synthetic data, as opposed to the practical perspective; according to the practical perspective, synthetic data is used as a proxy of real data when it is inaccessible, essential, and a secondary asset for tasks like education, software development, or systems demonstrations [36]. The ML perspective focuses on the generation of synthetic data based on existing, naturally occurring data to either improve a ML task or replace the original data.
The different taxonomies of synthetic data generation established in the literature follow a similar philosophy but vary in terminology and are often specific to the technique discussed. Regardless, it is possible to establish a broader taxonomy without giving up on specificity. This study provides a joint overview of the different data generation approaches, domains, and ML techniques where data generation is being used, as well as a common taxonomy across domains. It extends the analyses found in these articles and uses the compiled knowledge to identify research gaps. We compare the strengths and weaknesses of the models developed within each of these fields. Finally, we identify possible future research directions to address some of the limitations found. The contributions of this paper are summarized below:
-
Bridge different ML concepts that use synthetic data generation techniques (Sections "Background" and "Algorithmic applications");
-
Propose a synthetic data generation/data augmentation taxonomy to address the ambiguity in the various taxonomies proposed in the literature (Section "Data generation taxonomy");
-
Characterize all the relevant data generation methods using the proposed taxonomy (Sections "Data generation taxonomy" and "Algorithmic applications");
-
Consolidate the current generation mechanisms across the different techniques and methods to evaluate the quality of synthetic data generation (Sections "Generation mechanisms" and "Evaluating the quality of synthetic data");
-
Highlight the main challenges of synthetic data generation and discuss possible future research directions (Sections "Discussion"and "Future work").
Bibliometric data collection
Considering the goals determined in this study, the literature collection is more complex than usual; the wide range of domains and ML problems where synthetic data is used involved considering different naming conventions for the same concepts. In addition, it involved the identification of such domains and ML problems and checking for less popular mechanism combinations (some of which do not show up in any general query, unless purposefully looked up). To achieve this, we followed a 2-step approach:
-
1
Collection of related literature reviews/surveys/systematic studies: Allowed us to understand which domains and ML problems to discuss, naming conventions (for example, latent vs. embeddings vs. econdings vs. feature space; or synthetic vs. anonymized vs. augmented vs. artificial vs. resampled data), differences in taxonomies across domains, and importance of this study. Based on the rate at which research is being developed in ML, we considered exclusively studies from 2019 onward since any literature review prior to this date can be deemed outdated and overlapping with more recent literature reviews.
-
2
Individual queries according to specific domains, ML problems, concepts, and taxonomy proposed. The large amount of queries performed at this stage involved a case-by-case screening of the studies’ relevancy, searching through the bibliographies of existing papers as well as papers citing the original study and the inclusion of studies that were a priori known by the authors.
The studies included in this literature review were collected from Google Scholar. Compared to other sources, such as Scopus, Web of Science, Dimensions or OpenCitation’s COCI, several studies found Google Scholar to be the most complete source for literature search. According to [37], it contains 88% of all citations, many of which are not found in other sources, and contains 89% to 94% of the citations found by the remaining sources. Another study found even higher disparities [38]; Google Scholar found 93% to 96% of citations across all areas, far more complete than the remaining options, and found 95% and 92% of Web of Science’s and Scopus’ citations, respectively. Since a large percentage of the journals/repositories considered are high-impact journals, conference proceedings, or well-known repositories, it is reasonable to assume all the targeted studies were readily available via Google Scholar.
Paper organization
The rest of this paper is organized as follows: Sect. "Background" defines and formalizes the different concepts, goals, trade-offs, and motivations related to synthetic data generation. Section "Data generation taxonomy" defines the taxonomy used to categorize all the algorithms analyzed in this study. Section "Algorithmic applications" analyses all the algorithms using synthetic data generation, distinguished by learning problem. Section "Generation mechanisms" describes the main generation mechanisms found, distinguished by generation type. Section "Evaluating the Quality of Synthetic Data" reviews performance evaluation methods of synthetic data generation mechanisms. Section "Discussion" summarizes the main findings and general recommendations for good practices on synthetic data usage. Section "Future Work" discusses limitations, research gaps, and future research directions. Section "Conclusions" presents the main conclusions drawn from this study.
Background
In this section, we define basic concepts, common goals, trade-offs, and motivations regarding the generation of synthetic data in ML. We define synthetic data generation as the production of artificial observations that resemble naturally occurring ones within a certain domain, using a generative model. It requires access to a training dataset, a generative process, or a data stream. However, the constraints imposed on this process largely depend on the target ML task. For example, to generate artificial data for regularization purposes in supervised learning (i.e., data augmentation) the training dataset must be annotated. The production of anonymized datasets using synthetic data generation requires synthetic datasets to be different from the original data while following similar statistical properties. Domain knowledge may also be necessary to encode specific relationships among features into the generative process.
Relevant learning problems
The breach of sensitive information is an important barrier to the sharing of datasets, especially when it concerns personal information [39]. One solution for this problem is the generation of synthetic data without identifiable information. Generally speaking, ML tasks that require data with sensitive information are not compromised when using synthetic data. The experiment conducted by [6] using relational datasets showed that in 11 out of 15 comparisons (\(\approx 73\%\)), practitioners performing predictive modelling tasks using fully synthetic datasets performed the same or better than those using the original dataset. Optionally, anonymized synthetic data may be produced with theoretical privacy guarantees, using differential privacy techniques. This topic is discussed in Sect. "Privacy".
A common problem in the training of ML classifiers is their capacity to generalize [40] (i.e., reduce the difference in classification performance between known and unseen observations). This is particularly true for deep neural networks since they require the estimation of high amounts of parameters. Data augmentation is a common method to address this problem for any type of ML classifier. The generation of synthetic observations increases the range of the input space used in the training phase and reduces the difference in performance between known and new observations. Although other regularization methods exist, data augmentation is a useful method since it does not affect the choice in the architecture of the ML classifier and does not exclude the usage of other regularization methods. In domains such as computer vision and NLP, data augmentation is also used to improve the robustness of models against adversarial attacks [41, 42]. These topics are discussed in higher detail in Sect. "Regularization".
In supervised learning, synthetic data generation is often motivated by the need to balance target class distributions (i.e., oversampling). Since most ML classifiers are designed to perform best with balanced datasets, defining an appropriate decision boundary to distinguish rare classes becomes difficult [43]. Although there are other approaches to address imbalanced learning, oversampling techniques are generally easier to implement since they do not involve modifications to the classifier. This topic is discussed in higher detail in Sect. "Oversampling".
In supervised learning tasks where labeled data is not readily available, but can be labeled, an Active Learning (AL) method may be used to improve the efficiency of the labeling process. AL aims to reduce the cost of producing training datasets by finding the most informative observations to label and feed into the classifier [44]. In this case, the generation of synthetic data is particularly useful to reduce the amount of labeled data required for a successful ML project. This topic is discussed in Sect. "Active learning".
Two other techniques reliant on synthetic data generation are Semi-supervised Learning (Semi-SL) and Self-Supervised Learning (Self-SL). The former leverages both labeled and unlabeled data in the training phase, simultaneously, while several methods apply perturbations on the training data as part of the training procedure [45]. The latter, Self-SL, is a technique used to train neural networks in the absence of labeled data. Several Semi-SL and Self-SL methods use synthetic data generation as a core element. These methods are discussed in Sects. "Semi-supervised Learning" and "Self-supervised Learning".
Problem formulation
The original dataset, \({\mathcal {D}} = {\mathcal {D}}_L \cup {\mathcal {D}}_U\), is a collection of real observations and is distinguished according to whether a target feature exists, \({\mathcal {D}}_L = {((x_i, y_i))}^l_{i=1}\), or not, \({\mathcal {D}}_U = {(x_i)}^{u}_{i=1}\). All three datasets, \({\mathcal {D}}\), \({\mathcal {D}}_L\) and \({\mathcal {D}}_U\) consist of ordered collections with lengths \(l+u\), l and u, respectively. Synthetic data generation is performed using a generator, \(f_{gen}(x;\tau ) = x^s\), where \(\tau\) defines the generation policy (i.e., its hyperparameters), \(x \in {\mathcal {D}}\) is an observation and \(x^s \in {\mathcal {D}}^s\) is a synthetic observation. Analogous to \({\mathcal {D}}\), the synthetic dataset, \({\mathcal {D}}^s\), is also distinguished according to whether there is an assignment of a target feature, \({\mathcal {D}}^s_L = {((x^s_j, y^s_j))}^{l'}_{j=1}\), or not, \({\mathcal {D}}^s_U = {(x^s_j)}^{u'}_{j=1}\).
Depending on the ML task, it may be relevant to establish metrics to measure the quality of \({\mathcal {D}}^s\). In this case, a metric \(f_{qual}({\mathcal {D}}^s, {\mathcal {D}})\) is used to determine the level of similarity/dissimilarity between \({\mathcal {D}}\) and \({\mathcal {D}}^s\). In addition, a performance metric to estimate the performance of a model on the objective task, \(f_{per}\), may be used to determine the appropriateness of a model with parameters \(\theta\), i.e., \(f_{\theta }\). The generator’s goal is to generate \({\mathcal {D}}^s\) with arbitrary length, given \({\mathcal {D}} \sim {\mathbb {P}}\) and \({\mathcal {D}}^s \sim {\mathbb {P}}^s\), such that \({\mathbb {P}}^s \approx {\mathbb {P}}\), \(x_i \ne x_j \forall x_i \in {\mathcal {D}} \wedge x_j \in {\mathcal {D}}^s\). \(f_{gen}(x;\tau )\) attempts to generate a \({\mathcal {D}}^s\) that maximizes either \(f_{per}\), \(f_{qual}\), or a combination of both.
Data generation taxonomy
The taxonomy proposed in this paper is a combination of different definitions found in the literature, extended with other traits that vary among domains and generation techniques. Within image data studies, [30] and [32] divide data augmentation techniques into “basic” or “classical” approaches and deep learning approaches. In both cases, the former refers to domain-specific generation techniques, while the latter may be applied to any data structure [33]. Proposes a time-series data augmentation taxonomy divided into four families: (1) Random transformation, (2) Pattern mixing, (3) Generative models, and (4) Decomposition. Except for generative models, the majority of the methods presented in the remaining families are well-established and domain-specific [20]. Defines a taxonomy for synthetic tabular data generation approaches divided into three types of approaches: (1) Classical, (2) Deep learning, and (3) Others. Most taxonomies follow similar definitions while varying in terminology or distinction criteria. In addition, all taxonomies with categories defined as “basic”, “traditional”, or “classical” use these to characterize domain-specific transformations.
Within the taxonomies found, none of them consider how a generation mechanism employs \({\mathcal {D}}\) into the generation process or, if applicable, the training phase. However, it is important to understand whether a generation mechanism randomly selects x and a set of close neighbors, thus considering local information only, or considers the overall dataset or data distribution for the selection of x and/or generation of \(x^s\). Our proposed taxonomy is depicted in Fig. 1. It characterizes data generation mechanisms using four properties:
-
1
Architecture. Defines the broader type of data augmentation. It is based on domain specificity, architecture type, or data transformations using a heuristic or random perturbation process. Data generation based on data sampling from a probability function is considered probability-based. Generation techniques that apply a form of random perturbation, interpolation, or geometric transformation to the data with some degree of randomness are considered randomized approaches. Typical, domain-specific data generation techniques are considered domain-specific approaches. These techniques apply transformations to a data point leveraging relationships in the structure of the data (which is known a priori). Generative models based on neural network architectures are defined as network-based. These architectures attempt to either generate observations in the latent space and/or by producing observations that are difficult to distinguish from the original dataset.
-
2
Application level. Refers to the phase of the ML pipeline where the generative process is included. Generative models are considered internal if used alongside the primary ML task, whereas models used before the development of the primary ML task are considered external.
-
3
Scope. Considers the usage of the original dataset’s properties. Generative models that consider the density of the data space, statistical properties of \({\mathcal {D}}\), or attempt to replicate/manipulate specific relationships found in \({\mathcal {D}}\) are considered to have a global scope, whereas generative models that consider a single observation and/or a set of close neighbors are considered to have a local scope. On the one hand, generative models with a local scope do not account for \({\mathbb {P}}^s\) but allow for the generation of \(x^s\) within more precise regions in the latent/input space. On the other hand, generative models with a global scope have a higher capacity to model \({\mathbb {P}}^s\) but produce \(x^s\) with less precision within the latent/input space.
-
4
Data space. Refers to the type of data representation used to apply the generative model. Generation mechanisms can be applied using the raw dataset (i.e., on the input space), an embedded representation of the data (i.e., on the latent space), or based on the target feature (i.e., on the output space). Although some studies discuss the need to generate synthetic data on the input space [6, 39], various studies successfully apply synthetic data generation techniques on a latent space.
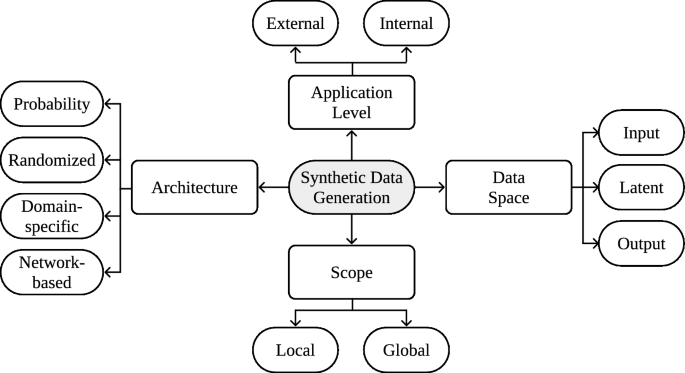
General taxonomy of data generation mechanisms proposed in this paper
Throughout the analysis of the different types of generation mechanisms, all relevant methods were characterized using this taxonomy and listed in Table 2.
Algorithmic applications
In this section, we discuss the data generation mechanisms for the different contexts where they are applied. We emphasize the constraints in each problem that condition the way generation mechanisms are used. The literature search was conducted with the Google Scholar database, using multiple keywords related to each learning problem. Additional studies were collected by checking the citing and cited articles of each study found initially. The related work discussed in these studies was used to check for additional missing methods. Although a larger preference was given to studies published in or after 2019, our analysis includes relevant papers from previous years, including seminal/classical publications in the field. All the steps involved in the literature collection were conducted manually and individually for each learning problem.
Privacy
Synthetic data generation is a technique used to produce synthetic, anonymized versions of datasets [39]. It is considered a good approach to share sensitive data without compromising significantly a given data mining task [92, 107]. Dataset anonymization via synthetic data generation attempts to balance disclosure risk and data utility in the final synthetic dataset. The goal is to ensure observations are not identifiable and the relevant data mining tasks are not compromised [108, 109].
The generation of synthetic datasets allows a more flexible approach to implement ML tasks. To do this, it is important to guarantee that sensitive information in \({\mathcal {D}}\) is not leaked into \({\mathcal {D}}^s\). Differential privacy (DP), a formalization of privacy, offers strict theoretical privacy guarantees [51]. A differentially private generation mechanism produces a synthetic dataset, regulated by the privacy parameter \(\epsilon\), with statistically indistinguishable results when using either \({\mathcal {D}}\) or neighboring datasets \({\mathcal {D}}' = {\mathcal {D}} \backslash \{x\}\), for any \(x \in {\mathcal {D}}\). A synthetic data generation model (\(f_{gen}\)) guarantees \((\epsilon , \delta )\)-differential privacy if \(\forall S \subseteq Range(f_{gen})\) all \({\mathcal {D}}, {\mathcal {D}}'\) differing on a single entry [47]:
In this case, \(\epsilon\) is a non-negative number defined as the privacy budget. A lower \(\epsilon\) guarantees a higher level of privacy but reduces the utility of the produced synthetic data. DP synthetic data is especially appealing since it is not affected by post-processing; any ML pipeline may be applied on \({\mathcal {D}}^s\) while maintaining \((\epsilon , \delta )\)-differential privacy [110].
Choosing an appropriate DP synthetic data generation technique is generally challenging and depends on the task to be developed (if known) and the domain. However, marginal-based algorithms appear to perform well across various tests [111]. A well-known method for the generation of DP synthetic datasets is the combination of the Multiplicative Weights update rule with the Exponential Mechanism (MWEM) [47]. MWEM is an active learning-style algorithm that maintains an approximation of \({\mathcal {D}}^s\). At each time step, MWEM selects the worst approximated query (determined by a scoring function) using the Exponential Mechanism and improves the accuracy of the approximating distribution using the Multiplicative Weights update rule. A known limitation of this method is its lack of scalability. Since this method represents the approximate data distribution in datacubes, this method becomes infeasible for high-dimensional problems [48]. This limitation was addressed with the integration of a Probabilistic Graphical Model-based (PGM) estimation into MWEM (MWEM-PGM) and a subroutine to compute and optimize the clique marginals of the PGM, along with other existing privacy mechanisms [48]. Besides MWEM, this method was used to modify and improve the quality of other DP algorithms: PrivBayes [49], HDMM [59] and DualQuery [60].
PrivBayes [49] addresses the curse of dimensionality by computing a differentially private Bayesian Network (i.e., a type of PGM). Instead of injecting noise into the dataset, they inject noise into the lower-dimensional marginals. The high-dimensional matrix mechanism (HDMM) [59] mechanism is designed to efficiently answer a set of linear queries on high-dimensional data, which are answered using the Laplace mechanism. The DualQuery algorithm [60] is based on the two-player interactions in MWEM and follows a similar synthetic data generation mechanism as the one found in MWEM.
FEM [53] follows a similar data generation approach as MWEM. It also uses the exponential mechanism and replaces the multiplicative weights update rule with the follow-the-perturbed-leader (FTPL) algorithm [112]. The Relaxed Adaptive Projection (RAP) algorithm [54] uses the projection mechanism [113] to answer queries on the private dataset using a perturbation mechanism and attempts to find the synthetic dataset that matches the noisy answers as accurately as it can.
Kamino [57] introduces denial constraints in the data synthesis process. It builds on top of the probabilistic database framework [55, 56], which models a probability distribution function (PDF) and integrates denial constraints as parametric factors, out of which the synthetic observations are sampled. RON-GAUSS [58] combines the random orthonormal (RON) dimensionality reduction technique and synthetic data sampling using either a Gaussian generative model or a Gaussian mixture model. The motivation for this model stems from the Diaconis-Freedman-Meckes effect [114], which states that most high-dimensional data projections follow a nearly Gaussian distribution. Since RON-GAUSS includes a feature extraction step (using RON) and the synthetic data generated is not projected back into the input space, we consider RON-GAUSS an internal approach to the ML pipeline.
The Maximum Spanning Tree (MST) algorithm [46] is a marginal estimation-based approach that produces differentially private data. It uses the Private-PGM mechanism [48] that relies on the PGM approach to generate synthetic data. PGM models are most commonly used when it is important to maintain the pre-existing statistical properties and relationships between features [115].
Another family of DP synthetic data generation techniques relies on the usage of Generative Adversarial Networks (GAN). DPGAN [50] modifies the original GAN architecture to make it differentially private by introducing noise to gradients during the learning procedure. This approach was also applied on a conditional GAN architecture directed towards tabular data (CTGAN) [93], which resulted in the DPCTGAN [51] algorithm. Another type of GAN-based DP data synthesis method is based on the combination of a GAN architecture and the Private Aggregation of Teacher Ensembles (PATE) [116] approach. Although the PATE method generates a DP classifier, it served as the basis for PATE-GAN [52], a DP synthetic data generation mechanism. PATE-GAN replaces the discriminator component of a GAN with the PATE mechanism, which guarantees DP over the generated data. The PATE mechanism is used in the learning phase to train an ensemble of classifiers to distinguish real from synthetic data. As a second step, the predicted labels are passed (with added noise) to another discriminator, which is used to train the generator network.
Finally, there are also popular synthetic data-based anonymization approaches to perform anonymization without DP guarantees. For example, the Synthetic Data Vault (SDV) [6] anonymizes databases using Gaussian copula models to generate synthetic data. However, this method allows the usage of other generation mechanisms. A posterior extension of SDV was proposed to generate data using a CTGAN [93] and to handle sequential tabular data using a conditional probabilistic auto-regressive neural network [117].
Regularization
When the training data is clean, labeled, balanced, and sampled from a fixed data source, the resulting ML classifier is expected to achieve good generalization performance [118]. However, if one or more of these assumptions do not hold, the ML model becomes prone to overfitting [119]. Regularization techniques are used to address problems like overfitting, small training dataset, high dimensionality, outliers, label noise, and catastrophic forgetting [120,121,122,123]. One of these techniques is data augmentation. It is used to increase the size and variability of a training dataset, by producing synthetic observations [124, 125]. Since it is applied at the data level, it can be used for various types of problems and classifiers [126]. Although data augmentation is commonly used and extensively studied in computer vision [30] and natural language processing [14], its research on tabular data is less common.
Mixup [84] consists of a linear interpolation between two randomly selected observations and their target feature values, \((x_i, y_i), (x_j, y_j) \in {\mathcal {D}}_L\), such that given \(\lambda \sim \text {Beta}(\alpha ,\alpha )\), \(x^s = \lambda x_i + (1-\lambda ) x_j\) and \(y^s = \lambda y_i + (1-\lambda ) y_j\), where \(\alpha\) is a predetermined hyperparameter. This method was the source of Manifold Mixup (M-Mixup) [85]. It generates synthetic data in the latent space of a neural network classifier’s hidden layers. Another Mixup-based data augmentation approach, Nonlinear Mixup (NL-Mixup) [86], applies a nonlinear interpolation policy. In this case, \(\Lambda\) is a set of mixing policies sampled from a beta distribution applied to each feature. This approach modifies the original mixup approach to generate data within a hyperrectangle/orthotope: \(x^s = \Lambda \odot x_i + (1-\Lambda ) \odot x_j\), where \(\odot\) denotes the Hadamard product.
Ref. [87] proposed an autoencoder-based data augmentation (AE-DA) approach where the training of the autoencoder is done for each target class, non-iteratively, which reduces the amount of time required compared to the batch processing approach. The decoding weights of an autoencoder are scaled and linearly combined with an observation from another class using a coefficient that follows a beta distribution. The latter step varies from typical interpolation-based approaches since this coefficient is usually drawn from a uniform distribution.
The Modality-Agnostic Automated Data Augmentation in the Latent Space model (MODALS) [88] leverages on the concept discussed by [3], as well as the Latent Space Interpolation method (LSI) [89] and M-Mixup [85]. However, MODALS introduces a framework for data augmentation internally. It contains a feature extraction step, trained using a combination of adversarial loss, classification loss, and triplet loss, where latent space generation mechanisms are applied. The classifier is trained using the original and the synthetic observations generated in the latent space. In this study, the authors discuss the difference transform augmentation method (among others already described in this study). It generates within-class synthetic data by selecting a \(x^c\) and two random observations within the same class, \(x_i, x_j\), to compute \(x^s = x^c + \lambda (x_i-x_j)\). In addition, they also experiment with Gaussian noise and Hard example extrapolation, determined by \(x^s = x^c + \lambda (x^c-\mu )\), where \(\mu\) is the mean of the observations within a given class.
In the model distillation approach proposed in [16] the student model is trained with synthetic data generated with Gibbs sampling. Although Gibbs sampling is infrequently used in recent literature, two oversampling methods using Gibbs sampling appear to achieve state-of-the-art performance [81]. However, probabilistic-based approaches for data augmentation are uncommon; there are some methods proposed for the more specific case of oversampling, but no more related methods for data augmentation were found.
A well-known approach to GAN-based data augmentation is Table-GAN [92]. It utilizes the vanilla GAN approach to the generation of synthetic data. However, vanilla GAN does not allow the controlled generation of synthetic data given conditional attributes such as the target feature values in supervised learning tasks and may be the cause for aggravated categorical feature imbalance. These limitations were addressed with the CTGAN [93] algorithm, which implements the conditional GAN approach to tabular data. Another GAN-based architecture, MedGAN [90], can also be adapted for tabular data and is used as a benchmark in related studies (e.g., [91, 93]). When compared to the remaining GAN-based approaches, MedGAN’s architecture is more complex and generally underperforms in the experiments found in the literature. The GANBLR [91] modifies vanilla GAN architectures with a Bayesian network as both generator and discriminator to create synthetic data. This approach benefits from its interpretability and reduced complexity while maintaining state-of-the-art performance across various evaluation criteria.
Another less popular approach for network-based synthetic data generation is autoencoder architectures. TVAE, proposed in [93] achieved state-of-the art performance. It consists of the VAE algorithm with an architecture modified for tabular data (i.e., 1-dimensional). However, as discussed by the authors, this method contains limitations since it is difficult to achieve DP with AE-based models since they access the original data during the training procedure, unlike GANs [94]. Studies the impact of data augmentation on supervised learning with small datasets. The authors compare four different AE architectures: Undercomplete, Sparse, Deep, and Variational AE. Although all of the tested AE architectures improved classification performance, the deep and variational autoencoders were the best overall performing models.
Oversampling
Since most supervised ML classifiers are designed to expect classes with similar frequencies, training them over imbalanced datasets can result in limited classification performance. With highly skewed distributions in \({\mathcal {D}}_L\), the classifier’s predictions tend to be biased towards overrepresented classes [8]. For example, one can predict correctly with over 99% accuracy whether credit card accounts were defrauded using a constant classifier. One way to address this issue is via oversampling [12], which can be considered a specific setting of data augmentation. It is an appropriate technique when, given a set of n target classes, there is a collection \(C_{maj}\) containing the majority class observations and \(C_{min}\) containing the minority class observations such that \({\mathcal {D}}_L = \bigcup ^n_{i=1} C_i\). The training dataset \({\mathcal {D}}_L\) is considered imbalanced if \(|C_{maj}| > |C_{min}|\). An oversampler is expected to generate a \({\mathcal {D}}_L^s = \bigcup ^n_{i=1} C_i^s\) that guarantees \(|C_i \cup C_i^s| = |C_{maj}|, \forall i \in \{1, \ldots , n\}\). The model \(f_\theta\) will be trained using an artificially balanced dataset \({\mathcal {D}}_L' = {\mathcal {D}}_L \cup {\mathcal {D}}_L^s\).
Random Oversampling (ROS) is considered a classical approach to oversampling. It oversamples minority classes by randomly picking samples with replacement. It is a bootstrapping approach that, if generated in a smoothed manner (i.e., by adding perturbations to the synthetic data), is also known as Random Oversampling Examples (ROSE) [61]. However, the random duplication of observations often leads to overfitting [127].
The Synthetic Minority Oversampling Technique (SMOTE) [62] attempts to address the data duplication limitation in ROS with a two-stage data generation mechanism:
-
1
Selection phase. A minority class observation, \(x^c \in C_{min}\), and one of its k-nearest neighbors, \(x^{nn} \in C_{min}\), are randomly selected.
-
2
Generation phase. A synthetic observation, \(x^s\), is generated along a line segment between \(x^c\) and \(x^{nn}\): \(x^s = \alpha x^c + (1-\alpha )x^{nn}, \alpha \sim {\mathcal {U}}(0, 1)\).
Although the SMOTE algorithm addresses the limitations in ROS, it brings other problems, which motivated the development of several SMOTE-based variants [64]: (1) it introduces noise when a noisy minority class observation is assigned to \(x^c\) or \(x^{nn}\), (2) it introduces noise when \(x^c\) and \(x^{nn}\) belong to different minority-class clusters, (3) it introduces near duplicate observations when \(x^c\) and \(x^{nn}\) are too close and (4) it does not account for within-class imbalance (i.e., different input space regions should assume different importance according to the concentration of minority class observations).
Borderline-SMOTE [63] modifies SMOTE’s selection mechanism. It calculates the k-nearest neighbors for all minority class observations and selects the ones that are going to be used as \(x^c\) in the generation phase. An observation is selected based on the number of neighbors belonging to a different class, where the observations with no neighbors belonging to \(C_{min}\) and insufficient number of neighbors belonging to \(C_{maj}\) are not considered for the generation phase. This approximates the synthetic observations to the border of the expected decision boundaries. Various other methods were proposed since then to modify the selection mechanism, such as K-means SMOTE [75]. This approach addresses within-class imbalance and the generation of noisy synthetic data by generating data within clusters. The data generation is done according to each cluster’s imbalance ratio and dispersion of minority class observations. DBSMOTE [76] also modifies the selection strategy by selecting as \(x^c\) the set of core observations in a DBSCAN clustering solution.
The Adaptive Synthetic Sampling approach (ADASYN) [65] uses a comparable approach to Borderline-SMOTE. It calculates the ratio of non-minority class observations within the k-nearest neighbors of each \(x \in C_{min}\). The number of observations to be generated using each \(x \in C_{min}\) as \(x^c\) is determined according to this ratio; the more non-minority class neighbors an observation contains, the more synthetic observations are generated using it as \(x^c\). The generation phase is done using the linear mechanism in SMOTE. However, this approach tends to aggravate the limitation (1) discussed previously. A second version of this method, KernelADASYN [66], replaces the generation mechanism with a weighted kernel density estimation. The weighing is done according to ADASYN’s ratio and the synthetic data is sampled using the calculated Gaussian Kernel function whose bandwidth is passed as an additional hyperparameter.
Modifications to SMOTE’s generation mechanism are less common and generally attempt to address the problem of noisy synthetic data generation. Safe-level SMOTE [73] truncates the line segment between \(x^c\) and \(x^{nn}\) according to a safe level ratio. Geometric-SMOTE (G-SMOTE) [64] generates synthetic data within a deformed and truncated hypersphere to also avoid the generation of near-duplicate synthetic data. It also modifies the selection strategy to combine the selection of majority class observations as \(x^{nn}\) to avoid the introduction of noisy synthetic data.
LR-SMOTE [74] modifies both the selection and generation mechanisms. The set of observations to use as \(x^c\) contains the misclassified minority class observations using an SVM classifier, out of which the potentially noisy observations are removed. The k-means clustering method is used to find the closest observations to the cluster centroids, which are used as \(x^c\). The observations with a higher number of majority class neighbors are more likely to be selected as \(x^{nn}\). Although the generation mechanism synthesizes observations as a linear combination between \(x^c\) and \(x^{nn}\), it restricts or expands this range by setting \(\alpha \sim {\mathcal {U}}(0, M)\), where M is a ratio between the average euclidean distance of each cluster’s minority class observations to \(x^c\) and the euclidean distance between \(x^c\) and \(x^{nn}\).
The Minority Oversampling Kernel Adaptive Subspaces algorithm (MOKAS) [67] adopts a different approach when compared to SMOTE-based mechanisms. It uses the adaptive subspace self-organizing map (ASSOM) [128] algorithm to learn sub-spaces (i.e., different latent spaces for each unit in the SOM), out of which synthetic data is generated. The synthetic data is generated using a lower dimensional representation of the input data to ensure the reconstructed data is different from the original observations. Overall, the usage of SOMs for oversampling is uncommon. Another two examples of this approach, SOMO [68] and G-SOMO [69] use a similar approach as K-means SMOTE. In the case of G-SOMO, the SMOTE generation mechanism is replaced by G-SMOTE’s instead.
Oversampling using GMM was found in a few recently proposed algorithms. GMM-SENN [70] fits a GMM and uses its inverse weights to sample data, followed by the application of SMOTEENN to leverage the Edited Nearest Neighbors (ENN) methods as a means to reduce the noise in the training dataset. The GMM Filtering-SMOTE (GMF-SMOTE) [71] algorithm applies a somewhat inverse approach; a GMM is used to detect and delete boundary samples the synthetic data is generated with SMOTE.
The contrastive learning-based VAE approach proposed in [72], designed for oversampling, was adapted from the architecture proposed in [129]. They address a limitation found in most oversampling methods, where these methods focus almost exclusively on the distribution of the minority class, while largely ignoring the majority class distribution. Their VAE architecture uses two encoders trained jointly, using both a majority and a minority class observation. The synthetic observation is generated by sampling from one of the sets of latent variables (which follows a Gaussian distribution) and projecting it into the decoder.
Another set of network-based methods that fully replace SMOTE-based mechanisms is GAN-based architectures. One example of this approach is CGAN [77]. It uses an adversarial training approach to generate data that approximates the original data distribution and is indistinguishable from the original dataset (according to the adversarial classifier). A more recent GAN-based oversampler, K-means CTGAN [78] uses a K-means clustering method as an additional attribute to train the CTGAN. In this case, cluster labels allow the reduction of within-class imbalance. These types of approaches benefit from learning the overall per-class distribution, instead of using local information only. However, GANs require more computational power to train, their performance is sensitive to the initialization, and are prone to the “mode collapse” problem.
Statistical-based oversampling approaches are less common. Some methods, such as RACOG and wRACOG [81] are based on Gibbs sampling, PDFOS [83] is based on probability density function estimations and RWO [82] uses a random walk algorithm. Although oversampling for classification problems using continuous features appears as a relatively well-explored problem, there is a general lack of research on oversampling using nominal features or mixed data types (i.e., using both nominal and continuous features) and regression problems. SMOTENC [62] introduces a SMOTE adaptation for mixed data types. It calculates the nearest neighbors of \(x^c\) by including in the Euclidean distance metric the median of the standard deviations of the continuous features for every nominal feature value that is different between \(x^c\) and \(x^{nn}\). The generation is done using the normal SMOTE procedure for the continuous features and the nominal features are determined with their modes within \(x^c\)’s nearest neighbors. The SMOTEN [62] is an oversampling algorithm for nominal features only. It uses the nearest neighbor approach proposed in [130] and generates \(x^s\) using the modes of the features in \(x^c\)’s nearest neighbors. Solutions to oversampling in regression problems are generally also based on SMOTE, such as SMOTER [79] and G-SMOTER [80].
Active learning
AL is an informed approach to data collection and labeling. In classification problems, when \(|{\mathcal {D}}_U| \gg |{\mathcal {D}}_L|\) and it is possible to label data according to a given budget, AL methods will search for the most informative unlabeled observations. Once labeled and included in the training set, these observations are expected to improve the performance of the classifier to a greater extent when compared to randomly selected observations. AL is an iterative process where an acquisition function \(f_{acq}(x, f_\theta ): {\mathcal {D}}_U \rightarrow {\mathbb {R}}\) computes a classification uncertainty score for each unlabeled observation, at each iteration. \(f_{acq}\) provides the selection criteria based on the uncertainty scores, \(f_\theta\) and the labeling budget [9].
One way to improve an AL process is via the generation of synthetic data, since the generation of informative, labeled, synthetic observations reduces the amount of data labeling required to achieve a certain classification performance. In this case, synthetic data is expected to improve classification with a better definition of the classifier’s decision boundaries. This allows the allocation of the data collection budget over a larger area of the input space. These methods can be divided into AL with pipelined data augmentation approaches and AL with within-acquisition data augmentation [9]. Pipelined data augmentation is the more intuitive approach, where at each training phase the synthetic data is produced to improve the quality of the classifier and is independent of \(f_{acq}\). In [44], the pipelined approach in tabular data achieves superior performance compared to the traditional AL framework using the G-SMOTE algorithm and the oversampling generation policy. Other methods, although developed and tested on image data, could also be adapted for tabular data: in the Bayesian Generative Active Deep Learning framework [95] the authors propose VAEACGAN, which uses a VAE architecture along with an auxiliary-classifier generative adversarial network (ACGAN) [131] to generate synthetic data.
The Look-Ahead Data Acquisition via augmentation algorithm [9] proposes an acquisition function that considers the classification uncertainty of synthetic data generated using a given unlabeled observation, instead of only estimating the classification uncertainty of the unlabeled observation itself. This approach considers both the utility of the augmented data and the utility of the unlabeled observation. This goal is achieved with the data augmentation method InfoMixup, which uses M-Mixup [85] along with the distillation of the generated synthetic data using \(f_{acq}\). The authors additionally propose InfoSTN, although the original Spatial Transform Networks (STN) [132] were originally designed for image data augmentation.
Semi-supervised learning
Semi-supervised learning (Semi-SL) techniques modify the learning phase of ML algorithms to leverage both labeled and unlabeled data. This approach is used when \(|{\mathcal {D}}_U| \gg |{\mathcal {D}}_L|\) (similarly to AL settings), but additional labeled data is too difficult to acquire. In recent years, the research developed in this area directed much of its focus to neural network-based models and generative learning [45]. Overall, Semi-SL can be distinguished between transductive and inductive methods. In this section, we will focus on synthetic data generation mechanisms in inductive, perturbation-based Semi-SL algorithms, applicable to tabular or latent space data.
The ladder network [96] is a semi-supervised learning architecture that learns a manifold latent space using a Denoising Autoencoder (DAE). The synthetic data is generated during the learning phase; random noise is introduced into the input data and the DAE learns to predict the original observation. Although this method was tested with image data, DAE networks can be adapted for tabular data [133].
The \(\Pi\)-model simultaneously uses both labeled and unlabeled data in the training phase [97]. Besides minimizing cross-entropy, they add to the loss function the squared difference between two input-level transformations (Gaussian noise and other image-specific methods) in the network’s output layer. Mean Teacher algorithm [98] built upon the \(\Pi\)-model, which used the same types of augmentation. The Interpolation Consistency Training (ICT) [99] method combined the mean teacher and the Mixup approach, where synthetic observations are generated using only the unlabeled observations and their predicted label using the teacher model. In Mixmatch [100], the Mixup method is used by randomly selecting any pair of observations and their true labels (if it’s a labeled observation) or predicted label (if it’s unlabeled).
The Semi-SL Data Augmentation for Tabular data (SDAT) algorithm [101] uses an autoencoder to generate synthetic data in the latent space with Gaussian perturbations. The Contrastive Mixup (C-Mixup) [103] algorithm generates synthetic data using the Mixup mechanism with observation pairs within the same target label. The Mixup Contrastive Mixup algorithm (MCoM) [102] proposes the triplet Mixup method using three observations where \(x^s = \lambda _ix_i + \lambda _jx_j + (1-\lambda _i-\lambda _j)x_k\), where \(\lambda _i, \lambda _j \sim {\mathcal {U}}(0, \alpha )\), \(\alpha \in (0, 0.5]\) and \(x_i\), \(x_j\) and \(x_k\) belong to the same target class. The same algorithm also uses the M-Mixup method as part of the latent space learning phase.
Self-supervised learning
Self-supervised learning (Self-SL), although closely related to Semi-SL, assumes \({\mathcal {D}}_L = \emptyset\). These models focus on representation learning using \({\mathcal {D}}_U\) via secondary learning tasks, which can be adapted to multiple downstream tasks [134]. This family of techniques allows the usage of raw, unlabeled data, which is generally cheaper to acquire when compared to processed, curated, and labeled data. Although not all Self-SL methods rely on data augmentation (e.g., STab [135]), the majority of state-of-the-art tabular Self-SL methods use data augmentation as a central concept for the training phase.
The value imputation and mask estimation method (VIME) [1] is a Semi-SL and Self-SL approach that introduces Masking, a tabular data augmentation method. It is motivated by the need to generate corrupted, difficult-to-distinguish synthetic data in a computationally efficient way for Self-SL training. They replace with probability \(p_m\) the feature values in \(x_i\) with another randomly selected value of each corresponding feature. To do this, the authors use a binomial mask vector \(m=[m_1, \ldots , m_d]^\bot \in \{0,1\}^d\), \(m_j \sim \text {Bern}(p_m)\), observation \(x_i\) and the noise vector \(\epsilon\) (i.e., the vector of possible replacement values). A synthetic observation is produced as \(x^s=(1-m) \odot x_i + m \odot \epsilon\). A subsequent study that proposed the SubTab [104] framework presents a multi-view approach; analogous to cropping in image data or feature bagging in ensemble learning. In addition, the authors propose an extension of the masking approach proposed in VIME by introducing noise using different approaches: Gaussian noise, swap-noise (i.e., the approach proposed in VIME) and zero-out noise (i.e., randomly replace a feature value by zero).
The Self-supervised contrastive learning using random feature corruption method (Scarf) [105] uses a similar synthetic data generation approach as VIME. Scarf differs from VIME by using contrastive loss instead of the denoising auto-encoder loss used in VIME. A-SFS [106] is a Self-SL algorithm designed for feature extraction. It achieved higher performance compared to equivalent state-of-the-art augmentation-free approaches such as Tabnet [136] and uses the masking generation mechanism described in VIME.
Generation mechanisms
In this section, we provide a general description of the synthetic data generation mechanisms found in the learning problems in Sect. "Algorithmic applications". Table 3 summarizes the assumptions and usage of the generation mechanisms across the selected works and learning problems.
We focus on 2 key conditions for the data generation process, smoothness, and manifold space (adapted from the background in [45]). The smoothness condition requires that if two observations \(x_i, x_j\) are close, then it’s expected that \(y_i, y_j\) have the same value. The manifold condition requires synthetic data generation to occur within local Euclidean topological spaces. Therefore, a generation mechanism with the smoothness requirement also requires a manifold, while the opposite is not necessarily true.
In the remaining subsections, we will describe the main synthetic data generation mechanisms found in the literature, based on the studies discussed in Sect. "Algorithmic applications".
Perturbation mechanisms
The general perturbation-based synthetic data generation mechanism is defined as \(x^s = x_i + \epsilon\), where \(\epsilon\) is the noise vector sampled from a certain distribution. The random perturbation mechanism can be thought of as the non-informed equivalent of PGMs and PDFs. It samples \(|\epsilon |\) values from a uniform distribution, i.e., \(e_i \sim {\mathcal {U}}(\cdot , \cdot ), \forall e_i \in \epsilon\), while the minimum and maximum values depend on the context and level of perturbation desired, typically centered around zero.
Laplace (commonly used in DP algorithms) and Gaussian perturbations sample \(\epsilon\) with \(e_i \sim \text {Lap}(\cdot , \cdot )\) and \(e_i \sim {\mathcal {N}}(\cdot , \cdot )\), respectively. Within the applications found, in the presence of categorical features, these methods tend to use n-way marginals (also known as conjunctions or contingency tables [60]) to ensure the generated data contains variability in the categorical features and the distribution of categorical feature values follows some given constraint. Although various other distributions could be used to apply perturbations, the literature found primarily focuses on introducing noise via uniform, Laplace, and Gaussian distributions.
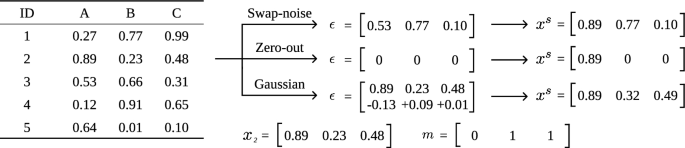
Examples of synthetic observations generated with different masking approaches
Masking modifies the original perturbation-based approach by introducing a binomial mask vector, \(m = [m_1, \ldots , m_d]^\bot \in \{0,1\}^d, m_i \sim \text {Bern}(p_m)\) and the generation mechanism is defined as \(x^s = (1 - m)\odot x_i + m \odot \epsilon\) [1]. The \(\epsilon\) variable is defined according to the perturbation used. The Gaussian approach generates the noise vector as \(\epsilon = x_i + \epsilon '\), where \(e_i' \sim {\mathcal {N}}(\cdot , \cdot ), \forall e_i' \in \epsilon '\). The swap-noise approach shuffles the feature values from all observations to form \(\epsilon\), while the zero-out noise approach sets all \(\epsilon\) values to zero. Intuitively, the masking technique modifies an observation’s feature values with probability \(p_m\), instead of adding perturbations over the entire observation. Figure 2 shows a visual depiction of the masking technique.
Probability density function mechanisms
The Gaussian generative model, despite being infrequently used when compared to the remaining Probability Density Function mechanisms discussed in this subsection, is an essential building block for these mechanisms. In particular, we focus on the multivariate Gaussian approach, which follows near-Gaussian distribution assumptions, which is rarely reasonable on the input space. However, for high-dimensional data, it is possible to motivate this approach via the Diaconis-Freedman-Meckes effect [114], which states that high-dimensional data projections generally follow a nearly Gaussian distribution. The Gaussian generative model produces synthetic data from a Gaussian distribution \(x^s \sim {\mathcal {N}}(\mu , \Sigma )\), where \(\mu \in {\mathbb {R}}^d\) is a vector with the features’ means and \(\Sigma \in {\mathbb {R}}^{d \times d}\) is the covariance matrix. It follows the following density function [58]:
Consequently, to define a Gaussian generative model it is only necessary to estimate the dataset’s mean and covariance matrix.
A Gaussian mixture model (GMM) comprises several Gaussian distributions that aim to represent subpopulations within a dataset. Its training procedure allows the model to iteratively learn the subpopulations using the Expectation Maximization algorithm. A GMM becomes more appropriate than the Gaussian generative model when the data is expected to have more than one higher-density region, leading to a poor fit of unimodal Gaussian models.
Kernel Density Estimation (KDE) methods use a kernel function to estimate the density of the dataset’s distribution at each region of the input/latent space. Despite the various kernel options, the Gaussian kernel is commonly used for synthetic data generation [66]. The general kernel estimator is defined as follows:
Where \(N = |{\mathcal {D}}|\), h is a smoothing parameter known as bandwidth and K is the kernel function. The Gaussian kernel is defined as follows:
Therefore, the Gaussian KDE approach can also be expressed as \({\hat{p}}(x) = \frac{1}{N+h}\sum _{i=1}^{N}G_i(x)\), while the data is sampled from the estimated probability distribution. Figure 3 shows a visualization of the PDF mechanisms discussed, applied to a mock dataset.

Examples of PDF mechanisms fitted to a mock dataset. Legend: a Original dataset, b Gaussian generative model, c Gaussian Mixture Model and d Gaussian Kernel Density Estimation
Probabilistic graphical models
A Bayesian network can be thought of as a collection of conditional distributions. It represents the joint probability distribution over the cross-product of the feature domains in \({\mathcal {D}}\). It is a directed acyclic graph that represents \({\mathcal {D}}\)’s features as nodes and their conditional dependencies as directed edges. The set of features pointing directly to feature \(v \in V, d=|V|\) via a single edge are known as the parent variables, pa(v). A Bayesian network calculates p(x) as the product of the individual density functions, based on the conditional probabilities of the parent variables:
Since the construction of a directed acyclic graph can be labor intensive, different ML approaches were developed for the learning of these structures [137]. Bayesian networks can be used for synthetic data generation when the relationship between variables is known (or can be learned) and when the data is high-dimensional, making the sampling process non-trivial.
Random walk algorithms comprise the general process of iterating through a set of random steps. Although uncommon, random walk approaches may be used to sample data. The random walk approach described in [82] uses the Gaussian noise mechanism over minority class observations to create synthetic observations. The Gibbs sampling mechanism also performs a random walk by iterating through sampled feature values.
Gibbs sampling is a Markov Chain Monte Carlo algorithm that iteratively samples a synthetic observation’s feature values. It is a suitable method to sample synthetic data from a Bayesian network. The process starts with an initial observation selected from \({\mathcal {D}}\), \(x_0\), and is used to begin the sampling process. In its original format, the sampling of each feature value v in \(x^s_i\) is conditioned by \(x^s_{i-1}\) and the feature values already sampled from \(x^s_i\), such that \(x^s_{i, v} \sim p(x^s_{i, v} | x^s_{i, 1}, \ldots , x^s_{i, v-1}, x^s_{i-1, v+1}, \dots , x^s_{i-1, d})\). Therefore, Gibbs sampling is a special case of the Metropolis-Hastings algorithm.
Linear transformations
Linear interpolation mechanisms can be split into two subgroups: between and within-class interpolation. Both mechanisms follow a similar approach; they use a scaling factor \(\lambda\), typically sampled from either \({\mathcal {U}}(0,1)\) or \(\text {Beta}(\alpha , \alpha )\):
The within-class interpolation mechanism selects two observations from the same class, while the between-class interpolation mechanism selects two observations from different classes and also interpolates the one-hot encoded target classes \(y_i\) and \(y_j\). However, the approach to select observations might vary according to the ML task and data generation algorithm. For example, most SMOTE-based methods select a center observation and a random observation within its k-nearest neighbors belonging to the same class, while the Mixup method selects two random observations, regardless of their class membership.

Examples of linear transformation mechanisms. Legend: a Between-class interpolation, b Within-class interpolation, c Observation-based extrapolation, d Hard extrapolation, e Combination of interpolation and extrapolation and (f) Difference transform
The observation-based linear extrapolation mechanism modifies Eq. 6 such that \(x^s = x_i + \lambda (x_i - x_j)\), while the hard extrapolation mechanism uses the mean of a class’ observations, \(\mu ^c\) and a randomly selected observation to generate \(x^s = x_i^c + \lambda (x_i^c - \mu ^c)\). Some methods also combine both interpolation and extrapolation. This can be achieved using Eq. 6 and modifying \(\lambda\)’s range to either decrease its minimum value below zero or increase its maximum value above one.
The difference transform mechanism uses two observations to compute a translation vector (multiplied by the scaling factor \(\lambda\)) and apply it to a third observation:
Although there are various linear transformation mechanisms in the literature, the majority of the studies applied linear interpolation mechanisms. Within-class interpolation was frequently found in oversampling methods, while between-class interpolation was found most often in regularization methods. A depiction of the linear transformation mechanisms found in the literature is presented in Fig. 4.
Geometric transformations
Overall, geometric transformation mechanisms were not frequently found in the literature. They are primarily used to develop Mixup or SMOTE-based variants. Figure 5 shows a visual example of the related mechanisms.
The hypersphere mechanism generates data within a distorted, n-dimensional hyper spheroid. It is formed using an observation to define the center of the geometry and another to define its edge. It is defined with two hyperparameters, the deformation factor, \(\alpha _{def} \in [0, 1]\), and the truncation factor, \(\alpha _{trunc} \in [-1, 1]\). The deformation factor deforms the hypersphere into an elliptic shape, where \(\alpha _{def}=1\) applies no deformation and \(\alpha _{def}=0\) creates a line segment. The truncation factor limits the generation area of the hyper spheroid within a subset of the hypersphere, where \(\alpha _{trunc}=0\) applies no truncation, \(\alpha _{trunc}=1\) uses the half of the area between the two selected observations and \(\alpha _{trunc}=-1\) uses the opposing area. In Fig. 5a, the two generation areas were formed using approximately \(\alpha _{trunc} = \alpha _{def} = 0.5\).
The triangular mechanism selects three observations to generate \(x^s = \lambda _ix_i + \lambda _jx_j + (1-\lambda _i-\lambda _j)x_k\), where \(\lambda _i, \lambda _j \sim {\mathcal {U}}(0, \alpha )\), \(\alpha \in (0, 0.5]\). The hyperrectangle mechanism uses an approach similar to Eq. 6. However, the scaling factor is changed into a scaling vector, \(\Lambda = [\lambda _1,\dots ,\lambda _d ] \in [0,1]^d, \lambda _i \sim \text {Beta}(\alpha , \alpha )\), where \(\alpha\) is a hyperparameter used to define the Beta distribution. A synthetic observation is generated with \(x^s = \Lambda \odot x_i + (1-\Lambda ) \odot x_j\), where \(\odot\) denotes the Hadamard product. This operation originates a generation area like the ones presented in Fig. 5c.

Examples of geometric transformation mechanisms. Legend: a hypersphere mechanism, b triangular mechanism and c hyperrectangle mechanism
Neural networks
Generative Adversarial Network (GAN) architectures are structured as a minimax two-player game composed of two models, a generator, and a discriminator. Both models are trained simultaneously throughout the learning phase, to learn to generate data with similar statistical properties when compared to the original data. The generative model captures the data distribution, while the discriminator estimates the probability of an observation coming from the training data. The goal of the generator model is to produce synthetic observations that are capable of fooling the discriminator, making it difficult for the discriminator to distinguish real from synthetic observations. Although they were originally developed in an unsupervised learning setting [138], subsequent contributions proposed GANs with several different architectures, for semi-SL, supervised learning (for both regularization and oversampling), and reinforcement learning.
An autoencoder (AE) is a type of neural network architecture that learns manifold representations of an input space. These models are typically trained by regenerating the input and are designed with a bottleneck in the hidden layers that correspond to the learned latent space. It contains two parts, an encoder, and a decoder. The encoder transforms the input data into lower-dimensional representations (i.e., the latent space), while the decoder projects these representations into the original input space. Since it was first proposed [139], many variants were developed for multiple applications. However, based on the literature found, the variational AE architecture appears to be the most popular approach.
Evaluating the quality of synthetic data
The vast majority of synthetic data generation models are evaluated on an ML utility basis. Compared to research on the development of actual synthetic data generation algorithms, there is a general lack of research on the development of metrics to evaluate their quality beyond performance metrics such as Overall Accuracy (OA) or F1-score. One motivation to do this is the ability to anticipate the quality of the data for the target task before training an ML classifier, which may be expensive and time-consuming. This is a challenging problem since the usefulness of synthetic data generators depends on the assumptions imposed according to the dataset, domain, and ML problem [18]. This section focuses on the main evaluation approaches found in the literature beyond classification performance, as well as recently proposed methods. For a more comprehensive analysis of performance metrics for synthetic data evaluation, the reader is referred to [140] and [17].
The GANBLR model [91] was evaluated on three aspects: (1) ML utility, (2) Statistical similarity, and (3) Interpretability. In [93], the authors evaluate the CTGAN and TVAE models using a likelihood fitness metric (to measure statistical similarity) and ML efficacy (i.e., utility). [141] evaluate synthetic data generators using a 2-step approach: Similarity comparison and data utility. According to [19], the evaluation of generative models should quantify three key aspects of synthetic data:
-
1
Fidelity. Synthetic observations must resemble real observations;
-
2
Diversity. Synthetic observations should cover \({\mathcal {D}}\)’s variability;
-
3
Generalization. Synthetic observations should not be copies of real observations;
Ensuring these properties are met will secure the objectives defined in Sect. "Problem formulation": \({\mathbb {P}}^s \approx {\mathbb {P}}\) and \(x_i \ne x_j \forall x_i \in {\mathcal {D}} \wedge x_j \in {\mathcal {D}}^s\). However, this is a relatively recent consideration that was not commonly found in the literature. The only study found to explicitly address all three aspects was [19], although all other studies and metrics discussed in Section "Quantitative approaches" address (implicitly or explicitly) at least one of these aspects.
The effective evaluation of synthetic data generation methods is a complex task. Good performance on one evaluation method does not necessarily imply a good performance on the primary ML task, results from different evaluation methods seem to be independent, and evaluating the models directly onto the target application is generally recommended [17]. Therefore, each evaluation procedure must be carefully implemented and adapted according to the use case.
Quantitative approaches
The Kullback–Leibler (KL) divergence (and equivalently the log-likelihood) is a common approach to evaluate generative models [17]. Other commonly used metrics, like Parzen window estimates, appear to be a generally poor quality estimation method and are not recommended for most applications [17]. KL divergence is defined as follows:
Where \({\mathcal {X}}\) is a probability space, P and Q are estimated probability distributions based on \({\mathbb {P}}\) and \({\mathbb {P}}^s\), respectively. The KL divergence is a non-symmetric measurement that represents how a reference probability distribution (P) differs from another (Q). A \(D_{KL}\) close to zero means Q is similar to P. However, metrics like the KL divergence or the log-likelihood are generally difficult to interpret, do not scale well for high dimensional data, and fail to highlight model failures [19]. Another related metric, used in [142], is the Jensen-Shannon (JS) divergence. It consists of a symmetrized and smoothed variation of the KL divergence. Having \(M=\frac{P+Q}{2}\), it is calculated as:
The Wasserstein Distance is another relevant metric to estimate the distance between two distribution functions. It was also used to develop GAN variants since it improves the stability in the training of GANs [143, 144].
In past literature, the propensity score was considered an appropriate performance metric to measure the utility of masked data [145]. This metric is estimated using a classifier (typically a logistic regression) trained on a dataset with both the original and synthetic data, using as a target the source of each observation (synthetic or original). The goal of this classifier is to predict the likelihood of an observation being synthetic. Therefore, this approach guarantees observation-level insights regarding the faithfulness of each observation. [145] suggest a summarization of this metric, also defined as the propensity Mean Squared Error (pMSE) [18]:
Where \(N = |{\mathcal {D}} \cup {\mathcal {D}}^s|\), \(c = \frac{|{\mathcal {D}}^s|}{N}\) and \({\hat{p}}_i\) is the estimated propensity score for observation i. When a synthetic dataset is indistinguishable from real data, pMSE will be close to zero. Specifically, when the data source is indistinguishable, the expected pMSE is given by [146]:
Where k is the number of parameters in the logistic regression model (including bias). When the synthetic dataset is easily distinguishable from the original dataset, \(U_p\) will be close to \({(1-c)}^2\). [39], established a generally consistent, weak negative correlation between \(U_p\) and OA.
[18] proposed TabSynDex to address the lack of uniformity of synthetic data evaluation, which can also be used as a loss function to train network-based models. It is a single metric evaluation approach bounded within [0, 1] that consists of a combination of (1) the relative errors of basic statistics (mean, median, and standard deviation), (2) the relative errors of correlation matrices, (3) a pMSE-based index, (4) a support coverage-based metric for histogram comparison and (5) the performance difference in an ML efficacy-based metric between models trained on real and synthetic data.
The three-dimensional metric proposed by [19] presents an alternative evaluation approach. It combines three metrics (\(\alpha\)-Precision, \(\beta\)-Recall, and Authenticity) for various application domains. It extends the Precision and Recall metrics defined in [147] into \(\alpha\)-Precision and \(\beta\)-Recall, which are used to quantify fidelity and diversity. Finally, the authenticity metric is estimated using a classifier that is trained based on the distance (denoted as d) between \(x^s\) and its nearest neighbor in \({\mathcal {D}}\), \(x_{i^*}\); if \(d(x^s, x_{i^*})\) is smaller than the distance between \(x_{i^*}\) and its nearest neighbor in \({\mathcal {D}}\backslash \{x_{i^*}\}\), \(x^s\) will likely be considered unauthentic. This approach provides a threefold perspective over the quality of \({\mathcal {D}}^s\) and allows a sample-level analysis of the generator’s performance. Furthermore, there is a relative trade-off between the two metrics used to audit the generator and the synthetic data; a higher \(\alpha\)-Precision score will generally correspond to a lower Authenticity score and vice versa.
A less common evaluation approach is to attempt to replicate the results of studies using synthetic data [148,149,150]. Another method is the computation of the average distance among synthetic observations and their nearest neighbors within the original dataset [141]. The Confidence Interval Overlap and Average Percentage Overlap metrics may be used to evaluate synthetic data specifically for regression problems [151, 152].
Visual and qualitative approaches
One of the qualitative approaches found in the literature is the comparison of the features’ distributions with synthetic data and the original data using histogram plots [141]. This comparison can be complemented with the quantification of these distribution differences [148]. A complementary approach is the comparison of correlation matrices via heat map plots [141].
Another way to assess the quality of synthetic data is to evaluate individual, synthetic data points and collect subjective evaluations by domain experts [148]. The goal of such a test is to understand whether domain experts are able to distinguish synthetic from real data, which could be quantified with classification performance metrics. A low classification performance implies synthetic data that is difficult to distinguish from real data.
Discussion
The generation of tabular and latent space synthetic data has applications in multiple ML tasks and domains. Specifically, we found six areas that were shown to benefit from synthetic data: data privacy, regularization, oversampling, active learning, semi-supervised learning, and self-supervised learning. Synthetic data may be used either as an accessory task to improve an ML model’s performance over a primary task (e.g., regularization and oversampling), an intermediate task (e.g., feature extraction), or as a final product itself (e.g., data anonymization). The analysis of data generation algorithms for each relevant learning problem led to the proposal of a general-purpose taxonomy primarily focused on the underlying mechanisms used for data generation. We characterized every algorithm discussed in this work into four categories: (1) architecture, (2) application level, (3) data space, and (4) scope. The successful implementation of synthetic data generation generally requires a few considerations:
-
1
Ensuring the dataset’s features are comprised within similar, fixed boundaries. For example, any method using a neighbors-based approach will rely on distance measurements (typically the Euclidean distance), which is sensitive to the scale of the data and a nearest-neighbors estimation may vary depending on whether the data was scaled a priori. This can be achieved with data scaling.
-
2
Various generation mechanisms require a manifold. There are two approaches to address non-manifold input data: (1) Adopt methods sensitive to the presence of non-metric features, or (2) project the input data into a manifold (i.e., a latent space).
-
3
The smoothness assumption is prevalent in linear and perturbation-based data generation mechanisms. If a classification problem has low class separation and it is difficult to solve, the choice in the design of the generator algorithm is also difficult. Generally, generation algorithms with a global scope might adapt better to classification problems with low separability. On the other hand, problems with higher separability might require a definition of more uniform decision boundaries to prevent overfitting, which can be achieved with generation algorithms with a local scope.
-
4
Considering the trade-off between performance and computational power. It is generally understood that computationally-intensive approaches tend to produce synthetic data with higher quality. When trained properly, neural network mechanisms typically lead to synthetic data that is more difficult to distinguish compared to the remaining approaches. Geometric mechanisms have also achieved good results but often require careful tuning of their hyperparameters. Linear and perturbation mechanisms do not require much training and use fewer hyperparameters but have been known for often producing low diversity synthetic data (vis a vis the original dataset).
This work focused primarily on the mechanisms used to generate synthetic observations; preprocessing, learning phase design, latent space learning, and ML task-specific contributions were secondary objectives for analysis. Consequently, understanding how the constraints within each task condition the choice and design of the synthetic data generator is a subject of future work.
Throughout the analysis of the literature, we identified six types of generation mechanisms and discuss more specific methods used in classical and state-of-the-art techniques. Techniques for data privacy via synthetic data rely primarily on perturbation mechanisms, PDFs, PGMs, and Neural networks. Regularization approaches frequently employ Linear mechanisms. Other less commonly used mechanisms are PGMs, Neural network approaches, geometric, and perturbation mechanisms. Various Oversampling algorithms have been proposed using each of the mechanisms found. However, the most prevalent mechanisms used were linear-based. AL methods rarely employ synthetic data. The few studies found employ primarily linear and geometric mechanisms, and a minority used AE models for latent space augmentation. Most Semi-SL methods used perturbation and linear mechanisms, while geometric mechanisms are rarely used. All tabular Self-SL methods used perturbation mechanisms.
Designing an approach to measure the quality of synthetic data depends on the target ML problem. A holistic evaluation approach for synthetic data should consider the analysis of (1) ML utility, (2) Statistical similarity, and (3) interpretability. The analysis of statistical similarity can be further divided into (1) fidelity, (2) diversity, and (3) generalization. However, balancing the analysis between these three perspectives is not a straightforward task. For example, duplicating a dataset to form a synthetic dataset will result in the best possible fidelity and diversity, but bad generalization. Overall, there is a paucity of research into the development of comprehensive analyses of synthetic data, as well as understanding the balance between the different types of analyses.
Future work
As discussed throughout our analysis, it appears that synthetic data generation research is generally isolated within ML problems and/or domains. Given the breadth and complexity of input-level and latent-level data generation mechanisms, it is increasingly important to find an a priori approach to efficiently determine appropriate data generation policies and techniques. However, the complexity of this task is determined by various factors: different data types, ML problems, model architectures, computational resources, performance metrics, and contextual constraints. Auto-augmentation and meta-learning aim to address this challenge and are still subject to active research.
Finally, various synthetic data generation algorithms are research-based, and might not be usable or feasible to be implemented by practitioners [24]. One way to address this problem is to publish the code developed, and ideally make them available as open-source libraries for out-of-the-box usage.
Latent space learning
It is understood that, if learned properly, the latent space is expected to be convex and isotropic. In that case, using linear generation techniques in the latent space would produce synthetic data without introducing noise [88]. However, it is unclear which types of model/architectures and training procedures contribute to the learning of a good latent space according to the context. Furthermore, we found a limited amount of research on tabular data augmentation using auto-encoder architectures. Although there are studies performing data augmentation on tabular data in various domains [94], defining the architecture and learning phase of an AE is not an intuitive task. Generally, autoencoders are used to learn a manifold for more complex data types. As long as the method used to generate the latent space is appropriate, the methods discussed in this study could be used in the latent space regardless of the type of data.
Selection of generation mechanisms
It remains an open question which generation mechanisms, or types of mechanisms, create better synthetic data [88]. Although there is not necessarily a one-size-fits-all solution, a general set of rules of thumb could be explored, such as understanding how certain characteristics of a problem will affect the choice of the generation policy, which types of mechanisms are more appropriate for different types of dataset, ML model architecture, domains, and target ML problem, or the trade-offs between the different types of generation mechanism. A better understanding of the relationship between recently proposed methods for evaluating synthetic data (as discussed in Sect. "Evaluating the quality of synthetic data") and the performance over the target ML problem might contribute to answering this question. Furthermore, determining the use cases, quality, and general performance of data generation on the input, latent, and output space should be further developed. Finally, it is still unclear why synthetic data generation works for each of the ML tasks discussed. Research on this topic lacks depth and fails to address the theoretical underpinnings [14, 154].
Data privacy
The evaluation of anonymization techniques lacks standardized, objective, and reliable performance metrics and benchmark datasets to allow an easier comparison across classifiers to evaluate key aspects of data anonymization (resemblance, utility, privacy, and performance). These datasets should contain mixed data types (i.e., a combination of categorical, ordinal, continuous, and discrete features) and the metrics should evaluate the performance of different data mining tasks along with the anonymization reliability. This problem appears to be universal across domains. For example, [20] observed the lack of a universal method or metric to report the performance of synthetic data generation algorithms for tabular health records. Therefore, in order to facilitate the usage of these techniques in industry domains, these benchmarks must also be realistic [51]. Attempts to address this problem by proposing a standardized evaluation methodology using standard datasets and real-world industry applications.
Regularization in supervised learning
Unlike data privacy solutions, studies on data augmentation techniques generally do not consider the similarity/dissimilarity of synthetic data. The study of quality metrics for supervised learning may reduce computational overhead and experimentation time. Only one study related to the relationship between quality metrics and performance in the primary ML task was found in [39], which was done only for the pMSE metric.
Consistency and interpretability
Neural network mechanisms typically involve a higher computational cost compared to the remaining types of mechanisms. This problem is further aggravated by their inconsistent performance, since different initializations may result in very different performances. This problem may be observed in [77]. More generally, representing training data in the latent space raises the challenge of interpretability; the ability to interpret latent space representations could guide the design of data generation techniques.
Ensembles of generation mechanisms
In non-tabular data domains, a common approach for data augmentation is the combination of several data augmentation methods to increase the diversification of synthetic data. This is true for both text classification [24] and image classification [10]. However, for tabular data, no studies were found that discuss the potential of ensembles of generation mechanisms on tabular data, i.e., understanding how selecting with different probabilities different generation mechanisms to generate synthetic data would affect the performance of the primary ML task. The formalization and analysis carried out in this work, regarding the different types of synthetic data generation mechanisms and quality metrics for latent and tabular synthetic data at an observation level, may facilitate this work.
Oversampling
Various oversampling methods have been proposed to address imbalanced learning limitations. However, there is still a major limitation in the literature regarding the oversampling of datasets with mixed data types or with exclusively non-metric features at the input space. In addition, research on oversampling using PDFs or PGMs is scarce.
Tabular few-shot learning
To the best of our knowledge, research on few-shot learning for tabular data is infrequent. Few-shot learning research using synthetic data generation techniques has been extensively developed using image [155, 156] and text data [157], but they are rarely adapted or tested for tabular data. One of the few studies found achieved a good performance in both few-shot and zero-shot learning through the adaptation of a Large Language model for tabular data [158].
Fairness and bias
Oversampling does not seem to be a relevant source of bias in behavioral research and does not appear to have an appreciably different effect on results for directly versus indirectly oversampled variables [159]. However, most oversampling methods do not account for the training dataset’s distribution, which is especially important for features with sensitive information (e.g., gender or ethnicity). Therefore, the application of oversampling methods on user data may further increase the bias in classification between genders or ethnicity groups.
The quality of synthetic data generation in high-dimensional scenarios appears as a prevailing limitation in various applications, especially within linear and geometric mechanisms. This limitation can be addressed with dimensionality reduction techniques [153], as well as latent space learning. However, research on data generation in the latent space is mostly focused on GAN architectures, which require significant computational power. Other methods to learn manifold latent spaces could be explored to address this limitation.
Conclusions
This literature review analyses various synthetic data generation-based algorithms for tabular data, with a focus on external-level applications. Since synthetic data generation is a crucial step for various ML applications and domains, it is essential to understand and compare which techniques and types of algorithms are used for each of these problems. The usage of synthetic data is an effective approach to better prepare datasets and ML pipelines for a wide range of applications and/or address privacy concerns. Our work proposed a taxonomy based on four key characteristics of generation algorithms, which was used to characterize 70 data generation algorithms across six ML problems. This analysis resulted in the categorization and description of the generation mechanisms underlying each of the selected algorithms into six main categories. Finally, we discussed several techniques to evaluate synthetic data, as well as general recommendations and research gaps based on the insights collected throughout the analysis of the literature.
Despite the extensive research developed on several methods for synthetic data generation, there are still open questions regarding the theoretical underpinnings of synthetic data adoption for each of the techniques, as well as limitations in the different types of generation mechanisms and evaluation procedures. However, the empirical work presented in the literature shows significant performance improvements and promising research directions for future work.
Availability of data and materials
All materials (tables, figures, examples and associated Python scripts) generated are available at https://github.com/joaopfonseca/publications.
Notes
Results obtained using Google Scholar, limited to articles published since 2019, using the search query (“synthetic data generation” OR “oversampling” OR “imbalanced learning” OR “data augmentation”) AND (“literature review” OR “survey”) Retrieved on August \(11^{th}\), 2022. More articles were added later whenever found relevant.
References
Yoon J, Zhang Y, Jordon J, van der Schaar M. Vime: extending the success of self-and semi-supervised learning to tabular domain. Adv Neural Inform Proc Syst. 2020;33:11033–43.
Kingma DP, Welling M. An introduction to variational autoencoders. Found Trends Mach Learn. 2019;12(4):307–92.
DeVries T, Taylor GW. Dataset augmentation in feature space. arXiv. 2017. https://doi.org/10.48550/arXiv.2112.09238.
Assefa SA, Dervovic D, Mahfouz M, Tillman RE, Reddy P, Veloso M. Generating synthetic data in finance: opportunities, challenges and pitfalls. In: Proceedings of the First ACM International Conference on AI in Finance, 2020;1–8
Wang Y, Huang G, Song S, Pan X, Xia Y, Wu C. Regularizing deep networks with semantic data augmentation. IEEE Trans Pattern Anal Mach Intell. 2021;44(7):3733.
Patki N, Wedge R, Veeramachaneni K. The synthetic data vault. In: 2016 IEEE International Conference on Data Science and Advanced Analytics (DSAA), 2016;399–410. IEEE
Laine S, Aila T. Temporal ensembling for semi-supervised learning. In: International Conference on Learning Representations (ICLR), 2017;4:6
Fonseca J, Douzas G, Bacao F. Improving imbalanced land cover classification with k-means smote: detecting and oversampling distinctive minority spectral signatures. Information. 2021;12(7):266.
Kim Y-Y, Song K, Jang J, Moon I-C. Lada: Look-ahead data acquisition via augmentation for deep active learning. Adv Neural Inform Proc Syst. 2021;34:22919–30.
Grill J-B, Strub F, Altché F, Tallec C, Richemond P, Buchatskaya E, Doersch C, Avila Pires B, Guo Z, Gheshlaghi Azar M. Bootstrap your own latent-a new approach to self-supervised learning. Adv Neural Inform Proc Syst. 2020;33:21271–84.
Lv J-J, Shao X-H, Huang J-S, Zhou X-D, Zhou X. Data augmentation for face recognition. Neurocomputing. 2017;230:184–96.
Douzas G, Bacao F, Fonseca J, Khudinyan M. Imbalanced learning in land cover classification: improving minority classes’ prediction accuracy using the geometric smote algorithm. Remote Sens. 2019;11(24):3040.
Yi X, Walia E, Babyn P. Generative adversarial network in medical imaging: a review. Med Image Anal. 2019;58: 101552.
Feng SY, Gangal V, Wei J, Chandar S, Vosoughi S, Mitamura T, Hovy E. A survey of data augmentation approaches for nlp. In: Findings of the Association for Computational Linguistics: ACL-IJCNLP 2021, pp. 968–988. Association for Computational Linguistics, Online 2021. https://doi.org/10.18653/v1/2021.findings-acl.84https://aclanthology.org/2021.findings-acl.84
Alam TM, Shaukat K, Hameed IA, Luo S, Sarwar MU, Shabbir S, Li J, Khushi M. An investigation of credit card default prediction in the imbalanced datasets. IEEE Access. 2020;8:201173–98.
Fakoor R, Mueller JW, Erickson N, Chaudhari P, Smola AJ. Fast, accurate, and simple models for tabular data via augmented distillation. Adv Neural Inform Proc Syst. 2020;33:8671–81.
Theis L, van den Oord A, Bethge M. A note on the evaluation of generative models. In: International Conference on Learning Representations (ICLR 2016), 2016:1–10
Chundawat VS, Tarun AK, Mandal M, Lahoti M, Narang P. Tabsyndex: a universal metric for robust evaluation of synthetic tabular data. arXiv. 2022. https://doi.org/10.4855/arXiv.2112.09238.
Alaa A, Van Breugel B, Saveliev ES, van der Schaar M. How faithful is your synthetic data? sample-level metrics for evaluating and auditing generative models. In: International Conference on Machine Learning, 2022:290–306. PMLR
Hernandez M, Epelde G, Alberdi A, Cilla R, Rankin D. Synthetic data generation for tabular health records: a systematic review. Neurocomputing. 2022. https://doi.org/10.1016/j.neucom.2022.04.053.
Raghunathan TE. Synthetic data. Ann Rev Stat Appl. 2021;8:129–40.
Sauber-Cole R, Khoshgoftaar TM. The use of generative adversarial networks to alleviate class imbalance in tabular data: a survey. J Big Data. 2022;9(1):98.
Nalepa J, Marcinkiewicz M, Kawulok M. Data augmentation for brain-tumor segmentation: a review. Front Comput Neurosci. 2019;13:83.
Bayer M, Kaufhold M-A, Reuter C. A survey on data augmentation for text classification. ACM Comput Surveys. 2021;55(7):1.
Shorten C, Khoshgoftaar TM, Furht B. Text data augmentation for deep learning. J Big Data. 2021;8(1):1–34.
Chen J, Tam D, Raffel C, Bansal M, Yang D. An empirical survey of data augmentation for limited data learning in nlp. arXiv. 2021. https://doi.org/10.48550/arXiv.2112.09238.
Liu P, Wang X, Xiang C, Meng W. A survey of text data augmentation. In: 2020 International Conference on Computer Communication and Network Security (CCNS), 2020:191–195. IEEE
Sampath V, Maurtua I, Aguilar Martin JJ, Gutierrez A. A survey on generative adversarial networks for imbalance problems in computer vision tasks. J Big Data. 2021;8:1–59.
Wang X, Wang K, Lian S. A survey on face data augmentation for the training of deep neural networks. Neural Comput Appl. 2020;32(19):15503–31.
Shorten C, Khoshgoftaar TM. A survey on image data augmentation for deep learning. J Big Data. 2019;6(1):1–48.
Khosla C, Saini BS. Enhancing performance of deep learning models with different data augmentation techniques: A survey. In: 2020 International Conference on Intelligent Engineering and Management (ICIEM), 2020:79–85. IEEE
Khalifa NE, Loey M, Mirjalili S. A comprehensive survey of recent trends in deep learning for digital images augmentation. Artif Intell Rev. 2021. https://doi.org/10.1007/s10462-021-10066-4.
Iwana BK, Uchida S. An empirical survey of data augmentation for time series classification with neural networks. PLoS ONE. 2021;16(7):0254841.
Wen Q, Sun L, Yang F, Song X, Gao J, Wang X, Xu H. Time series data augmentation for deep learning: a survey. In: Zhou, Z.-H. (ed.) Proceedings of the Thirtieth International Joint Conference on Artificial Intelligence, IJCAI-21, pp. 4653–4660. International Joint Conferences on Artificial Intelligence Organization, ??? 2021
Zhao T, Liu G, Günnemann S, Jiang M. Graph data augmentation for graph machine learning: a survey. arXiv. 2022. https://doi.org/10.48550/arXiv.2112.09238.
Mannino M, Abouzied A. Is this real? generating synthetic data that looks real. In: Proceedings of the 32nd Annual ACM Symposium on User Interface Software and Technology, 2019:549–561
Martín-Martín A, Thelwall M, Orduna-Malea E, Delgado López-Cózar E. Google scholar, microsoft academic, scopus, dimensions, web of science, and opencitations’ coci: a multidisciplinary comparison of coverage via citations. Scientometrics. 2021;126(1):871–906.
Martín-Martín A, Orduna-Malea E, Thelwall M, López-Cózar ED. Google scholar, web of science, and scopus: a systematic comparison of citations in 252 subject categories. J Inform. 2018;12(4):1160–77.
Dankar FK, Ibrahim M. Fake it till you make it: guidelines for effective synthetic data generation. Appl Sci. 2021;11(5):2158.
Zhang C, Bengio S, Hardt M, Recht B, Vinyals O. Understanding deep learning (still) requires rethinking generalization. Commun ACM. 2021;64(3):107–15.
Zeng Y, Qiu H, Memmi G, Qiu M. A data augmentation-based defense method against adversarial attacks in neural networks. In: International Conference on Algorithms and Architectures for Parallel Processing, 2020:274–289. Springer
Morris JX, Lifland E, Yoo JY, Grigsby J, Jin D, Qi Y. Textattack: a framework for adversarial attacks, data augmentation, and adversarial training in nlp. arXiv. 2020. https://doi.org/10.48550/arXiv.2112.09238.
Sáez JA, Krawczyk B, Woźniak M. Analyzing the oversampling of different classes and types of examples in multi-class imbalanced datasets. Pat Recog. 2016;57:164–78.
Fonseca J, Douzas G, Bacao F. Increasing the effectiveness of active learning: introducing artificial data generation in active learning for land use/land cover classification. Remote Sens. 2021;13(13):2619.
Van Engelen JE, Hoos HH. A survey on semi-supervised learning. Mach Learn. 2020;109(2):373–440.
McKenna R, Miklau G, Sheldon D. Winning the nist contest: a scalable and general approach to differentially private synthetic data. J Priv Conf. 2021. https://doi.org/10.48550/arXiv.2108.04978.
Hardt M, Ligett K, McSherry F. A simple and practical algorithm for differentially private data release. In: Proceedings of the 25th International Conference on Neural Information Processing Systems-2012;2:2339–2347.
McKenna R, Sheldon D, Miklau G. Graphical-model based estimation and inference for differential privacy. In: International Conference on Machine Learning, 2019:4435–4444. PMLR.
Zhang J, Cormode G, Procopiuc CM, Srivastava D, Xiao X. Privbayes: private data release via bayesian networks. ACM Trans Database Syst (TODS). 2017;42(4):1–41.
Xie L, Lin K, Wang S, Wang F, Zhou J. Differentially private generative adversarial network. arXiv. 2018. https://doi.org/10.48550/arXiv.2112.09238.
Rosenblatt L, Liu X, Pouyanfar S, de Leon E, Desai A, Allen J. Differentially private synthetic data: applied evaluations and enhancements. arXiv. 2020. https://doi.org/10.48550/arXiv.2112.09238.
Jordon J, Yoon J, Van Der Schaar M. Pate-gan: Generating synthetic data with differential privacy guarantees. In: International Conference on Learning Representations 2018
Vietri G, Tian G, Bun M, Steinke T, Wu S. New oracle-efficient algorithms for private synthetic data release. In: International Conference on Machine Learning, 2020:9765–9774. PMLR.
Aydore S, Brown W, Kearns M, Kenthapadi K, Melis L, Roth A, Siva AA. Differentially private query release through adaptive projection. In: International Conference on Machine Learning, 2021:457–467 PMLR.
De Sa C, Ilyas I, Kimelfeld B, Re C, Rekatsinas T. A formal framework for probabilistic unclean databases. In: 22nd International Conference on Database Theory (ICDT 2019) 2019.
Suciu D, Olteanu D, Ré C, Koch C. Probabilistic databases. Syn Lect Data Manag. 2011;3(2):1–180.
Ge C, Mohapatra S, He X, Ilyas IF. Kamino: constraint-aware differentially private data synthesis. Proc VLDB Endo. 2021;14(10):1886–99.
Chanyaswad T, Liu C, Mittal P. Ron-gauss: enhancing utility in non-interactive private data release. Proc Priv Enhancing Technol. 2019;2019(1):26–46.
McKenna R, Miklau G, Hay M, Machanavajjhala A. Optimizing error of high-dimensional statistical queries under differential privacy. Proceedings of the VLDB Endowment. 2018;11(10).
Gaboardi, M., Arias, E.J.G., Hsu, J., Roth, A., Wu, Z.S.: Dual query: Practical private query release for high dimensional data. In: International Conference on Machine Learning, 2014:1170–1178 PMLR.
Menardi G, Torelli N. Training and assessing classification rules with imbalanced data. Data Mining Knowl Disc. 2014;28(1):92–122.
Chawla NV, Bowyer KW, Hall LO, Kegelmeyer WP. Smote: synthetic minority over-sampling technique. J Arti Intell Res. 2002;16:321–57.
Han H, Wang W-Y, Mao B-H. Borderline-smote: a new over-sampling method in imbalanced data sets learning. In: International Conference on Intelligent Computing, 2005:878–887. Springer.
Douzas G, Bacao F. Geometric smote a geometrically enhanced drop-in replacement for smote. Inform Sci. 2019;501:118–35.
He H, Bai Y, Garcia EA, Li S. Adasyn: Adaptive synthetic sampling approach for imbalanced learning. In: 2008 IEEE International Joint Conference on Neural Networks (IEEE World Congress on Computational Intelligence), 2008:1322–1328 IEEE.
Tang B, He H. Kerneladasyn: Kernel based adaptive synthetic data generation for imbalanced learning. In: 2015 IEEE Congress on Evolutionary Computation (CEC), 2015:664–671 IEEE.
Lin C-T, Hsieh T-Y, Liu Y-T, Lin Y-Y, Fang C-N, Wang Y-K, Yen G, Pal NR, Chuang C-H. Minority oversampling in kernel adaptive subspaces for class imbalanced datasets. IEEE Trans Knowl Data Eng. 2017;30(5):950–62.
Douzas G, Bacao F. Self-organizing map oversampling (somo) for imbalanced data set learning. Expert Syst Appl. 2017;82:40–52.
Douzas G, Rauch R, Bacao F. G-somo: an oversampling approach based on self-organized maps and geometric smote. Expert Syst Appl. 2021;183: 115230.
Xing M, Zhang Y, Yu H, Yang Z, Li X, Li Q, Zhao Y, Zhao Z, Luo Y. Predict dlbcl patients’ recurrence within two years with gaussian mixture model cluster oversampling and multi-kernel learning. Comp Meth Prog Biomed. 2022;226: 107103.
Xu Z, Shen D, Kou Y, Nie T. A synthetic minority oversampling technique based on gaussian mixture model filtering for imbalanced data classification. IEEE Trans Neural Net Learn Syst. 2022. https://doi.org/10.1109/TNNLS.2022.3197156.
Dai W, Ng K, Severson K, Huang W, Anderson F, Stultz C. Generative oversampling with a contrastive variational autoencoder. In: 2019 IEEE International Conference on Data Mining (ICDM), 2019:101–109 IEEE.
Bunkhumpornpat C, Sinapiromsaran K, Lursinsap C. Safe-level-smote: Safe-level-synthetic minority over-sampling technique for handling the class imbalanced problem. In: Pacific-Asia Conference on Knowledge Discovery and Data Mining, 2009:475–482 Springer.
Liang X, Jiang A, Li T, Xue Y, Wang G. Lr-smote-an improved unbalanced data set oversampling based on k-means and svm. Knowl-Based Syst. 2020;196: 105845.
Douzas G, Bacao F, Last F. Improving imbalanced learning through a heuristic oversampling method based on k-means and smote. Inform Sci. 2018;465:1–20.
Bunkhumpornpat C, Sinapiromsaran K, Lursinsap C. Dbsmote: density-based synthetic minority over-sampling technique. Appl Intell. 2012;36(3):664–84.
Douzas G, Bacao F. Effective data generation for imbalanced learning using conditional generative adversarial networks. Expert Syst Appl. 2018;91:464–71.
An C, Sun J, Wang Y, Wei Q. A k-means improved ctgan oversampling method for data imbalance problem. In: 2021 IEEE 21st International Conference on Software Quality, Reliability and Security (QRS), 2021:883–887 IEEE.
Torgo L, Ribeiro RP, Pfahringer B, Branco P. Smote for regression. In: Portuguese Conference on Artificial Intelligence, 2013:378–389. Springer.
Camacho L, Douzas G, Bacao F. Geometric smote for regression. Expert Syst Appl. 2022;3: 116387.
Das B, Krishnan NC, Cook DJ. Racog and wracog: two probabilistic oversampling techniques. IEEE Trans Knowl Data Eng. 2014;27(1):222–34.
Zhang H, Li M. Rwo-sampling: a random walk over-sampling approach to imbalanced data classification. Inform Fusion. 2014;20:99–116.
Gao M, Hong X, Chen S, Harris CJ, Khalaf E. Pdfos: pdf estimation based over-sampling for imbalanced two-class problems. Neurocomputing. 2014;138:248–59.
Zhang H, Cisse M, Dauphin YN, Lopez-Paz D. mixup: Beyond empirical risk minimization. In: International Conference on Learning Representations 2018.
Verma V, Lamb A, Beckham C, Najafi A, Mitliagkas I, Lopez-Paz D, Bengio Y. Manifold mixup: Better representations by interpolating hidden states. In: International Conference on Machine Learning, 2019:6438–6447 PMLR.
Guo H. Nonlinear mixup: Out-of-manifold data augmentation for text classification. In: Proceedings of the AAAI Conference on Artificial Intelligence, 2020;34:4044–4051.
Feng X, Wu QJ, Yang Y, Cao L. An autuencoder-based data augmentation strategy for generalization improvement of dcnns. Neurocomputing. 2020;402:283–97.
Cheung T-H, Yeung, D-Y. Modals: Modality-agnostic automated data augmentation in the latent space. In: International Conference on Learning Representations 2020.
Liu X, Zou Y, Kong L, Diao Z, Yan J, Wang J, Li S, Jia P, You J. Data augmentation via latent space interpolation for image classification. In: 2018 24th International Conference on Pattern Recognition (ICPR), 2018:728–733. IEEE.
Armanious K, Jiang C, Fischer M, Küstner T, Hepp T, Nikolaou K, Gatidis S, Yang B. Medgan: medical image translation using gans. Comput Med Imag Graph. 2020;79: 101684.
Zhang Y, Zaidi NA, Zhou J, Li G. Ganblr: a tabular data generation model. In: 2021 IEEE International Conference on Data Mining (ICDM), 2021:181–190 IEEE.
Park N, Mohammadi M, Gorde K, Jajodia S, Park H, Kim Y. Data synthesis based on generative adversarial networks. Proc VLDB Endowment. 2018. https://doi.org/10.14778/3231751.3231757.
Xu L, Skoularidou M, Cuesta-Infante A, Veeramachaneni K. Modeling tabular data using conditional gan. Adv Neural Inform Proc Syst. 2019;32:1049.
Delgado JMD, Oyedele L. Deep learning with small datasets: using autoencoders to address limited datasets in construction management. Appl Soft Comput. 2021;112: 107836.
Tran T, Do T-T, Reid I, Carneiro G. Bayesian generative active deep learning. In: International Conference on Machine Learning, 2019:6295–6304 PMLR.
Rasmus A, Berglund M, Honkala M, Valpola H, Raiko T. Semi-supervised learning with ladder networks. Advances in neural information processing systems. 2015;28.
Samuli, L., Timo, A.: Temporal ensembling for semi-supervised learning. In: International Conference on Learning Representations (ICLR), 2017;4:6.
Tarvainen A, Valpola H. Mean teachers are better role models: Weight-averaged consistency targets improve semi-supervised deep learning results. Advances in neural information processing systems. 2017;30.
Verma V, Kawaguchi K, Lamb A, Kannala J, Solin A, Bengio Y, Lopez-Paz D. Interpolation consistency training for semi-supervised learning. Neural Net. 2022;145:90–106.
Berthelot D, Carlini N, Goodfellow I, Papernot N, Oliver A, Raffel CA. Mixmatch: A holistic approach to semi-supervised learning. Advances in neural information processing systems. 2019;32.
Fang, J., Tang, C., Cui, Q., Zhu, F., Li, L., Zhou, J., Zhu, W.: Semi-supervised learning with data augmentation for tabular data. In: Proceedings of the 31st ACM International Conference on Information & Knowledge Management, pp. 3928–3932 (2022)
Li X, Khan L, Zamani M, Wickramasuriya S, Hamlen KW, Thuraisingham B. Mcom: A semi-supervised method for imbalanced tabular security data. In: IFIP Annual Conference on Data and Applications Security and Privacy, 2022:48–67 Springer.
Darabi S, Fazeli S, Pazoki A, Sankararaman S, Sarrafzadeh M. Contrastive mixup: Self-and semi-supervised learning for tabular domain. arXiv preprint arXiv:2108.12296 2021
Ucar T, Hajiramezanali E, Edwards L. Subtab: subsetting features of tabular data for self-supervised representation learning. Adv Neural Inform Proc Syst. 2021;34:18853–65.
Bahri D, Jiang H, Tay Y, Metzler D. Scarf: Self-supervised contrastive learning using random feature corruption. In: International Conference on Learning Representations 2022.
Qiu Z, Zeng W, Liao D, Gui N. A-sfs: semi-supervised feature selection based on multi-task self-supervision. Knowl-Based Syst. 2022;252: 109449.
Taub J, Elliot M, Pampaka M, Smith D. Differential correct attribution probability for synthetic data: an exploration. In: International Conference on Privacy in Statistical Databases, 2018:122–137. Springer.
Singh K, Batten L. Aggregating privatized medical data for secure querying applications. Future Gener Comp Syst. 2017;72:250–63.
Li P, Li T, Ye H, Li J, Chen X, Xiang Y. Privacy-preserving machine learning with multiple data providers. Future Gene Comp Syst. 2018;87:341–50.
Dwork C, Roth A. The algorithmic foundations of differential privacy. Found Trends Theor Compr Sci. 2014;9(3–4):211–407.
Tao Y, McKenna R, Hay M, Machanavajjhala A, Miklau G. Benchmarking differentially private synthetic data generation algorithms. arXiv. 2021. https://doi.org/10.48550/arXiv.2112.09238.
Kalai A, Vempala S. Efficient algorithms for online decision problems. J Comp Syst Sci. 2005;71(3):291–307.
Nikolov A, Talwar K, Zhang L. The geometry of differential privacy: the sparse and approximate cases. In: Proceedings of the Forty-fifth Annual ACM Symposium on Theory of Computing, 2013:351–360.
Meckes E. Projections of probability distributions: A measure-theoretic dvoretzky theorem. In: Geometric Aspects of Functional Analysis, pp. 317–326. Springer 2012
Young J, Graham P, Penny R. Using bayesian networks to create synthetic data. J Offi Stat. 2009;25(4):549.
Papernot N, Abadi M, Erlingsson U, Goodfellow I, Talwar K. Semi-supervised knowledge transfer for deep learning from private training data. In: Proceedings of the International Conference on Learning Representations 2017. arxiv:1610.05755
Zhang K, Patki N, Veeramachaneni K. Sequential models in the synthetic data vault. arXiv. 2022. https://doi.org/10.48550/arXiv.2112.09238.
Benning M, Burger M. Modern regularization methods for inverse problems. Acta Numerica. 2018;27:1–111.
Bartlett PL, Montanari A, Rakhlin A. Deep learning: a statistical viewpoint. Acta Num. 2021;30:87–201.
Halevy A, Norvig P, Pereira F. The unreasonable effectiveness of data. IEEE Intell Syst. 2009;24(2):8–12.
Domingos P. A few useful things to know about machine learning. Commun ACM. 2012;55(10):78–87.
Salman S, Liu X. Overfitting mechanism and avoidance in deep neural networks. arXiv. 2019. https://doi.org/10.48550/arXiv.2112.09238.
Xie Z, He F, Fu S, Sato I, Tao D, Sugiyama M. Artificial neural variability for deep learning: On overfitting, noise memorization, and catastrophic forgetting. Neural Comput. 2021;33(8):2163–92.
Van Dyk DA, Meng X-L. The art of data augmentation. J Comput Grap Stat. 2001;10(1):1–50.
Wong SC, Gatt A, Stamatescu V, McDonnell MD. Understanding data augmentation for classification: when to warp? In: 2016 International Conference on Digital Image Computing: Techniques and Applications (DICTA), 2016:1–6. IEEE.
Behpour S, Kitani KM, Ziebart BD. Ada: Adversarial data augmentation for object detection. In: 2019 IEEE Winter Conference on Applications of Computer Vision (WACV), 2019:1243–1252. IEEE.
Krawczyk B. Learning from imbalanced data: open challenges and future directions. Prog Artif Intell. 2016;5(4):221–32.
Kohonen T. Emergence of invariant-feature detectors in the adaptive-subspace self-organizing map. Biol Cyber. 1996;75(4):281–91.
Abid A, Zou J. Contrastive variational autoencoder enhances salient features. arXiv. 2019. https://doi.org/10.48550/arXiv.2112.09238.
Cost S, Salzberg S. A weighted nearest neighbor algorithm for learning with symbolic features. Mach Learn. 1993;10(1):57–78.
Odena A, Olah C, Shlens J. Conditional image synthesis with auxiliary classifier gans. In: International Conference on Machine Learning, 2017:2642–2651. PMLR.
Jaderberg M, Simonyan K, Zisserman A, et al. Spatial transformer networks. Advances in neural information processing systems. 2015;28.
Sattarov T, Herurkar D, Hees J. Explaining anomalies using denoising autoencoders for financial tabular data. arXiv. 2022. https://doi.org/10.48550/arXiv.2112.09238.
Liu X, Zhang F, Hou Z, Mian L, Wang Z, Zhang J, Tang J. Self-supervised learning: generative or contrastive. IEEE Trans Knowl Data Eng. 2021;35(1):857.
Hajiramezanali E, Shen MW, Scalia G, Diamant NL. Stab: Self-supervised learning for tabular data. In: NeurIPS 2022 First Table Representation Workshop 2022.
Arik SÖ, Pfister T. Tabnet: Attentive interpretable tabular learning. In: Proceedings of the AAAI Conference on Artificial Intelligence, 2021;35:6679–6687
Yu Y, Chen J, Gao T, Yu M. Dag-gnn: Dag structure learning with graph neural networks. In: International Conference on Machine Learning, 2019:7154–7163. PMLR.
Goodfellow I, Pouget-Abadie J, Mirza M, Xu B, Warde-Farley D, Ozair S, Courville A, Bengio Y. Generative adversarial networks. Commun ACM. 2020;63(11):139–44.
Ackley DH, Hinton GE, Sejnowski TJ. A learning algorithm for boltzmann machines. Cog Sci. 1985;9(1):147–69.
Dankar FK, Ibrahim MK, Ismail L. A multi-dimensional evaluation of synthetic data generators. IEEE Access. 2022;10:11147–58.
Hittmeir M, Ekelhart A, Mayer R. On the utility of synthetic data: An empirical evaluation on machine learning tasks. In: Proceedings of the 14th International Conference on Availability, Reliability and Security, 2019:1–6.
Zhao Z, Kunar A, Birke R, Chen LY. Ctab-gan: Effective table data synthesizing. In: Asian Conference on Machine Learning, 2021:97–112. PMLR.
Gulrajani I, Ahmed F, Arjovsky M, Dumoulin V, Courville AC. Improved training of wasserstein gans. Advances in neural information processing systems. 2017;30.
Goncalves A, Ray P, Soper B, Stevens J, Coyle L, Sales AP. Generation and evaluation of synthetic patient data. BMC Med Res Methodol. 2020;20(1):1–40.
Woo M-J, Reiter JP, Oganian A, Karr AF. Global measures of data utility for microdata masked for disclosure limitation. Journal of Privacy and Confidentiality. 2009;1(1).
Snoke J, Raab GM, Nowok B, Dibben C, Slavkovic A. General and specific utility measures for synthetic data. J Royal Stat Soc Series A. 2018;181(3):663–88.
Sajjadi MS, Bachem O, Lucic M, Bousquet O, Gelly S. Assessing generative models via precision and recall. Advances in neural information processing systems. 2018;31.
El Emam K. Seven ways to evaluate the utility of synthetic data. IEEE Security Priv. 2020;18(4):56–9.
Benaim AR, Almog R, Gorelik Y, Hochberg I, Nassar L, Mashiach T, Khamaisi M, Lurie Y, Azzam ZS, Khoury J. Analyzing medical research results based on synthetic data and their relation to real data results: systematic comparison from five observational studies. JMIR Med Inform. 2020;8(2):16492.
Rosenblatt L, Holovenko A, Rumezhak T, Stadnik A, Herman B, Stoyanovich J, Howe B. Epistemic parity: reproducibility as an evaluation metric for differential privacy. arXiv. 2022. https://doi.org/10.48550/arXiv.2112.09238.
Khan MSN, Reje N, Buchegger S. Utility assessment of synthetic data generation methods. In: Privacy in Statistical Database 2022.
Karr AF, Kohnen CN, Oganian A, Reiter JP, Sanil AP. A framework for evaluating the utility of data altered to protect confidentiality. Am Stat. 2006;60(3):224–32.
Roccetti M, Delnevo G, Casini L, Mirri S. An alternative approach to dimension reduction for pareto distributed data: a case study. J Big Data. 2021;8(1):1–23.
Dao T, Gu A, Ratner A, Smith V, De Sa C, Ré C. A kernel theory of modern data augmentation. In: International Conference on Machine Learning, 2019:1528–1537. PMLR.
Cubuk ED, Zoph B, Mane D, Vasudevan V, Le QV. Autoaugment: Learning augmentation strategies from data. In: Proceedings of the IEEE/CVF Conference on Computer Vision and Pattern Recognition, 2019:113–123.
Zhao A, Balakrishnan G, Durand F, Guttag J., Dalca AV. Data augmentation using learned transformations for one-shot medical image segmentation. In: Proceedings of the IEEE/CVF Conference on Computer Vision and Pattern Recognition, 2019:8543–8553.
Zhou J, Zhen Y, Tang J, Li J, Yang Z. Flipda: effective and robust data augmentation for few-shot learning. arXiv. 2021. https://doi.org/10.48550/arXiv.2112.09238.
Hegselmann S, Buendia A, Lang H, Agrawal M, Jiang X, Sontag D. Tabllm: Few-shot classification of tabular data with large language models. arXiv. 2022. https://doi.org/10.4855/arXiv.2112.09238.
Hauner KK, Zinbarg RE, Revelle W. A latent variable model approach to estimating systematic bias in the oversampling method. Beh Res Meth. 2014;46(3):786–97.
Funding
This research was supported by two research grants of the Portuguese Foundation for Science and Technology (“Fundação para a Ciência e a Tecnologia”), references SFRH/BD/151473/2021 and DSAIPA/DS/0116/2019, and by project UIDB/04152/2020 - Centro de Investigação em Gestão de Informação (MagIC).
Author information
Authors and Affiliations
Contributions
JF defined the methodology for the analysis and prepared the original draft. FB reviewed the manuscript and provided supervision.
Corresponding author
Ethics declarations
Competing interests
The authors declare that they have no known competing financial interests or personal relationships that could have appeared to influence the work reported in this paper.
Additional information
Publisher's Note
Springer Nature remains neutral with regard to jurisdictional claims in published maps and institutional affiliations.
Rights and permissions
Open Access This article is licensed under a Creative Commons Attribution 4.0 International License, which permits use, sharing, adaptation, distribution and reproduction in any medium or format, as long as you give appropriate credit to the original author(s) and the source, provide a link to the Creative Commons licence, and indicate if changes were made. The images or other third party material in this article are included in the article's Creative Commons licence, unless indicated otherwise in a credit line to the material. If material is not included in the article's Creative Commons licence and your intended use is not permitted by statutory regulation or exceeds the permitted use, you will need to obtain permission directly from the copyright holder. To view a copy of this licence, visit http://creativecommons.org/licenses/by/4.0/.
About this article

Cite this article
Fonseca, J., Bacao, F. Tabular and latent space synthetic data generation: a literature review. J Big Data 10, 115 (2023). https://doi.org/10.1186/s40537-023-00792-7
Received:
Accepted:
Published:
DOI: https://doi.org/10.1186/s40537-023-00792-7