
Abstract
Cardiovascular diseases had been for a long time one of the essential medical problems. As indicated by the World Health Association, heart ailments are at the highest point of ten leading reasons for death. Correct and early identification is a vital step in rehabilitation and treatment. To diagnose heart defects, it would be necessary to implement a system able to predict the existence of heart diseases. In the current article, our main motivation is to develop an effective intelligent medical system based on machine learning techniques, to aid in identifying a patient’s heart condition and guide a doctor in making an accurate diagnosis of whether or not a patient has cardiovascular diseases. Using multiple data processing techniques, we address the problem of missing data as well as the problem of imbalanced data in the publicly available UCI Heart Disease dataset and the Framingham dataset. Furthermore, we use machine learning to select the most effective algorithm for predicting cardiovascular diseases. Different metrics, such as accuracy, sensitivity, F-measure, and precision, were used to test our system, demonstrating that the proposed approach significantly outperforms other models.
Introduction
According to the World Health Organization, the number of deaths will add up by 24.5 million in 2030 [1], because of the growth of cardiovascular risk factors such as high blood pressure, diabetes, obesity, and smoking.
In several cases, saving the patient’s life rely crucially on the time before being seen by a doctor and finding the required hospitalization, so giving the physicians perpetual update concerning their patient’s health conditions will considerably scale back the number of deaths.
Many factors could cause cardiopathy such as the dynamic changes in lifestyle, smoking, food habits, physical activity, obesity, diabetes, and also biochemical factors like blood pressure or glycaemia [2, 3], whereas the common symptoms of cardiovascular diseases can be a pain in arms and chest [4]. To limit the risk of this illness, it is crucial to record essential heart comportment for every kind of Cardio Vascular Disease (CVD) and provide a system that helps doctors make correct and efficient decisions whereas diagnosis. In a Medical diagnosis, the doctor tries to distinguish the heart defect by analyzing the values of a variety of characteristics. This task is primarily based on a range of traditional ways like ECG, occultation, taking measures of blood pressure, blood sugar, and cholesterol. However, those techniques are expensive and time consuming, and could lead to human errors [5]. On the other hand, machine-learning algorithms allow cardiovascular disease diagnosis that significantly reduces processing time and improves prediction accuracy. A variety of machine learning techniques are used in various studies to aid in the diagnosis of heart diseases [6, 7] , and cardiovascular disease classification [8].
In this work, we propose a system based on filling missing data algorithms and machine learning models to diagnose cardiovascular diseases. To achieve this goal, we experiment with multiple machine-learning models and different filling missing values algorithms .In the following; we summarize the main contributions of this work:
-
Preprocessing the data which includes normalizing step, and filling up missing values by using different algorithms such as, the mean value, KNN, MICE, and RF.
-
Solving the Framingham data balance challenge with the SMOTE approach.
-
Classifying the patients with cardiovascular disease, by using various machine learning techniques like Nu SVM, Gradient Boosting regressor, Extreme gradient boost,ADA Boost, ExtraTrees,LGBM,SGD and the stacking algorithm.
-
Comparing numerous machine learning methods, such as Nu SVM, Gradient Boosting Regressor, Extreme gradient boost, and the stacking algorithm, utilizing various metrics and the Receiver Operating Characteristic (ROC) curve.
The rest of this paper is organized as follows: in the second section, we present related works; the third section describes in detail the proposed methodology. In section four, we analyze the experimental results. Finally, we conclude with a conclusion and perspectives.
Related works
Because of the increasing number of deaths thanks to heart diseases, healthcare organizations need innovative approaches to know, control and manage their actions to enhance the quality of the service and help physicians and staff accomplish their missions within the right time, in good conditions. One among the innovative approaches is the internet of things (IoT) that has widely been employed in the cardiovascular domains, within the last years, to measure, monitor, and collect data. In this context, Safa and Pandian [9] proposed system focuses on identifying the level of stress in four classified categories by obtaining physiological parameters from the indented person under observation. Oximeter sensors are tested using a classifier model trained on a dataset of cardiac data that has already been stored, The results showed that the quality of K neighbour classification is significantly higher than that of SVM and Decision tree methods. Balakrishnand et al. [10]created asolution using an intelligent finger tip heart rate sensor that remotely and continuously monitors the patients’ blood pressure and heart rate,the security of IoT devices in this classification is required. To secure this system, a lightweight encryption technique was proposed. The classification of arrhythmic heart beats is accomplished through the use of linear regression. Zaman et al. [11] proposed a cardiac status prediction method based on IoT and Machine Learning. The data collected from the human body were normalized before being used by machine learning algorithms to calculate and predict the overall condition of a patient’s heart, the results were quite satisfactory. Based on the Internet of Things (IoT) and bio-sensors, Islam et al. [12] propose a low-cost healthcare system for CVD patients in Bangladesh. It will allow doctors to continuously monitor a cardiac patient in the hospital or at home from a remote location.
Krittanawong et al. [13] provide a meta-analysis on machine learning prediction in cardiovascular diseases. Siontis et al. [14] summarize the current and future state of AI-enhanced ECG(Electro Cardio Gram) in the detection of cardiovascular disease in at-risk populations, discuss its implications for clinical decision-making in patients with cardiovascular disease, and evaluate its potential limitations in their review. Linda et al. [15] developed a novel clinical decision support system to prescribe exercise for patients suffering from heart diseases. In their preliminary analysis, they find that clinicians are unsure how to create an exercise prescription for patients who have multiple CVD risk factors. The provided system is an easy-to-use, guided, and time-efficient evidence-based approach for patients.
The association rules mining technique has also been utilized in many works to seek out frequent item sets among large patients data sets to diagnose the presence of heart diseases. Ali et al. [16] presented a three-phase PB-FARM approach for the assessment of risk factors associated with diseases. It was also implemented on the Z-Alizadeh Sani dataset to assess the factors influencing the incidence of this disease. The results showed a strong correlation between the incidence rate of CAD and old age and typical chest pain. Jesmin et al. [17] presented a rule extraction experiment on heart disease data using different rule mining algorithms. It is found from the set of healthy rules, being ’female’ is one of the factors for a healthy heart condition, they have more chance of being free from coronary heart disease than males.
M. Anbarasi et al. employed genetic algorithms in [18]; to optimize the information size and find the sufficient subset amongst patients attributes values for heart condition prediction. The optimization advantages of the genetic algorithm have been utilized in [19]; where Peter and Somasundaram implemented a hybrid system for initialization of neural network weights that supported a group of risk factors like hypertension, high cholesterol, obesity, etc. In another research [20], Amin utilized a layered neuro-fuzzy approach to provide an awfully low error rate in performing analysis for heart condition occurrences.
Data imputation methods have been used to fill up missing data in preprocessing step. Khoudrifi and Bahaj [21] compare algorithms with different performance measures using machine learning. Each algorithm worked better in some situations and worse in others. K-NN, RF, and Multilayer Perceptron (MLP) with hybrid Particle Swarm Optimization (PSO) and Ant Colony Optimization (ACO) are the models likely to work best in the data set used in this study. Setiawan et al. [22] implemented ANN with Rough Set Theory (RST) ,(ANN-RST) attribute reduction to predict the real missing attribute values on heart disease data, this method outperforms well in comparison to other techniques such as ANN, Piecewise Linear Network-Orthonormal Least Square feature selection (PLN-OLS), and KNN. Louridi et al. [23]. Suggest filling up missing values with the mean value instead of ignoring them, this approach gives better results with SVM in classification (Fig. 1).

The proposed architecture
Methodology
This section includes the dataset description, data pre-processing, and network architecture of the proposed model.
Datasets description
UCI heart disease dataset
UCI Heart disease Dataset is taken from the UCI machine learning repository [24], it contains data from four institutions [25]: Cleveland Clinic Foundation, Hungarian Institute of Cardiology, Budapest, V.A. Medical Centre, Long Beach, CA, and University Hospital, Zurich, Switzerland.
UCI heart disease is an open dataset with 76 attributes, but only fourteen were chosen for this research , as defined and proved most important to diagnose heart disease in the literature [26, 27] The complete description and the number of values for every attribute is shown within the Table 1 below.
Framingham dataset
The dataset was derived from an ongoing cardiovascular study including inhabitants of Framingham, Massachusetts, and is freely accessible via the Kaggle website [34]. The classification is used to determine whether a patient has a 10-year chance of developing coronary heart disease (CHD). The dataset contains information on patients and has a total of 4,240 records and 15 attributes. Each characteristic may be a risk factor. Concerns about demographic, behavioral, and medical characteristics are all risk factors.The complete description and the number of values for every attribute is shown within the Table 2 below.
Data processing
Label conversion
As indicated in the Table 1, the target in the UCI heart dataset contains values (0, 1, 2, 3,4). Where 0 indicates good health (absence of cardiovascular illness) and (1, 2, 3, 4 indicates the existence of cardiovascular disease.Our interest is to detect the absence or presence of heart disease, for this reason, the class must be limited to (0, 1), for that , Levels (1, 2, 3, 4) were reduced to 1.
Data normalization
In this study, MinMax normalization was applied. Min-max normalization is also known as feature scaling because it reduces the values of a numeric range of a data feature, i.e. more precisely to a scale between 0 and 1. The original data is subjected to linear transformation in this data normalization technique. The minimum and maximum values from the data are retrieved, and each value is replaced using the formula below:
where j in \(\{1,....n\}\) and n is the number of features
Filling missing data
In the dataset, we find out that there are some missing values in patients’ records, for instance, fasting blood sugar and major vessels that the university couldn’t identify. To address this issue, Kanikar and Shah [8] advised removing records with missing data and filling in default values where applicable. However, the findings were inadequate since this technique minimizes training data and ignores records with missing values.
To remedy the problem of missing values, we proposed to fill up missing cells with different techniques, such as mean value, K Nearest Neighbor (KNN), Random Forest (RF), and MICE.
-
Mean value: this algorithm consists of replacing the missing value with the mean of each column. This technique is frequently used because it is easy to implement [28], its formula is as below :
$$\begin{aligned} \begin{array}{rcl} X_{i}= \frac{\sum _{i=1}^{j}x_{ij}}{n} \end{array} \end{aligned}$$(2) -
K Nearest Neighbor (KNN): is an algorithm that is useful to match a point in a multi-dimensional space with its nearest k neighbors. It can be used for continuous, discrete, ordinal, and categorical data, which makes it particularly useful for handling missing data [29].
For example, we have 13 variables where RestBloodPressure is missing, Therefore for a given missing value, we will look at the other characteristics of the person, look for its k nearest neighbors then we can then approximate the RestBloodPressure of the person we wanted.
To select the best k (k nearest neighbors) value for the KNN algorithm, we trained two classifiers, SVM and BN, for various values of k, the better accuracy is achieved for k = 6 for the two classifiers. the Results are given in Fig. 2 below.
Fig. 2 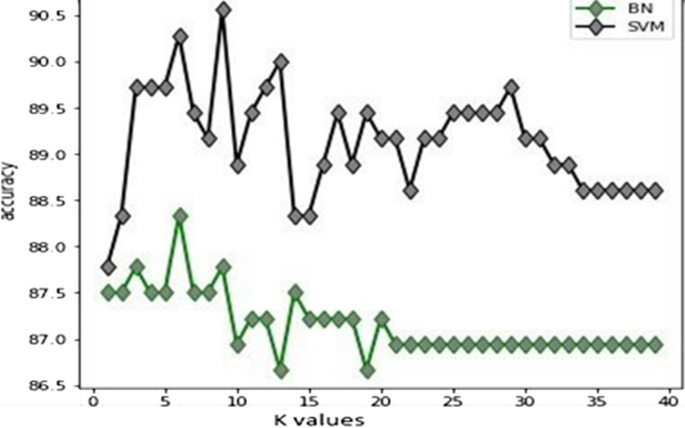
Variation of k value with accuracy
-
Random Forest (RF): is becoming increasingly popular for dealing with missing data, particularly in biomedical research. Unlike traditional imputation methods, RF does not assume normality or necessitate the specification of parametric models [30].
For instance, the Chol feature lacks 23 values. RF imputes missing data using the mean/mode, and then fits a random forest on the observed portion and predicts the missing portion for each variable with missing values. This training and prediction process is performed iteratively until the desired level of accuracy is attained or a user-specified maximum number of iterations is reached.
-
Multiple Imputations by Chained Equations (MICE): By using a divide and conquer method, MICE imputes missing values of the data set, by concentrating on one variable at a time. It uses all the other variables in the data set (or a sensitively selected subset of such variables) to estimate missing in that variable [31].
MICE replaces missing values in each variable with temporary values derived from the variable’s non-missing values. Replace the missing oldpeak value with the mean oldpeak value observed in the data, for example, or replace the missing ca values with the mean ca value observed in the data, and so on. MICE then returns to missing temporary value imputations for the oldpeak variable only. As a result, the current data has missing values for oldpeak but not for income or gender. The algorithm uses a linear regression to regress oldpeak on other variables; to fit the model to the current data copy, drop all records where oldpeak is missing during the model fitting process. The dependent variable in this model is oldpeak, and the other features are independent variables. MICE predicts the missing oldpeak values using the fitted regression model from the previous step. The algorithm goes through the same steps for each variable that has missing data.

Testing the methods of filling up the missing data
We tested the performance of the listed missing values algorithms (MICE,KNN, RF and mean value) by using different classifiers such as BN, SVM, and ANN.
Figure 3a–d displays the performances of each algorithm to fill up missing data. The results prove that the highest result is achieved by MICE imputation.

Chi-square calculus
Classification phase
Training phase
We split our data into train and test , we train the data by using different machine learning algorithms, namely Extreme Gradient Boosting (XGboost), Adaptive Boosting (Adaboost), Gradient Boosting, ExtraTrees,Light Gradient Boosting (Lightgbm), Stochastic Gradient Boosting (SGDC), and Nu SVM. The Table 3 describes the parameters of each algorithm.
Testing phase
After training our dataset with the above machine learning, we use a Stacking algorithm , which is the process that combines the predictions of several learning algorithms.
Stacking is an ensemble learning method that uses meta-learning to combine multiple machine learning algorithms. The base-level algorithms are trained on a complete training data-set, and the meta-model is trained on the outcomes of all base-level models as a feature.
Stacking is a higher level (blending level) extension of the voting classifier or voting regressor that learns the best aggregation of the individual results.
Figure 4 describes the process of Stacking, we have a training dataset that is trained on different classifiers (XGboost,Adaboost, Gradient Boosting, ExtraTrees, Lightgbm, SGDC and Nu SVM ) which give the Performances P1, P2, P3,P4, P5,P6, P7 , the Stack algorithm takes all predictions and gives a final prediction.
We used a stacking classifier with NuSVM as a metaclassifier in this study, with suffle set to false and cross validation set to 5. Stacking entails stacking the output of each estimator separately and using NuSVM to compute the final prediction. Stacking allows you to take advantage of each estimator’s strength by feeding their output into a final estimator.

Stacking architecture
Results and performances of classification
We evaluated the performance of our model using five specific performance measures namely: accuracy, specificity, recall, and F-measure
-
Specificity: is the proportion of the predicted negative cases that were correctly identified.
$$\begin{aligned} \begin{array}{rcl} Specificity = \frac{TN}{TN+FP} \end{array} \end{aligned}$$(3) -
Precision: is defined as the proportion of correctly predicted positive observations to all predicted positive observations.
$$\begin{aligned} \begin{array}{rcl} Precision = \frac{TP}{TP+FP} \end{array} \end{aligned}$$(4) -
Accuracy: measures the proportion of correctly predicted observations to total observations[76].
$$\begin{aligned} \begin{array}{rcl} Accuracy = \frac{TP+TN}{TP+TN+FP+FN} \end{array} \end{aligned}$$(5) -
Recall: measures how well the model identifies True Positives.
$$\begin{aligned} \begin{array}{rcl} Recall = \frac{TP}{TP+FN} \end{array} \end{aligned}$$(6) -
F-measure : measures probability that a positive prediction is correct.
$$\begin{aligned} \begin{array}{rcl} F-measure = \frac{2*Precision*Recall}{Precision+Recall} \end{array} \end{aligned}.$$(7)
Results and discussion
Performance results
To construct prediction models, a total of 13 important attributes are used, and modeling approaches are usedto calculate the performance of each model. As illustrated in Table 4, the Stacking method surpasses the othermachine learning techniques in terms of accuracy, F-Measure, precision, and sensitivity, all of which are increased by 1.4 to 2.4 percentage points. Extra Trees and LightGbm obtained the second highest performance level, although not as high as the stacking method. The XGBoost classifier has an accuracy of 92.37%, which is regarded reasonable but not adequate. When compared to other algorithms, Gradient Boost had the lowest accuracy of 90.27%.
Additionally, Fig. 5 demonstrates that the Stacking algorithm achieved an AUC value of 0.9583, indicating that it is capable of improving heart disease diagnosis.
When utilized alone, the base learners for predicting cardiovascular illness in patients produced ROC curves that indicated good model performance. However, the adoption of a stacking model improves accuracy. Indeed, the stacking approach was able to use all of the basis learners, resulting in model performance estimates that were higher than the base learners’ predictions. In other words, the final stacking model performed in accordance with mathematical proofs suggesting that the ROC of any stacking method will be greater than the ROC of any individual base learner. The purpose of utilizing a stacking approach is not to compare these models exhaustively but to combine their strengths into an ensemble that has been shown to result in improved performance.
On the Framingham dataset, we used a similar approach to validate our study’s performance. Prior to that, we needed to address the issue of unbalanced data. Indeed, in the Framingham dataset, the unaffected patients outnumber the ill patients. As a result, this issue impairs the model’s generalization and diminishes its ability to diagnose patients. To solve this issue, we use SMOTE oversampling with a k-neighbour parameter of 2 as shown in Table 5.
Moreover, Daily cigaret intake, body mass, hyperglycemia, heart rate, education, total cholesterol, and blood pressure medication are all missing values in the Framingham dataset, which are filled using the Mice algorithm (Table 6.).
According to Fig. 6 , the stacking technique produces favorable results for the ROC curve of the Framingham dataset, achieving an accuracy of 90.24 percent.

ROC curve of UCI heart disease dataset

ROC curve of Framingham dataset
Comparing results against other approaches
As illustrated in Table 7, our methodology outperforms earlier work methods in terms of classifying performance. Our model makes use of MICE imputation to deal with missing values during the preprocessing step, whereas previous work [8] suggests removing records with missing values, which produces suboptimal results. The earlier approaches [32, 33] achieved satisfactory results by incorporating additional preprocessing techniques and utilizing fundamental classifiers such as DT(Decision Trees),SVM,KNN,LR(Logistic Regression), and RF. Nonetheless, our method benefits from the use of MICE imputation and the stacking algorithm.
Conclusion
The number of patients with heart failure increased every day. There is a need for a system that can identify heart failure illness. For this purpose, Our approach consists to develop a system that resolves the missing data problem in the preprocessing step by using the MICE model that we prove is the best algorithm to fill inexistent values .We used XGboost, Adaboost, gradient boosting, extra trees, light gradient boosting Lightgbm, SGDC, Nu SVM a,d the stacking algorithm in the classification step ,the score accuracy of 95.83% was obtained by using the stacking algorithml.
The presented work can give a big push to automatic diagnosing to help physicians in diagnosing their patients and keep updating their medical status.
In future study, we will leverage the research presented here to develop an effective prediction system for improving medical treatment and lowering expenses. There are various prospects for additional study that would significantly enhance the functionality of the current research. Other disorders, such as diabetes, that are clinically related with heart disease should be considered. Additionally, we hope to apply AI to demonstrate a correlation between cardiac illness and meteorological conditions or air quality. Additionally, the prediction system might be integrated with other systems, such as a context-aware security access control system, to support the healthcare system’s security foundations.
Availability of data and materials
Not applicable. For any collaboration, please contact the authors.
References
https://www.who.int/cardiovascular_diseases/en/cvd_atlas_25_future.pdf?ua=1.
Benjamin EJ, Muntner P et al. Alonso, Alvaro, –Heart Disease and Stroke Statistics–2019 Update: A Report From the American Heart Association, Circulation, 2019;vol. 139, no. 10
Murthy H, Meenakshi M, –Dimensionality reduction using neuro-genetic approach for early prediction of coronary heart disease, in International Conference on Circuits, Communication, Control and Computing (I4C), 2014; pp. 329–332.
Bashir S, Khan ZS, Khan FH, Anjum A, Bashir K. Improving Heart Disease Prediction Using Feature Selection Approaches, in 16th International Bhurban Conference on Applied Sciences and Technology (IBCAST), 2019; pp. 619–623.
Gavhane A, Kokkula G, Pandya I, Devadkar PK. –Prediction of Heart Disease Using Machine Learning, in Proceedings of the 2nd International Conference on Electronics, Communication and Aerospace Technology, ICECA 2018, 2018; pp. 1275–1278.
Ismaeel S, Miri A, Chourishi D. Using the Extreme Learning Machine (ELM) technique for heart disease diagnosis, in 2015 IEEE Canada International Humanitarian Technology Conference. IHTC. 2015;2015:1–3.
Ekiz S, Erdogmus P. Comparative study of heart disease classification, in 2017 Electric Electronics. Computer Science, Biomedical Engineerings’ Meeting, EBBT. 2017;2017:1–4.
Kanikar P, Shah DR, Prediction of cardiovascular diseases using support vector machine and Bayesien classification, International Journal of Computer Applications (0975 – 8887) Volume 156 – No 2, December 2016.
Safa M, Pandian A, Applying machine learning algorithm to sensor coupled IoT devices in prediction of cardiac stress – An integrated approach,Materials Today: Proceedings,2021,ISSN 2214-7853, https://doi.org/10.1016/j.matpr.2021.02.698.
Balakrishnand D, Rajkumart T. Dhiliphan, Dhanasekaran S, An intelligent and secured heart rate monitoring system using IOT,Materials Today: Proceedings,2020,ISSN 2214-7853, https://doi.org/10.1016/j.matpr.2020.11.316.
Zaman MIU, Tabassum S, Ullah MS, Rahaman A, Nahar S, Islam AKM. Muzahidul, “Towards IoT and ML-Driven Cardiac Status Prediction System,” 2019 1st International Conference on Advances in Science, Engineering and Robotics Technology (ICASERT), 2019; pp. 1-6, https://doi.org/10.1109/ICASERT.2019.8934639.
Islam MR, Osmani MB, Tuhin SK. “IoT-based Low Cost Healthcare System for Cardiac Patient of Bangladesh using Bio-sensors,” 2019 2nd International Conference on Innovation in Engineering and Technology (ICIET), 2019, pp. 1-6, https://doi.org/10.1109/ICIET48527.2019.9290531.
Krittanawong C, Virk HUH, Bangalore S, et al. Machine learning prediction in cardiovascular diseases: a meta-analysis. Sci Rep. 2020;10:16057. https://doi.org/10.1038/s41598-020-72685-1.
Siontis KC, Noseworthy PA, Attia ZI, et al. Artificial intelligence-enhanced electrocardiography in cardiovascular disease management. Nat Rev Cardiol. 2021. https://doi.org/10.1038/s41569-020-00503-2.
Linda PS, Yin W, Gregory PA, et al. Development of a Novel Clinical Decision Support System for Exercise Prescription Among Patients With Multiple Cardiovascular Disease Risk Factors,Mayo Clinic Proceedings: Innovations, Quality & Outcomes,Volume 5, Issue 1,2021,Pages 193-203, ISSN 2542-4548
Ali Y, Amir R, Fardin A-M. Profile-based assessment of diseases affective factors using fuzzy association rule mining approach: A case study in heart diseases,Journal of Biomedical Informatics,Volume 116,2021,103695,ISSN 1532-0464, https://doi.org/10.1016/j.jbi.2021.103695.
Jesmin N, Tasadduq I, Kevin TS, Phoebe C-Y. Association rule mining to detect factors which contribute to heart disease in males and females,Expert Systems with Applications,Volume 40, Issue 4,2013,Pages 1086-1093,ISSN 0957-4174, https://doi.org/10.1016/j.eswa.2012.08.028.
Anbarasi M, Anupriya E, Iyengar NChSN. Enhanced prediction of heart disease with feature subset selection using genetic algorithm. International Journal of Engineering Science and Technology. 2010;2:5370–6.
Peter TJ, Somasundaram K, AN EMPIRICAL STUDY ON PREDICTION OF HEART DISEASE USING CLASSIFICATION DATA MINING TECHNIQUES, 2012.
Amin SU, Agarwal K, Beg R, Genetic Neural Network Based Data Mining in Prediction of Heart Disease Using Risk Factors, in Proceedings of 2013 IEEE Conference on Information and Communication Technologies (ICT 2013), 2013, no. Ict, pp. 1227–1231.
Khoudrfi Y, Bahaj M, Heart disease prediction and classification using machine learning algorithms potimized by ant colony optimization and particle swarm optimization, International Journal of Intelligent Engineering and Systems, 2019;Vol.12, No.1, https://doi.org/10.22266/ijies2019.0228.24.
Akhmad SN, Venkatachalam PA, Mohd H, Ahmad F. Missing data estimation on heart disease using Artificial Neural Network and Rough Set Theory. 2007. p. 129–33. https://doi.org/10.1109/ICIAS.2007.4658361.
Louridi N, Amar M, Ouahidi B. Identification of Cardiovascular Diseases Using Machine Learning. 2019;1-6. https://doi.org/10.1109/CMT.2019.8931411
UCI Machine Learning Repository. https//archive.ics.uci.edu/ml/datasets/Heart+Disease.
Lichman M. UCI Machine Learning Repository. [Online] Https://archive.ics.uci.edu/. 2013.
Bashir S, Khan ZS, Khan FH, Anjum A, Bashir K. –Improving Heart Disease Prediction Using Feature Selection Approaches, in 16th International Bhurban Conference on Applied Sciences and Technology (IBCAST), 2019; pp. 619–623.
Tiwaskar SA, Gosavi R, Dubey R, Jadhav S, Iyer K. Comparison of Prediction Models for Heart Failure Risk: A Clinical Perspective, in Fourth International Conference on Computing Communication Control and Automation (ICCUBEA), 2019; pp. 1–6.
Zhou XH1, Eckert GJ, Tierney WM , Multiple imputation in public health research, Statist. Med. 2001; 20:1541–1549 (https://doi.org/10.1002/sim.689)
Pan R, Yang T, Cao J, Lu K, Zhang Z, -Missing data imputation by K nearest neighbours based on grey relational structure and mutual information, Appl. Intell., 43(3), pp. . [68] Fei Tang and Hemant Ishwaran. Random forest missing data algorithms, Wiley. 2015. https://doi.org/10.1002/sam.11348.
Hong S, Lynn HS. Accuracy of random-forest-based imputation of missing data in the presence of non-normality, non-linearity, and interaction. BMC Med Res Methodol. 2020;20:199. https://doi.org/10.1186/s12874-020-01080-1.
White IR, Royston P, Wood AM (2011) Multiple imputation using chained equations: Issues and guidance for practice. Statist. Med., 30: 377-399. https://doi.org/10.1002/sim.4067
Kabir HE, Shahid Z. Developing a Hyperparameter Tuning Based Machine Learning Approach of Heart Disease Prediction. J Appl Sci Process Eng. 2020;7:631-647. https://doi.org/10.33736/jaspe.2639.2020.
Ramesh G, Madhavi Karanam, Reddy P. Dileep Kumar, Somasekar J, Joseph Tan. Improving the accuracy of heart attack risk prediction based on information gain feature selection technique,Materials Today: Proceedings,2021,ISSN 2214-7853, https://doi.org/10.1016/j.matpr.2020.12.079. (https://www.sciencedirect.com/science/article/pii/S2214785320397649)
Acknowledgements
Not applicable.
Funding
Not applicable. This research received no specific grant from any funding agency.
Author information
Authors and Affiliations
Contributions
All authors read and approved the final manuscript.
Corresponding authors
Ethics declarations
Ethics approval and consent to participate
The author confirms the sole responsibility for this manuscript. The author read and approved the final manuscript
Consent for publication
Open Access This article is licensed under a Creative Commons Attribution 4.0 International License, which permits use, sharing, adaptation, distribution and reproduction in any medium or format, as long as you give appropriate credit to the original author(s) and the source, provide a link to the Creative Commons licence, and indicate if changes were made. The images or other third party material in this article are included in the article’s Creative Commons licence, unless indicated otherwise in a credit line to the material. If material is not included in the article’s Creative Commons licence and your intended use is not permitted by statutory regulation or exceeds the permitted use, you will need to obtain permission directly from the copyright holder. To view a copy of this licence, visit http://creativecommons.org/licenses/by/4.0/.
Competing interests
The authors declare that they have no competing interests.
Additional information
Publisher's Note
Springer Nature remains neutral with regard to jurisdictional claims in published maps and institutional affiliations.
Rights and permissions
Open Access This article is licensed under a Creative Commons Attribution 4.0 International License, which permits use, sharing, adaptation, distribution and reproduction in any medium or format, as long as you give appropriate credit to the original author(s) and the source, provide a link to the Creative Commons licence, and indicate if changes were made. The images or other third party material in this article are included in the article's Creative Commons licence, unless indicated otherwise in a credit line to the material. If material is not included in the article's Creative Commons licence and your intended use is not permitted by statutory regulation or exceeds the permitted use, you will need to obtain permission directly from the copyright holder. To view a copy of this licence, visit http://creativecommons.org/licenses/by/4.0/.
About this article

Cite this article
Louridi, N., Douzi, S. & El Ouahidi, B. Machine learning-based identification of patients with a cardiovascular defect. J Big Data 8, 133 (2021). https://doi.org/10.1186/s40537-021-00524-9
Received:
Accepted:
Published:
DOI: https://doi.org/10.1186/s40537-021-00524-9