
Abstract
One of the challenges in diagnosing stroke disease is the lack of useful analysis tool to identify critical stroke data that contains hidden relationships and trends from a vast amount of data. In order to address this problem, we proposed Intuitionistic Fuzzy Based Decision Tree in order to diagnosis the different types of stroke disease. The approach is implemented by mapping observation data into Intuitionistic Fuzzy Set. These results lead to a compound of a membership function, non-membership function, and a hesitation degree for each record. The result of Intuitionistic Fuzzy is calculated using Hamming Distance as main requirement for Intuitionistic Fuzzy Entropy. The Hamming Distance calculate the difference between values on the same variable. Main advantage of this approach is that we can find out variables effected on the stroke disease using information gain derived from Intutionistics Entropy. Furthermore, the Intuitionistic Fuzzy based Decision Tree are able to provide plenty of information to stakeholders regarding the hidden facts of established rules and utilize linguistic terms to accommodate unclearness, ambiguity, and hesitation in human perception. The results of Intuitionistic Fuzzy Entropy determine the root and node in the formation of the decision tree model based on the information gain of variables in the data. In this study, simulation results show that the approach successfully determine 20 variables that directly influence stroke. These variables are used to classify the types of stroke. Furthermore, results show that the approach has resulted in 90.59% in classifying stroke disease. Results of the study also demonstrates that the approach produces the best diagnosis performance compared to the other two models according to the accuracy of classification from the type of stroke disease.
Introduction
Stroke or cerebro-vascular accident (CVA) is a condition in which part of the brain abruptly loses its source of nutrients, oxygen and glucose, that are normally delivered to it by way of the vascular system [11]. Lubis et al. [20] explained that there are two types of stroke, ischemic and hemorrhagic. An ischemic stroke (ISC) is one in which a solid blood clot blocks the flow of blood in an artery to the brain. On the other hand, a hemorrhagic stroke (HEM) is one in which a blood vessel bursts and the blood creates pressure in the brain [20]. Furthermore, a brief stroke attack that come about less than 24 h is called Transient Ischemic Attack (TIA). For over a 1000 years, stroke has become the third of the deadliest diseases around the world, after the heart attack and all types of cancer disease [19]. Research conducted by Park and Ovbiagele [21], explained that people who have the mild disability after stroke disease would potentially experience severe stroke disease in the future.
Based on the data collected by the World Health Organization (WHO), more than 15 million people suffer from stroke diseases each year [29]. Among these, 5 million people died and another 5 million had a long-term disability. If the condition is not addressed and treated properly, then the number of deaths is predicted to increase up to 23.3 million in 2030 [17]. One of the challenges in diagnosing stroke disease is the lack of useful analysis tools to analyse the data. This has an impact on the way stakeholder make the decision based on information obtained from the patient data.
To help health practitioner in different level of treatments to extracts useful knowledge from a large volume of patients’ data, data mining tools obviously are required. Data mining tools provide to unveil previously unknown solution. They improve data analysis on large datasets of patients data to gain useful information for diagnosing and allocating suitable treatment. Many studies used data mining techniques in health environment to perform analysis [8, 9, 25]. Research which was conducted [25], proposed hybrid data mining in order to provide reliable performance to diagnose heart disease and choose the best treatment for the patient. While, [9] implemented three data mining algorithms including CART (Classification and Regression Tree), ID3 (Iterative Dichotomized 3) and DT (Decision Table) extracted from a decision tree or rule-based classifier to create the prediction models using a dataset of heart disease. Moreover, they proposed a new hybrid data mining model. Hereinafter, [8] used classification techniques using principal component analysis (PCA) and linear discriminant analysis (LDA) methods to detect lung cancer disease. Based on the exposure above, one of the advantages of data mining has been used in the field of health is to make the diagnosis of disease by classification techniques. In order to gain insight for collecting information about health, we use Intuitionistic Fuzzy based Decision Tree health for stroke disease in health analytics in this study.
The computational challenges reveal when abundant of data and knowledge results from practical experiences among health worker and professional, which lead them for the intuition deployment within health diagnosis and treatment. It is now related to an approach called as the Intuitionistic fuzzy set. The Intuitionistic fuzzy set was first proposed by Atanassov [2]. It is one of the most effective and efficient ways of representing statements or arguments in linguistics because it calculates the hesitation degree to determine the statement including membership functions or non-membership functions. The benefits of using Intuitionistic Fuzzy are calculating intuition from experts or practician based on their experience, avoid bias and help to diagnosis disease [27]. Based on psychology, intuition is able to quickly process a lot of information without seeing the cognitive effort [14, 28].
Furthermore, hesitation margin of Intuitionistic Fuzzy set is important while considering entropy in the decision tree that will be built [7]. An Intuitionistic fuzzy based decision tree will be applied in data stroke to classify the type of stroke that patients have. Das [10] explained that analytics is the process of transforming raw data into actionable strategic knowledge in order to gain insight into business processes, and thereby guide decision-makers to help businesses run efficiently. Furthermore, the development of analytics is business analytics that aims to identify trends and understand information based on exploration of historical data from multiple data sources using statistical analysis, data mining, and other techniques to enable managers to know information based on previously hidden patterns [4]. There are six stages of business analytics, which are data quality analytics, descriptive analytics, diagnostics analytics, predictive analytics, prescriptive analytics and semantic analytics [10]. Additionally, Raghupathi and Raghupathi [23] proposed specific analytics called as health analytics.
Health analytics is the utilization of medical data, statistical analysis and computer-based model into actionable strategic knowledge in order to assist health service providers obtaining the better understanding regarding patients and making the more proper decision according to the existing facts [23]. Currently, health analytics has been used for healthcare professionals to identify areas of deficiency and suggest potential improvements in the emergency room (ER) [16]. The research applied solutions and monitored two indicators: Long-Stay ER (LOS), and percentage of patients who are left unattended, indicating the effectiveness of the ER. Other research implemented a predictive analytics modeling to generate probability estimation of The Veteran Health Administration (VHA). The predictive analytics was used in VHA to estimate parameters of patient’s past history that provide insight into past behavior that affects future action, and is essential for clinical planning and scheduling decisions to improve patient care [13]. Based on previous research that has been presented above, health analytics has shown to be an effective tool to improve the quality and performance of patient service. However, those studies [13, 16] have not applied more specific types of disease such as stroke. This research determined the classification of stroke using Intuitionistic Fuzzy Decision Tree in diagnostic analytics.
In regard of the potential contribution by the outcomes of this study, there are two points. The first contribution is by the formation of decision tree model in this research, that was implemented in stroke patients medical data using intuitionistic fuzzy based decision tree technique. This result of influential variables is highly providing information for the further and deepen studies concerning stroke diagnosis and its handling or other related diseases. In order to cope with the idea of diagnosis analytics, the second contribution is to provide relevant scorecards based on influential variable of stroke disease previosly extracted from the rules.
The rest of this study is organized as follows. Section 2 introduces Intuitionistic Fuzzy based decision tree in order to classify stroke, followed by Sect. 3 with the implementation of Intuitionistic Fuzzy Based Decision Tree for Stroke Diagnosis. Section 4 showed the results of the experiment. Finally the conclusions are given in Sect. 5.
Intuitionistic fuzzy sets (ifs)
The fundamental of fuzzy concept was introduced in 1965 [32]. Generally, Yager and Zadeh [31] explained that fuzzy logic is the logic that underlies the reasoning of a thing by way of precise estimates. They proposed a mathematical form to see how vagueness can be expressed in human languages, such as far, near, big or small. Intuitionistic Fuzzy Sets consists of membership and non-membership function for the amount of data attributes ith [2]. The Intuitionistic Fuzzy Sets represent information more abundant and flexible than the fuzzy set when uncertainty such as hesitancy degree. It is one of the most effective and efficient ways of representing statements or arguments in linguistics because it calculates the hesitation degree to determine the statement including membership functions or non-membership functions. The benefits of using Intuitionistic Fuzzy are calculating intuition from experts or practician based on their experience, avoid bias and help to diagnosis disease [27]. Additionally, Fuzzy logic is also the fastest way to map an input space into an output space using the degree of membership. Moreover, a fuzzy set in X was given as follows
where \(\mu_{{A^{\prime}}} \left( x \right) \in \left[ {0,1} \right]\) is the membership function of fuzzy set A. Furthermore, Atanassov [2] purposed the Intuitionistic Fuzzy Set (IFS) in 1983. The IFS is a generalization of fuzzy theory characterized by membership degree and non-membership degree. The IFS also takes into account the Hesitation degree as defined as one taken away the degree of membership and degree of non-membership. The concept of IFS is, let a (crisp) set X be fixed and let A ⊂ E be a fixed set. An IFS A in E is an object of the following form
where, \(\mu_{A} : X \to \left[ {0,1} \right]\) and \(v_{A} : X \to \left[ {0,1} \right]\), such that
Obviously, every ordinary fuzzy set have the following form
then \(\uppi_{\text{A}} ( {\text{x)}}\) is the degree of hesitation margin. It turns out that the hesitation margin is important while entropy [26] is considered.
Intuitionistic fuzzy based decision tree
Basically, decision tree formulation defines the roots, initial node, and leaf node. The algorithm starts with a training set of tuples and their associated class labels [12]. Decision tree chooses the attributes in order to be the roots, initial node, and leaf node by using entropy and information gain. The following equation is the formulation to determine entropy and information gain [6]:
E is the entropy training set, while pi is the non zero probability that an arbitrary tuple in E belongs to class Ci.
The intuitionistic fuzzy decision tree presented here was using intuitionistic fuzzy entropy in order to get entropy and information gain. The following equation is the formulation to determine intuitionistic fuzzy entropy as denoted as EIFS [26]:
where M and N are the intuitionistic fuzzy elements \(\left( \langle \upmu , {\text{v}},\;\varvec{\pi} \rangle \right)\) fully belonging (M) and not fully belonging (N). Furthermore, \({\text{H}}_{\text{ifs}}\) is the normalized Hamming distance with the highest value of membership, nonmembership and hesitation [26]:
Algorithm 1: Intuitionistic fuzzy based decision tree algorithm:
-
1.
Create root node for the tree that has a set of intuitionistic fuzzy data
-
2.
If a node t with an intuitionistic fuzzy set of data D satisfies the following conditions, then it is a leaf node and assigned by the class name.
-
The proportion of a class Ck is greater than equal to Ɵr, \(\frac{{\left| {D^{ci} } \right|}}{\left| D \right|} \ge\uptheta_{r}\).
-
The number of data sets is less than Ɵn.
-
There are no attributes for more classifications.
-
Stop the tree building
-
Prune the tree
-
-
3.
If node D does not satisfy the above conditions, then it is not a leaf-node, and a new sub-node is generated as follows:
-
Counting the frequency of classes
-
Deriving the IFS
-
Calculating the intuitionistic entropy
-
Choosing the greatest value of information gain.
-
Deriving the child node for each information gain
-
Replacing the D by Dj (j = 1,2,…, m) and repeat from 2 recursively
-
Implementation of intuitionistic fuzzy based decision tree for stroke diagnosis
Data description
In this study, we utilized data from BioMed Central [24], which consisted of 19.436 patient data. With 114 variables of medical records from patients with stroke and 85% of patients is the ischemic stroke. After conducting the discussion with experts and data preprocessing (missing values and in order to improve the data quality, eventually 37 variables and 18.425 patients data were used in this study. Early stroke symptom is presumed by analyzing and assessing three types of factors, namely General identification, Drug type and drug condition, and Patient condition, where each contain numbers of variables as further presented in Table 1. These attributes were all important factors which affect individual health in stroke disease.
Furthermore, the dataset is divided into training data and test data by using K-fold cross-validation to divide the dataset into 10-fold cross-validation. This process divided data randomly into 10 sections, then 10 experiments were run sequentially, where each experiment deploy the 10th partition data as testing data and the rest of the partition as training data. Cross-validation validates the accuracy of the classification model [30]. Referring to [15, 18, 33] 10-fold cross-validation has proved that various tests with different datasets and different learning techniques have shown that 10 is the right number of folds to get the best error estimates.
Rules from tree
According to Algorithm 1, things that should be done is create the root node, splitting into branch node and get the leaf node.
-
1.
We change data into IFS membership function forms. For instance, we used the age of patient as a IFS membership function form as shown in Fig. 1.
Fig. 1 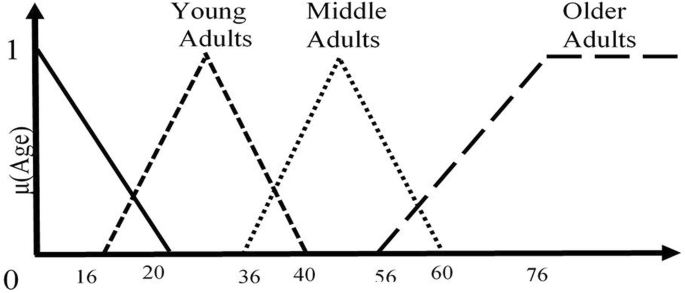
Membership function of patient age

-
2.
After converting the data into IFS, we split the data into two, data training and data testing. Data training is used to build the decision tree, then data testing is used to test data on training data. Furthermore, we calculate entropy to determine the next step. The way calculate entropy, has been shown in Eq. 8. Initially, the calculated entropy is TARGET entropy.
Step 1: Calculating the Information Entropy of training set sample S according to Eq. 5. The training is 14.750 sample, so \(n =\) 14.750. These samples were classified into four types: ISC, HEM, TIA and Nonstroke. The number of ISC is 12.317, HEM is 1472, TIA is 620 and Nonstroke is 341. Then the result of entropy as follows:
Step 2: Calculate The Intuitionistic Fuzzy value using Intuitionistic Fuzzy Entropy according to Eq. 8. In this paper, we used Age Variable for example where the value is 57. The result of age variable with the value 57 for membership is 0.25, nonmembership is 0.75 and hesitation is 0.25. Then the result of intuitionistic fuzzy entropy as follows:
Step 3: Calculate information gain according to Eq. 7 and \({\text{E}}_{\text{Sub}}\) replaced by \({\text{E}}_{\text{IFS}}\) as follow:
-
3.
Then all attributes are calculated entropy based on entropy TARGET as in Eq. 6. After getting the value of entropy, we calculate the information gain, according to the Eq. 7. We repeated those steps until there were no attributes left. If the size of the tree is huge, we should prune the tree. A pruning technique is used to reduce the size of the tree by eliminating the small possibility to classify TARGET. Pruning aims to predict the complexity of decision trees that have been made but still have high accuracy in making the diagnosis. The pruning technique used is error based pruning (EBP) as it is in the J.48 algorithm. EBP prunes the internal node from the bottom of the decision tree with Eq. 11 [22].
 (11)
(11)where ẻ\(\left( t \right)\) is the error rate internal node, ẻ\(\left( {T_{t} } \right)\) is the error rate with internal node \(\left( t \right)\), while std(ẻ\(( T_{t} )\)) is standard of error rate subtree with internal node t with Eq. 12 for the detail.
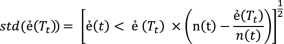 (12)
(12)where \({\text{n}}\left( {\text{t}} \right)\) is the number of nodes checked for error rate.


The evaluation of model
Performance evaluation is conducted on the model with the aim to know how well the model performance using test data. Evaluation is based on accuracy, sensitivity and specificity. Accuracy is the degree of closeness of measurements of the quantity to that true value of the quantity, sensitivity is the fraction of the relevant samples that are retrieved, and specificity calculates the actual positive proportions correctly identified. Accuracy, sensitivity and specificity are calculated as shown in Eqs. 13, 14, and 15 based on Table 2 [5].
Diagnosis analytics
Diagnosis analytics is used to assess why a particular result can occur based on existing data. At this level of analytics, the context of the data is examined, and the factors which have the possibility of contributing to the results are evaluated [3]. In order to examine the data and showed the cause-effect relationship among variables of stroke disease, we used the scorecard. The aims of the scorecard are displaying the record summaries of data, shows the cause-effect relationship variables of stroke disease, and periodically updated chart. Diagnosis analytics helps the paramedics to identify the causes leading to the realized performance. Diagnosis analytics include understanding the impact of the input factors of stroke and operational policies on the performance measures. The resource of diagnosis analytics based on the result of information gain from Intuitionistic Fuzzy based Decision Tree.
Result and discussion
After performing an implementation using Intuitionistic Fuzzy based Decision Tree, attributes that influence classification are created into a tree and shown in Fig. 2. 40 attributes existed before, only 25 attributes have the most significant influence based on the value of the calculated information gain. These attributes determine the formation of decision trees and the classification of stroke diagnoses in this study.
Arslan et al. [1] discussed the classification of specific stroke diseases (ischemic) using data mining techniques, namely Support Vector Machine (SVM), Stochastic Gradient Boosting (SGB) and penalized logistic regression, with different group variables. However, several similar results found in the final outcome variables most influential with the results of this study, including age variables. Arslan’s research uses the elements of medical checkup analysis (e.g., White blood cell, Hematocrit, Hemoglobin, Platelet).
Using the same data, decision tree based algorithms were compared to assess the accuracy of this study, i.e. J48 and C5.0. Table 3 shows that the resulting accuracy value is not significant. This is due to techniques in making the decision tree used was almost the same, so the accuracy obtained was not much different. These results were not expected where significant results should be used as a basis/further analytical basis, such as the initial diagnosis of the patient before further action was taken. So in the future research improvements can be applied on the more specific variables to increase the value of significance. Compared with the prior studies, insignificant results were also obtained by [7] which examined the glass by compared Random forest, J48, Soft Decision Tree and Intuitionistic Fuzzy Decision Tree itself had an insignificant accuracy.

Tree formation
What difference the algorithm was the establishment of a decision tree model based on its attributes. In the formation of J.48 and C5.0, rules were almost the same, the excellence in Intuitionistic Fuzzy-based Decision Tree is the hesitation degree in the formation of rules to be taken into account. The result of tree formation as seen in Fig. 2. By selecting the same node, the classification results indicated the type of Ischemic stroke, and the resulting rule was different. The rule in Intuitionistic Fuzzy based decision tree possessed hesitation degree in variable age, moreover the hesitation degree could make the rule more specific in classification the type of stroke disease (Table 4).

Classification model performance
Evaluation of classification results is calculated using several methods, such as precision, sensitivity, and specificity. Table 5 is a confusion matrix for the stroke classification model. Subsequently.
Model evaluation using testing data and training data, in this research indicates that the classification model of the type of stroke disease produced is quite good. The AUC value for the classification model in this study shows a high-performance level (AUC = 0.73) as shown in Fig. 3. Based on the information gain of Intuitionistic Fuzzy based Decision Tree the scorecard is shown in Fig. 4. Figure 4 illustrates the influential variable of stroke types on Intuitionistic Fuzzy based Decision Tree models to understand the underlying causes of stroke disease.

Diagnosis analytics based on type of stroke
Conclusion
This paper contribute a formulation of Intuitionistic Fuzzy based Decision Tree to classify types of stroke in BioMed Central data. The advantage of Intuitionistic Fuzzy based Decision Tree is the core of diagnosis analytics as a classification model to support physicians and paramedics to determine future action in patients. This model accommodates the doctor's and paramedic's intuition and provides a crisp solution that applies to particular cases. The Proposed diagnosis analytics proofs as an effective and efficient way of representing statements or arguments with utilization of the hesitation degree to help deeper interpretation with membership functions and non-membership functions. This approach showed a better comparable understanding to other similar decision tree models.
Abbreviations
- CART:
-
classification and regression tree
- CT-Scan:
-
computed tomography scan
- CVA:
-
cerebro-vascular accident
- DT:
-
decision table
- HEM:
-
hemorrhagic stroke
- ID3:
-
iterative dichotomized 3
- IFS:
-
intuitionistic fuzzy set
- ISC:
-
ischemic stroke
- TIA:
-
transient ischemic attack
References
Arslan AK, Colak C, Sarihan ME. Different medical data mining approaches based prediction of ischemic stroke. Comput Methods Programs Biomed. 2016;130:87–92. https://doi.org/10.1016/j.cmpb.2016.03.022.
Atanassov KT. On intuitionistic fuzzy sets theory. Berlin: Springer; 2012.
Baer LL, Norris DM (2015) What Every Leader Needs to Know About Student Success Analytics White paper developed for Civitas Learning. Retrieved June 17:2016
Bag D. Business analytics. Didcot: Taylor & Francis; 2016.
Balali V, Golparvar-Fard M. Evaluation of multiclass traffic sign detection and classification methods for US roadway asset inventory management. J Comput Civil Eng. 2015;30:04015022.
Bramer M. Data for data mining. Principles of data mining. Berlin: Springer; 2016. p. 9–19.
Bujnowski P, Szmidt E, Kacprzyk J. Intuitionistic fuzzy decision tree: a new classifier. Intelligent systems’ 2014. Berlin: Springer; 2015. p. 779–90.
Chauhan D, Jaiswal V An efficient data mining classification approach for detecting lung cancer disease. In: International conference on communication and electronics systems (ICCES). IEEE; 2016. p 1–8.
Chaurasia V (2017) Early prediction of heart diseases using data mining techniques.
Das S. Computational business analytics. Boca Raton: CRC Press; 2013.
Edlow JA. Stroke (Biographies of Disease) cerebrovascular. Westport: Greenwood Press; 2008.
Han J, Pei J, Kamber M. Data mining: concepts and techniques. New York: Elsevier; 2011.
Harris SL, May JH, Vargas LG. Predictive analytics model for healthcare planning and scheduling. Eur J Oper Res. 2016;253:121–31.
Hogarth RM. Intuition: a challenge for psychological research on decision making. Psychol Inq. 2010;21:338–53.
Hooten MB, Hobbs N. A guide to Bayesian model selection for ecologists. Ecol Monogr. 2015;85:3–28.
Khalifa M, Zabani I. Utilizing health analytics in improving the performance of healthcare services: A case study on a tertiary care hospital. J Infect Public Health. 2016;9:757–65.
KKRI (2014) Penyakit Tidak Menular. Ministry of Health Republic of Indonesia. http://www.depkes.go.id/folder/view/01/structure-publikasi-pusdatin-buletin.html. Accessed 2 Aug 2017.
Lever J, Krzywinski M, Altman N. Points of significance: model selection and overfitting. London: Nature Publishing Group; 2016.
Lindley RI. Stroke. Oxford: Oxford University Press; 2017.
Lubis SA, Novitri N, Rizal A. Comparison of post-stroke functional recovery between ischemic and hemorrhagic stroke patients: a prospective cohort study. Althea Med J. 2017;4:267–70.
Park JH, Ovbiagele B. Relationship of functional disability after a recent stroke with recurrent stroke risk. Eur J Neurol. 2016;23:361–7. https://doi.org/10.1111/ene.12837.
Quinlan JR. C4. 5: programs for machine learning. New York: Elsevier; 2014.
Raghupathi W, Raghupathi V. An overview of health analytics. J Health Med Inf. 2013;4:2.
Sandercock PA, Niewada M, Członkowska A. The international stroke trial database Trials. 2011;12:101.
Shouman M, Turner T, Stocker R. Using data mining techniques in heart disease diagnosis and treatment. In: 2012 Japan-Egypt conference on electronics, communications and computers (JEC-ECC). IEEE; 2012. p 173–7.
Szmidt E, Kacprzyk J. Entropy for intuitionistic fuzzy sets. Fuzzy Sets Syst. 2001;118:467–77.
Thong NT. Intuitionistic fuzzy recommender systems: an effective tool for medical diagnosis. Knowl-Based Syst. 2015;74:133–50.
Tonetto L, Tamminen P. Understanding the role of intuition in decision-making when designing for experiences: contributions from cognitive psychology. Theor Issues Ergonom Sci. 2015;16:631–42.
WHO (2014) World Health Organization. http://www.who.int/topics/cerebrovascular_accident/en/. Accessed 02 July 2017.
Witten IH, Frank E, Hall MA, Pal CJ. Data Mining: Practical machine learning tools and techniques. Burlington: Morgan Kaufmann; 2016.
Yager RR, Zadeh LA. An introduction to fuzzy logic applications in intelligent systems, vol. 165. Berlin: Springer; 2012.
Zadeh LA. The birth and evolution of fuzzy logic. Int J Gener Syst. 1990;17:95–105.
Zhang Y, Yang Y. Cross-validation for selecting a model selection procedure. J Econom. 2015;187:95–112.
Authors’ contributions
AM carried out the idea and implementation of this research as well as interpretation of results. TD and MH made substantial contributions to the conception and design of this research as well as critically reviewing and interpreting results. All authors read and approved the final manuscript.
Acknowledgements
This article has been extracted from the thesis written by Anis Fitri Nur Masruriyah in Computer Science Department, Bogor Agricultural University.
Competing interests
The authors declare that they have no competing of interests.
Availability of data and materials
Not applicable
Source funding
This research did not receive any specific grant from funding agencies in the public, commercial, or not-for-profit sectors.
Publisher’s Note
Springer Nature remains neutral with regard to jurisdictional claims in published maps and institutional affiliations.
Author information
Authors and Affiliations
Corresponding author
Rights and permissions
Open Access This article is distributed under the terms of the Creative Commons Attribution 4.0 International License (http://creativecommons.org/licenses/by/4.0/), which permits unrestricted use, distribution, and reproduction in any medium, provided you give appropriate credit to the original author(s) and the source, provide a link to the Creative Commons license, and indicate if changes were made.
About this article

Cite this article
Djatna, T., Hardhienata, M.K.D. & Masruriyah, A.F.N. An intuitionistic fuzzy diagnosis analytics for stroke disease. J Big Data 5, 35 (2018). https://doi.org/10.1186/s40537-018-0142-7
Received:
Accepted:
Published:
DOI: https://doi.org/10.1186/s40537-018-0142-7