
Abstract
Background
Sarcopenia is a progressive age-related disease that can cause a range of adverse health outcomes in older adults, and older adults with severe sarcopenia are also at increased short-term mortality risk. The aim of this study was to construct and validate a risk prediction model for sarcopenia in Chinese older adults.
Methods
This study used data from the 2015 China Health and Retirement Longitudinal Study (CHARLS), a high-quality micro-level data representative of households and individuals aged 45 years and older adults in China. The study analyzed 65 indicators, including sociodemographic indicators, health-related indicators, and biochemical indicators.
Results
3454 older adults enrolled in the CHARLS database in 2015 were included in the final analysis. A total of 997 (28.8%) had phenotypes of sarcopenia. Multivariate logistic regression analysis showed that sex, Body Mass Index (BMI), Mean Systolic Blood Pressure (MSBP), Mean Diastolic Blood Pressure (MDBP) and pain were predictive factors for sarcopenia in older adults. These factors were used to construct a nomogram model, which showed good consistency and accuracy. The AUC value of the prediction model in the training set was 0.77 (95% CI = 0.75–0.79); the AUC value in the validation set was 0.76 (95% CI = 0.73–0.79). Hosmer–Lemeshow test values were P = 0.5041 and P = 0.2668 (both P > 0.05). Calibration curves showed significant agreement between the nomogram model and actual observations. ROC and DCA showed that the nomograms had good predictive properties.
Conclusions
The constructed sarcopenia risk prediction model, incorporating factors such as sex, BMI, MSBP, MDBP, and pain, demonstrates promising predictive capabilities. This model offers valuable insights for clinical practitioners, aiding in early screening and targeted interventions for sarcopenia in Chinese older adults.
Background
With the rapid development of China’s economy, the country has gradually transitioned into an aging society. According to the findings of the seventh census conducted in 2020, China’s population aged 60 and above is projected to exceed 260 million, accounting for 18.7% of the total population. Within this demographic, those aged 65 and above are expected to surpass 190 million, making up 13.5% of the total population [1]. The increasing number of older adults will significantly escalate expenditures within the social security system, imposing a considerable financial burden on the government. Among the various health-related factors contributing to disability in older adults, sarcopenia and cognitive impairment have attracted significant academic and clinical attention [2]. Currently, China’s focus on sarcopenia has started relatively late, with general hospitals showing evident specialization and insufficient understanding of sarcopenia, which has yet to be categorized into a specific field.
Sarcopenia was traditionally defined by a reduction in muscle mass, but current research highlights the significance of muscle strength and its impact on physical function [3]. Since 2016, the World Health Organization has officially recognized sarcopenia as a disease and a pressing public health concern in aging populations [4,5,6]. The loss of skeletal muscle mass is central to sarcopenia and can lead to physical dysfunction [7]. Studies indicate that sarcopenia affects over a quarter of older adults in Chinese communities [8], with a global incidence among individuals over 60 ranging from 10 to 27% [9]. Various factors contribute to the onset of sarcopenia, including age, nutrition intake, physical inactivity, diseases, and iatrogenic factors [10]. Risk factors such as aging, malnutrition, smoking, and low BMI have been identified [11, 12], with higher prevalence observed in patients with chronic obstructive pulmonary disease [13], chronic heart failure [14] and chronic liver disease [15]. Furthermore, sarcopenia is associated with adverse outcomes like falls, functional decline, frailty, and mortality [16, 17].
Although there are a number of sarcopenia risk prediction models, they all have some limitations. For example, some models have small sample sizes, which may limit their generalizability and applicability to different older adults [18]. Additionally, some models rely on predictor variables that are difficult and time-consuming to collect, limiting their usefulness in real-world clinical applications [19]. Furthermore, there are models that do not capture all risk factors for sarcopenia, which may affect their predictive accuracy [20]. These limitations underscore the need for further research to develop more comprehensive and practical prediction models for sarcopenia.
In contrast to foreign studies primarily focused on disease-specific correlations with sarcopenia, research in our country is predominantly centered on current situations and influencing factors. Key factors such as age, exercise habits, number of diseases, malnutrition, risk of falls, and fatigue are identified as easily inducible factors for sarcopenia. This study aims to identify and incorporate these factors into the construction of a sarcopenia risk prediction model, providing valuable insights for early screening and intervention by clinical medical staff.
Methods
Data source
We utilized data from the China Health and Retirement Longitudinal Study (CHARLS), publicly accessible at http://charls.pku.edu.cn. CHARLS is an ongoing longitudinal survey encompassing families and individuals aged 45 and older across 150 counties and 450 communities (villages) within 28 provinces, autonomous regions, and municipalities nationwide. Its comprehensive content spans demographic, economic, health, pension, and other pertinent information. Approval for this project was granted by the Biomedical Ethics Committee of Peking University (Beijing, China) (IRB00001052-11015), with our study adhering strictly to the principles outlined in the Declaration of Helsinki, and obtaining informed consent from all participants. Our analysis specifically focused on CHARLS2015 data, wherein after excluding subjects with missing data, a total of 3454 participants were ultimately included in our study cohort. Notably, our research targeted individuals aged 60 and above. The flowchart of the study is outlined in Fig. 1.
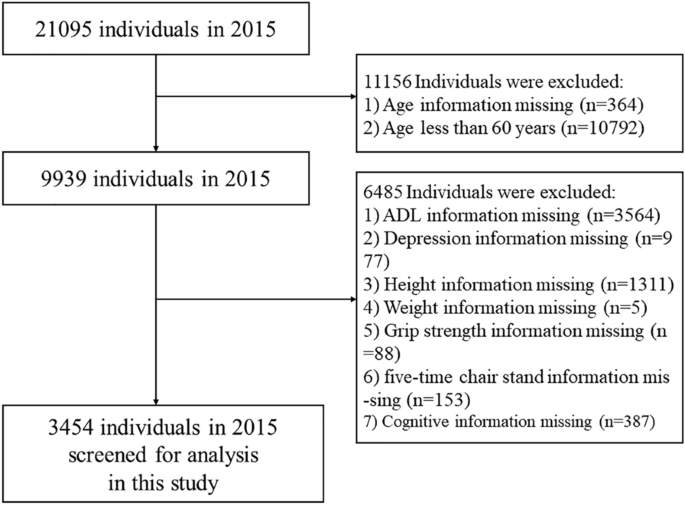
Flowchart of the study
Data extraction
Assessment of symptoms of sarcopenia
Sarcopenia was evaluated according to the criteria recommended by the AWGS2019 [7], which encompass muscle strength, physical performance and appendicular skeletal muscle mass (ASM). Handgrip strength (unit: kg) was assessed in both the dominant and non-dominant hand using the YuejianTM WL-1000 dynamometer. Participants were instructed to squeeze the handle as firmly as possible for 3 s. Measurements were taken twice for each hand, with a minimum interval of 15 s between trials. The recorded value represents the average of the maximum grip strength from both hands. The thresholds for low grip strength established by AWGS are < 28 kg for men and < 18 kg for women [21]. Physical performance decline, as per AWGS criteria, is defined as 5 times sitting time > 12 s or 6-m walking speed < 1 m/s [22]. ASM measurements were derived using validated anthropometric equations specifically developed for the Chinese population [23, 24]. The study demonstrated strong concordance between the ASM equation and Dual-Energy X-ray Absorptiometry (DXA) [23, 24]. In our study cohort, the cutoff for low muscle mass was determined based on sex-specific criteria, equating to a minimum of 20% of height-adjusted muscle mass (ASM/Ht2) [23,24,25,26]. Height and weight were recorded in centimeters and kilograms, respectively. Regarding sex, a value of 1 represents male and a value of 2 represents female. Consequently, individuals with ASM/Ht2 < 5.69 kg/m2 for females and ASM/Ht2 < 6.88 kg/m2 for males were classified as having low muscle mass. The ASM equation utilized is:
Sarcopenia manifests through a blend of diminished muscle strength, impaired physical performance, or decreased appendicular skeletal muscle mass. Diagnosis typically hinges on identifying low muscle strength, either alone or accompanied by reduced appendicular skeletal muscle mass. Individuals displaying low muscle strength, compromised physical performance, and diminished appendicular skeletal muscle mass were classified as having severe sarcopenia. For the purposes of this study, participants were segregated into two main groups: those with sarcopenia and those without.
Assessment of depressive symptoms
Depressive symptoms were assessed with a 10-item stream using the Center for Epidemiologic Studies Depression Scale (CES-D) to assess depressive mood and behavior. CESD pay attention to the individual's situation in the past week and rate it as “Rarely or none of the time (< 1 day)”, “Some or a little of the time (1-2 days)”, “Occasionally or a moderate amount of the time (3-4 days)”, and “Most or all of the time (5-7 days)” according to the frequency of symptoms, and assign 0, 1, 2, and 3 points, respectively, with higher scores representing individuals with more severe depressive symptoms. In this study, according to the research results of ROBERTS and his colleagues [27], CESD ≥ 16 is considered to have depressive symptoms, and < 16 is considered to have no depressive symptoms.
Assessment of cognitive function
CHARLS measures cognitive function in three parts: Telephone Interview for Cognitive Status (TICS), Word Recall, and Picture Drawing. The higher the score, the better the cognitive function. The TICS requires the subject to correctly name the year, month, day, day of the week, and season, and each correct answer is worth 1 point; the subject is required to correctly calculate 100-7, and each correct answer is worth 1 point, and the scores of the two parts are added together, the total score is 0–10 points, which mainly evaluates the subject’s orientation, calculation ability and attention. Word recall: the researchers read 10 words and asked the subjects to recall the 10 words in a short time and after answering several other questions, each correct recall of a word was recorded as 1 point, and the average score of the two words recalled was taken. A total score of 0–10 points was used to assess episodic memory ability. Picture drawing: the researcher provides a picture of two overlapping five-pointed stars and asks the subjects to draw the figure on a white piece of paper. If they can draw a similar figure, they get 1 point, and if they cannot, they get 0 points. It is used to evaluate the subject's visuospatial ability.
Assessment of activities of daily living
Activities of daily living include physical self-maintenance scale (PSMS) and instrumental activities of daily living (IADL). PSMS evaluates essential tasks like dressing, bathing, eating, getting out of bed, going to the toilet, controlling bowel and urine. Meanwhile, IADL assesses more complex activities such as shopping, cooking, doing housework, taking medicine, managing money and making phone calls. According to the degree, it is divided into “No, I don’t have any difficulty”, “I have difficulty but can still do it”, “Yes, I have difficulty and need help” and “I cannot do it”. These options correspond to scores of 1, 2, 3, and 4, respectively, indicating higher scores reflect greater impairment in the skill.
Socio-demographic information
Socio-demographics include sex, age, marital status, education level, address and residence. Sex is defined as male and female. Education level was divided into no schooling, primary school, junior high school and above. Marital status was defined as married if the subject was currently married and living with a spouse; unmarried if the subject was currently separated, divorced, widowed, or never married. Address is divided into “Family house”, “Nursing home” and “Other”. Residence is divided into “The center of city/town”, “Combination zone between urban and rural areas”, “Village” and “Special area”.
Health-related information
Within the health-related data examined as potential risk factors, a broad spectrum of conditions and indicators were included. These encompassed physical disabilities, neurological impairments such as brain damage, sensory deficits like blindness, deafness and muteness, as well as prevalent medical conditions including hypertension, dyslipidemia, diabetes, cancer and various chronic diseases affecting organs such as the lungs, liver, heart and kidneys. Mental health aspects such as emotional disturbances, memory-related ailments, and joint diseases or rheumatism were also considered. Other factors such as asthma, pain (specifically chronic pain), history of surgeries like cataract or hip fracture, usage of assistive devices like hearing aids, dental health indicators like tooth loss and lifestyle habits like smoking status, alcohol consumption, and social activity levels were evaluated. Additionally, variables related to accidents, falls, vision and hearing impairments and subjective health assessments were included. Specifically, aspects like distant vision, near vision, hearing ability and self-assessment of health status were categorized as “good”, “fair” or “poor”, while the remaining variables were dichotomized as “yes” or “no”. These variables can be directly obtained from the CHARLS questionnaire.
Statistical methods
In this study, data from the CHARLS database in 2015 were selected for analysis. Continuous variables were expressed as medians and interquartile ranges, and rank sum tests were used to compare between groups; categorical variables were expressed as percentages, and χ2 tests or Fisher's exact tests were used to compare between groups. First, the data set is randomly divided into training set (n = 2417) and verification set (n = 1037) according to the ratio of 7:3. During this process, we set a random seed to ensure the randomization and repeatability of the sampling [28].
Utilizing a nomogram to depict the risk of sarcopenia among the older adults in China, we employed Least Absolute Selection and Shrinkage Operator (LASSO) regression analysis to construct and validate the model. We chose LASSO regression due to its capability to manage high-dimensional datasets with multicollinearity, effectively selecting variables and improving model interpretability. In contrast to Rigid and Elastic Net models, LASSO provides greater flexibility in variable selection and sparsity, making it the preferred choice for our specific research objectives and dataset characteristics. This choice ultimately leads to a more accurate and concise model. The primary R packages utilized in this study include: “mice”, “tableone”, “glmnet”, “rms”, “pROC” and “rmda”. First, LASSO regression analysis was performed on the training set data to select predictors of sarcopenia in Chinese older adults [29, 30]. Then, the tuning parameter (λ) suitable for LASSO regression analysis was determined by tenfold cross-validation, and the most significant features were screened using the LASSO algorithm. Finally, the selected predictors were included in the multivariate logistic regression analysis and the predictors with P-value < 0.05 were included in the nomogram model. The maximum missing value of all extracted variables does not exceed 20%, and multiple imputation is used to handle missing data [31].
In this study, the area under the receiver operating characteristic curve (AUROC) was used to determine the discriminative ability of the model. Calibration curves are used to determine the degree of agreement between predicted probabilities and observed results. Clinical validity was assessed by decision curve analysis (DCA). All data in this study were analyzed using R software (version 4.1.0). All tests were two-tailed and P < 0.05 was considered statistically significant.
Results
General information and clinical characteristics of the older adults
A total of 3454 older adult subjects (aged 60 years and older) were enrolled in this study, and the screening process for specific subjects is shown in Fig. 1. The general information and clinical characteristics of the subjects are listed in Table 1. There were 1708 men (49.4%) and 1746 women (50.6%). More detailed information is provided in a separate document (see supplement information).
Prevalence and associated variables of sarcopenia
The prevalence of sarcopenia was 28.8% (997/3454). There were significant differences in sex, BMI, and MDBP between the two groups of older adults (P < 0.05). According to clinical experience [32, 33], pain and MSBP were included in the model, and significant differences were found between the two groups of older adults. In the older adults, 2417 (70%) and 1037 (30%) were randomly assigned to the training and validation sets, respectively. The comparison of training and validation sets in the supplement information shows no significant difference between the two groups (P > 0.05).
LASSO logistic regression
In this investigation, non-zero coefficients were identified as potential predictors of frailty through the LASSO regression model (Fig. 2A and Fig. 2B). Subsequently, these underlying factors linked with sarcopenia were incorporated into multiple logistic regression models utilizing the ‘rms’ package within the ‘R’ software environment. Ultimately, it was found that sex (P < 0.001), BMI (P < 0.001), MSBP (P < 0.001), MDBP (P < 0.001) and pain (P = 0.015) were correlated with sarcopenia in the older adults (Table 2).

Demographic and clinical feature selection using the LASSO regression model. A According to the logarithmic (lambda) sequence, a coefficient profile was generated, and non-zero coefficients were produced by the optimal lambda. B The optimal parameter (lambda) in the LASSO model was selected via tenfold cross-validation using minimum criteria. The partial likelihood deviation (binomial deviation) curve relative to log (lambda) was plotted. A virtual vertical line at the optimal value was drawn using one SE of minimum criterion (the 1-SE criterion)
Developing predictive models
Based on tenfold cross-validation, LASSO regression analysis was used to screen the best predictors of the model. Multiple logistic regression was used to build the prediction model. The variance inflation factor (VIF) test was performed, and the VIF values of all variables were < 4. Without covariance, the model fits well. The predictive model consists of variables with a P-value of less than 0.05 in a multivariate logistic regression. These variables included sex, BMI, MSBP, MDBP, pain as predictors. The prediction model adopts nomogram, which can be used to quantitatively predict the risk of sarcopenia in the older adults (Fig. 3).
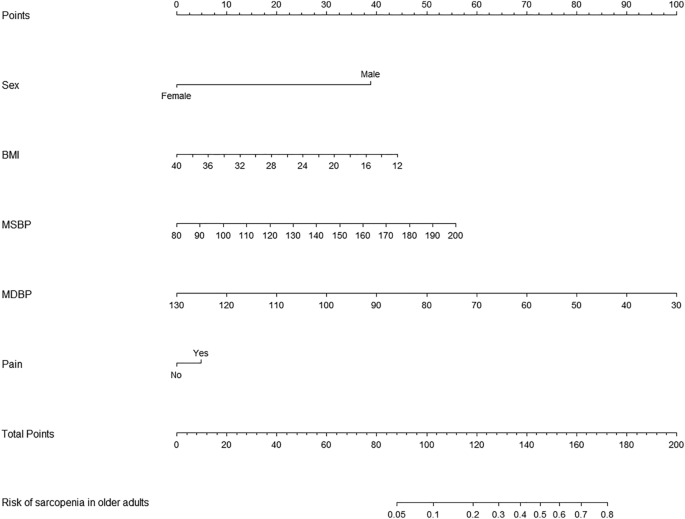
A nomogram for predicting sarcopenia in the older adults in China
Validating predictive models
AUC (area under curve) is a statistical metric that measures the performance of a classifier, specifically indicating the probability that a randomly chosen positive sample will rank higher than a randomly chosen negative sample. It is commonly utilized to assess the effectiveness of machine learning models. AUC values were computed to evaluate the discriminative power of the prediction model, by examining the incidence of sarcopenia among older adults in both the training and validation datasets. As shown in Fig. 4A, B, the AUC value of the predictive model in the training set was 0.77 (95% CI = 0.75–0.7901); the AUC value in the validation set was 0.76 (95% CI = 0.7287–0.7904). These data suggest that the nomogram has good discriminative power and predictive value, correctly identifying sarcopenic and non-sarcopenic patients.

A Nomogram ROC curves generated from the training dataset. B Nomogram ROC curves generated using the validation dataset
Correcting the predictive model
Calibration plots and the Hosmer–Lemeshow goodness-of-fit test were used to evaluate the model plots (P > 0.05 indicated that the model fit was very good). The test results show that the model fits both the training set (χ2 = 7.305, df = 8, p = 0.5041) and the validation set (χ2 = 9.9748, df = 8, p = 0.2668) well. The calibration plots of the training and validation sets based on the multivariate logistic regression model are shown in Fig. 5A, B. The calibration curves of the modality maps showed that the predicted probability of sarcopenia for the training set (Fig. 5A) and the validation set (Fig. 5B) were highly consistent with the actual probability of sarcopenia.

A Calibration plots for training dataset. B Calibration plots for validation dataset
Clinical validity assessment
The DCA method was used to evaluate the clinical validity of the model, and the results are shown in Figs. 6A, B. From the decision curve, the net benefit of the prediction model on the internal validation set is significantly higher than that of the two extreme cases, indicating that the nomogram model has better net benefit and prediction accuracy.

A DCA curves for training data set. B DCA curves for validation data set
Discussion
This study reveals that the prevalence of sarcopenia among the older adults in China stands at 28.8%, aligning with the findings reported by Cruz-Jentoft and his colleagues [34], which ranged from 1 to 29%. Sarcopenia can lead to reduced mobility, increased disability, falls, and risk of death [35, 36]. Therefore, identification of high-risk individuals is critical to preventing sarcopenia and its associated adverse outcomes.
This study shows that sex is a predictor of sarcopenia, and the results show that sarcopenia is related to sex, and the male population suffers from sarcopenia more often, which is consistent with previous research findings [37, 38]. The reason for the analysis may be that sarcopenia is caused by genetic inheritance or gene mutation. Since the disease-causing gene is located on the sex chromosome, and men have only one chromosome, one gene mutation is enough to cause the disease; women have two chromosomes, so two copies of muscular dystrophy can only be caused by a mutation in the gene. It is rare for a woman to inherit two disease-causing genes on her chromosomes, so men are more likely to have muscular dystrophy than women [39].Whether it is genetic or a mutation, there is currently no way to change the gene. The only way to control it is to delay development, improve symptoms, increase muscle strength, and prolong life through medication.
Our study revealed that BMI serves as a predictor of sarcopenia, with a lower BMI indicating a higher risk of sarcopenia, consistent with findings reported by Wu LC and colleagues [40]. This suggests a potential association between higher BMI and improved prognosis among older adults. However, it is important to note that while higher BMI may confer certain benefits, such as reduced risk of sarcopenia, it can also contribute to metabolic syndrome, posing physiological challenges for older individuals. Moreover, metabolic disorders associated with obesity may exacerbate malnutrition, perpetuating a detrimental cycle. A meta-analysis encompassing 26 studies [41] underscored the significant impact of different training modalities on muscle strength and physical performance in older adults with sarcopenia. Similarly, a systematic review [42] highlighted the positive effects of appropriate physical activity in enhancing muscle strength and flexibility, averting muscle atrophy and degeneration, and promoting blood circulation and metabolism, thereby fostering overall health in older adults aged 60 years and above [43]. Furthermore, the role of supplements in enhancing muscle mass and preventing metabolic syndrome onset is noteworthy. Selenium and magnesium, investigated in randomized controlled trials and dietary observational studies [44, 45], have shown potential associations with improved physical activity and muscle performance in older adults. Additionally, randomized controlled trials [46] have consistently demonstrated the efficacy of omega-3 fatty acids in preserving muscle mass and mitigating age-related muscle loss. In addressing the role of supplements, it is pertinent to mention Beta-hydroxy-beta-methylbutyrate (HMB), a metabolite of the essential amino acid leucine, which has garnered attention for its potential benefits in muscle health. Several studies have explored the effects of HMB supplementation on muscle mass preservation and physical function in older adults [47, 48]. These findings suggest that HMB may serve as a valuable adjunct to nutritional interventions and muscle training in mitigating the risk of sarcopenia among older adults. Therefore, early nutritional intervention and muscle training should be offered to older adults at risk for sarcopenia to reduce the risk of sarcopenia.
At the same time, this study also found that blood pressure is closely related to the occurrence of sarcopenia. High systolic blood pressure may reflect the stiffness of the blood vessels, which may reduce the ability of blood to flow to the muscles, resulting in an inadequate supply of nutrients to the muscles, thus increasing muscle loss. Low diastolic blood pressure may indicate that the heart is not pumping enough blood to the body during diastole, which may also affect the supply of nutrients to the muscles [49]. Both high systolic blood pressure and low diastolic blood pressure can be signs of physical decline in the older adults, and physical decline is closely related to sarcopenia. Therefore, in the future, in addition to paying attention to heart, brain and kidney complications, hypertensive patients should also pay attention to muscle loss.
In addition, this study shows that chronic pain, particularly chronic low back pain, is also associated with sarcopenia, which has a critical impact on spinal health because maintaining spinal function requires the involvement of strong lower back muscles. On the one hand, the decrease in muscle quantity and quality reduces muscle tolerance to exercise and makes muscles more susceptible to fatigue, which reduces their ability to maintain overall spinal stability. Spinal instability greatly increases the incidence of chronic low back pain. On the other hand, the decline in the function of the trunk muscles, especially the dorsi extensors, leads to a weakening of the muscles' suspension force on the spine, making it difficult for the body to maintain a normal upright posture, resulting in a severe forward tilt of the body. Leaning forward increases the work of the posterior muscles, fatigues the muscle tissue, and makes it impossible to keep the body upright, creating a vicious cycle that affects the patient's quality of life [50]. Therefore, the prevention and treatment of sarcopenia is a very important and urgent issue for spinal health in older adults.
The nomogram, constructed through multifactorial regression analysis, amalgamates various predictive indicators to represent the relationships between variables in the predictive model using scaled line segments on a common plane according to a predetermined ratio. It serves as a tool to forecast the probability of a clinical outcome event by summing the scores assigned to each predictor to derive a total score. Widely employed across diverse clinical domains, the nomogram stands as a common predictive model utilized in research endeavors. To further bolster the credibility of our findings, we recognize the importance of engaging with previous studies that have developed and validated nomograms, as this interaction could enhance the robustness of our research outcomes. In this study, we identified sex, BMI, MSBP, MDBP and pain as the main factors predicting sarcopenia in Chinese older adults. Our prediction model, constructed based on these five factors influencing sarcopenia development, exhibited good discrimination, calibration, and clinical validity. This suggests that the prediction model holds value for effectively identifying high-risk older adults with sarcopenia. The nomogram specifically quantifies the hazard ratio in terms of scores, allowing for the calculation of the probability of a certain outcome through simple calculations. It provides individualized risk assessment for each person, enhancing relevance and accuracy.
Therefore, the establishment of a prediction model for sarcopenia in older adults constitutes a novel achievement of this study. Nomograms, as efficient and accurate assessment tools, can assist clinical medical staff in objectively screening older adults at risk of sarcopenia, thereby providing a theoretical basis and starting point for formulating early prevention and intervention measures. Their clinical applicability is robust, aiding in the identification of patients at high risk for sarcopenia, enabling the implementation of early intervention plans, and facilitating individual health management in older adults.
This study has several limitations. Firstly, the absence of age-specific analysis based on different age groups is a notable gap. Sarcopenia, which involves a decrease in muscle mass due to age-related hormonal changes, would have benefited from a more granular examination across age brackets. Secondly, the CHARLS database lacked some potential predictors, such as dietary habits and nutritional status, limiting the scope of our analysis. Thirdly, the nomogram developed in this study is specific to data from China, and its generalizability to other regions and countries remains to be determined through external validation. Additionally, while pain was identified as an important factor in sarcopenia, the study did not delve into the specifics of pain, such as its location, intensity, and duration, which could have provided deeper insights. Furthermore, patients with impaired cognitive function were not excluded, and in some cases, family members assisted with self-reporting, potentially introducing biases into the results. Given these limitations, future research should aim to conduct prospective studies, incorporate more comprehensive predictor variables, and externally validate the model to enhance its generalizability and accuracy.
Conclusions
Our sarcopenia risk prediction model based on CHARLS data provides a reliable and accurate tool for Chinese older adults. This model can help clinicians to identify high-risk patients earlier and take timely preventive and interventional measures to improve the quality of life and health outcomes of the older adults.
Availability of data and materials
The datasets generated during and/or analyzed during the current study are available in the CHARLS repository, http://charls.pku.edu.cn.
References
Ren R, Qi J, Lin S, et al. The China alzheimer report 2022. General Psychiatry. 2022;35(1): e100751.
Liu YZZ, Rao K, Wang S. Blue book of elderly health: annual report on elderly health in China (2018). China: Social Science Academic Press; 2019.
Damluji AA, Alfaraidhy M, Alhajri N, et al. Sarcopenia and cardiovascular diseases. Circulation. 2023;147(20):1534–53.
Cruz-Jentoft AJ, Sayer AA. Sarcopenia. Lancet (London, England). 2019;393(10191):2636–46.
Bauer J, Morley JE, Schols A, et al. Sarcopenia: a time for action. An SCWD position paper. J Cachexia Sarcopenia Muscle. 2019;10(5):956–61.
Anker SD, Morley JE, von Haehling S. Welcome to the ICD-10 code for sarcopenia. J Cachexia Sarcopenia Muscle. 2016;7(5):512–4.
Chen LK, Woo J, Assantachai P, et al. Asian working group for sarcopenia: 2019 consensus update on sarcopenia diagnosis and treatment. J Am Med Directors Assoc. 2020;21(3):300-7.e2.
Xu W, Chen T, Cai Y, et al. Sarcopenia in community-dwelling oldest old is associated with disability and poor physical function. J Nutr Health Aging. 2020;24(23):339–45.
Petermann-Rocha F, Balntzi V, Gray SR, et al. Global prevalence of sarcopenia and severe sarcopenia: a systematic review and meta-analysis. J Cachexia Sarcopenia Muscle. 2022;13(1):86–99.
Cesari M, Kuchel GA. Role of sarcopenia definition and diagnosis in clinical care: moving from risk assessment to mechanism-guided interventions. J Am Geriatr Soc. 2020;68(7):1406–9.
Shimokata H, Ando F. Sarcopenia and its risk factors in epidemiological study. Nihon Ronen Igakkai zasshi Japanese journal of geriatrics. 2012;49(6):721–5.
Dodds RM, Granic A, Davies K, et al. Prevalence and incidence of sarcopenia in the very old: findings from the Newcastle 85+ Study. J Cachexia Sarcopenia Muscle. 2017;8(2):229–37.
Bone AE, Hepgul N, Kon S, et al. Sarcopenia and frailty in chronic respiratory disease. Chron Respir Dis. 2017;14(1):85–99.
Springer J, Springer JI, Anker SD. Muscle wasting and sarcopenia in heart failure and beyond: update 2017. ESC Heart Failure. 2017;4(4):492–8.
Bhanji RA, Narayanan P, Allen AM, et al. Sarcopenia in hiding: the risk and consequence of underestimating muscle dysfunction in nonalcoholic steatohepatitis. Hepatology (Baltimore, MD). 2017;66(6):2055–65.
Cruz-Jentoft AJ, Bahat G, Bauer J, et al. Sarcopenia: revised European consensus on definition and diagnosis. Age Ageing. 2019;48(1):16–31.
Gao K, Cao LF, Ma WZ, et al. Association between sarcopenia and cardiovascular disease among middle-aged and older adults: findings from the China health and retirement longitudinal study. EClinicalMedicine. 2022;44: 101264.
Cai G, Ying J, Pan M, et al. Development of a risk prediction nomogram for sarcopenia in hemodialysis patients. BMC Nephrol. 2022;23(1):319.
Yin G, Qin J, Wang Z, et al. A nomogram to predict the risk of sarcopenia in older people. Medicine. 2023;102(16): e33581.
Mo YH, Su YD, Dong X, et al. Development and validation of a nomogram for predicting sarcopenia in community-dwelling older adults. J Am Med Dir Assoc. 2022;23(5):715-21.e5.
Zhao Y, Hu Y, Smith JP, et al. Cohort profile: the China Health and Retirement Longitudinal Study (CHARLS). Int J Epidemiol. 2014;43(1):61–8.
Chen LK, Woo J, Assantachai P, et al. Asian working group for sarcopenia: 2019 consensus update on sarcopenia diagnosis and treatment. J Am Med Dir Assoc. 2020;21(3):300-7.e2.
Wen X, Wang M, Jiang CM, et al. Anthropometric equation for estimation of appendicular skeletal muscle mass in Chinese adults. Asia Pac J Clin Nutr. 2011;20(4):551–6.
Yang M, Hu X, Wang H, et al. Sarcopenia predicts readmission and mortality in elderly patients in acute care wards: a prospective study. J Cachexia Sarcopenia Muscle. 2017;8(2):251–8.
Alexandre Tda S, Duarte YA, Santos JL, et al. Sarcopenia according to the European Working Group on Sarcopenia in Older People (EWGSOP) versus dynapenia as a risk factor for mortality in the elderly. J Nutr Health Aging. 2014;18(8):751–6.
Wu X, Li X, Xu M, et al. Sarcopenia prevalence and associated factors among older Chinese population: Findings from the China Health and Retirement Longitudinal Study. PLoS ONE. 2021;16(3): e0247617.
Roberts RE, Rhoades HM, Vernon SW. Using the CES-D scale to screen for depression and anxiety: effects of language and ethnic status. Psychiatry Res. 1990;31(1):69–83.
Wu WT, Li YJ, Feng AZ, et al. Data mining in clinical big data: the frequently used databases, steps, and methodological models. Mil Med Res. 2021;8(1):44.
Lyu J, Li Z, Wei H, et al. A potent risk model for predicting new-onset acute coronary syndrome in patients with type 2 diabetes mellitus in Northwest China. Acta Diabetol. 2020;57(6):705–13.
Morris TP, White IR, Royston P. Tuning multiple imputation by predictive mean matching and local residual draws. BMC Med Res Methodol. 2014;14:75.
Xue QL. The frailty syndrome: definition and natural history. Clin Geriatr Med. 2011;27(1):1–15.
Chen J, Wang X, Xu Z. Sarcopenia and chronic pain in the elderly: a systematic review and meta-analysis. J Pain Res. 2023;16:3569–81.
Du Y, Oh C, No J. Associations between sarcopenia and metabolic risk factors: a systematic review and meta-analysis. J Obes Metab Syndr. 2018;27(3):175–85.
Cruz-Jentoft AJ, Landi F, Schneider SM, et al. Prevalence of and interventions for sarcopenia in ageing adults: a systematic review. Report of the International Sarcopenia Initiative (EWGSOP and IWGS). Age Ageing. 2014;43(6):748–59.
Papadopoulou SK. Sarcopenia: a contemporary health problem among older adult populations. Nutrients. 2020;12(5):1293.
Senior HE, Henwood TR, Beller EM, et al. Prevalence and risk factors of sarcopenia among adults living in nursing homes. Maturitas. 2015;82(4):418–23.
Gao Q, Hu K, Yan C, et al. Associated factors of sarcopenia in community-dwelling older adults: a systematic review and meta-analysis. Nutrients. 2021;13(12):4291.
Bouchard DR, Dionne IJ, Brochu M. Sarcopenic/obesity and physical capacity in older men and women: data from the Nutrition as a Determinant of Successful Aging (NuAge)-the Quebec longitudinal Study. Obesity (Silver Spring, Md). 2009;17(11):2082–8.
Laurent MR, Dedeyne L, Dupont J, et al. Age-related bone loss and sarcopenia in men. Maturitas. 2019;122:51–6.
Wu LC, Kao HH, Chen HJ, et al. Preliminary screening for sarcopenia and related risk factors among the elderly. Medicine. 2021;100(19): e25946.
Lu L, Mao L, Feng Y, et al. Effects of different exercise training modes on muscle strength and physical performance in older people with sarcopenia: a systematic review and meta-analysis. BMC Geriatr. 2021;21(1):708.
Montero-Fernández N, Serra-Rexach JA. Role of exercise on sarcopenia in the elderly. Eur J Phys Rehabil Med. 2013;49(1):131–43.
Beaudart C, Dawson A, Shaw SC, et al. Nutrition and physical activity in the prevention and treatment of sarcopenia: systematic review. Osteoporosis Int. 2017;28(6):1817–33.
Rederstorff M, Krol A, Lescure A. Understanding the importance of selenium and selenoproteins in muscle function. CMLS. 2006;63(1):52–9.
Brown MR, Cohen HJ, Lyons JM, et al. Proximal muscle weakness and selenium deficiency associated with long term parenteral nutrition. Am J Clin Nutr. 1986;43(4):549–54.
Lalia AZ, Dasari S, Robinson MM, et al. Influence of omega-3 fatty acids on skeletal muscle protein metabolism and mitochondrial bioenergetics in older adults. Aging. 2017;9(4):1096–129.
Yang C, Song Y, Li T, et al. Effects of beta-hydroxy-beta-methylbutyrate supplementation on older adults with sarcopenia: a randomized, double-blind, placebo-controlled study. J Nutr Health Aging. 2023;27(5):329–39.
Landi F, Calvani R, Picca A, et al. Beta-hydroxy-beta-methylbutyrate and sarcopenia: from biological plausibility to clinical evidence. Curr Opin Clin Nutr Metab Care. 2019;22(1):37–43.
Zhang XZ, Xie WQ, Chen L, et al. Blood flow restriction training for the intervention of sarcopenia: current stage and future perspective. Front Med. 2022;9: 894996.
Lin T, Dai M, Xu P, et al. Prevalence of sarcopenia in pain patients and correlation between the two conditions: a systematic review and meta-analysis. J Am Med Directors Assoc. 2022;23(5):902.e1-e20.
Acknowledgements
This research received no specific grant from any funding agency in the public, commercial, or not-for-profit sectors.
Funding
No funding.
Author information
Authors and Affiliations
Contributions
Qiugui Li, Hongtao Cheng: raise questions, screen variables, analyze data, write papers; Wenjiao Cen: screen variables; Tao Yang, Shengru Tao: Revise the thesis.
Corresponding author
Ethics declarations
Ethics approval and consent to participate
This is a retrospective study based on CHARLS database. The patient's information has been hidden before the study. The original CHARLS was approved by the Ethical Review Committee of Peking University (IRB00001052–11015), and all participants signed the informed consent at the time of participation. This research followed the guidance of the Declaration of Helsinki.
Consent for publication
Not applicable.
Competing interests
The authors declare that they have no known competing financial interests or personal relationships that could have appeared to influence the work reported in this paper.
Additional information
Publisher's Note
Springer Nature remains neutral with regard to jurisdictional claims in published maps and institutional affiliations.
Supplementary Information
Rights and permissions
Open Access This article is licensed under a Creative Commons Attribution 4.0 International License, which permits use, sharing, adaptation, distribution and reproduction in any medium or format, as long as you give appropriate credit to the original author(s) and the source, provide a link to the Creative Commons licence, and indicate if changes were made. The images or other third party material in this article are included in the article's Creative Commons licence, unless indicated otherwise in a credit line to the material. If material is not included in the article's Creative Commons licence and your intended use is not permitted by statutory regulation or exceeds the permitted use, you will need to obtain permission directly from the copyright holder. To view a copy of this licence, visit http://creativecommons.org/licenses/by/4.0/. The Creative Commons Public Domain Dedication waiver (http://creativecommons.org/publicdomain/zero/1.0/) applies to the data made available in this article, unless otherwise stated in a credit line to the data.
About this article

Cite this article
Li, Q., Cheng, H., Cen, W. et al. Development and validation of a predictive model for the risk of sarcopenia in the older adults in China. Eur J Med Res 29, 278 (2024). https://doi.org/10.1186/s40001-024-01873-w
Received:
Accepted:
Published:
DOI: https://doi.org/10.1186/s40001-024-01873-w