
Abstract
This paper proposes a novel approach for improving the speech of a single speaker in noisy reverberant environments. The proposed approach is based on using a beamformer with a large number of virtual microphones with the suggested arrangement on an open sphere. Our method takes into account virtual microphone signal synthesizing using the non-parametric sound field reproduction in the spherical harmonics domain and the popular weighted prediction error method. We obtain entirely accurate beam steering towards a known source location with more directivity. The suggested approach is proven to perform effectively not just in boosting the directivity factor but also in terms of improving speech quality as measured by subjective metrics like the PESQ. In comparison to current research in the area of speech enhancement by beamformer, our experiments reveal more noise and reverberation suppression as well as improved quality in the enhanced speech samples due to the usage of virtual beam rotation in the fixed beamformer. Text for this section.
1 Introduction
Distance speech signals recorded by a microphone inside a room contain reverberation caused by reflections from surfaces like walls, windows, floors, doors and ceilings. Similar to additive noise, echoes and interference, reverberation has a destructive effect on speech intelligibility [1]. Moreover, high reverberation leads to a dramatic decrease in the recorded speech quality, causing a severe degradation in audio applications such as automatic speech recognition and source localization [2]. As the reverberation time (RT60) increases, the detrimental effects on the speech signal magnify. In the literature, reverberation is divided into early reflections and late reverberation. The early reflections part increases the speech intelligibility, whereas the late reverberation part distorts the speech signal [3].
Beamforming is considered a rational approach to overcome noise and reverberation, which has attracted much attention due to its advantages in audio signal capturing in many applications such as sound reproduction and speech separation [1]. The beamformer performance depends on the number of microphones [1]. Although increasing the number of microphones increases the signal-to-noise ratio (SNR) in the output of the beamformer [4, 5], in terms of hardware and computational complexity, it is not feasible to increase the number of microphones by a significant amount. Therefore, a serious challenge is the limitation of the number of microphones in beamformers.
Although an adaptive beamformer can adapt the beam pattern toward the source, its performance in a high reverberation room is lower than a fixed beamformer. Therefore, fixed beamformers are preferable to adaptive beamformers in high reverberation conditions [6].
In this research, using virtual microphones (VMs) is considered an attractive approach to dominate these problems. VMs with proper techniques can synthesize sound signals at any spatial position, independent of the locations of the physical microphones. Virtual microphones (sensors) have been used in various applications, mainly in array processing [5]. For example, in [7] , the phase shift is estimated by using a VM in the microphone array; Also, a wideband beamformer is designed by deploying an optimized array consisting of virtual sensors [8].
Although there are several techniques to synthesize a VM signal, the procedure of virtual miking is still a significant challenge [5]. For instance, in [9], the image theory is applied to VM signal estimation, in [10], the interpolation of physical microphone signals generates a new VM signal, and in [11], geometrical information is used to produce the VM signal.
The sound field recording consists of reconstructing the sound signal in arbitrary places in the space [12], which can be employed for synthesizing the VM signal. This approach is generally classified into parametric [11,12,13,14,15] and non-parametric [16,17,18,19,20,21,22]. A general model characterizes the acquired sound field in parametric methods, whereas non-parametric methods decompose the recorded sound field into spatial basis functions. Since the recorded signal contains the direct sound and reverberation, the parametric method requires two distinct models to estimate the direct sound and reverberation [12]. In contrast, in the non-parametric approach, instead of model estimation in the parametric approach, a sound field can be represented by determining the coefficients of spherical harmonics. We have also presented a new technique to calculate the coefficients of spherical harmonics.
Due to reverberation being affected by the room impulse response (RIR) between the microphone and the sound source, getting an accurate model for reverberation is practically infeasible. Therefore, despite the analysis complexity, the non-parametric method along with a dereverberation approach is used in this research. It is worth noting that in the previous research, the signal in the spherical harmonics domain has not been employed as a virtual microphone signal, while in this research, we have reconstructed the signal of virtual microphones in a noisy reverberant room by using the recorded signals of real microphones.
The accuracy of the non-parametric method increases when the amount of reverberation decreases. The dereverberation removes the reverberant component in the recorded signal and improves the signal-to-reverberant ratio (SRR). The criterion for evaluating a dereverberation technique is the amount of late reverberation suppression [3, 23]. In dereverberation classes, the direct inverse filtering method has fewer performance limitations and less sensitivity to the RIR estimation than the spectral enhancement and channel equalization methods [23,24,25,26]. Therefore, the weighted prediction error (WPE) algorithm in this class of dereverberation is utilized in this research.
This paper proposes a solution for synthesizing VM signals and using them in a fixed beamformer. The proposed approach allows increasing the number of VMs in the beamformer without increasing the hardware. Figure 1 shows an overview of this research.
Our contributions are as follows:
-
(1)
We propose a new technique to synthesize the virtual microphone signal using spherical harmonics analysis.
-
(2)
We offer a new array geometry that utilizes a large number of VMs without increasing the computational complexity of the beamformer.
-
(3)
We propose a method to rotate the beam pattern of a fixed beamformer towards the known sound source location.
The paper is organized as follows. In Sect. 2, problem formulation of the sound field in spherical coordinates for virtual miking and sampling, beamforming and dereverberation is described. In Sect. 3, array geometry is considered, and at the beginning, the array performance evaluation is defined; next, the proposed uniform phase shift array geometry is detailed. In Sect. 4, experimental results, which include the implementation setup and simulation results, are presented.
2 Problem formulation
In this paper, as shown in Fig. 2, the position of a point in spherical coordinates is specified as \({\mathbf {r}}=(r, \theta , \phi )\), in which r is the radial distance from the origin (radius), \(\theta\) and \(\phi\) are the inclination (polar angle) and azimuth, respectively. Also, an acoustic source in \({\mathbf {r}}_s\) is considered in the far-field region. The room where the microphone array and sound source are located has a moderate diffuse noise and high reverberation.
\(S(t,\omega ,{\mathbf {r}})\) is the signal of a single speech source recorded by a physical microphone, which can be written as [12]
where t is time, \(\omega = 2 \pi f\) is radial frequency, \(f>0\) is temporal frequency, \(S_d(t,\omega ,{\mathbf {r}} )\) is the sum of direct-path speech and early reflections, \(S_r(t,\omega ,{\mathbf {r}})\) is the late reverberation signal that spatially has isotropic and homogeneous characteristics, and \(N(t,\omega ,{\mathbf {r}})\) is the noise. Suppose \(X(t,\omega ,{\mathbf {r}})\) is the virtual microphone signal, which is defined as
where \(X_d (t,\omega ,{\mathbf {r}})\) is the reconstructed direct sound, \(X_r (t,\omega ,{\mathbf {r}})\) is the reverberation sound field component, and \(X_n (t,\omega ,{\mathbf {r}})\) is the estimated noise.
2.1 Making the VM signal
This section explains the method of creating a virtual microphone signal in the spherical harmonics domain employing the spherical Fourier transform. By calculating the coefficients of spherical harmonics, the received speech signal at a specific point on the sphere surface can be estimated. \(Y_n ^m (\theta ,\phi )\) is the spherical harmonics of order n (\(n \in N\)) and degree m (\(m \in Z\) and \(-n \le m \le n\)) which is defined as [27]
where (.)! is the factorial function, and \(P_n ^ m(\cos {\theta })\) is the normalized associated Legendre polynomial.
While \(p(k,{\mathbf {r}})\) is a square-integrable function on the surface of an open sphere only for kr in a range smaller than N, it can be illustrated employing a weighted sum of the spherical harmonics as [27]
where N is the truncation order, \(p(k,{\mathbf {r}})\) is the time-dependence amplitude of the sound pressure in free three-dimensional space, \(p_{nm}(k,r)\) are the weights which are known as coefficients of the spherical Fourier transform, \(k=2\pi fc\) is the wave number, and c is the speed of sound wave in air. The coefficients of the spherical Fourier are defined as [27]
where \((.)^*\) denotes complex conjugation. It is worth noting that for satisfying the far-field condition, the distance between the sound source and the microphone array centre has to be more than \(8{r}^2 f/c\) [28].
Because of using uniform distribution of physical microphones on the spherical array, (e.g. positioning the microphones in the vertex of the Platonic solids), for \(n \le N\), \(p_{nm} (k,r )\) can be obtained as [27]
where \({\mathbf {r}}_q=(r,\theta _q,\phi _q)\) is the location of the qth physical microphone and Q is the number of physical microphones. To avoid spatial aliasing, Q is set to be greater than or equal to \((N+1)^2\) [27].
By combining (4) and (6) the amplitude of the sound pressure on the sphere surface in the direction of \((\theta ,\phi )\) is
A physical microphone located in the \({\mathbf {r}}_q\) converts \(p(k,{\mathbf {r}}_q)\) to \(S(t,\omega ,{\mathbf {r}}_q)\) and a virtual microphone positioned in the \({\mathbf {r}}\) converts \(p(k,{\mathbf {r}})\) to \(X(t,\omega ,{\mathbf {r}})\). Finally, based on (7), the VM signal can be synthesized as
The number of virtual microphones determines the number of times Equation 8 is calculated. So, with the increase in the number of virtual microphones, the computational complexity will also increase linearly.
2.2 Dereverberation
Based on [23], by filtering the multi-channel recorded signal, the estimated late reverberation signal in the qth physical microphone can be estimated as
where \(c_l^{(q,q')}(\omega )\) are coefficients of the linear prediction (dereverberation) filter, superscript \((.)^H\) is the Hermitian transpose, D is the time-delay that separates the early reflections from the late reverberation part, \(L_c\) is the dereverberation filter length.
Based on (1) and using (9), the direct sound signal in the qth physical microphone can be estimated as
In order to estimate the direct sound signal, the filter coefficients \(c_l^{(q,q')}(\omega )\) are predicted using the WPE method. The conventional WPE method assumes a circularly symmetric complex Gaussian distribution for the desired speech coefficients in the first physical microphone \(S_d (t,\omega ,{\mathbf {r}}_1)\), with zero-mean and unknown time-varying variance \(\sigma _d^2(t,\omega )=E \left[ |S_d (t,\omega ,{\mathbf {r}}_1)|^2\right]\) [23, 29].
Using a recursive algorithm as described in Algorithm (1), \(c_l^{(q,q')}(\omega )\) can be estimated [23] where J is the number of iterations, and \(\varepsilon\) is a small value.
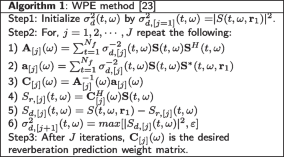
Once \({\mathbf {C}}_{[j]}(\omega )\) is specified, the coefficients of dereverberation filter \(c_l^{(q,q')}(\omega )\), can be defined as
By substituting the values of \({c}_{l}^{(q,q')}(\omega )\) in (10), the estimated direct sound signal \({\hat{S}}_d(t,\omega ,{\mathbf {r}}_q )\) for all physical microphones (\(q=1,2,\cdots ,Q\)) can be obtained. By replacing the estimated direct sound \({\hat{S}}_d(t,\omega ,{\mathbf {r}}_q)\) in (8), the estimated direct sound of the VM signal can be acquired as
2.3 Beamforming
As shown in Fig. (1), a beamformer with the input of synthesized VM signals is used. A complex-valued weight \(W_{v}(\omega )\) is applied to the vth VM signal, and then the weighted signals are added together. The beamformer output is obtained as [1]
where \({\hat{X}}_d(t,\omega ,{\mathbf {r}}_v)\) is an estimate of the direct sound of the vth virtual microphone in the \({\mathbf {r}}_v=(r,\theta _v,\phi _v)\), and V is the number of virtual microphones. By combining (12) and (13) the beamformer output is given as
It is assumed that all physical and virtual microphones are omnidirectional, and without losing the generality the source is located in the (\(\theta =90^{\circ },\phi =0^{\circ }\)) direction in the far-field. So, the phase vectors of the VMs are given as
where \(\tau _v\) and \(e^{-j\omega \tau _v}\) are the time delay of receiving the source signal and the phase shift of the the vth VM signal, respectively.
Assuming a spherically diffuse white noise with zero-mean value, the pseudo-coherence V \(\times\) V matrix, \(\mathbf {\Gamma }(\omega )\), can be specified. The \((v,v')\)th element of \(\mathbf {\Gamma }(\omega )\) is given as [1]
The weights of a reqularized superdirective beamformer are given as [1]
where \(\epsilon \ge 0\) is the regulirization parameter and \({\mathbf {I}}_V\) is the \(V \times V\) identity matrix.
3 Proposed array geometry
The geometry of the microphone array has an important effect on the sound capturing performance. Beam-pattern, directivity factor (DF), white noise gain (WNG), frequency range, robustness, and sidelobe suppression are major parameters related to geometry [30]. In this study, the two main employed evaluation parameters of spatial sound capturing are the DF and the WNG. Using (15), (16) and (17), the DF is expressed as [1]
and the WNG is given as [1]
Our proposed geometry is the combination of parallel rings at equal distances from each other (see Fig. 3). The ring plane has been considered perpendicular to the line between the sphere centre and the source location. As a result, the distance of the points on a ring from the source location will be equal. Therefore, the direct signals received at the points on a ring are in phase with each other, and as a result, they can be added together easily. So, the best WNG will be obtained in the proposed geometry.In order not to increase the computational load of the beamformer, the number of rings is set to be equal to the number of real microphones. The radius of the lth ring can be calculated as
where L is the number of rings and \(l=1,2,...,L\). It is assumed that on the lth ring \(Q_l\) virtual microphones are distributed uniformly. Based on [31], to avoid spatial aliasing, the ranges of \(Q_l\) and L are expressed as
where \(f_{max}\) is the maximum frequency of the speech and r is the radius of the circle (ring). Finally, we have L distinct rings in our proposed array geometry, leading to a total of \(V=\sum _{l=1}^{L}Q_l\) virtual microphones.
4 Implementation setup
This section describes the experimental setup of the proposed speech improvement system as detailed in previous sections. A general block diagram of the implementation system is shown in Fig. 4.
First, we choose the uniform spherical microphone array geometry to capture the 3-D audio. We employ \(Q=32\) physical microphones placed on the vertices of a truncated icosahedron (similar to the microphone arrangement of Eigenmike [32]) on the surface of an open sphere with radius \(r=10\) cm.
Due to simulating microphone signals, the clean speech is filtered through the RIR model of the desired room and then is recorded by 32 microphones. The RIR generator provided by Habets [33] is used to simulate the RIR of a room with \(6\times 5\times 4\) \({(\text {m}^3)}\) dimensions [22] with various SNR and RT60 values. The SNR is in the range of 0–30 dB, and the RT60 is in the range of 0.2–1 second.
In order to reduce audio reverberation, according to Sect. 2.2, the WPE dereverberation algorithm is employed. \(D=3\), \(L_c=15\), \(\varepsilon =10^{-3}\), and \(J=5\) are four optimum variables in Algorithm 1 [23]. So, the \({\hat{S}}_d (t,\omega ,{\mathbf {r}}_q )\) is obtained by using the WPE algorithm in the optimum performance.
In the next step, using (3) and \(N=4\), 25 spherical harmonics functions, \(Y_n^m(\theta ,\phi )\), are specified as \(Y_0^0(\theta ,\phi )\), \(Y_1^{-1}(\theta ,\phi )\), \(Y_1^0(\theta ,\phi )\), \(Y_1^1(\theta ,\phi )\), \(\cdots\), \(Y_4^4(\theta ,\phi )\). Then the complex value of each \(Y_n^m(\theta _q,\phi _q)\) for the qth microphone is specified. By employing (6) a set of \(p_{nm}(.)\) is calculated which is consist of 25 signals in the spherical harmonics domain.
Depending on the source direction and using the proposed array geometry as mentioned in Sect. 3, the location of the V virtual microphones on the surface of the open sphere, \((r,\theta _v,\phi _v)\), is determined. By selecting \(L=32\), the number of VMs is \(V=392\). So, \({\hat{X}}_d (t,\omega ,{\mathbf {r}}_v)\) is synthesized by using (12) and \((r,\theta _v,\phi _v)\) (for \(v= 1, 2, ..., V\)).
Finally, a beamformer with the proposed array geometry and the proposed regularized superdirective algorithm in (17) with \(\epsilon =0.1\) is applied to the VM signals.
The improved speech signal in the beamformer output is compared to the original clean speech to evaluate the results. In this research, four well-known metrics is employed: (1) the Perceptual evaluation of speech quality (PESQ) [34], (2) the Frequency-weighted segmental signal-to-noise ratio (FWSegSNR) [35], (3) the Cepstral distance (CD) [36], and 4) the Speech-to-reverberation modulation energy ratio (SRMR) [37]. It should be emphasized that at a smaller RT60, the SRMR metric becomes less precise [37].
5 Simulation results
In this section, the performance of the proposed system is evaluated. To this end, the system depicted in Fig. 4 and the setup setting as detailed in Sect. 4 are used. Twenty clean speech utterances from the TIMIT database [38] with different SNR equal to 5, 10, and 20 decibels and different RT60 in the range of 0.2–1 second are used (totally 540 utterances). Moreover, all sub-blocks are simulated in the MATLAB software package.
5.1 Array measurement
To evaluate the proposed geometry mentioned in Sect. 3, the proposed microphone array (PMA), the uniform circular microphone array (UCMA), and the uniform spherical microphone array (USMA) geometries under the same conditions and all with the same beamforming method in terms of the DF and the WNG are compared (see Fig. 5). The USMA consist of 32 microphones on the vertices of a truncated Icosahedron on the surface of a sphere with a radius of 10 cm. Also, the UCMA includes 32 microphones on a ring with the same radius as USMA. As detailed in Sect. 3, the PMA geometry consist of \(L=32\) rings and based on (21) there are \(V=392\) virtual microphones on these rings. In this comparison, the sound source is located on the UCMA plane in the far-field.
Figure 5a represents the DF values for UCMA, USMA, and PMA geometries. As depicted, the PMA geometry is superior at all frequency bands, especially at higher frequencies (e.g., more than 5 dB around 4 kHz). Figure 5b shows the WNG values for three mentioned geometries. As shown, the WNG of the PMA is more than the other two geometries, even at low frequencies. At frequencies below 700 Hz, the WNG of the PMA is, on average, 3 dB more than the UCMA and the USMA geometries. As a result, the performance of the PMA geometry is superior.
In order to evaluate the performance of the three geometries under study in relation to changes in the source location, the sound source is rotated 45 degrees. As shown in Fig. 6a, the DF curve of the PMA does not change as the source location changes. At the same condition, the DF of the UCMA decreases by an average of 3 dB. Also, the DF of the USMA does not change at frequencies less than 1.2 kHz but changes slightly at frequencies above 1.2 kHz. As depicted in Fig. 6b, by changing the source location, the WNG curve of the PMA is fixed and always is better than the other two geometries.
Next, we explore the performance of the PMA geometry in comparison to the USMA and the UCMA geometries for the other two setups, including \(Q=20\) and \(Q=12\) microphones when the sound source is located on the UCMA plane in the far-field. In this examination, for \(L=20\) rings, \(V=250\) virtual microphones and for \(L=12\) rings, \(V=152\) virtual microphones are used in the PMA geometry. As shown in Fig. 7a, by reducing the number of microphones, the DF of the PMA changes slightly, while below 2.5 kHz, the DF of the UCMA reduces slightly, and above 2.5 kHz reduces more in proportion to the increase the frequency. Also, the DF of the USMA reduces differently at different frequencies. Figure 7b shows that by reducing the number of rings from \(L=20\) to \(L=12\), the WNG of the PMA is reduced on average by 1 dB. The WNG of the UCMA reduces below 2.7 kHz, and the WNG of the USMA, except from 0.8 kHz to 1.4 kHz, reduces. As can be seen, the DF and the WNG of the PMA are superior.
5.2 Speech quality measurement
By considering Fig. 4 and explanations given in Sect. 4, the performance of the PMA is evaluated in the frequency range of 100–4000 Hz in terms of four metrics PESQ, CD, FWSegSNR, and SRMR. The USMA and the UCMA geometries with \(Q=32\) microphones are employed for physical microphones arrangement. Also, \(L=32\) rings are considered in the PMA geometry for \(V=392\) virtual microphones distribution on the surface of the sphere (see Sect. 3).
In addition, the performance of the PMA geometry in speech improvement is compared with the UCMA and the USMA geometries. We have compared the proposed system with the WPE dereverberation (WPE), the regularised superdirective beamformer (BF), and their combination (WPE+BF) along with the UCMA and the USMA geometries.
The level of diffuse noise and the reverberation time are controlled, confined to 5 –20 dB and 200–1000 ms, respectively. Our primary goal is audio capturing in the high reverberant environments, so in the test scenarios, we divide the diffuse noise levels into three parts: very high noise level (SNR=5 dB), high noise level (SNR=10 dB), and medium noise level (SNR=20 dB).
As depicted in Fig. 8, the PESQ metric versus RT60 is used to evaluate the proposed system compared to the other methods and geometries in three SNR levels. As shown, for the UCMA and the USMA geometries, the WPE method has little ability to PESQ improvement, whereas the effect of the beamformer is quite apparent. However, almost the combination of dereverberation and beamforming is better than each of them, and its results are close to the beamforming results.
As it turns out, the use of the USMA geometry further improves the speech quality compared to the UCMA geometry, but its effectiveness is limited. The fantastic performance of the proposed system is evident in all three amounts of noise in Fig. 8, due to the proposed array geometry and a large number of virtual microphones relative to the number of physical microphones.
In Table 1, the average of \(\Delta\)PESQ for RT60 between 200 and 1000 ms is calculated for each method. As can be seen, by increasing the diffuse noise power, the proposed system in speech improvement performs better than other methods, and this superiority in increasing the PESQ metric is quite evident.
Since the PESQ criterion somehow reflects the opinion of the human listener, in addition to this chart, by listening to the output of the proposed system, the speech improvement is quite hearable.
Figure 9 illustrates the cepstral distance (CD) metric of under assessment methods in RT60 values between 200 and 1000 ms. WPE performance depends on the reverberation time, and the best performance is around 600 ms in various noise levels. At the same time, the performance of the beamformer is almost the same at different amounts of noise.
Experiments revealed that the combination of dereverberation and beamforming with spherical geometry effectively reduced the cepstral distance. Nevertheless, in all situations, the proposed system performs more potent than the others to improve the CD metric. As shown in Figure 9 and Table 2, the proposed system, due to the use of multiple virtual microphones, suppresses the noise and reverberation included in the recorded speech more effectively than the other methods at all SNR and RT60 values.
Figure 10 indicates the comparison between the proposed system and the other methods in terms of the FWSegSNR metric. By carefully examining the performance of the WPE in the three charts of Fig. 10, it is clear that at different amounts of noise levels, the WPE performs almost independently of the SNR of the recorded signal. Also, the WPE improves the more FWSegSNR at a moderate reverberation level (RT60 about 500 ms).
As can be seen in Table 3, as the value of the SNR of the recorded speech signal decreases, the value of the \(\Delta\)FWSegSNR due to the beamformer performance increases. The proposed system improves the \(\Delta\)FWSegSNR at least one decibel more than other methods by utilizing 392 VMs.
Figure 11 contains three charts that show the SRMR changes versus various RT60 values from 200 to 1000 ms in three levels of SNR. By comparing different methods, it is observed that the WPE significantly improves the SRMR. In contrast, the beamformer slightly improves the SRMR in several SNR values.
The mean of \(\Delta\)SRMR in the RT60 range between 200 and 1000 ms in the three SNR levels are represented in Table 4. The WPE, in contrast to the beamformer, in all methods and SNR levels, performs more successfully in increasing the SRMR metric. The proposed system performs better than the other methods because of utilizing the WPE to synthesize VM signals and uses many VMs in the PMA geometry.
Finally, the destructive effects of the microphone placement error of the spherical microphone array and the use of random geometry instead of the proposed geometry, in terms of \(\Delta\)PESQ, are represented in Table 5. As can be seen, 5% of microphone placement error has less than 2% effect on the \(\Delta\)PESQ, while using random geometry reduces the \(\Delta\)PESQ by about 21% on average (for three SNRs).

The research block-diagram

Geometric model of a spherical array

Proposed microphone array geometry is the parallel rings with equal distances

Block diagram of the experimental setup

a The DF and b the WNG of the PMA, the USMA and the UCMA geometries with \(Q=L=32\)

a The DF and b the WNG of the PMA, USMA and UCMA geometries with \(Q=L=32\) for two sources located at X-axis and \(\theta _s=\phi _s=45^\circ\)

a The DF and b the WNG of the PMA, the USMA and the UCMA geometries with \(Q=L=20\) and \(Q=L=12\)

\(\Delta\)PESQ changes in proportion to RT60 for beamforming (BF), dereverberation (WPE) and their combination (WPE+BF) with the USMA and the UCMA geometries in comparison to the proposed approach in three noise levels

\(\Delta\)CD changes in proportion to RT60 for beamforming (BF), dereverberation (WPE) and their combination (WPE+BF) with the USMA and the UCMA geometries in comparison to the proposed approach in three noise levels

\(\Delta\) FWSegSNR changes in proportion to RT60 for beamforming (BF), dereverberation (WPE) and their combination (WPE+BF) with the USMA and the UCMA geometries in comparison to the proposed approach in three noise levels

\(\Delta\)SRMR changes in proportion to RT60 for beamforming (BF), dereverberation (WPE) and their combination (WPE+BF) with the USMA and the UCMA geometries in comparison to the proposed approach in three noise levels
6 Conclusion
A novel method to synthesize the virtual microphone signal in the SH domain has been presented. Also, a new microphone array geometry for arranging a large number of virtual microphones has been proposed. Because the location of virtual microphones depends on the source position; therefore, the proposed microphone array is always in a constant direction relative to the source location. As a result, with this technique, the direction of the array beam-pattern can be adjusted to the sound source without the need for adaptive beamformers. Test results on 540 corrupted utterances have shown that the suggested system significantly has improved the noisy reverberant speech because of its ability to increase the number of virtual microphones and use the proposed geometry.
Availability of data and materials
Raw data (clean speech) is selected from the TIMIT standard dataset. Noisy reverberated speech is generated by the RIR generator [33].
Abbreviations
- CD::
-
Cepstral distance
- DF::
-
Directivity factor
- FWSegSNR::
-
Frequency-weighted segmental signal-to-noise ratio
- PESQ::
-
Perceptual evaluation of speech quality
- PMA::
-
Proposed microphone array
- RIR::
-
Room impulse response
- RT60::
-
Reverberation time
- SHD::
-
Spherical harmonics domain
- SNR::
-
Signal-to-noise ratio
- SRMR::
-
Speech-to-reverberation modulation energy ratio
- SRR::
-
Signal-to-reverberant ratio
- UCMA::
-
Uniform circular microphone array
- USMA::
-
Uniform spherical microphone array
- VM::
-
Virtual microphone
- WNG::
-
White noise gain
- WPE::
-
Weighted prediction error
References
J. Benesty, I. Cohen, J. Chen, Fundamentals of Signal Enhancement and Array Signal Processing (John Wiley, New Jersey, 2017)
R. Haeb-Umbach, J. Heymann, L. Drude, S. Watanabe, M. Delcroix, T. Nakatani, Far-field automatic speech recognition. Proc. IEEE 109(2), 124–148 (2020)
M. Parchami, W.-P. Zhu, B. Champagne, Speech dereverberation using weighted prediction error with correlated inter-frame speech components. Speech Commun. 87(1), 49–57 (2017)
J. Benesty, J. Chen, Y. Huang, Microphone Array Signal Processing (Springer, New Jersy, 2008)
H. Katahira, N. Ono, S. Miyabe, T. Yamada, S. Makino, Nonlinear speech enhancement by virtual increase of channels and maximum SNR beamformer. EURASIP J. Adv. Signal Process. 2016(1), 1–8 (2016)
L. Wang, H. Ding, F. Yin, Combining superdirective beamforming and frequency-domain blind source separation for highly reverberant signals. EURASIP J. Audio Speech Music Process. 1, 1–13 (2010)
M. Arcienega, A. Drygajlo, J. Malsano, Robust phase shift estimation in noise for microphone arrays with virtual sensors. in 2000 10th European Signal Processing Conference, ed. by IEEE (2000), pp. 1–4
G. Doblinger, Optimized design of interpolated array and sparse array wideband beamformers. in 2008 16th European Signal Processing Conference, ed. by IEEE (2008), pp. 1–5
C.H.M. Olmedilla, D. Gomez, Image Theory Applied to Virtual Microphones (2008)
H. Katahira, N. Ono, S. Miyabe, T. Yamada, S. Makino, Virtually increasing microphone array elements by interpolation in complex-logarithmic domain. in 21st European Signal Processing Conference (EUSIPCO 2013), IEEE, 2013), pp. 1–5
G. Del Galdo, O. Thiergart, T. Weller, E.A. Habets, Generating virtual microphone signals using geometrical information gathered by distributed arrays. in 2011 Joint Workshop on Hands-free Speech Communication and Microphone Arrays, (IEEE, 2011), pp. 185–190
M. Pezzoli, F. Borra, F. Antonacci, S. Tubaro, A. Sarti, A parametric approach to virtual miking for sources of arbitrary directivity. IEEE/ACM Trans. Audio Speech Lang. Process. 28, 2333–2348 (2020)
R. Schultz-Amling, F. Kuech, O. Thiergart, M. Kallinger, Acoustical zooming based on a parametric sound field representation. in Audio Engineering Society Convention 128. (Audio Engineering Society, 2010)
O. Thiergart, G. Del Galdo, M. Taseska, E.A. Habets, Geometry-based spatial sound acquisition using distributed microphone arrays. IEEE Trans. Audio Speech Lang. Process. 21(12), 2583–2594 (2013)
K. Kowalczyk, O. Thiergart, M. Taseska, G. Del Galdo, V. Pulkki, E.A. Habets, Parametric spatial sound processing: a flexible and efficient solution to sound scene acquisition, modification, and reproduction. IEEE Signal Process. Mag. 32(2), 31–42 (2015)
P. Samarasinghe, T. Abhayapala, M. Poletti, Wavefield analysis over large areas using distributed higher order microphones. IEEE/ACM Trans. Audio Speech Lang. Process. 22(3), 647–658 (2014)
J.G. Tylka, E. Choueiri, Soundfield navigation using an array of higher-order ambisonics microphones. in Audio Engineering Society Conference: 2016 AES International Conference on Audio for Virtual and Augmented Reality. (Audio Engineering Society, 2016)
N. Ueno, S. Koyama, H. Saruwatari, Sound field recording using distributed microphones based on harmonic analysis of infinite order. IEEE Signal Process. Lett. 25(1), 135–139 (2017)
Y. Takida, S. Koyama, H. Saruwataril, Exterior and interior sound field separation using convex optimization: comparison of signal models. in 2018 26th European Signal Processing Conference (EUSIPCO). (IEEE, 2018), pp. 2549–2553
F. Borra, I.D. Gebru, D. Markovic, Soundfield reconstruction in reverberant environments using higher-order microphones and impulse response measurements. in ICASSP 2019-2019 IEEE International Conference on Acoustics, Speech and Signal Processing (ICASSP). (IEEE, 2019), pp. 281–285
F. Borra, S. Krenn, I.D. Gebru, D. Marković, 1st-order microphone array system for large area sound field recording and reconstruction: Discussion and preliminary results. In: 2019 IEEE Workshop on Applications of Signal Processing to Audio and Acoustics (WASPAA), pp. 378–382 (2019). IEEE
F. Zotter, M. Frank, Ambisonics: A Practical 3D Audio Theory for Recording, Studio Production, Sound Reinforcement, and Virtual Reality, vol. 19 (Springer, Berlin, 2019)
M. Parchami, H. Amindavar, W.-P. Zhu, Speech reverberation suppression for time-varying environments using weighted prediction error method with time-varying autoregressive model. Speech Commun. 109, 1–14 (2019)
K. Kinoshita, M. Delcroix, S. Gannot, E.A. Habets, R. Haeb-Umbach, W. Kellermann, V. Leutnant, R. Maas, T. Nakatani, B. Raj et al., A summary of the reverb challenge: state-of-the-art and remaining challenges in reverberant speech processing research. EURASIP J. Adv. Signal Process. 2016(1), 1–19 (2016)
I. Kodrasi, Dereverberation and Noise Reduction Techniques Based on Acoustic Multi-channel Equalization (Verlag Dr. Hut, Munich, 2016)
J. Wung, A. Jukić, S. Malik, M. Souden, R. Pichevar, J. Atkins, D. Naik, A. Acero, Robust multichannel linear prediction for online speech dereverberation using weighted householder least squares lattice adaptive filter. IEEE Trans. Signal Process. 68, 3559–3574 (2020)
B. Rafaely, Fundamentals of Spherical Array Processing, vol. 8 (Springer, Berlin, 2015)
J. Meyer, Beamforming for a circular microphone array mounted on spherically shaped objects. J. Acoust. Soc. Am. 109(1), 185–193 (2001)
T. Nakatani, T. Yoshioka, K. Kinoshita, M. Miyoshi, B.-H. Juang, Speech dereverberation based on variance-normalized delayed linear prediction. IEEE Trans. Audio Speech Lang. Process. 18(7), 1717–1731 (2010)
M. Blanco Galindo, P. Coleman, P.J. Jackson, Microphone array geometries for horizontal spatial audio object capture with beamforming. J. Audio Eng. Soc. 68(5), 324–337 (2020)
G. Huang, J. Benesty, J. Chen, On the design of frequency-invariant beampatterns with uniform circular microphone arrays. IEEE/ACM Trans. Audio Speech Lang. Process. 25(5), 1140–1153 (2017)
M. Acoustics, Em32 eigenmike microphone array release notes (v17. 0). 25 Summit Ave, Summit, NJ 07901, USA (2013)
E.A. Habets, Room impulse response generator. Technische Universiteit Eindhoven, Tech. Rep 2(2.4), 1 (2006)
R. Zhang, J. Liu, An improved multi-band spectral subtraction using DMel-scale. Proced. Comput. Sci. 131, 779–785 (2018)
Y. Hu, P.C. Loizou, Evaluation of objective quality measures for speech enhancement. IEEE Trans. Audio Speech Lang. Process. 16(1), 229–238 (2007)
C.G. Flores, G. Tryfou, M. Omologo, Cepstral distance based channel selection for distant speech recognition. Comput. Speech Lang. 47, 314–332 (2018)
J.F. Santos, T.H. Falk, Speech dereverberation with context-aware recurrent neural networks. IEEE/ACM Trans. Audio Speech Lang. Process. 26(7), 1236–1246 (2018)
V. Zue, S. Seneff, J. Glass, Speech database development at MIT: TIMIT and beyond. Speech Commun. 9(4), 351–356 (1990)
Acknowledgements
Not applicable.
Funding
Not applicable
Author information
Authors and Affiliations
Contributions
The authors’ contributions statement is attached. All authors read and approved the final manuscript.
Corresponding author
Ethics declarations
Ethics approval and consent to participate
Not applicable
Consent to participate
We, Mohammad Ebrahim Sadeghi and Hamid Sheikhzadeh and Mohammad Javad Emadi, give our consent for information about ourselves to be published in EURASIP Journal on Advances in Signal Processing. We understand that the information will be published without ours, but full anonymity cannot be guaranteed. We understand that the text and any pictures or videos published in the article will be freely available on the internet and may be seen by the general public. The pictures, videos and text may also appear on other websites or in print, may be translated into other languages or used for commercial purposes. We have been offered the opportunity to read the manuscript. Signing this consent form does not remove our rights to privacy.
Competing Interests
The authors declare that they have no competing interests.
Additional information
Publisher's Note
Springer Nature remains neutral with regard to jurisdictional claims in published maps and institutional affiliations.
Rights and permissions
Open Access This article is licensed under a Creative Commons Attribution 4.0 International License, which permits use, sharing, adaptation, distribution and reproduction in any medium or format, as long as you give appropriate credit to the original author(s) and the source, provide a link to the Creative Commons licence, and indicate if changes were made. The images or other third party material in this article are included in the article's Creative Commons licence, unless indicated otherwise in a credit line to the material. If material is not included in the article's Creative Commons licence and your intended use is not permitted by statutory regulation or exceeds the permitted use, you will need to obtain permission directly from the copyright holder. To view a copy of this licence, visit http://creativecommons.org/licenses/by/4.0/.
About this article

Cite this article
Sadeghi, M.E., Sheikhzadeh, H. & Emadi, M.J. Speech improvement in noisy reverberant environments using virtual microphones along with proposed array geometry. EURASIP J. Adv. Signal Process. 2022, 120 (2022). https://doi.org/10.1186/s13634-022-00951-7
Received:
Accepted:
Published:
DOI: https://doi.org/10.1186/s13634-022-00951-7