
Abstract
Background
Due to the absence of evidence in the literature on Paralympic Powerlifting the present study investigated various methods to assess bench press maximum repetition and the way each method influences the measurement of minimum velocity limit (MVT), load at zero velocity (LD0), and force–velocity (FV).
Objective
To evaluate the precision of the multi-point method using proximal loads (40, 50, 60, 70, 80, and 90% of one repetition maximum; 1RM) compared to the four-point method (50, 60, 70, and 80% of 1RM) and the two-point method using distant loads (40 and 80% and 50 and 80% of 1RM) in in the MVT, LD0, and FV, in bench press performed by Paralympic Powerlifters (PP).
Methods
To accomplish this, 15 male elite PP athletes participated in the study (age: 27.7 ± 5.7 years; BM: 74.0 ± 19.5 kg). All participants performed an adapted bench press test (free weight) with 6 loads (40, 50, 60, 70, 80, and 90% 1RM), 4 loads (50, 60, 70, and 80% 1RM), and 2 loads (40–80% and 50–80% 1RM). The 1RM predictions were made by MVT, LD0, and FV.
Results
The main results indicated that the multiple (4 and 6) pointsmethod provides good results in the MVT (R2 = 0.482), the LD0 (R2 = 0.614), and the FV (R2 = 0.508). The two-point method (50–80%) showed a higher mean in MVT [1268.2 ± 502.0 N; ICC95% 0.76 (0.31–0.92)], in LD0 [1504.1 ± 597.3 N; 0.63 (0.17–0.86)], and in FV [1479.2 ± 636.0 N; 0.60 (0.10–0.86)].
Conclusion
The multiple-point method (4 and 6 points) and the two-point method (40–80%) using the MVT, LD0, and FV all showed a good ability to predict bench press 1RM in PP.
Background
Much has been studied about the influence of physical activities on health and psychosocial aspects, mainly in people with some type of pathology or disability, or from special groups [1,2,3,4,5,6,7]. On the other hand, the practice of physical activities and sports are important for people with disabilities [8, 9]. Regarding Paralympic sports, Paralympic Powerlifting (PP), an adapted sport [10], has been gaining more supporters worldwide [11, 12] and presents various adaptations to training, especially concerning mechanical variables [13]. PP athletes tend to develop great strength, though with low training and competition velocities or in differentiated regimes [14,15,16]. Among the mechanical variables herein, the relation of force–velocity (F–V) tends to be very important and presents a linear relationship. It has been used to evaluate the capacities in the maximum production of force (F0), velocity (V0), and power (Pmax) in diverse activities and bench press [17, 18]. Thus, studies have revealed that the results of the F–V relationship (F0, V0, F–V slope, and Pmax) can be used to implement individualized programs [19,20,21]. However, a basic prerequisite for the adequacy of training programs based on the FV profile is that the main results must be highly reliable.
The test procedure in relation to FV during iso-inertial tasks, consists in the application of multiple (at least four) loads (Multiple-Point Method—MPM) [18, 22]. Studies carried out with the MPM showed a highly linear relationship to F–V, with high reliability and moderate to high validity [18, 23,24,25,26]. However, due to the high linearity of the relationship with FV, Jaric [27] proposed a test based on the application of only two loads (2PM). Studies have confirmed the similar reliability and high validity of the relation to F–V obtained from MPM and 2PM [17, 25,26,27,28,29,30,31]. However, it has been shown that the accuracy of the two-point method (2PM) depends on several factors such as the distance between the two experimental points, the proximity of the points to the F and V intercepts and the reliability of the individual points [18, 28, 32, 33]. Furthermore, it was found that the reliability and validity of the two-point method progressively decreased as the separation between the two experimental points was reduced [27, 28].
The relationship of F–V to MPM has been widely applied in the control of strength training loads, especially when related to load-velocity [33, 34]. However, regarding PP, studies have focused more on the health issues related to the etiology of injuries [8, 35]. In PP, the extended legs on the bench tend to reduce the transfer of force to lifting [36], in which affects the maintenance of force, power, velocity, and, and these are not well elucidated [16, 37, 38].
A practical question that remains open is whether there is accuracy of the F–V relation in disabled athletes performed on the adapted bench press [14, 16, 18, 39] and whether this affected by its different methods of evaluation. Another point that does not present consensus so far is which of the three evaluation methods would be most effective for calculating force and velocity indicators, namely the minimum velocity limit (MVT), zero velocity load (LD0), and force–velocity (FV) [40, 41]. Therefore, the aim of the present study was to evaluate the precision of the multi-point method using proximal loads (40, 50, 60, 70, 80, and 90% of one repetition maximum; 1RM) compared to the four-point method (50, 60, 70, and 80% of 1RM) and the two-point method using distant loads (40 and 80% and 50 and 80% of 1RM) in the MVT, LD0, and FV, in bench press performed by Paralympic Powerlifters (PP).Our hypothesis was that (i) the multiple (4 and 6) points method provides a good relationship with FV in the adapted bench press for disabled people and national-level Paralympic Powerlifting athletes; (ii) the MVT, LD0, and FV methods present reliable values at the evaluated points and; (iii) the two-point methods can be used with good reliability and (iv) the use of free weights presents good reliability in the adapted bench press for disabled people and PP national level athletes.
Method
Experimental approach to the problem
Subjects were laboratory tested nine times over 21 days (3 weeks) and each session was separated by at least 24 h. First week: The purpose of the first visit was to familiarize the subjects with the Adapted Bench Press test protocol and the desired technique for the tests, before determining the Adapted Bench Press 1RM and minimum velocity limit (i.e., 1RM velocity). On the second and third visits, participants completed a protocol where they progressively lifted heavier loads (40 to 90% 1RM), during which concentric velocity was monitored to establish individual velocity and load relationships. In these visits, the 1RM of the Adapted Bench Press and the minimum velocity limit (i.e., 1RM velocity) were determined. In weeks "2" and "3", the subjects were tested with loads of 40, 50, 60, 70, 80, and 90% of 1RM, performed in six sessions with loads defined randomly (by drawing lots) with a minimum rest interval of 24 h (resulting in three sessions per week). The 1RM predictions were made by linear regression with the use of the minimum velocity limit (MVT), the load at zero velocity (LD0) or the force–velocity (FV) as predictors [41], using the load-velocity relationships developed using six loads (40, 50, 60, 70, 80, and 90% 1RM), four loads (50, 60, 70, 80% 1RM) and two loads (40–80% and 50–80% 1RM). This experimental approach allowed the study of the influence of performing exercises using free weights (Adapted Bench Press) on the reliability and validity of using load-velocity relationships to predict 1RM. Each participant performed all sessions at the same time of the day and under similar environmental conditions (22–25 °C). Figure 1 shows the experimental design of the study.

Experimental approach. RM: Repetition Maximum
Participants
15 male elite PP athletes (age: 27.7 ± 5.7 years; experience: 2.1 ± 0.9 years; body mass: 74.0 ± 19.5 kg; 1RM: 113.0 ± 31.3 kg; 1RM/BM: 1.6 ± 0.3) were included, all participating in an training program at the university where the study was conducted. It was required that all participants were nationally classified competitors, eligible to compete in the adapted sport, had participated in at least one competition at the national level during the previous year, and had a nine-month minimum experience in the sport. Among the participants, six athletes presented spinal cord injury due to accidents with injuries below the eighth thoracic vertebra; four amputees, two with polio, one with Cerebral Palsy, and two with Arthrogryposis. The participants abstained from strenuous exercise for a minimum period of 48 h before each test session and were instructed not to consume alcohol and coffee during this period. All participants who started the study performed all tests and there were no exclusions.
The participants were evaluated during the competitive phase of the season and were familiar with the testing procedures due to constant training and testing routines. All participants signed a free and informed consent term. This study was conducted under the ethical principles set out in the Helsinki Declaration (2013). It was approved by the Research Ethics Committee of the Federal University of Sergipe, CAAE: 2.637.882 (date of approval: 7 May 2018).
Procedures
During the first visit, for familiarization purposes, body mass was measured while sitting on a Micheletti Electronic® Wheelchair Scale (Micheletti®, São Paulo, Brazil) with a maximum weight capacity of 300 kg (dimensions of 5.0 × 102 × 120 cm). Then, the 1RM load and the velocity limit for 1RM were assessed. In the following sessions, each participant completed a progressive load protocol to establish the specific load and velocity relationships. To perform the bench press, an official straight bench (Eleiko Sport AB®, Halmstad, Sweden) approved by the International Paralympic Committee was chosen, with a total length of 210 cm. The bar used was the 220 cm Eleiko brand (Eleiko Sport AB®, Halmstad, Sweden), weighing 20 kg.
Warm-up
Participants performed a pre-warm-up for the upper limbs that consisted of three exercises (shoulder abduction with dumbbells, development of the shoulders in the machine, rotation of the shoulders with dumbbells), with a series of 20 repetitions for approximately 10 min. Then, a specific warm-up was performed on the bench press using only the bar (20 kg) without extra weight, completing10 slow repetitions (3.0 × 1.0 s, eccentric × concentric) and 10 fast repetitions (1.0 × 1.0 s, eccentric × concentric). Then, the subjects performed five repetitions with 40% of 1RM, followed by three repetitions with 50% of 1RM, one repetition with 70, one with 80, and one with 90% of 1RM. Between sets, participants rested for at least three minutes [37, 38].
Load Determination
The participants started the tests with a self-selected load estimated to be the maximum load. Weight was then added until the maximum load was attained. If the participant overestimated the initial load, 2.5% of the load was subtracted before a new attempt [42]. A rest of 3.0 to 5.0 min was provided between trials, according to the participants' perception of recovery [42,43,44]. The coefficient of variation between the two measures was at least 94%.
To determine the test load, the 1RM load was assessed. Each participant started the attempts with a weight that could only be lifted once with maximum effort and selected the grip width that was most comfortable for each participant. The VMP in 1RM was 0.17 m/s, a value used as a reference value for the MVT method.
The determination of 1RM was performed in the first week [16, 41]. To determine the predicted values of 1RM performed in the second and third weeks, the velocity at each load was evaluated using 3 repetitions at 40% of the predicted 1RM (estimated by the subject), 3 repetitions at 50% 1RM, 3 repetitions at 60% 1RM, 3 repetitions at 70% 1RM, 1 rep at 80% 1RM, and 1 rep at 90% 1RM [45, 46], with 3 min of rest between the velocity tests. In the case of 70, 80, and 90%, three tests of one repetition were performed, so that the velocity of the three repetitions was obtained.
During all tests, participants were instructed to perform the adapted bench press exercise with the eccentric phase performed under control, while the concentric phase was completed as quickly as possible. With the bar (Eleiko Sport AB®, Halmstad, Sweden) supported with the elbows extended, the participant flexed the elbows until the bar touched the chest. The position close to the nipple lines was demarcated with a towel to keep the movement as linear as possible, signaling the most appropriate path of the bar, which was visually confirmed by the researchers positioned adjacent to the participant. Participants were also given verbal cues about when to stop the eccentric phase (approximated stop and 1.0 s) and start the concentric phase of the bench press, along with consistent verbal encouragement [41].
During each lift, the displacement of the bar and the time between data points were recorded using a linear position transducer sampling cable up to 50 Hz (Force Measurement System Speed4Lift SL®; Mostoles, Madrid, Spain) [47]. From these data, the concentric phase of each repetition was automatically identified by the linear position transducer and the average concentric velocity was calculated for that part of the lift. This linear position transducer was previously validated [41].
The retractable cord of this device was fixed inside the bar collar, with the unit mounted on the floor directly below the position of the bar during the bench press action. The use of the fastest repetition in each load ensured that the velocities used to develop the load-velocity relationship represented the individual's best performance. With lighter loads (< 80% 1RM), the fastest repetition tends to be the second or third, especially in warm-up sets. Subsequent analysis was performed to predict 1RM from these load velocity profiles using three different methods: (1) MVT; (2) LD0 and; (3) FV (Fig. 1).
Load velocity relations
The average concentric velocity and concentric force of each repetition were quantified using a previously validated linear position transducer (Force Measurement System Speed4Lift SL®; Mostoles, Madrid, Spain) [47]. Individual load-velocity relationships specific to each exercise were developed for each participant. These relationships only included the highest velocity repetition measured in the tests (40–90% 1RM).
Subsequent analyses were performed to predict 1RM from the load-velocity relationship using three different methods applied previously: (1) MVT; (2) LD0 and; (3) FV. The specific calculations used to determine the predicted 1RM for each of these methods were based on previous studies [41, 45]. These 1RM prediction calculations were performed using the full load-velocity relationships developed using 6 loads (40%, 50%, 60%, 70%, 80%, and 90% 1RM), with 4 loads (50%, 60%, 70%, and 80% of 1RM), and in two 2-load methods (40% and 80%; 50% and 80%) that tend to be more viable due to the exclusion of heavier loads [16].
The regression equation to estimate 1RM was done using three different predictors: MVT, LD0 and FV [41], and for each participant it was taken into account the load and velocity values at every relative load (40–90% 1RM). The MVT method was based on the assumption that in 1RM the failure will always occur at the same velocity (for the same participant and exercise) [41]; commonly referred to as the MVT. After identifying the MVT, the regression to the specific load-velocity ratio equation was determined for the MVT to predict 1RM (1RMMVT) [40], which is also suitable for the prediction of 1RM in the bench press with free weight. The LD0 method presents a load-velocity relationship and the regression would occur at a velocity of 0.0 m.s−1 [39], performed with free weight, and the mean estimates of 1RMLD0 of free weight did not differ from the measured 1RM [41]. The FV method relates the force with the velocity, and subsequently, the determination of the individual FV 1RM intercept and the load-velocity relationship, above the gravity acceleration (9.81 m.s−2) [22].
Statistical Analysis
Measures of mean central tendency ± Standard Deviation (X ± SD) were used. The test reliability of the predicted scores of 1RMMVT, 1RMLD0, and 1RMFV was determined by comparing the 1RM predictions between tests. The intraclass correlation coefficient (ICC: 3.1) and the coefficient of variation (CV) with 95% confidence intervals were calculated using a custom spreadsheet developed for this purpose [48]. These form values are used to calculate the ICC and CV values for individual points in the load-velocity relationship in the experiments to examine reliability. The ICCs were classified according to the following criteria: excellent (ICC = 0.91–1.00), good (ICC = 0.76–0.90), moderate (ICC = 0.51–0.75), and poor (ICC = 0.00–0.50). The magnitude of the CV was based on the following parameters: bad (> 0.10%), moderate (5–10%) and good (5%). Pearson's product-moment correlation coefficients were calculated to assess the relationships between measured and predicted 1RM scores. Bland–Altman plots were used to describe the level of agreement between measured and predicted 1RM values and identify significant trends in the Bland–Altman plots [49]. Pearson correlation analysis was used to examine the relationship between the variables "x" (mean score of 1RM) and "y" (difference between predicted and measured 1RM) of each graph to identify any trends in the data. The one-way ANOVA with repeated measures was performed to assess differences in measured versus predicted scores of 1RM during trials and Bonferroni Post Hoc. In cases where sphericity was violated, the Greenhouse–Geisser correction procedure was used. In circumstances where a significant main effect was observed, post hoc Fisher’s Least Significant Differences analyses were performed to determine where these differences occurred [50, 51]. These analyses assessed whether the 1RMMVT, 1RMLD0, and 1RMFV predictions were reliable and could be used to accurately determine 1RM. Significance was established with a type I error rate of α ≤ 0.05, and these analyses were performed using SPSS (v.25, IBM, New York, USA) and Prisma GraphPad version 8.1 (GraphPad Software, San Diego, California, USA) software.
Results
Figure 2 shows the relationships between the bar velocities and different percentages of 1 repetition maximum (1RM) in the Adapted Bench Press with free weight. For MVT, LD0, and FV, the highest coefficient observed was 2 points (40–80%).

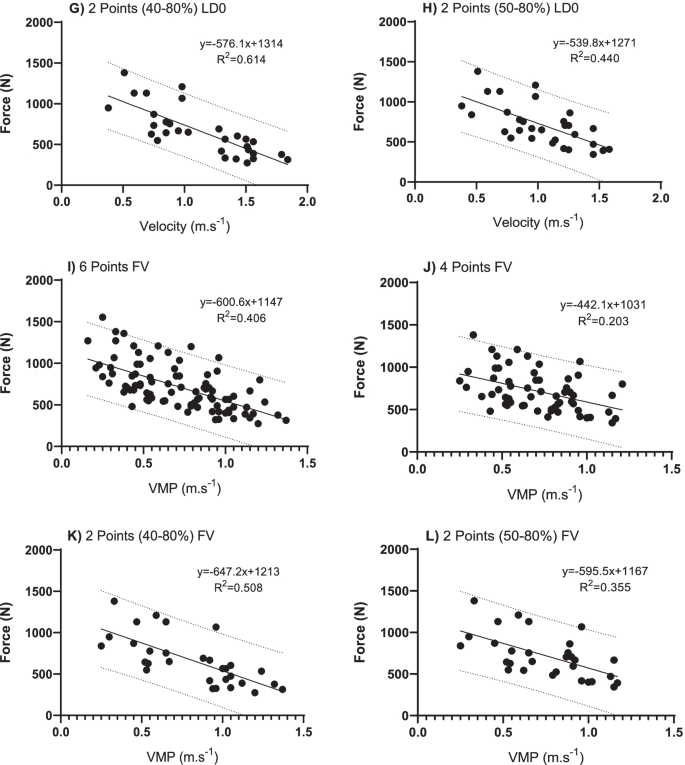
Linear Regression Model through the Force–Velocity relation between bar velocity and different percentages of 1 repetition maximum (1RM) in the Adapted Bench Press with free weight, in the minimum velocity limit (MVT), load at zero velocity (LD0) and velocity of force (FV). In each column are the linear regression line and the prediction equation based on 6 points (40, 50, 60, 70 80 and 90%), 4 points (50, 60, 70, 80%), 2 points (40–80%) and 2 points (50–80%)
Figure 3 shows the evaluations of predicted and measured results for 1RM (ANOVA) in 6, 4, 40–80% and 50%, in MVT, LD0, and FV. Regardless of the method, the highest load was observed between 50–80%, but without significant differences for the other loads.

Results of predicted values at 6, 4, 40–80% and 50% using the Minimum Velocity Limit (MVT), Load at Zero Velocity (LD0) and velocity of force (FV) methods in relation to the measured value of 1RM and confidence interval of the test. No significant differences were found in any of the methods in relation to the 1RM assessed (p < 0.05)
Table 1 shows the intra-class correlation coefficient and the variation coefficient for the bench press test, adapted with 1RM (N) free weight, as predicted from the load-velocity relationship.
In Fig. 4, the evaluations of the results predicted and measured for velocity (ANOVA) are found in 6, 4, 40–80%, and 50%, in the MVT, LD0, and FV methods. No significant differences were found in any of the methods in relation to the points used in the evaluation (p < 0.05).

Results for predicted velocity values (ms-1) at 6, 4, 40–80% and 50% using the Minimum Velocity Limit (MVT), Load at Zero Velocity (LD0) and velocity of force (FV) in relation to the predicted values and confidence interval of the test
Table 2 shows the intra-class correlation coefficient and the variation coefficient for the bench press test, adapted with the free weight of the estimated velocity (m.s−1), as predicted from the load-velocity relationship.
In Fig. 5, the Bland–Altman Charts for MVT, LD0, and FV for the 6-point and 4-point load methods, and the two points (40–80% and 50–80%) are shown.

Bland–Altman plots showing differences between the parameters obtained from the 6-point and 4-point load method, and two points (40–80% and 50–80%) in the minimum velocity Limit (MVT), Load at zero velocity (LD0) and velocity of force (FV). Each graph represents the mean difference and 95% limits of agreement (dashed lines), along with the regression line (solid line)
Discussion
The study aimed to verify the highest precision of the multi-point method using 6 points (loads 40, 50, 60, 70, 80, and 90% of 1RM), 4 points (50, 60, 70, and 80% of 1RM) and two 2 points (40–80% and 50–80% of 1RM), through the MVT, LD0, and FV methods in Paralympic Powerlifting using free weights. The current results showed that the multiple (4 and 6) points method provides a good results of the F–V relationship with a good precision, and that the MVT, LD0, and FV methods present reliable values in the bench press for disabled people and national-level Paralympic Powerlifting athletes. The Force–velocity relationship in the MVT method for 6 and 4 points was R2 = 0.327 and 0.126, respectively, in the LD0 for 6 and 4 points, R2 = 0.444 and 0.249, respectively, and in the FV methods for 6 and 4 points R2 = 0.406 and 0.203, respectively. If an acceptable R2 with 0.75 (substantial), 0.50 (moderate), and 0.25 (weak) was adopted, values lower than 0.25 would be considered weak. Therefore, the 6-point method presented an acceptable coefficient of determination whilst the 4-point method presented a weak coefficient of determination. If a qualitative interpretation of the r coefficients defined by Hopkins (23) was made, the cutoff points would be 0–0.09 = trivial; 0.1–0.29 = small; 0.3–0.49 = moderate; 0.5–0.69 = large; 0.7–0.89 = very large; 0.9–0.99 = almost perfect; and 1 = perfect. Significant correlations were found in all methods. Moreover, the results of the 6 and 4 points methods showed an almost perfect relationship. The magnitude of the CV was based on the following parameters: poor (> 0.10%), moderate (5–10%), and good (5%) (12). In the same way, each one attends where the MVT presented 0.6 and 1.4, LD0 3.3 and 3.9 and FV 1.2 and 1.5, for 6 and 4 points respectively. Thus, it seems that for 6 points referring to 1RM, the results tend to be better than those with 4 points, for all methods.
The current findings are in accordance with previous research that showed that the F–V relationship is shown to be highly reliable and at least moderately valid, especially when assessed with variables using standard tests [52]. Nevertheless, other studies have shown that the F–V relationship may be inconsistent, and the discrepancy in results has demonstrated concurrent validity of F0 from moderate to high [53], and others have shown low or even insignificant results when related to the force measured directly. Low reliability was demonstrated through the MVT method with exercises with free weight for well-trained individuals (CV = 22.5%) [40]. However, in line with the present study, when evaluating the 1RM predicted through the MVT, although strongly correlated with the measured 1RM, the predicted 1RM scores overestimated the measured 1RM, which also occurred in the results of the multiple-point methods with 6 and 4 points [40]. This was attributed to the low reliability of the MVT variable, suggesting that the 1RM predicted by the MVT does not tend to be accurate to predict 1RM, which in part differs from the results of the present study.
The same prediction using the LD0, instead of the MVT [41, 52], was greater than 1RM, as in the results of the current study. Additionally, using the LD0 tends to overestimate the predicted 1RM [39], as also demonstrated through our resultsIn addition, researchers have used the Smith machine to predict 1RM for free weight exercises, which tends to be more technically demanding than exercise with machines, and therefore could present kinematic differences [41] that can explain the possible differences between what is predicted and the true 1RM.
However, within the FV estimation method [22], this study was not valid for free-weight exercise, contrary to the results of this study. In the present study, all participants performed their training with free weights only, which may be a justification for these results [54]. This study was performed with free weights, so with a velocity of 90% of 1RM and using the 6-point methods, it tends to induce technical differences between repetitions due to the high load [41]. This has been reported where variations with loads greater than 80% of 1 RM have been used [41]. In addition to the above, in Paralympic Powerlifting, the legs must be extended over the bench and the transfer of strength tends to be reduced with the adapted bench press, which can bring difficulty in stabilization and impact the the movement [36].
In the current study we found that the two-point method can be used with accuracy, using the same criteria for the 40–80% and 50–80% methods. The results show that in the two-point method, the R2 was 0.482 and 0.293 in the MVT method, being 0.614 and 0.440 with the LD0 as predictor, and 0.508 and 0.355 with the FV as predictor, (40–80% and 50–80%, respectively). The ICC presented in MVT was 0.88 and 0.76, in LD0 0.77 and 0.63, and in FV it was 0.67 and 0.60. The CV in MVT was 6.1 and 12.5, the LD0 4.9 and 12.0, and the FV 13.7 and 15.3, for 40–80% and 50–80%, respectively. There was also an overestimation of the 1RM predicted in all methods. Our findings were supported by the assumptions that the F–V has an independent relationship at zero values and with a reliable and moderately valid linear relationship [18, 23]. The F–V relationship tends to individualize different levels of physical fitness [55] and different modalities [56]. In other words, the idea is to use two-point methods to explain differences between participants in ballistic deficits, providing an individualized intervention [57]. Thus, the strong and approximately linear relation to F–V has been used to predict % 1RM [33], emphasizing that the load-velocity relationship tends to be specific for each exercise [33]. The linearity of the force–velocity and load-velocity relationships tend to allow a viable prediction to be obtained through two loads [47, 52] using a linear regression modelling [17, 58].
It is likely that the two-point method is more time-efficient, as it can be performed in conjunction with the warm-up and is even suitable for assessing injuries, as differences were observed between injured and uninjured players [21]. Some limitations have been addressed [57], with an emphasis on the specificity of the tests [59]. This study focused on Paralympic Powerlifting athletes, aiming to provide more tools for this segment. The determination of the points does not usually occur randomly. In this study, the rules of the sport were taken into account, in which the bar weighs 20 kg and the competition rulebook requires the placement of fastening clips, amounting to a minimum weight of 25 kg on the bar. So, for an athlete who lifts 80 KG in 1 RM, 30% of 1RM would be 24 kg,; so the research started with 40% of 1RM. One study evaluated the effect of distance between experimental points on the reliability and validity of the method [47]. The individuals were evaluated in the bench press exercise with loads of 20–70% 1RM, 30–60% 1RM, and 40–50% 1RM. The authors concluded that there was a decrease in the reliability and validity of the F–V parameters with the proximity of the points 40–50% 1RM (coefficient of variation [CV] = 18.0%; r = 0.64), 30–60% 1RM (CV = 7.3%; r = 0.94), 20–70% of 1RM (CV = 5.5%; r = 0.98). In the evaluation, it was determined that there should be a point closer to the maximum velocity with zero load, and another one closer to the maximum force with zero velocity.
Theoretically, from a physiological point of view, the F–V relation would be almost linear in values greater than 40% [60], and best represented by a linear function at forces greater than 40% (R2 = 0,996) while following a curvilinear function below that level [61]. On the other hand, it has already been mentioned that in loads of 90 and 100%, technical differences tend to be induced between repetitions due to the high load, and this has been reported with loads greater than 80% of 1 RM [41]. Confirming this, it has already been reported that the loads tend to be linear close to 80% and, above these values, it is likely not to preserve linearity [62]. Hence, the more stable loads should be between 40 and 80% of 1RM [41, 58]. Other authors suggest a range of 30 to 80% of 1RM [39], considering the number of attempts to avoid muscle fatigue (18). Finally, the last load should be close to 80% of 1RM [39]. Thus, the results indicate that the two-point loads of 40 and 80% were the ones that seemed to have the greatest relationship in the force and velocity indicators, mainly when MVT and LD0 wwre used as predictors.
The use of free weights presented good reliability in the bench press adapted for disabled people and national-level Paralympic Powerlifting athletes. The Force–Velocity relationship in the Bench Press has been reported in previous studies using the Smith machine [14], and also in the free bench press [41]. The use of the free bench press tends to have a greater transfer than in the Smith machine [14]. These results are in agreement with some previous studies [13, 16, 39] that have already described the very close linear relationship that exists between force and velocity, where athletes' experience can interfere with strength and conditioning [13]. Regarding the validity of the 1RM predictions based on velocity, previous research has already shown that the MVT and LD0 measures showed very strong correlations with the 1RM measured in the bench press (r = 0.95–0.98 and r = 0.99, respectively) [13, 16, 39]. The results of this study agree with other studies [40, 41], as both MVT and LD0 had better 1 RM predictions for all points, while the same did not occur with the FV measure.
Regarding PP specifically, a study conducted by Loturco et al. [16] showed that the load-velocity relationship was strong and accurate for Paralympic powerlifters, especially at higher load intensities (≥ 70% 1RM). They also mentioned that the 1RM tests were performed at lower velocities than those previously reported in the literature. This study found no such results and the velocity of the Powerlifters was close to that of non-disabled people or even above (VMP = 0.17 ± 0.1 and VMax 0.32 ± 0.1 m.s–1). On the other hand [58], it was observed that posture and transfer of strength interfered with the performance in the bench press. Indeed, it was observed that in the study by Loturco et al. [16], the sample was small (eight men, five women, and four dwarfs), the calculation of the sample size was not provided, and the force of 1RM variation was large (standard deviation of up to 30% in the measured force and 41% in the predicted). Thus, there was a greater possibility of type II error in that study. A small number of participants can cause a violation of the assumption of the normality of the variables [63], where the p-value for small samples can be mistaken [48]. In addition, considering that in PP the legs must be extended on the bench, there is a tendency to reduce the transfer of strength in the bench press, where there would be difficulty in maintaining force and velocity [36].
The Bland–Altman analysis demonstrated great overestimations and underestimations for different participants. Despite significant statistical trends, it must be emphasized that very large samples are needed to provide conclusive information on trends through Bland–Altman analysis [49]. Thus, further studies are required, since estimates of 1RM based on load-velocity relationships may not be accurate enough to determine the true load. It seems that the multiple point methods (4 and 6 points) using the MVT, LD0, and FV as predictors, showed statistical relevance for the prediction of 1RM. The two-point method (40–80%), also showed statistical significance, while the same did not occur with higher loads in this same model (50–80%).
Practical applications
The methods herein proposed, mainly those with multiple points (4 and 6 points) and with two points (40–80%) are a possibility for monitoring the training load in PP, and these can be evaluated every day during warm-up. It is recommended that coaches use the best predictive methods of F–V as a control tool throughout the periodization to monitor athlete performance. The three methods, MVT, LD0, and FV, showed the same predictive power, so coaches should choose the one that athletes feel most comfortable with. Furthermore, the velocity measurement in the study was performed using a linear encoder, which has affordable prices and can even be performed with validated statistical programs.
Availability of data and materials
The data presented in this study are available on request from the corresponding author.
Abbreviations
- MVT:
-
Minimum velocity limit
- LD0:
-
Load at zero velocity
- FV:
-
Velocity of force
- PP:
-
Paralympic powerlifting
- 1RM:
-
One repetition maximum
- F–V:
-
Relation to force–velocity
- F0:
-
Maximum production of force
- V0:
-
The maximum velocity
- Pmax:
-
Power
- N:
-
Newtons
References
Aidar FJ, Carneiro AL, Moreira OC, Cláudia E, de Oliveira P, Garrido ND, Reis VM, Raineh I, Vilaça JM, de Gama DM. Effects of resistance training on the physical condition of people with multiple sclerosis. J Sports Med Phys Fitness. 2018. https://doi.org/10.23736/S0022-4707.17.07621-6.
Aidar FJ, de Oliveira RJ, de Matos DG, Mazini Filho ML, Moreira OC, de Oliveira CE, Hickner RC, Reis VM. A Randomized trial investigating the influence of strength training on quality of life in ischemic stroke. Top Stroke Rehabil. 2016;23(2):84–9.
Aidar FJ, Gama D, de Matos RF, de Souza AB, Gomes FS, Garrido N, Carneiro AL, Reis V. Influence of aquatic exercises in physical condition in patients with multiple sclerosis. J Sports Med Phys Fitness. 2018. https://doi.org/10.23736/S0022-4707.17.07151-1.
Mazini Filho ML, Aidar FJ, Gama de Matos D, Costa Moreira O, de Oliveira CEP, de Oliveira R, Venturini G, Magalhães Curty V, Menezes Touguinha H, Caputo Ferreira ME. Circuit strength training improves muscle strength, functional performance and anthropometric indicators in sedentary elderly women. J Sports Med Phys Fitness. 2018;58(7–8):1029–36.
Mazini Filho ML, Aidar FJ, Moreira OC, Matos DG, Oliveira CEP, Venturini GRO, Costa SP, Curty VM, Ferreira MEC. Comparison of the effect of two physical exercise programs on the functional autonomy, balance and flexibility of elderly women. Med Sport. 2017;70:288–98.
Moreira OC, Lopes GS, de Matos DG, Mazini-Filho ML, Aidar FJ, Silva SF, de Oliveira CE. Impact of two hydrogymnastics class methodologies on the functional capacity and flexibility of elderly women. J Sports Med Phys Fitness. 2019;59(1):126–31.
Nobari H, Ahmadi M, Sá M, Pérez-Gómez J, Clemente FM, Adsuar JC, Minasian V, Afonso J. The effect of two types of combined training on bio-motor ability adaptations in sedentary females. J Sports Med Phys Fitness. 2021;61(10):1317–25. https://doi.org/10.23736/S0022-4707.20.11736-5.
Paz ÂA, Aidar FJ, de Matos DG, de Souza RF, da Silva-Grigoletto ME, van den Tillaar R, Ramirez-Campillo R, Nakamura FY, Costa MDC, Nunes-Silva A, Costa E, Silva AA, Marçal AC, Reis VM. Comparison of post-exercise hypotension responses in paralympic powerlifting athletes after completing two bench press training intensities. Medicina. 2020;56(4):156.
Aidar FJ, Dantas EF, Almeida-Neto PF, Neto FR, Garrido ND, Cabral BG, Figueiredo T, Reis VM. Can post-exercise hemodynamic response be influenced by different recovery methods in paraplegic sportsmen? Int J Environ Res Public Health. 2022;19(3):1772. https://doi.org/10.3390/ijerph19031772.
International Paralympic Comitê (IPC). Sports. Available https://www.paralympic.org/powerlifting. Accessed 12 May 2021.
Wilson D, Ramchandani G. An investigation of home advantage in the summer paralympic games. Sport Sci Health. 2017;13(3):625–33.
Blauwet C, Lexell J, Derman W, Idrisova G, Kissick J, Stomphorst J, Wosornu YT, Van de Vliet P, Webborn N. The road to rio: medical and scientific perspectives on the 2016 paralympic games. PM R. 2016;8(8):798–801.
Loturco I, Pereira LA, Kobal R, McGuigan MR. Power output in traditional and ballistic bench press in elite athletes: influence of training background. J Sports Sci. 2019;37(3):277–84.
Gonzalez-Badillo JJ, Sanchez-Medina L. Movement velocity as a measure of loading intensity in resistance training. Int J Sports Med. 2010;31:347–52.
Bartolomei S, Totti V, Nigro F, Ciacci S, Semprini G, Di Michele R, Cortesi M, Hoffman JR. A comparison between the recovery responses following an eccentrically loaded bench press protocol vs. regular loading in highly trained men. J Hum Kinet. 2019;68(1):59–67. https://doi.org/10.2478/hukin-2019-0056.
Loturco I, Pereira LA, Winckler C, Santos WL, Kobal R, McGuigan M. Load-velocity relationship in national paralympic powerlifters: a case study. Int J Sports Physiol Perform. 2019;14(4):531–5.
Grbic V, Djuric S, Knezevic O, Mirkov D, Nedeljkovic A, Jaric S. A novel two-velocity method for elaborate isokinetic testing of knee extensors. Int J Sports Med. 2017;38(10):741–6.
García-Ramos A, Jaric S, Padial P, Feriche B. Force-velocity relationship of upper body muscles: traditional versus ballistic bench press. J Appl Biomech. 2016;32(2):178–85.
Samozino P, Edouard P, Sangnier S, Brughelli M, Gimenez P, Morin J. Force-velocity profile: imbalance determination and effect on lower limb ballistic performance. Int J Sports Med. 2014;35(6):505–10.
Jiménez-Reyes P, Samozino P, Brughelli M, Morin JB. Effectiveness of an individualized training based on force-velocity profiling during jumping. Front Physiol. 2017;7:677.
Mendiguchia J, Edouard P, Samozino P, et al. Field monitoring of sprinting power-force-velocity profile before, during and after hamstring injury: two case reports. J Sports Sci. 2016;34(6):535–41.
Picerno P, Iannetta D, Comotto S, Donati M, Pecoraro F, Zok M, Tollis G, Figura M, Varalda C, Di Muzio D. 1RM prediction: a novel methodology based on the force–velocity and load–velocity relationships. Eur J Appl Physiol. 2016;116:2035–43.
García-Ramos A, Feriche B, Pérez-Castilla A, Padial P, Jaric S. Assessment of leg muscles mechanical capacities: Which jump, loading, and variable type provide the most reliable outcomes? Eur J Sport Sci. 2017;17(6):690–8.
Sreckovic S, Cuk I, Djuric S, Nedeljkovic A, Mirkov D, Jaric S. Evaluation of force-velocity and power-velocity relationship of arm muscles. Eur J Appl Physiol. 2015;115(8):1779–87.
Zivkovic MZ, Djuric S, Cuk I, Suzovic D, Jaric S. A simple method for assessment of muscle force, velocity, and power producing capacities from functional movement tasks. J Sports Sci. 2017;35(13):1287–93.
Zivkovic MZ, Djuric S, Cuk I, Suzovic D, Jaric S. Muscle force-velocity relationships observed in four different functional tests. J Hum Kinet. 2017;56:39–49.
Jaric S. Two-load method for distinguishing between muscle force, velocity, and power-producing capacities. Sports Med. 2016;46(11):1585–9.
Pérez-Castilla A, Jaric S, Feriche B, Padial P, García-Ramos A. Evaluation of muscle mechanical capacities through the two-load method: optimization of the load selection. J Strength Cond Res. 2018;32(5):1245–53.
Picerno P. Good practice rules for the assessment of the force-velocity relationship in isoinertial resistance exercises. Asian J Sports Med. 2017;8(3):e15590.
Dobrijevic S, Ilic V, Djuric S, Jaric S. Force-velocity relationship of leg muscles assessed with motorized treadmill tests: two-velocity method. Gait Posture. 2017;56:60–4.
Jaric S. Force-velocity relationship of muscles performing multi-joint maximum performance tasks. Int J Sports Med. 2015;36:699–704.
García-Ramos A, Torrejón A, Morales-Artacho A, Pérez-Castilla A, Jaric S. Optimal resistive forces for maximizing the reliability of leg muscles capacities tested on a cycle ergometer. J Appl Biomech. 2018;34(1):47–52.
Conceição F, Fernandes J, Lewis M, Gonzaléz-Badillo JJ, Jimenéz-Reyes P. Movement velocity as a measure of exercise intensity in three lower limb exercises. J Sports Sci. 2016;34:1099–106.
Loturco I, Kobal R, Moraes JE, Kitamura K, Abad CCC, Pereira LA, Nakamura FY. Predicting the maximum dynamic strength in bench press: the high precision of the bar velocity approach. J Strength Cond Res. 2017;31(4):1127–31.
Willick SE, Cushman DM, Blauwet CA, Emery C, Webborn N, Derman W, Schwellnus M, Stomphorst J, Van de Vliet P. The epidemiology of injuries in powerlifting at the London 2012 Paralympic Games: an analysis of 1411 athlete-days. Scand J Med Sci Sports. 2016;26:1233–8.
Ribeiro Neto F, Dorneles JR, Costa RRG. Are the flat and arched bench press really similar? Sports Biomech. 2020;22:1–2.
Mendonça TP, Aidar FJ, Matos DG, Souza RF, Marçal AC, Almeida-Neto PF, Cabral BG, Garrido ND, Neiva HP, Marinho DA, Marques MC, Reis VM. Force production and muscle activation during partial vs. full range of motion in paralympic powerlifting. PLoS ONE. 2021;16(10):e0257810. https://doi.org/10.1371/journal.pone.0257810.
Matos MD, dos Santos FJ, Aidar RF, de Souza J, dos Santos L, da Silva A, de Mello HP, Neiva DA, MarinhoMarques, MC. Does the Grip width affect the bench press performance of paralympic powerlifters? Int J Sports Physiol Perform. 2020;15(9):1252–9. https://doi.org/10.1123/ijspp.2019-0784.
Jidovtseff B, Harris NK, Crielaard JM, Cronin JB. Using the load velocity relationship for 1RM prediction. J Strength Cond Res. 2011;25(1):267–70.
Banyard BG, Nosaka K, Haff GG. Reliability and validity of the load-velocity relationship to predict the 1RM back squat. J Strength Cond Res. 2017;31(7):1897–904.
Hughes LJ, Banyard HG, Dempsey AR, Scott BR. Using a load-velocity relationship to predict one repetition maximum in free-weight exercise: a comparison of the different methods. J Strength Cond Res. 2019;33(9):2409–19.
Aidar FJ, Fraga GS, Getirana-Mota M, Marçal AC, Santos JL, de Souza RF, Ferreira ARP, Neves EB, Zanona AF, Bulhões-Correia A, de Almeida-Neto PF, Fernandes TLB, Garrido ND, Cirilo-Sousa MDS, Merino-Fernández M, Díaz-de-Durana AL, Murawska-Ciałowicz E, Cabral BGAT, Clemente FM. Effects of ibuprofen use on lymphocyte count and oxidative stress in elite paralympic powerlifting. Biology (Basel). 2021;10(10):986. https://doi.org/10.3390/biology10100986.
de Aquino RM, Aidar FJ, Vasconcelos Resende RB, Reis GC, de Oliveira BL, de Matos DG, Marçal AC, de Almeida-Neto PF, Díaz-deDurana AL, Merino-Fernández M, Vilaça-Alves J, de Araújo Tinoco BG, Cabral NEB, Reis VM, Clemente FM, Garrido ND. Are strength indicators and skin temperature affected by the type of warm-up in paralympic powerlifting athletes? Healthcare. 2021;9(8):923. https://doi.org/10.3390/healthcare9080923.
Teles LJL, Aidar FJ, Matos DG, Marçal AC, Almeida-Neto PF, Neves EB, Moreira OC, Ribeiro Neto F, Garrido ND, Vilaça-Alves J, Díaz-de-Durana AL, Clemente FM, Jeffreys I, Cabral BGAT, Reis VM. Static and dynamic strength indicators in paralympic power-lifters with and without spinal cord injury. Int J Environ Res Public Health. 2021;18(11):5907. https://doi.org/10.3390/ijerph18115907.
Jiménez-Alonso A, García-Ramos A, Cepero M, Miras-Moreno S, Rojas FJ, Pérez-Castilla A. Velocity performance feedback during the free-weight bench press testing procedure: an effective strategy to increase the reliability and one repetition maximum accuracy prediction. J Strength Cond Res. 2022;36(4):1077–83. https://doi.org/10.1519/JSC.0000000000003609.
García-Ramos A, Barboza-González P, Ulloa-Díaz D, Rodriguez-Perea A, Martinez-Garcia D, Guede-Rojas F, Hinojosa-Riveros H, Chirosa-Ríos LJ, Cuevas-Aburto J, Janicijevic D, Weakley J. Reliability and validity of different methods of estimating the one-repetition maximum during the free-weight prone bench pull exercise. J Sports Sci. 2019;37(19):2205–12. https://doi.org/10.1080/02640414.2019.1626071.
Pérez-Castilla A, Piepoli A, Delgado-García G, Garrido-Blanca G, García-Ramos A. Reliability and concurrent validity of seven commercially available devices for the assessment of movement velocity at different intensities during the bench press. J Strength Cond Res. 2019;33:1258–65.
Batterham AM, Hopkins WG. Linear models and effect magnitudes for research, clinical and practical implications. Int J Sports Physiol Perform. 2010;1:49–57.
Bland JM, Altman DG. Measuring agreement in method comparison studies. Stat Methods Med Res. 1999;8:135–60.
Cohen J. Statistics a power primer. Psychol Bull. 1992;112:155–9.
Cohen J. Statistical power analysis for the behavioural sciences. 2nd ed. Hillsdale, NJ: Lawrence Erlbaum; 1988.
Jaric S. Two-load method for distinguishing between muscle force, velocity, and power-producing capacities. Sport Med. 2016;46:1585–9.
Cosic M, Djuric S, Zivkovic MZ, Nedeljkovic A, Leontijevic B, Jaric S. Is test standardization important when arm and leg muscle mechanical properties are assessed through the force-velocity relationship? J Hum Kinet. 2019;69:47–58.
Otterman MILC, Arby LYNNAD, Kelly WIAS. The S Mith M Achine and F Ree W Eights for B Ench P Ress and S Quat E Xercises. Strength Cond. 2005;19:169–76.
Cuk I, Mirkov D, Nedeljkovic A, Kukolj M, Ugarkovic D, Jaric S. Force–velocity property of leg muscles in individuals of different level of physical fitness. Sport Biomech. 2016;15:207–19.
Giroux C, Rabita G, Chollet D, Guilhem G. Optimal balance between force and velocity differs among world-class athletes. J Appl Biomech. 2016;32:59–68.
Samozino P, Rabita G, Dorel S, Slawinski J, Peyrot N, Saez de Villarreal E, et al. A simple method for measuring power, force, velocity properties, and mechanical effectiveness in sprint running. Scand J Med Sci Sport. 2016;26:648–58.
Garcia-Ramos A, Jaric S. Two-point method: a quick and fatigue-free procedure for assessment of muscle mechanical capacities and the 1 repetition maximum. Strength Cond J. 2018;40:54–66.
Morin JB, Samozino P. Interpreting power-force-velocity profiles for individualized and specific training. Int J Sports Physiol Perform. 2016;11:267–72.
Dern RJ, Levene JM, Blair HA. Forces exerted at different velocities in human arm movements. Am J Physiol. 1947;1947(151):415–37.
Ralston HJ, Polissar MJ. Dynamic features of human isolated voluntary muscle in isometric and free contractions. J Appl Physiol. 1949;1(7):526–33. https://doi.org/10.1152/jappl.1949.1.7.526.
Morel JE. Force-velocity relationship in single muscle fibres. J Theor Biol. 1978;73:445–51.
VanSant AF. The dilemma of the small sample size. Pediatr Phys Ther. 2003;15:145.
Acknowledgements
The authors would like to thank you from subjects in this study. This work was supported by the Portuguese Foundation for Science and Technology (FCT), I.P., under project UIDB04045/2020.
Funding
This research received no external funding.
Author information
Authors and Affiliations
Contributions
Original and final draft: FJA, CJB, DGM; Methodology: LASO, RFS; Formal analysis: PFAN, BGATC, HPN; Review: FRN, VMR, DAM, MCM, FMC, HN; Project administration and supervision: FMC, HN. All authors read and approved the final manuscript.
Corresponding author
Ethics declarations
Ethics approval and consent to participate
All participants signed a free and informed consent term. This study was conducted in accordance with the ethical principles set out in the Helsinki Declaration (2013). This study was approved by the Research Ethics Committee of the Federal University of Sergipe, CAAE: 2.637.882 (date of approval: 7 May 2018).
Consent for publication
Written informed consent has been obtained from the patient (s) to publish this paper.
Competing interests
The authors declare that they have no competing interests.
Additional information
Publisher's Note
Springer Nature remains neutral with regard to jurisdictional claims in published maps and institutional affiliations.
Rights and permissions
Open Access This article is licensed under a Creative Commons Attribution 4.0 International License, which permits use, sharing, adaptation, distribution and reproduction in any medium or format, as long as you give appropriate credit to the original author(s) and the source, provide a link to the Creative Commons licence, and indicate if changes were made. The images or other third party material in this article are included in the article's Creative Commons licence, unless indicated otherwise in a credit line to the material. If material is not included in the article's Creative Commons licence and your intended use is not permitted by statutory regulation or exceeds the permitted use, you will need to obtain permission directly from the copyright holder. To view a copy of this licence, visit http://creativecommons.org/licenses/by/4.0/. The Creative Commons Public Domain Dedication waiver (http://creativecommons.org/publicdomain/zero/1.0/) applies to the data made available in this article, unless otherwise stated in a credit line to the data.
About this article

Cite this article
Aidar, F.J., Brito, C.J., de Matos, D.G. et al. Force–velocity relationship in Paralympic powerlifting: two or multiple-point methods to determine a maximum repetition. BMC Sports Sci Med Rehabil 14, 159 (2022). https://doi.org/10.1186/s13102-022-00552-9
Received:
Accepted:
Published:
DOI: https://doi.org/10.1186/s13102-022-00552-9