
Abstract
Species distribution modeling (SDM) has become an increasingly common approach to explore questions about ecology, geography, outbreak risk, and global change as they relate to infectious disease vectors. Here, we conducted a systematic review of the scientific literature, screening 563 abstracts and identifying 204 studies that used SDMs to produce distribution estimates for mosquito species. While the number of studies employing SDM methods has increased markedly over the past decade, the overwhelming majority used a single method (maximum entropy modeling; MaxEnt) and focused on human infectious disease vectors or their close relatives. The majority of regional models were developed for areas in Africa and Asia, while more localized modeling efforts were most common for North America and Europe. Findings from this study highlight gaps in taxonomic, geographic, and methodological foci of current SDM literature for mosquitoes that can guide future efforts to study the geography of mosquito-borne disease risk.
Graphical Abstract

Background
Mosquito-borne diseases have long imposed a heavy burden on both human and animal health worldwide [1]. There is an extensive history of mosquito control efforts to reduce the transmission of mosquito-borne diseases of global public health importance, notably malaria, yellow fever, and dengue fever [2,3,4]. However, these efforts are increasingly undermined by the combined effects of climate change, urbanization, and health system erosion, all of which are implicated in the expansion of mosquito-borne diseases to higher latitudes and elevations [3, 5, 6], the re-emergence of diseases like malaria and yellow fever [7,8,9,10], and the emergence of novel pathogens like chikungunya and Zika virus [11,12,13,14]. Despite their public health importance, most of these diseases are undersurveilled and underreported, particularly in areas where poverty overlaps with a growing number of syndemic and syndromically hard-to-distinguish mosquito-borne diseases [15,16,17]. As a result, mapping the geographic distribution of mosquito vectors is often used as a first step towards describing the shifting landscapes of infectious disease risk.
One of the most commonly applied tools to study mosquito geographic distributions is species distribution modeling (SDM), also commonly known as ecological niche modeling. Species distribution models relate presence-absence or presence-only occurrence data to explanatory landscape factors, producing estimates of suitable habitat [18, 19]. Inputs for SDMs typically include geolocated data on the presence of the species of interest as the response variable, often in the form of occurrence records derived from literature reviews, databases, or aggregated abundance sampling [18]. Explanatory variables are extracted from a wide range of sources, and ideally represent aspects of the species’ ecology that impact whether the organism can persist in a particular environment. Researchers often consider climatological factors, as well as place and organism-specific factors such as land cover, slope, aspect, elevation, soil type, and human effects on the landscape [20,21,22].
Given the flexibility of the approach, the motivations and objectives for developing SDMs of mosquito species often vary alongside model inputs, methods, and spatial scope. For example, global, regional, or national-scale SDMs may aim to anticipate broad distributions of present or future disease risk [23,24,25], while models developed at a finer spatial scale play an increasingly important role in vector control strategies. Public health vector control and mosquito source reduction are cornerstones of disease management, curbing transmission when clinical treatment and prophylactic options are limited or non-existent, as is currently the case for many arboviruses [26]. Identifying areas at risk from mosquito-borne disease transmission is integral to the development of effective policies, formation of mitigation strategies, and allocation of resources [27, 28]; however, vector surveillance activities can be resource intensive and geographically limited [29, 30]. Research-guided mosquito surveillance and abatement efforts are therefore often cited as necessary for practitioners to precisely know not only when, but also where to both monitor and intervene [31,32,33,34,35,36,37].
Here, we undertake a systematic review of the current body of literature on mosquito SDM research, motivated by the desire to understand these different applications, and to identify trends, challenges, and gaps in the current body of knowledge generated around mosquito ecology and biogeography. We followed the preferred reporting items for systematic reviews and meta-analyses (PRISMA) guidelines to identify and compile studies that developed SDMs of mosquito species in the past 20 years, and extracted information on the species, methods, input variables, and location and scale of each relevant published, peer-reviewed study [38].
Methods
We conducted literature searches following PRISMA statement guidelines, a checklist of criteria to ensure transparency in systematic reviews [38, 39]. We conducted searches across all Web of Science databases through January 2023 to identify studies using SDMs to estimate mosquito geographic distributions. Combinations of key terms used in searches included “Aedes,” “Culex,” “Anopheles,” and “mosquito” with “species distribution model*” and “ecological niche model*.” We included Aedes, Anopheles and Culex as explicit search terms, as these genera comprise the disease vectors most targeted in public health initiatives, and are intensely studied as disease vectors [40,41,42]. The inclusion of “mosquito” as a search term was to ensure that we captured studies on species beyond these three taxonomic groupings, and we did not restrict our searches to species implicated in human disease transmission. While there were no restrictions on the geographic region of study or date of publication, searches were limited to English language results.
Duplicate records were removed from our search results before screening. We screened the remaining abstracts for subject relevance (i.e., studies on mosquitoes), additionally removing publications that were literature reviews, expert commentaries, synthesis papers, phylogenetic studies, or gray literature. The remaining studies were reviewed in full for inclusion, excluding studies with methodologies that were not within the scope of this review, including papers that were purely descriptive, used mosquito-borne disease cases as response variables, or modeled mosquito presence, abundance, or behaviors (e.g., such as oviposition or bite rates) using data with no geospatial component.
We extracted information from the full text of the remaining studies, which included information on publication (e.g., digital object identifier link), the mosquito species of interest as identified in the studies, SDM methods used, geographic location of study, spatial scale of analysis, and data sources for both species occurrence records and explanatory environmental variables. We noted methods used for model fitting, addressing collinearity, and if modeled distributions were projected beyond their initial training scope (e.g., models projected to other geographic locations, or future time horizons) when available. The methods used in the studies were classified into nine categories, which are outlined in Table 1.
Data extracted from the final collection of screened literature were synthesized to describe trends in mosquito SDMs. Data visualization was conducted in R (v4.1.2.) using code adapted from Lippi et al. [43], and mapping was performed in ArcMap (v10.8.1). The database of screened literature is available on GitHub (https://github.com/RyanLab/MOSQ_SDM_Table).
Results
The initial search returned 1185 records (Fig. 1), and 563 records remained after duplicates were removed. In initial abstract screening, 298 records for studies that did not fit the scope of this review were removed. After reviewing the full text of the remaining 265 records, we retained 204 studies that met our criteria for inclusion (https://github.com/RyanLab/MOSQ_SDM_Table).
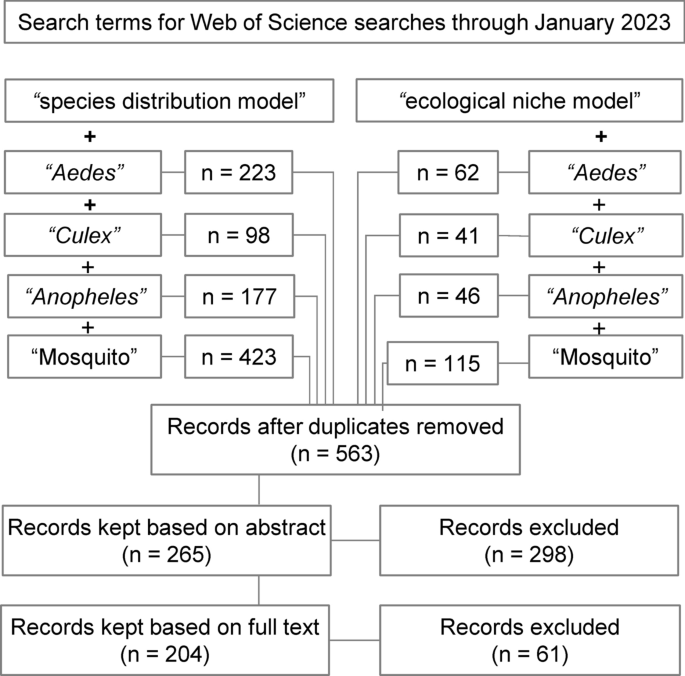
Flow diagram of the systematic review process, indicating combinations of search terms and number of studies screened
Taxonomic focus of SDMs
There were 138 mosquito species featured in SDMs produced in the reviewed literature, which included 78 species in Anopheles, 25 species in Culex, 24 species in Aedes (= Ochlerotatus), and 11 species in other genera, including Coquillettidia, Culiseta, Haemagogus, and Sabethes. By species, most SDM studies developed models for Aedes aegypti (n = 55), Aedes albopictus (n = 50), Culex pipiens (n = 20), Anopheles gambiae (n = 17), and Anopheles arabiensis (n = 15) (Fig. 2).

Top 10 mosquito species, within each genus, that have been studied with species distribution models (SDMs). Most efforts focused on Aedes aegypti and Aedes albopictus, followed by Culex pipiens, though collectively species in the genus Anopheles were also extensively modeled. Cs. Culiseta, Cq. Coquillettidia, Hg. Haemagogus, Ps. Psorophora, Sa. Sabethes, Ur. Uranotaenia
Grouping by genera, mosquitoes featured in SDM studies have changed over time (Fig. 3a).

Cumulative number of studies on mosquitoes that modeled a given mosquito genus (a), and the SDM methods used in studies over time (b). CTA Classification tree analysis, MaxEnt maximum entropy, GARP genetic algorithm for rule-set production
The early mosquito SDM literature predominantly focused on mosquitoes in the genus Anopheles, comprising 64.3% of studies published through 2010. In recent years, studies on Aedes mosquitoes have become more prevalent, and these mosquitoes were the taxonomic focus of nearly half (48.6%) of all mosquito SDMs produced since 2015. In the same period, roughly a quarter of studies were on mosquitoes in the genus Anopheles (24.0%), and 11.6% on mosquitoes in the genus Culex.
Methods used to build SDMs
Overall, 169 of the 204 studies reviewed (82.8%) used a single method to estimate mosquito distributions, while the remaining 35 (17.2%) used more than one method or used model ensemble approaches (Fig. 3b). More than half (n = 108, 52.9%) of the studies used MaxEnt exclusively, a trend which also holds across genera (Fig. 4). An additional 21 (10.3%) used MaxEnt with one or more additional SDM methods. Non-machine learning regression models (e.g., logistic regression, generalized linear models, etc.) were used exclusively in 18 studies (8.8%), and used in combination with other methods in an additional 16 studies (7.8%). CTA methods, which included classification and regression trees, boosted regression trees, and random forest, were used as the sole SDM method in 14 studies (6.9%), and the genetic algorithm for rule set prediction (GARP) was the sole method in 12 studies (5.9%). CTA methods were combined with other SDMs in 18 additional studies (8.8%), while GARP was used with other methods in five additional studies (2.5%). Mechanistic models were used as the only SDM method in three studies (1.5%), and bioclimatic envelope models were used in five studies (2.5%). Thirteen studies (6.4%), which were characterized as “Other,” featured uncommon methods such as ecological niche factor analysis, and other types of environmental suitability or logic thresholds.

Breakdowns of methods used, shown by taxonomic groups for Aedes (a), Anopheles (b), Culex (c), and studies that estimated distributions for multiple genera (d). For abbreviations, see Fig. 3
The frequency of using SDMs to estimate mosquito distributions increased markedly over time, particularly from 2015 onward (Fig. 3b). Concurrently, the evolution of SDM algorithms led to a more diverse methodological landscape. In the early 2000s, GARP was the most commonly implemented method among these studies, and remained a frequently used method until approximately 2010. MaxEnt software was released in 2006, and the first mosquito SDM study using MaxEnt was published shortly thereafter, in 2007. By 2011, it was the most common SDM approach, with 19 of 43 studies (44.2%) published during those years solely using MaxEnt. More than half (62.3%) of the mosquito SDM studies published since 2015 solely used MaxEnt to estimate mosquito distributions. To a lesser extent, the frequency of using multiple SDM approaches in a single study [“Mixed” (Figs. 3, 4)] has also increased over time. The first mixed methods study based on our inclusion criteria was published in 2008, and studies that used multiple SDM approaches have accounted for 13.7% of those published since 2015. CTAs and regression methods have seen modest increases in use over the past decade, and were used in 8.2% and 6.2% of studies, respectively, since 2015. The increased availability of gridded data layers of ecological and climate products, representing a host of environmental factors, has also been a fundamental piece in the rapid expansion of SDM research. A notable example is the WorldClim database, which was first released in 2005 (with version 2 released in 2017) and made long-term averages of historical and projected future climate data accessible for many SDM studies [44].
Spatial scale of SDMs
The scale of analysis varied considerably throughout the mosquito SDM literature. The majority of studies were conducted at the sub-national (34.8%) or national (31.4%) level. Most national or sub-national studies were conducted in the USA (11.1%), followed by Germany (6.7%), Mexico (6.7%), Australia (5.2%), Brazil (4.4%), China (4.4%), Colombia (4.4%), Italy (4.4%), Argentina (3.7%), Iran (3.7%), and Tanzania (3.7%) (Fig. 5). Approximately one-quarter of studies (24.5%) were regional, projecting models over large geographic areas that encompassed multiple countries. Most of the regional models were developed for portions of Africa (30.0%) and Europe (30.0%), followed by SDMs developed for regions in Asia (24.0%), North America (16.0%), and South America (16.0%). Nearly half of all regional models (44.0%) were developed for species of Anopheles. Relatively few SDMs (9.3%) focused on a global extent, but of those, the majority (68.4%) focused on mosquitoes in the genus Aedes (Fig. 6A). Studies conducted in African countries typically modeled the distributions of Anopheles, while European studies tended to focus on Aedes. In comparison, studies conducted in North America, South America, the Middle East, and countries in Asia more frequently included multiple species, or other taxonomic groups (Fig. 5).

Map representing the number of SDM studies conducted at the national or sub-national level (country, greyscale) and the mosquito genera modeled in the studies (pie chart, color breakdown)

The proportion of spatial scales represented in the reviewed SDM studies, shown by genera for Aedes (a), Anopheles (b), Culex (c), and multiple genera (d)
The scale of analysis used to build SDMs also varied by taxa. Species distribution models were built for Aedes mosquitoes in roughly equivalent proportions (Fig. 6a), possibly driven by the global invasions of Ae. aegypti and Ae. albopictus. In contrast, global suitability models for Anopheles and Culex were relatively uncommon (Fig. 6b, c), regional and sub-national models were most common for Anopheles (Fig. 6b), and SDMs for Culex and multiple genera primarily consisted of national and sub-national models (Fig. 6c, d).
Data sources used to build SDMs
Mosquito occurrence records used as data inputs for SDM workflows were obtained from a variety of sources. Over one-third of the reviewed studies (36.8%) included georeferenced locations from online data repositories when building models, the majority of which (49.3%) used the Global Bioinformatics Information Facility to obtain data. Georeferenced data obtained from published sources and literature reviews were also frequently used as data inputs in studies (36.8%), with the database published by Kraemer et al. [45] explicitly cited as a data source in 5.4% of all studies. Use of existing public health surveillance systems for mosquito records, which included databases from national public health authorities, was indicated in 11.8% of studies.
Collection of novel mosquito records through entomological sampling was indicated in approximately one-third (32.2%) of published studies, of which 16.1% supplemented collection records with data from other sources (e.g., published data, online repositories, etc.). Of the studies that collected entomological data, 59.3% reported larval sampling, of which 18.8% reported sampling with oviposition or gravid traps. Diverse sampling methods were reported in studies with entomological data that targeted the adult life stage, including Centers for Disease Control and Prevention light traps (37.8%), BG-Sentinel traps (22.2%), Mosquito Magnet traps (15.6%), aspiration (13.3%), and human landing catch (11.1%). While studies that included a field component typically described the mosquito life stage targeted in sampling, across all studies the life stage of mosquitoes used for species presence (i.e., adults, immatures, or both) was not specified in most instances (53.9%).
Environmental predictors of mosquito presence
Most studies (89.7%) incorporated climate variables to estimate mosquito distributions. While some studies (20.1%) used climate data exclusively, many (69.6%) used a combination of climate data and other environmental covariates (e.g., land cover class, elevation, soil classifications, etc.) in their model predictions. Most studies (69.2%) that used climate data to produce SDMs employed WorldClim data products. Many studies (27.9%) projected models to estimate mosquito distributions under future climate conditions, using products such as downscaled global climate models as environmental predictors. A variety of methods were used to control for collinearity in environmental predictors before building SDMs, including use of correlation coefficients with a threshold (27.5%), principal component analysis (8.3%), and variance inflation factor (5.9%). Nearly half of the studies (48.5%) did not explicitly address predictor collinearity.
Variables identified as important for predicting mosquito distributions were reported in 80.3% of studies. Identified drivers varied considerably between studies and taxa. Measures of temperature were most often described as important predictors of mosquitoes (54.9% of studies), followed by precipitation (42.6%), land cover and land use (31.4%), and elevation (18.6%). Of the studies that incorporated climate variables, 62.6% identified temperature, and 52.5% identified precipitation as important predictors of mosquito habitat suitability. By taxonomic group, temperature variables were top predictors in 44 (50.0%) studies on Aedes, 37 (58.7%) studies on Anopheles, and 16 (69.6%) studies on Culex. Precipitation variables were top predictors in 32 (36.4%) studies on Aedes, 36 (57.1%) studies on Anopheles, and 12 (52.2%) studies on Culex. Variable importance was not reported in 19.6% of studies.
Discussion
SDM has become a frequently used methodological approach to estimate the distribution, and implicit risk, of vector-borne diseases [35, 36]. In this study, we conducted a systematic review of scientific literature that used SDMs to estimate geographic distributions of mosquitoes. By quantifying data from the screened literature to identify patterns and trends, we were able to summarize the methods, taxonomic foci, geographic scope, and other attributes reported in SDM studies. Importantly, this also enabled us to identify potential gaps in the current literature, and thus provide guidance for future modeling efforts.
Current trends in mosquito SDMs
Although there is diversity in the landscape of available modeling approaches and tools, MaxEnt is the most commonly implemented method for conducting SDM studies on mosquitoes [46]. After its release in 2006, MaxEnt quickly gained favor over previously common methods, like GARP, and remains the most frequently used approach for the estimation of mosquito distributions [47]. While MaxEnt may be the most appropriate methodology for some studies, the popularity of the method also results from an interpretable graphic user interface, prolific training guides, and general ease of implementation for users. Further, the release of WorldClim climate model output data in 2005, and the subsequent availability of other gridded environmental data products, allowed users to perform analyses without collecting primary environmental data, facilitating the use of SDMs [48].
The majority of the SDM studies in this review were on Anopheles or Aedes. This is not surprising, given the emphasis on the global health importance of malaria transmitted by mosquitoes in the genus Anopheles, and arboviral pathogens transmitted by some species in the genus Aedes, including yellow fever virus and dengue virus. Moreover, most global modeling efforts involve mosquitoes in the genus Aedes, likely owing not only to the medical importance of two key species (Ae. aegypti and Ae. albopictus), but also to their cosmopolitan success as invasive species. In contrast, SDMs for Anopheles were typically conducted at regional, national, and local scales, and in locations predominantly on the African continent, reflecting the disproportionate research effort focused on malaria caused by Plasmodium falciparum.
Geographic gaps exist for central Asia, Southeast Asia, eastern Europe, and portions of Africa and South America, where few highly localized studies have been conducted. Notably, many of these regions have rich mosquito diversity, including dozens of understudied vectors of current or potential future emerging infections [49]. Modeling studies in these regions were also underdeveloped in respect to other methodological aspects; for example, temperature and precipitation in these regions were most commonly represented by WorldClim bioclimatic variables rather than regionally developed climate products. Regionally targeted research efforts may benefit from locally created and locally validated climate and land cover products.
Challenges of SDMs
We found considerable variation in which environmental drivers were identified as predictive of mosquito distributions, such that few generalizations could be made even for a given species. Variable importance is influenced by nearly every step of the SDM building process, such as choice of data products, scale of analysis, collinearity reduction techniques, and choice of SDM algorithm. In studies that reported variable importance, actual values of environmental predictors (i.e., numerical thresholds for occurrence) were rarely reported. The prevalence of studies that failed to reduce the number of variables to address collinearity, or lacked justification for choice of environmental predictors, points to a potentially troubling lack of biological grounding and hypothesis testing. These challenges can be readily addressed in future studies through adherence to best practices and standards in building models and reporting results [50,51,52]. Assessing the quality of models and adherence to best practices is beyond the scope of this review but has been recently assessed by Barker and MacIsaac [51]. Given some of these underlying heterogeneities among studies, care must be taken when interpreting the results of SDMs, especially those potentially used for guiding public health decision-making, as basing decisions on the results of poor-quality models can lead to the diversion of resources and miscommunication of the true risk of exposure.
Opportunities for future modeling efforts
Many efforts have been made to delineate the geographic extent of mosquitoes, but the current literature still may not capture the full landscape of risk, especially in the biodiverse areas where new infections are more likely to originate [53, 54]. Moreover, older range maps may not reflect the most current understanding of mosquito taxonomy (e.g., grouping members of a species complex together), and may need reassessment. The movement of vectors and pathogens may also serve as the catalyst for new public health challenges, for example, when mosquito vectors aggressively invade new locations [6, 55], or when the introduction of pathogens increases the medical significance of local mosquito populations [35]. These changes also create a problem for the scientific literature itself: the estimation of range boundaries based on baseline climate conditions has diminishing value in a rapidly warming world, where mosquito ranges have already become non-stationary in both invasive ranges [25] and endemic areas [6].
Conclusions
Our findings indicate an opportunity not only to expand data collection and distribution modeling efforts for underrepresented mosquito species and in underrepresented areas [43, 56] but also to more broadly rethink the SDM workflow as it is currently used in vector surveillance and control. An iterative workflow is technologically feasible and cost-effective, where (1) existing surveillance data and local knowledge are used to generate or update mosquito distribution models; (2) new forecasts are generated that anticipate areas at risk of range expansions, based on existing trends and climate projections; and (3) models are used to guide the collection of new surveillance data, which can also be used for model validation (Fig. 7). Field efforts to collect data used for model improvement can be a daunting endeavor, yet we found a surprisingly high number of studies which collected novel entomological survey data for building models. Nevertheless, relatively few studies incorporated data from public health surveillance systems, highlighting a potential avenue to future collaborations between modelers, public health authorities, and vector control agencies. This new workflow presents opportunities on the technological front, where efforts to employ newer approaches with updated methodologies and software, and adherence to best practices, may enable us to refine estimates of spatial risk; moreover, adoption of automated approaches that update range estimates from incoming data could aid in making timely predictions that are more accessible to decision-makers. Partnerships with local experts and agencies will be key both to improving model predictions and maximizing their applied utility [57]. Ultimately, working more closely with end users may facilitate the uptake of modeling workflows, ensuring that SDMs are appropriately contextualized and regularly updated.

A conceptual workflow for dynamic mosquito species distribution modeling
Availability of data and materials
All of the papers reviewed in this study are included in the References [24, 25, 58,59,60,61,62,63,64,65,66,67,68,69,70,71,72,73,74,75,76,77,78,79,80,81,82,83,84,85,86,87,88,89,90,91,92,93,94,95,96,97,98,99,100,101,102,103,104,105,106,107,108,109,110,111,112,113,114,115,116,117,118,119,120,121,122,123,124,125,126,127,128,129,130,131,132,133,134,135,136,137,138,139,140,141,142,143,144,145,146,147,148,149,150,151,152,153,154,155,156,157,158,159,160,161,162,163,164,165,166,167,168,169,170,171,172,173,174,175,176,177,178,179,180,181,182,183,184,185,186,187,188,189,190,191,192,193,194,195,196,197,198,199,200,201,202,203,204,205,206,207,208,209,210,211,212,213,214,215,216,217,218,219,220,221,222,223,224,225,226,227,228,229,230,231,232,233,234,235,236,237,238,239,240,241,242,243,244,245,246,247,248,249,250,251,252,253,254,255,256,257,258,259]. Data associated with this analysis are available on GitHub (https://github.com/RyanLab/MOSQ_SDM_Table).
Abbreviations
- CTA:
-
Classification tree analysis
- GARP:
-
Genetic algorithm for rule-set production
- MaxEnt:
-
Maximum entropy modeling
- SDM:
-
Species distribution model
References
WHO. A global brief on vector-borne diseases. World Health Organization; 2014. Report no.: WHO/DCO/WHD/2014.1.
Alonso P, Noor AM. The global fight against malaria is at a crossroads. The Lancet. 2017;390:2532–4.
Gubler D. Dengue, urbanization and globalization: the unholy trinity of the 21st century. Trop Med Health. 2011;39:3–11.
Gianchecchi E, Cianchi V, Torelli A, Montomoli E. Yellow fever: origin, epidemiology, preventive strategies and future prospects. Vaccines. 2022;10:372.
Brito AF, Machado LC, Oidtman RJ, Siconelli MJL, Tran QM, Fauver JR, et al. Lying in wait: the resurgence of dengue virus after the Zika epidemic in Brazil. Nat Commun. 2021;12:1–13.
Carlson CJ, Bannon E, Mendenhall E, Newfield T, Bansal S. Rapid range shifts in African Anopheles mosquitoes over the last century. Biol Let. 2023;19:20220365.
Linthicum KJ, Britch SC, Anyamba A. Rift Valley fever: an emerging mosquito-borne disease. Annu Rev Entomol. 2016;61:395–415.
Mackenzie JS, Gubler DJ, Petersen LR. Emerging flaviviruses: the spread and resurgence of Japanese encephalitis, West Nile and dengue viruses. Nat Med. 2004;10:S98-109.
Correa-Salazar C, Amon JJ. Cross-border COVID-19 spread amidst malaria re-emergence in Venezuela: a human rights analysis. Global Health BioMed Central. 2020;16:1–8.
de Oliveira FP, Stoffella-Dutra AG, Barbosa Costa G, Silva de Oliveira J, Dourado Amaral C, Duarte Santos J, et al. Re-emergence of yellow fever in Brazil during 2016–2019: challenges, lessons learned, and perspectives. Viruses. 2020;12:1233.
Roth A, Hoy D, Horwood PF, Ropa B, Hancock T, Guillaumot L, et al. Preparedness for threat of chikungunya in the Pacific. Emerg Infect Dis. 2014;20:e130696.
Lippi CA, Stewart-Ibarra AM, Romero M, Lowe R, Mahon R, Van Meerbeeck CJ, et al. Spatiotemporal tools for emerging and endemic disease hotspots in small areas: an analysis of dengue and chikungunya in Barbados, 2013–2016. Am J Trop Med Hyg. 2020;103:149–56.
Lucey DR, Gostin LO. The emerging Zika pandemic: enhancing preparedness. J Am Med Assoc. 2016;315:865–6.
Chen B, Sweeny AR, Wu VY, Christofferson R, Ebel G, Fagre AC, et al. Exploring the mosquito-arbovirus network: a survey of vector competence experiments. Am J Trop Med Hyg. 2023;108:987–94.
Vogels CBF, Rückert C, Cavany SM, Alex Perkins T, Ebel GD, Grubaugh ND. Arbovirus coinfection and co-transmission: a neglected public health concern? PLoS Biol. 2019;17:e3000130.
Carlson CJ, Mendenhall E. Preparing for emerging infections means expecting new syndemics. Lancet. 2019;394:297.
Glennon EE, Jephcott FL, Oti A, Carlson CJ, Bustos Carillo FA, Hranac CR, et al. Syndromic detectability of haemorrhagic fever outbreaks. medRxiv. 2020. https://doi.org/10.1101/2020.03.28.20019463.
Elith J, Leathwick JR. Species distribution models: ecological explanation and prediction across space and time. Annu Rev Ecol Evol Syst. 2009;40:677–97. https://doi.org/10.1146/annurev.ecolsys.110308.120159.
Elith J, Franklin J. Species distribution modeling. In: Reference module in life sciences. 2017. https://doi.org/10.1016/b978-0-12-809633-8.02390-6
Johnson CJ, Gillingham MP. An evaluation of mapped species distribution models used for conservation planning. Environ Conserv. 2005;32:117–28.
Madzokere ET, Hallgren W, Sahin O, Webster JA, Webb CE, Mackey B, et al. Integrating statistical and mechanistic approaches with biotic and environmental variables improves model predictions of the impact of climate and land-use changes on future mosquito-vector abundance, diversity and distributions in Australia. Parasit Vectors. 2020;13:484. https://doi.org/10.1186/s13071-020-04360-3.
Wiese D, Escalante AA, Murphy H, Henry KA, Gutierrez-Velez VH. Integrating environmental and neighborhood factors in MaxEnt modeling to predict species distributions: a case study of Aedes albopictus in southeastern Pennsylvania. PLoS ONE. 2019;14:e0223821.
El-Gabbas A, Dormann CF. Wrong, but useful: regional species distribution models may not be improved by range-wide data under biased sampling. Ecol Evol. 2018;8:2196–206.
Lippi CA, Stewart-Ibarra AM, Loor MEFB, Zambrano JED, Lopez NAE, Blackburn JK, et al. Geographic shifts in Aedes aegypti habitat suitability in Ecuador using larval surveillance data and ecological niche modeling: implications of climate change for public health vector control. PLoS Negl Trop Dis. 2019;13:e0007322.
Kraemer MUG, Sinka ME, Duda KA, Mylne AQN, Shearer FM, Barker CM, et al. The global distribution of the arbovirus vectors Aedes aegypti and Ae. albopictus. eLife. 2015;4:e08347.
Rodriguez-Morales AJ, Cardona-Ospina JA, Collins MH. Emerging and re-emerging vector-borne and zoonotic diseases. Front Med. 2021;8:714630. https://doi.org/10.3389/fmed.2021.714630.
Brookes VJ, Hernández-Jover M, Black PF, Ward MP. Preparedness for emerging infectious diseases: pathways from anticipation to action. Epidemiol Infect. 2015;143:2043–58.
Centers for Disease Control and Prevention. A National Public Health Framework for the Prevention and Control of Vector-Borne Diseases in Humans. Centers for Disease Control and Prevention; 2020;1–16.
Smith Gueye C, Newby G, Gosling RD, Whittaker MA, Chandramohan D, Slutsker L, et al. Strategies and approaches to vector control in nine malaria-eliminating countries: a cross-case study analysis. Malar J. 2016;15:1–14.
Lippi CA, Mao L, Stewart-Ibarra AM, Heydari N, Ayala EB, Burkett-Cadena ND, et al. A network analysis framework to improve the delivery of mosquito abatement services in Machala, Ecuador. Int J Health Geogr. 2020;19:1–14.
Fouet C, Kamdem C. Integrated mosquito management: is precision control a luxury or necessity? Trends Parasitol. 2019;35:85–95.
Dye-Braumuller K, Fredregill C, Debboun M. Mosquito control. In: Mosquitoes, communities, and public health in Texas. Mosquito and Vector Control Division, Harris County Public Health, Houston, TX. 2020; pp. 249–78.
Impoinvil DE, Ahmad S, Troyo A, Keating J, Githeko AK, Mbogo CM, et al. Comparison of mosquito control programs in seven urban sites in Africa, the Middle East, and the Americas. Health Policy. 2007;83:196–212.
Alimi TO, Fuller DO, Quinones ML, Xue R-D, Herrera SV, Arevalo-Herrera M, et al. Prospects and recommendations for risk mapping to improve strategies for effective malaria vector control interventions in Latin America. Malar J. 2015;14:519.
Coatsworth H, Lippi CA, Vasquez C, Ayers JB, Stephenson CJ, Waits C, et al. A molecular surveillance-guided vector control response to concurrent dengue and West Nile virus outbreaks in a COVID-19 hotspot of Florida. Lancet Reg Health Am. 2022;11:100231. https://doi.org/10.1101/2021.10.08.21264776.
Chanda E, Ameneshewa B, Angula HA, Iitula I, Uusiku P, Trune D, et al. Strengthening tactical planning and operational frameworks for vector control: the roadmap for malaria elimination in Namibia. Malar J. 2015;14:302.
Ryan SJ, Lippi CA, Zermoglio F. Shifting transmission risk for malaria in Africa with climate change: a framework for planning and intervention. Malar J. 2020;19:170.
Moher D, Liberati A, Tetzlaff J, Altman DG. Preferred reporting items for systematic reviews and meta-analyses: the PRISMA statement. BMJ. 2009;339:b2535.
Liberati A, Altman DG, Tetzlaff J, Mulrow C, Gøtzsche PC, Ioannidis JPA, et al. The PRISMA statement for reporting systematic reviews and meta-analyses of studies that evaluate health care interventions: explanation and elaboration. J Clin Epidemiol. 2009;62:e1-34.
WHO. Global vector control response 2017–2030. World Health Organization. 2017;1–53.
WHO. Global Strategy for dengue prevention and control, 2012–2020. World Health Organization. 2012; 1–43.
Moonen JP, Schinkel M, van der Most T, Miesen P, van Rij RP. Composition and global distribution of the mosquito virome—a comprehensive database of insect-specific viruses. One Health. 2023;16:100490.
Lippi CA, Ryan SJ, White AL, Gaff HD, Carlson CJ. Trends and opportunities in tick-borne disease geography. J Med Entomol. 2021;58:2021–9.
Fick SE, Hijmans RJ. WorldClim 2: new 1-km spatial resolution climate surfaces for global land areas. Int J Climatol. 2017;37:4302–15.
Kraemer MUG, Sinka ME, Duda KA, Mylne A, Shearer FM, Brady OJ, et al. The global compendium of Aedes aegypti and Ae. albopictus occurrence. Sci Data. 2015;2:150035.
Srivastava V, Lafond V, Griess VC. Species distribution models (SDM): applications, benefits and challenges in invasive species management. CABI Rev. 2019;2:1–13. https://doi.org/10.1079/pavsnnr201914020.
Phillips SJ, Anderson RP, Schapire RE. Maximum entropy modeling of species geographic distributions. Ecol Model. 2006;190:231–59. https://doi.org/10.1016/j.ecolmodel.2005.03.026.
Hijmans RJ, Cameron SE, Parra JL, Jones PG, Jarvis A. Very high resolution interpolated climate surfaces for global land areas. Int J Climatol. 2005;15:1965–78. https://doi.org/10.1002/joc.1276.
Soghigian J, Sither C, Justi S, Morinaga G, Cassel B, Vitek C, et al. An enduring enemy: phylogenomics reveals the history of host use in mosquitoes. 2023; Available from: https://www.researchsquare.com/article/rs-2515328/latest.pdf.
Araújo MB, Anderson RP, Márcia Barbosa A, Beale CM, Dormann CF, Early R, et al. Standards for distribution models in biodiversity assessments. Sci Adv. 2019;5:e4858.
Barker JR, MacIsaac HJ. Species distribution models applied to mosquitoes: use, quality assessment, and recommendations for best practice. Ecol Model. 2022;472:110073. https://doi.org/10.1016/j.ecolmodel.2022.110073.
Zurell D, Franklin J, König C, Bouchet PJ, Dormann CF, Elith J, et al. A standard protocol for reporting species distribution models. Ecography. 2020;43:1261–77.
Carlson CJ, Albery GF, Merow C, Trisos CH, Zipfel CM, Eskew EA, et al. Climate change increases cross-species viral transmission risk. Nature. 2022;607:555–62.
Jones KE, Patel NG, Levy MA, Storeygard A, Balk D, Gittleman JL, et al. Global trends in emerging infectious diseases. Nature. 2008;451:990–3.
World Health Organization. Vector alert: Anopheles stephensi invasion and spread in Africa and Sri Lanka. World Health Organization. 2022;1–4.
Schluth CG, Standley CJ, Bansal S, Carlson CJ. Spatial parasitology and the unmapped human helminthiases. Parasitology. 2023;150:391–9.
Judson SD, LeBreton M, Fuller T, Hoffman RM, Njabo K, Brewer TF, et al. Translating predictions of zoonotic viruses for policymakers. EcoHealth. 2017;15:52–62.
Foley DH, Weitzman AL, Miller SE, Faran ME, Rueda LM, Wilkerson RC. The value of georeferenced collection records for predicting patterns of mosquito species richness and endemism in the Neotropics. Ecol Entomol. 2007;33:12–23.
Trájer A. The complex investigation of the colonization potential of Aedes albopictus (Diptera: Culicidae) in the South Pannonian Ecoregion. Appl Ecol Env Res. 2017;15:275–98.
Tonnang HE, Kangalawe RY, Yanda PZ. Predicting and mapping malaria under climate change scenarios: the potential redistribution of malaria vectors in Africa. Malar J. 2010;9:111.
Khormi HM, Kumar L. Climate change and the potential global distribution of Aedes aegypti: spatial modelling using geographical information system and CLIMEX. Geospat Health. 2014;8:405.
Tonnang HE, Tchouassi DP, Juarez HS, Igweta LK, Djouaka RF. Zoom in at African country level: potential climate-induced changes in areas of suitability for survival of malaria vectors. Int J Health Geogr. 2014;13:12.
Sinka ME, Bangs MJ, Manguin S, Chareonviriyaphap T, Patil AP, Temperley WH, et al. The dominant Anopheles vectors of human malaria in the Asia-Pacific region: occurrence data, distribution maps and bionomic précis. Parasit Vectors. 2011;4:89.
Sinka ME, Bangs MJ, Manguin S, Rubio-Palis Y, Chareonviriyaphap T, Coetzee M, et al. A global map of dominant malaria vectors. Parasit Vectors. 2012;5:69.
Lühken R, Czajka C, Steinke S, Jöst H, Schmidt-Chanasit J, Pfitzner W, et al. Distribution of individual members of the mosquito Anopheles maculipennis complex in Germany identified by newly developed real-time PCR assays: the Anopheles maculipennis complex in Germany. Med Vet Entomol. 2016;30:144–54.
Moyes CL, Shearer FM, Huang Z, Wiebe A, Gibson HS, Nijman V, et al. Predicting the geographical distributions of the macaque hosts and mosquito vectors of Plasmodium knowlesi malaria in forested and non-forested areas. Parasit Vectors. 2016;9:242.
Sinka ME, Golding N, Massey NC, Wiebe A, Huang Z, Hay SI, et al. Modelling the relative abundance of the primary African vectors of malaria before and after the implementation of indoor, insecticide-based vector control. Malar J. 2016;15:142.
Wiebe A, Longbottom J, Gleave K, Shearer FM, Sinka ME, Massey NC, et al. Geographical distributions of African malaria vector sibling species and evidence for insecticide resistance. Malar J. 2017;16:85.
Longbottom J, Browne AJ, Pigott DM, Sinka ME, Golding N, Hay SI, et al. Mapping the spatial distribution of the Japanese encephalitis vector, Culex tritaeniorhynchus Giles, 1901 (Diptera: Culicidae) within areas of Japanese encephalitis risk. Parasit Vectors. 2017;10:148.
Ducheyne E, Tran Minh NN, Haddad N, Bryssinckx W, Buliva E, Simard F, et al. Current and future distribution of Aedes aegypti and Aedes albopictus (Diptera: Culicidae) in WHO Eastern Mediterranean Region. Int J Health Geogr. 2018;17:4.
Hertig E. Distribution of Anopheles vectors and potential malaria transmission stability in Europe and the Mediterranean area under future climate change. Parasit Vectors. 2019;12:18.
Khan SU, Ogden NH, Fazil AA, Gachon PH, Dueymes GU, Greer AL, et al. Current and projected distributions of Aedes aegypti and Ae. albopictus in Canada and the US. Environ Health Perspect. 2020;128:057007.
Polineni S, Shastri O, Bagchi A, Gnanakumar G, Rasamsetti S, Sundaravadivel P. MOSQUITO EDGE: an edge-intelligent real-time mosquito threat prediction using an IoT-enabled hardware system. Sensors. 2022;22:695.
Ayala D, Costantini C, Ose K, Kamdem GC, Antonio-Nkondjio C, Agbor J-P, et al. Habitat suitability and ecological niche profile of major malaria vectors in Cameroon. Malar J. 2009;8:307.
Monaghan AJ, Eisen RJ, Eisen L, McAllister J, Savage HM, Mutebi J-P, et al. Consensus and uncertainty in the geographic range of Aedes aegypti and Aedes albopictus in the contiguous United States: multi-model assessment and synthesis. PLoS Comput Biol. 2019;15:e1007369.
Simons RRL, Croft S, Rees E, Tearne O, Arnold ME, Johnson N. Using species distribution models to predict potential hot-spots for Rift Valley fever establishment in the United Kingdom. PLoS ONE. 2019;14:e0225250.
Peterson AT, Vieglais DA, Andreasen JK. Migratory birds modeled as critical transport agents for West Nile virus in North America. Vector-Borne Zoonotic Dis. 2003;3:27–37.
Levine RS, Peterson AT, Benedict MQ. Distribution of members of Anopheles quadrimaculatus Say s.l. (Diptera: Culicidae) and implications for their roles in malaria transmission in the United States. J Med Entomol. 2004;41:607–13.
Levine RS, Peterson AT, Benedict MQ. Geographic and ecologic distributions of the Anopheles gambiae complex predicted using a genetic algorithm. Am J Trop Med Hyg. 2004;70:105–9.
Peterson AT, Martínez-Campos C, Nakazawa Y, Martínez-Meyer E. Time-specific ecological niche modeling predicts spatial dynamics of vector insects and human dengue cases. Trans R Soc Trop Med Hyg. 2005;99:647–55.
Sweeney AW, Beebe NW, Cooper RD, Bauer JT, Peterson AT. Environmental factors associated with distribution and range limits of malaria vector Anopheles farauti in Australia. J Med Entomol. 2006;43:1068–75.
Sweeney AW, Beebe NW, Cooper RD. Analysis of environmental factors influencing the range of anopheline mosquitoes in northern Australia using a genetic algorithm and data mining methods. Ecol Model. 2007;203:375–86.
De Barros FSM, De Aguiar DB, Rosa-Freitas MG, Luitgards-Moura JF, Da Costa GH, Honório NA, et al. Distribution summaries of malaria vectors in the northern Brazilian Amazon. J Vect Ecol. 2007;32:161.
Rosa-Freitas MG, Tsouris P, Peterson AT, Honório NA, Barros FSMD, Aguiar DBD, et al. An ecoregional classification for the state of Roraima, Brazil: the importance of landscape in malaria biology. Mem Inst Oswaldo Cruz. 2007;102:349–58.
Beebe NW, Cooper RD, Mottram P, Sweeney AW. Australia’s dengue risk driven by human adaptation to climate change. PLoS Negl Trop Dis. 2009;3:e429.
Peterson AT. Shifting suitability for malaria vectors across Africa with warming climates. BMC Infect Dis. 2009;9:59.
Pech-May A, Moo-Llanes DA, Puerto-Avila MB, Casas M, Danis-Lozano R, Ponce G, et al. Population genetics and ecological niche of invasive Aedes albopictus in Mexico. Acta Trop. 2016;157:30–41.
Moffett A, Shackelford N, Sarkar S. Malaria in Africa: vector species’ niche models and relative risk maps. PLoS ONE. 2007;2:e824.
Kulkarni MA, Desrochers RE, Kerr JT. High resolution niche models of malaria vectors in northern Tanzania: a new capacity to predict malaria risk? PLoS ONE. 2010;5:e9396.
Masuoka P, Klein TA, Kim H-C, Claborn DM, Achee N, Andre R, et al. Modeling the distribution of Culex tritaeniorhynchus to predict Japanese encephalitis distribution in the Republic of Korea. Geospat Health. 2010;5:45.
Medley KA. Niche shifts during the global invasion of the Asian tiger mosquito, Aedes albopictus Skuse (Culicidae), revealed by reciprocal distribution models: niche shifts and global invasion. Glob Ecol Biogeogr. 2010;19:122–33.
Laporta GZ, Ramos DG, Ribeiro MC, Sallum MAM. Habitat suitability of Anopheles vector species and association with human malaria in the Atlantic Forest in south-eastern Brazil. Mem Inst Oswaldo Cruz. 2011;106:239–45.
Fischer D, Thomas SM, Niemitz F, Reineking B, Beierkuhnlein C. Projection of climatic suitability for Aedes albopictus Skuse (Culicidae) in Europe under climate change conditions. Global Planet Change. 2011;78:54–64.
Miller RH, Masuoka P, Klein TA, Kim H-C, Somer T, Grieco J. Ecological niche modeling to estimate the distribution of Japanese encephalitis virus in Asia. PLoS Negl Trop Dis. 2012;6:e1678.
Porretta D, Mastrantonio V, Bellini R, Somboon P, Urbanelli S. Glacial history of a modern invader: phylogeography and species distribution modelling of the Asian tiger mosquito Aedes albopictus. PLoS ONE. 2012;7:e44515.
Fuller DO, Ahumada ML, Quiñones ML, Herrera S, Beier JC. Near-present and future distribution of Anopheles albimanus in Mesoamerica and the Caribbean Basin modeled with climate and topographic data. Int J Health Geogr. 2012;11:13.
Obsomer V, Defourny P, Coosemans M. Predicted distribution of major malaria vectors belonging to the complex in Asia: ecological niche and environmental influences. PLoS ONE. 2012;7:e50475.
Fuller DO, Parenti MS, Hassan AN, Beier JC. Linking land cover and species distribution models to project potential ranges of malaria vectors: an example using Anopheles arabiensis in Sudan and Upper Egypt. Malar J. 2012;11:264.
Rochlin I, Ninivaggi DV, Hutchinson ML, Farajollahi A. Climate change and range expansion of the Asian tiger mosquito (Aedes albopictus) in northeastern USA: implications for public health practitioners. PLoS ONE. 2013;8:e60874.
Sallam MF, Al Ahmed AM, Abdel-Dayem MS, Abdullah MAR. Ecological niche modeling and land cover risk areas for Rift Valley fever vector, Culex tritaeniorhynchus Giles in Jazan, Saudi Arabia. PLoS ONE. 2013;8:e65786.
Gardner L, Sarkar S. A global airport-based risk model for the spread of dengue infection via the air transport network. PLoS ONE. 2013;8:e72129.
Mughini-Gras L, Mulatti P, Severini F, Boccolini D, Romi R, Bongiorno G, et al. Ecological niche modelling of potential West Nile virus vector mosquito species and their geographical association with equine epizootics in Italy. EcoHealth. 2014;11:120–32.
Foley DH, Linton Y-M, Ruiz-Lopez JF, Conn JE, Sallum MAM, Póvoa MM, et al. Geographic distribution, evolution, and disease importance of species within the Neotropical Anopheles albitarsis group (Diptera, Culicidae). J Vector Ecol. 2014;39:168–81.
Cardoso-Leite R, Vilarinho AC, Novaes MC, Tonetto AF, Vilardi GC, Guillermo-Ferreira R. Recent and future environmental suitability to dengue fever in Brazil using species distribution model. Trans R Soc Trop Med Hyg. 2014;108:99–104.
Olave MET, Rojas-Villalobos H, Zesati G, Bravo-Pena L, Alatorre-Cejudo L. Modelo biogeográfico de los mosquitos Culex spp. (Diptera: Culicidae) en México. Bol Geogr. 2015;37:43–58.
Campbell LP, Luther C, Moo-Llanes D, Ramsey JM, Danis-Lozano R, Peterson AT. Climate change influences on global distributions of dengue and chikungunya virus vectors. Phil Trans R Soc B. 2015;370:20140135.
Alahmed AM, Naeem M, Kheir SM, Sallam MF. Ecological distribution modeling of two malaria mosquito vectors using geographical information system in Al-Baha Province, Kingdom of Saudi Arabia. Pak J Zool. 2015;47:1797–806.
Melaun C, Werblow A, Cunze S, Zotzmann S, Koch LK, Mehlhorn H, et al. Modeling of the putative distribution of the arbovirus vector Ochlerotatus japonicus japonicus (Diptera: Culicidae) in Germany. Parasitol Res. 2015;114:1051–61.
Samson DM, Archer RS, Alimi TO, Arheart KL, Impoinvil DE, Oscar R, et al. New baseline environmental assessment of mosquito ecology in northern Haiti during increased urbanization. J Vector Ecol. 2015;40:46–58.
Acheson ES, Plowright AA, Kerr JT. Where have all the mosquito nets gone? Spatial modelling reveals mosquito net distributions across Tanzania do not target optimal Anopheles mosquito habitats. Malar J. 2015;14:322.
Kulkarni MA, Desrochers RE, Kajeguka DC, Kaaya RD, Tomayer A, Kweka EJ, et al. Ten years of environmental change on the slopes of Mount Kilimanjaro and its associated shift in malaria vector distributions. Front Public Health. 2016;4:281.
Cunze S, Kochmann J, Koch LK, Klimpel S. Aedes albopictus and its environmental limits in Europe. PLoS ONE. 2016;11:e0162116.
Samy AM, Elaagip AH, Kenawy MA, Ayres CFJ, Peterson AT, Soliman DE. Climate change influences on the global potential distribution of the mosquito Culex quinquefasciatus, vector of West Nile virus and lymphatic filariasis. PLoS ONE. 2016;11:e0163863.
Mweya CN, Kimera SI, Stanley G, Misinzo G, Mboera LEG. Climate change influences potential distribution of infected Aedes aegypti co-occurrence with dengue epidemics risk areas in Tanzania. PLoS ONE. 2016;11:e0162649.
Sallam MF, Xue R-D, Pereira RM, Koehler PG. Ecological niche modeling of mosquito vectors of West Nile virus in St. John’s County, Florida, USA. Parasit Vectors. 2016;9:371.
Lainhart W, Dutari LC, Rovira JR, Sucupira IMC, Póvoa MM, Conn JE, et al. Epidemic and non-epidemic hot spots of malaria transmission occur in indigenous Comarcas of Panama. PLoS Negl Trop Dis. 2016;10:e0004718.
Ganser C, Gregory AJ, McNew LB, Hunt LA, Sandercock BK, Wisely SM. Fine-scale distribution modeling of avian malaria vectors in north-central Kansas. J Vector Ecol. 2016;41:114–22.
Koch LK, Cunze S, Werblow A, Kochmann J, Dörge DD, Mehlhorn H, et al. Modeling the habitat suitability for the arbovirus vector Aedes albopictus (Diptera: Culicidae) in Germany. Parasitol Res. 2016;115:957–64.
Ren Z, Wang D, Ma A, Hwang J, Bennett A, Sturrock HJW, et al. Predicting malaria vector distribution under climate change scenarios in China: challenges for malaria elimination. Sci Rep. 2016;6:20604.
Fuller DO, Alimi T, Herrera S, Beier JC, Quiñones ML. Spatial association between malaria vector species richness and malaria in Colombia. Acta Trop. 2016;158:197–200.
Naeem M, Alahmed AM, Kheir SM, Sallam MF. Spatial distribution modeling of Stegomyia aegypti and Culex tritaeniorhynchus (Diptera: Culicidae) in Al-bahah Province. Kingdom Saudi Arabia Trop Biomed. 2016;33:295–310.
Espinosa MO, Polop F, Rotela CH, Abril M, Scavuzzo CM. Spatial pattern evolution of Aedes aegypti breeding sites in an Argentinean city without a dengue vector control programme. Geospat Health. 2016;11:471.
Fatima SH, Atif S, Rasheed SB, Zaidi F, Hussain E. Species distribution modelling of Aedes aegypti in two dengue-endemic regions of Pakistan. Trop Med Int Health. 2016;21:427–36.
Espinosa M, Weinberg D, Rotela CH, Polop F, Abril M, Scavuzzo CM. Temporal dynamics and spatial patterns of Aedes aegypti breeding sites, in the context of a dengue control program in Tartagal (Salta Province, Argentina). PLoS Negl Trop Dis. 2016;10:e0004621.
Santos J, Meneses BM. An integrated approach for the assessment of the Aedes aegypti and Aedes albopictus global spatial distribution, and determination of the zones susceptible to the development of Zika virus. Acta Trop. 2017;168:80–90.
Kimera SI, Mweya CN, Mboera LEG. Climate influence on emerging risk areas for Rift Valley fever epidemics in Tanzania. Am J Trop Med Hyg. 2017;97:109–14.
Moua Y, Roux E, Girod R, Dusfour I, De Thoisy B, Seyler F, et al. Distribution of the habitat suitability of the main malaria vector in French Guiana using maximum entropy modeling. J Med Entomol. 2016;54:606.
Baak-Baak CM, Moo-Llanes DA, Cigarroa-Toledo N, Puerto FI, Machain-Williams C, Reyes-Solis G, et al. Ecological niche model for predicting distribution of disease-vector mosquitoes in Yucatán State, México. J Med Entomol. 2017;54:854–61.
Filatov S. Little pigeons can carry great messages: potential distribution and ecology of Uranotaenia (Pseudoficalbia) unguiculata Edwards, 1913 (Diptera: Culicidae), a lesser-known mosquito species from the Western Palaearctic. Parasit Vectors. 2017;10:464.
Johnson TL, Haque U, Monaghan AJ, Eisen L, Hahn MB, Hayden MH, et al. Modeling the environmental suitability for Aedes (Stegomyia) aegypti and Aedes (Stegomyia) albopictus (Diptera: Culicidae) in the contiguous United States. J Med Entomol. 2017;54:1605–14.
Altamiranda-Saavedra M, Arboleda S, Parra JL, Peterson AT, Correa MM. Potential distribution of mosquito vector species in a primary malaria endemic region of Colombia. PLoS ONE. 2017;12:e0179093.
Pakdad K, Hanafi-Bojd AA, Vatandoost H, Sedaghat MM, Raeisi A, Moghaddam AS, et al. Predicting the potential distribution of main malaria vectors Anopheles stephensi, An. culicifacies s.l. and An. fluviatilis s.l. in Iran based on maximum entropy model. Acta Trop. 2017;169:93–9.
Kalan K, Ivović V, Glasnović P, Buzan E. Presence and potential distribution of Aedes albopictus and Aedes japonicus japonicus (Diptera: Culicidae) in Slovenia. J Med Entomol. 2017;54:1510–8.
Alaniz AJ, Bacigalupo A, Cattan PE. Spatial quantification of the world population potentially exposed to Zika virus. Int J Epidemiol. 2017;46:966–75.
Sallam M, Michaels S, Riegel C, Pereira R, Zipperer W, Lockaby B, et al. Spatio-temporal distribution of vector–host contact (VHC) ratios and ecological niche modeling of the West Nile virus mosquito vector, Culex quinquefasciatus, in the city of New Orleans, LA, USA. IJERPH. 2017;14:892.
Obenauer JF, Andrew Joyner T, Harris JB. The importance of human population characteristics in modeling Aedes aegypti distributions and assessing risk of mosquito-borne infectious diseases. Trop Med Health. 2017;45:38.
Alaniz AJ, Bacigalupo A, Cattan PE. Zika: probability of establishment of its vector, Aedes aegypti, in Chile. Rev Chilena Infectol. 2017;34:553–6.
Yañez-Arenas C, Rioja-Nieto R, Martín GA, Dzul-Manzanilla F, Chiappa-Carrara X, Buenfil-Ávila A, et al. Characterizing environmental suitability of Aedes albopictus (Diptera: Culicidae) in Mexico based on regional and global niche models. J Med Entomol. 2018;55:69–77.
Mosomtai G, Evander M, Mundia C, Sandström P, Ahlm C, Hassan OA, et al. Datasets for mapping pastoralist movement patterns and risk zones of Rift Valley fever occurrence. Data Brief. 2018;16:762–70.
Akpan GE, Adepoju KA, Oladosu OR, Adelabu SA. Dominant malaria vector species in Nigeria: modelling potential distribution of Anopheles gambiae sensu lato and its siblings with MaxEnt. PLoS ONE. 2018;13:e0204233.
Richman R, Diallo D, Diallo M, Sall AA, Faye O, Diagne CT, et al. Ecological niche modeling of Aedes mosquito vectors of chikungunya virus in southeastern Senegal. Parasit Vectors. 2018;11:255.
Liu B, Gao X, Ma J, Jiao Z, Xiao J, Wang H. Influence of host and environmental factors on the distribution of the Japanese encephalitis vector Culex tritaeniorhynchus in China. IJERPH. 2018;15:1848.
Kamal M, Kenawy MA, Rady MH, Khaled AS, Samy AM. Mapping the global potential distributions of two arboviral vectors Aedes aegypti and Ae albopictus under changing climate. PLoS ONE. 2018;13:e0210122.
Samy AM, Alkishe AA, Thomas SM, Wang L, Zhang W. Mapping the potential distributions of etiological agent, vectors, and reservoirs of Japanese encephalitis in Asia and Australia. Acta Trop. 2018;188:108–17.
Estallo EL, Sangermano F, Grech M, Ludueña-Almeida F, Frías-Cespedes M, Ainete M, et al. Modelling the distribution of the vector Aedes aegypti in a central Argentine city: modelling Aedes aegypti distribution. Med Vet Entomol. 2018;32:451–61.
Hira FS, Asad A, Farrah Z, Basit RS, Mehreen F, Muhammad K. Patterns of occurrence of dengue and chikungunya, and spatial distribution of mosquito vector Aedes albopictus in Swabi district, Pakistan. Trop Med Int Health. 2018;23:1002–13.
Hanafi-Bojd AA, Sedaghat MM, Vatandoost H, Azari-Hamidian S, Pakdad K. Predicting environmentally suitable areas for Anopheles superpictus Grassi (s.l.), Anopheles maculipennis Meigen (s.l.) and Anopheles sacharovi Favre (Diptera: Culicidae) in Iran. Parasit Vectors. 2018;11:382.
Alaniz AJ, Carvajal MA, Bacigalupo A, Cattan PE. Global spatial assessment of Aedes aegypti and Culex quinquefasciatus: a scenario of Zika virus exposure. Epidemiol Infect. 2019;147:e52.
Wiese D, Escalante AA, Murphy H, Henry KA, Gutierrez-Velez VH. Integrating environmental and neighborhood factors in MaxEnt modeling to predict species distributions: a case study of Aedes albopictus in southeastern Pennsylvania. PLoS ONE. 2019;14:e0223821.
Peach DAH, Almond M, Pol JC. Modeled distributions of Aedes japonicus japonicus and Aedes togoi (Diptera: Culicidae) in the United States, Canada, and northern Latin America. J Vector Ecol. 2019;44:119–29.
Liu B, Gao X, Ma J, Jiao Z, Xiao J, Hayat MA, et al. Modeling the present and future distribution of arbovirus vectors Aedes aegypti and Aedes albopictus under climate change scenarios in mainland China. Sci Total Environ. 2019;664:203–14.
Liu B, Jiao Z, Ma J, Gao X, Xiao J, Hayat MA, et al. Modelling the potential distribution of arbovirus vector Aedes aegypti under current and future climate scenarios in Taiwan. China Pest Manag Sci. 2019;75:3076–83.
Akpan GE, Adepoju KA, Oladosu OR. Potential distribution of dominant malaria vector species in tropical region under climate change scenarios. PLoS ONE. 2019;14:e0218523.
De Almeida MAB, Dos Santos E, Cardoso JDC, Da Silva LG, Rabelo RM, Bicca-Marques JC. Predicting yellow fever through species distribution modeling of virus, vector, and monkeys. EcoHealth. 2019;16:95–108.
Tiffin HS, Peper ST, Wilson-Fallon AN, Haydett KM, Cao G, Presley SM. The influence of new surveillance data on predictive species distribution modeling of Aedes aegypti and Aedes albopictus in the United States. Insects. 2019;10:400.
Chen X, Dimitrov NB, Meyers LA. Uncertainty analysis of species distribution models. PLoS ONE. 2019;14:e0214190.
Hesami N, Abai MR, Vatandoost H, Alizadeh M, Fatemi M, Ramazanpour J, et al. Using ecological niche modeling to predict the spatial distribution of Anopheles maculipennis s.l. and Culex theileri (Diptera: Culicidae) in Central Iran. J Arthropod Borne Dis. 2019;13:165–76.
Cunze S, Kochmann J, Koch LK, Genthner E, Klimpel S. Vector distribution and transmission risk of the Zika virus in South and Central America. PeerJ. 2019;7:e7920.
Gwitira I, Murwira A, Masocha M, Zengeya FM, Shekede MD, Chirenda J, et al. GIS-based stratification of malaria risk zones for Zimbabwe. Geocarto Int. 2019;34:1163–76.
Abrha H, Hagos H, Brhane E, Hadgu M, Mamo G. Spatio-temporal dynamics of malaria expansion under climate change in semi-arid areas of Ethiopia. Environ Hazards. 2019;18:400–13.
Ordoñez-Sierra R, Mastachi-Loza CA, Díaz-Delgado C, Cuervo-Robayo AP, Fonseca Ortiz CR, Gómez-Albores MA, et al. Spatial risk distribution of dengue based on the ecological niche model of Aedes aegypti (Diptera: Culicidae) in the Central Mexican highlands. J Med Entomol. 2020;57:728–37.
Hanafi-Bojd AA, Vatandoost H, Yaghoobi-Ershadi MR. Climate change and the risk of malaria transmission in Iran. J Med Entomol. 2020;57:50–64.
Portilla Cabrera CV, Selvaraj JJ. Geographic shifts in the bioclimatic suitability for Aedes aegypti under climate change scenarios in Colombia. Heliyon. 2020;6:e03101.
Cunze S, Kochmann J, Klimpel S. Global occurrence data improve potential distribution models for Aedes japonicus japonicus in non-native regions. Pest Manag Sci. 2020;76:1814–22.
Peach DAH, Matthews BJ. Modeling the putative ancient distribution of Aedes togoi (Diptera: Culicidae). J Insect Sci. 2020;20:7.
Espinosa-Vélez Y, Altamiranda-Saavedra M, Correa MM. Potential distribution of main malaria vector species in the endemic Colombian Pacific region. Trop Med Int Health. 2020;25:861–73.
Liu B, Gao X, Zheng K, Ma J, Jiao Z, Xiao J, et al. The potential distribution and dynamics of important vectors Culex pipiens pallens and Culex pipiens quinquefasciatus in China under climate change scenarios: an ecological niche modelling approach. Pest Manag Sci. 2020;76:3096–107.
Liu B, Ma J, Jiao Z, Gao X, Xiao J, Wang H. Risk assessment for the Rift Valley fever occurrence in China: special concern in south-west border areas. Transbound Emerg Dis. 2021;68:445–57.
Figueroa DP, Scott S, González CR, Bizama G, Flores-Mara R, Bustamante R, et al. Estimating the climate change consequences on the potential distribution of Culex pipiens L. 1758, to assess the risk of West Nile virus establishment in Chile. Gayana. 2020;84:46–53.
Marshall DS, Butler CJ. Potential distribution of the biocontrol agent Toxorhynchites rutilus by 2070. J Am Mosq Control Assoc. 2020;36:131–8.
Castaño-Quintero S, Escobar-Luján J, Osorio-Olvera L, Peterson AT, Chiappa-Carrara X, Martínez-Meyer E, et al. Supraspecific units in correlative niche modeling improves the prediction of geographic potential of biological invasions. PeerJ. 2020;8:e10454.
Bond JG, Moo-Llanes DA, Ortega-Morales AI, Marina CF, Casas-Martínez M, Danis-Lozano R. Diversity and potential distribution of culicids of medical importance of the Yucatan Peninsula, Mexico. Salud Publica Mexico. 2020;62:379–87.
Shoraka H, Sofizadeh A, Mehravaran A. Larval habitat characteristics and predicting the distribution of Culex tritaeniorhynchus using maximum entropy (MaxEnt) model in Golestan Province (north of Iran). J Vector Borne Dis. 2020;57:259.
Valderrama L, Ayala S, Reyes C, González CR. Modeling the potential distribution of the malaria vector Anopheles (Ano.) pseudopunctipennis Theobald (Diptera: Culicidae) in arid regions of northern Chile. Front Public Health. 2021;9:611152.
Gorris ME, Bartlow AW, Temple SD, Romero-Alvarez D, Shutt DP, Fair JM, et al. Updated distribution maps of predominant Culex mosquitoes across the Americas. Parasit Vectors. 2021;14:547.
Tjaden NB, Cheng Y, Beierkuhnlein C, Thomas SM. Chikungunya beyond the Tropics: where and when do we expect disease transmission in Europe? Viruses. 2021;13:1024.
Moo-Llanes DA, López-Ordóñez T, Torres-Monzón JA, Mosso-González C, Casas-Martínez M, Samy AM. Assessing the potential distributions of the invasive mosquito vector Aedes albopictus and its natural Wolbachia infections in México. Insects. 2021;12:143.
Omar K, Thabet HS, TagEldin RA, Asadu CC, Chukwuekezie OC, Ochu JC, et al. Ecological niche modeling for predicting the potential geographical distribution of Aedes species (Diptera: Culicidae): a case study of Enugu State, Nigeria. Parasit Epidemiol Control. 2021;15:e00225.
Echeverry-Cárdenas E, López-Castañeda C, Carvajal-Castro JD, Aguirre-Obando OA. Potential geographic distribution of the tiger mosquito Aedes albopictus (Skuse, 1894) (Diptera: Culicidae) in current and future conditions for Colombia. PLoS Negl Trop Dis. 2021;15:e0008212.
Outammassine A, Zouhair S, Loqman S. Global potential distribution of three underappreciated arboviruses vectors (Aedes japonicus, Aedes vexans and Aedes vittatus) under current and future climate conditions. Transbound Emerg Dis. 2022;69:e1160–71.
Campbell LP, Burkett-Cadena ND, Miqueli E, Unlu I, Sloyer KE, Medina J, et al. Potential distribution of Aedes (Ochlerotatus) scapularis (Diptera: Culicidae): a vector mosquito new to the Florida peninsula. Insects. 2021;12:213.
Andreo V, Cuervo PF, Porcasi X, Lopez L, Guzman C, Scavuzzo CM. Towards a workflow for operational mapping of Aedes aegypti at urban scale based on remote sensing. Remote Sens Appl Soc Environ. 2021;23:100554.
Hanafi-Bojd AA, Motazakker M, Vatandoost H, Dabiri F, Chavshin AR. Sindbis virus infection of mosquito species in the wetlands of northwestern Iran and modeling the probable ecological niches of SINV vectors in the country. Acta Trop. 2021;220:105952.
Cuervo PF, Artigas P, Mas-Coma S, Bargues MD. West Nile virus in Spain: Forecasting the geographical distribution of risky areas with an ecological niche modelling approach. Transbound Emerg Dis. 2022;69:e1113. https://doi.org/10.1111/tbed.14398.
Outammassine A, Zouhair S, Loqman S. Rift Valley fever and West Nile virus vectors in Morocco: current situation and future anticipated scenarios. Transbound Emerg Dis. 2022;69:1466–78.
Olabimi IO, Ileke KD, Adu BW, Arotolu TE. Potential distribution of the primary malaria vector Anopheles gambiae Giles [Diptera: Culicidae] in southwest Nigeria under current and future climatic conditions. JoBAZ. 2021;82:63.
Calzolari M, Desiato R, Albieri A, Bellavia V, Bertola M, Bonilauri P, et al. Mosquitoes of the maculipennis complex in northern Italy. Sci Rep. 2021;11:6421.
Marques R, Krüger RF, Cunha SK, Silveira AS, Alves DMCC, Rodrigues GD, et al. Climate change impacts on Anopheles (K.) cruzii in urban areas of Atlantic Forest of Brazil: challenges for malaria diseases. Acta Trop. 2021;224:106123.
Moua Y, Kotchi SO, Ludwig A, Brazeau S. Mapping the habitat suitability of West Nile virus vectors in southern Quebec and eastern Ontario, Canada, with species distribution modeling and satellite earth observation data. Remote Sens. 2021;13:1637.
Arnoldi I, Negri A, Soresinetti L, Brambilla M, Carraretto D, Montarsi F, et al. Assessing the distribution of invasive Asian mosquitoes in northern Italy and modelling the potential spread of Aedes koreicus in Europe. Acta Trop. 2022;232:106536.
Souris M, Marcombe S, Laforet J, Brey PT, Corbel V, Overgaard HJ. Modeling spatial variation in risk of presence and insecticide resistance for malaria vectors in Laos. PLoS ONE. 2017;12:e0177274.
Wieser A, Reuss F, Niamir A, Müller R, O’Hara RB, Pfenninger M. Modelling seasonal dynamics, population stability, and pest control in Aedes japonicus japonicus (Diptera: Culicidae). Parasit Vectors. 2019;12:142.
Pasquali S, Mariani L, Calvitti M, Moretti R, Ponti L, Chiari M, et al. Development and calibration of a model for the potential establishment and impact of Aedes albopictus in Europe. Acta Trop. 2020;202:105228.
Foley DH, Rueda LM, Peterson AT, Wilkerson RC. Potential distribution of two species in the medically important Anopheles minimus complex (Diptera: Culicidae). J Med Entomol. 2008;45:852–60.
Foley DH, Klein TA, Kim HC, Sames WJ, Wilkerson RC, Rueda LM. Geographic distribution and ecology of potential malaria vectors in the Republic of Korea. J Med Entomol. 2009;46:680–92.
Capinha C, Gomes E, Reis E, Rocha J, Sousa CA, Do Rosário VE, et al. Present habitat suitability for Anopheles atroparvus (Diptera, Culicidae) and its coincidence with former malaria areas in mainland Portugal. Geospat Health. 2009;3:177.
Larson SR, DeGroote JP, Bartholomay LC, Sugumaran R. Ecological niche modeling of potential West Nile virus vector mosquito species in Iowa. J Insect Sci. 2010;10:1–17.
Khatchikian C, Sangermano F, Kendell D, Livdahl T. Evaluation of species distribution model algorithms for fine-scale container-breeding mosquito risk prediction. Med Vet Entomol. 2011;25:268–75.
Arboleda S, Jaramillo-O N, Peterson AT. Spatial and temporal dynamics of Aedes aegypti larval sites in Bello, Colombia. J Vector Ecol. 2012;37:37–48.
Senay SD, Worner SP, Ikeda T. Novel three-step pseudo-absence selection technique for improved species distribution modelling. PLoS ONE. 2013;8:e71218.
Hill MP, Axford JK, Hoffmann AA. Predicting the spread of Aedes albopictus in Australia under current and future climates: multiple approaches and datasets to incorporate potential evolutionary divergence: invasion potential of A. albopictus in Australia. Austral Ecol. 2014;39:469–78.
Conley AK, Fuller DO, Haddad N, Hassan AN, Gad AM, Beier JC. Modeling the distribution of the West Nile and Rift Valley fever vector Culex pipiens in arid and semi-arid regions of the Middle East and North Africa. Parasit Vectors. 2014;7:289.
Golding N, Nunn MA, Purse BV. Identifying biotic interactions which drive the spatial distribution of a mosquito community. Parasit Vectors. 2015;8:367.
Laporta GZ, Linton Y-M, Wilkerson RC, Bergo ES, Nagaki SS, SantAna DC, et al. Malaria vectors in South America: current and future scenarios. Parasit Vectors. 2015;8:426.
Cianci D, Hartemink N, Ibáñez-Justicia A. Modelling the potential spatial distribution of mosquito species using three different techniques. Int J Health Geogr. 2015;14:10.
Cunze S, Koch LK, Kochmann J, Klimpel S. Aedes albopictus and Aedes japonicus—two invasive mosquito species with different temperature niches in Europe. Parasit Vectors. 2016;9:573.
Carlson CJ, Dougherty ER, Getz W. An ecological assessment of the pandemic threat of Zika virus. PLoS Negl Trop Dis. 2016;10:e0004968.
Marcantonio M, Metz M, Baldacchino F, Arnoldi D, Montarsi F, Capelli G, et al. First assessment of potential distribution and dispersal capacity of the emerging invasive mosquito Aedes koreicus in northeast Italy. Parasit Vectors. 2016;9:63.
Padilla O, Rosas P, Moreno W, Toulkeridis T. Modeling of the ecological niches of the Anopheles spp. in Ecuador by the use of geo-informatic tools. Spatial Spatio-temporal Epidemiol. 2017;21:1–11.
Thomas S, Tjaden N, Frank C, Jaeschke A, Zipfel L, Wagner-Wiening C, et al. Areas with high hazard potential for autochthonous transmission of Aedes albopictus-associated arboviruses in Germany. IJERPH. 2018;15:1270.
Dickens BL, Sun H, Jit M, Cook AR, Carrasco LR. Determining environmental and anthropogenic factors which explain the global distribution of Aedes aegypti and Ae. albopictus. BMJ Glob Health. 2018;3:e000801.
Ding F, Fu J, Jiang D, Hao M, Lin G. Mapping the spatial distribution of Aedes aegypti and Aedes albopictus. Acta Trop. 2018;178:155–62.
Früh L, Kampen H, Kerkow A, Schaub GA, Walther D, Wieland R. Modelling the potential distribution of an invasive mosquito species: comparative evaluation of four machine learning methods and their combinations. Ecol Model. 2018;388:136–44.
Sherpa S, Guéguen M, Renaud J, Blum MGB, Gaude T, Laporte F, et al. Predicting the success of an invader: niche shift versus niche conservatism. Ecol Evol. 2019;9:12658–75.
Uusitalo R, Siljander M, Culverwell CL, Mutai NC, Forbes KM, Vapalahti O, et al. Predictive mapping of mosquito distribution based on environmental and anthropogenic factors in Taita Hills, Kenya. Int J Appl Earth Obs Geoinf. 2019;76:84–92.
Ibáñez-Justicia A, Alcaraz-Hernández JD, Van Lammeren R, Koenraadt CJM, Bergsma A, Delucchi L, et al. Habitat suitability modelling to assess the introductions of Aedes albopictus (Diptera: Culicidae) in the Netherlands. Parasit Vectors. 2020;13:217.
Sherpa S, Renaud J, Guéguen M, Besnard G, Mouyon L, Rey D, et al. Landscape does matter: disentangling founder effects from natural and human-aided post-introduction dispersal during an ongoing biological invasion. J Anim Ecol. 2020;89:2027–42.
Sinka ME, Pironon S, Massey NC, Longbottom J, Hemingway J, Moyes CL, et al. A new malaria vector in Africa: predicting the expansion range of Anopheles stephensi and identifying the urban populations at risk. Proc Natl Acad Sci USA. 2020;117:24900–8.
Sintayehu DW, Tassie N, De Boer WF. Present and future climatic suitability for dengue fever in Africa. Infect Ecol Epidemiol. 2020;10:1782042.
Rhodes CG, Loaiza JR, Romero LM, Gutiérrez Alvarado JM, Delgado G, Rojas Salas O, et al. Anopheles albimanus (Diptera: Culicidae) ensemble distribution modeling: applications for malaria elimination. Insects. 2022;13:221.
Srivastava A, Nagpal B, Saxena R, Subbarao S. Predictive habitat modelling for forest malaria vector species An. dirus in India—a GIS-based approach. Curr Sci. 2001;80:1129–34.
Kearney M, Porter WP, Williams C, Ritchie S, Hoffmann AA. Integrating biophysical models and evolutionary theory to predict climatic impacts on species’ ranges: the dengue mosquito Aedes aegypti in Australia. Funct Ecol. 2009;23:528–38.
Schäfer ML, Lundström JO. The present distribution and predicted geographic expansion of the floodwater mosquito Aedes sticticus in Sweden. J Vector Ecol. 2009;34:141–7.
Caminade C, Medlock JM, Ducheyne E, McIntyre KM, Leach S, Baylis M, et al. Suitability of European climate for the Asian tiger mosquito Aedes albopictus: recent trends and future scenarios. J R Soc Interface. 2012;9:2708–17.
Drake JM, Beier JC. Ecological niche and potential distribution of Anopheles arabiensis in Africa in 2050. Malar J. 2014;13:213.
Capinha C, Rocha J, Sousa CA. Macroclimate determines the global range limit of Aedes aegypti. EcoHealth. 2014;11:420–8.
Equihua M, Ibáñez-Bernal S, Benítez G, Estrada-Contreras I, Sandoval-Ruiz CA, Mendoza-Palmero FS. Establishment of Aedes aegypti (L.) in mountainous regions in Mexico: increasing number of populations at risk of mosquito-borne disease and future climate conditions. Acta Trop. 2017;166:316–27.
Zheng X, Zhong D, He Y, Zhou G. Seasonality modeling of the distribution of Aedes albopictus in China based on climatic and environmental suitability. Infect Dis Poverty. 2019;8:98.
Kerkow A, Wieland R, Koban MB, Hölker F, Jeschke JM, Werner D, et al. What makes the Asian bush mosquito Aedes japonicus japonicus feel comfortable in Germany? A fuzzy modelling approach. Parasit Vectors. 2019;12:106.
Gangoso L, Aragonés D, Martínez-de La Puente J, Lucientes J, Delacour-Estrella S, Estrada Peña R, et al. Determinants of the current and future distribution of the West Nile virus mosquito vector Culex pipiens in Spain. Environ Res. 2020;188:109837.
Bayoh MN, Thomas CJ, Lindsay SW. Mapping distributions of chromosomal forms of Anopheles gambiae in West Africa using climate data: climatic mapping of Anopheles gambiae chromosomal forms. Med Vet Entomol. 2001;15:267–74.
Kuhn KG, Campbell-Lendrum DH, Davies CR. A continental risk map for malaria mosquito (Diptera: Culicidae) vectors in Europe. J Med Entomol. 2002;39:621–30.
Diuk-Wasser MA, Brown HE, Andreadis TG, Fish D. Modeling the spatial distribution of mosquito vectors for West Nile virus in Connecticut, USA. Vector-Borne Zoonotic Dis. 2006;6:283–95.
Tran A, Ponçon N, Toty C, Linard C, Guis H, Ferré J-B, et al. Using remote sensing to map larval and adult populations of Anopheles hyrcanus (Diptera: Culicidae) a potential malaria vector in southern France. Int J Health Geogr. 2008;7:9.
Cardo MV, Vezzani D, Carbajo AE. Environmental predictors of the occurrence of ground water mosquito immatures in the Paraná Lower Delta. Argentina J Med Entomol. 2011;48:991–8.
Cailly P, Balenghien T, Ezanno P, Fontenille D, Toty C, Tran A. Role of the repartition of wetland breeding sites on the spatial distribution of Anopheles and Culex, human disease vectors in southern France. Parasit Vectors. 2011;4:65.
Hongoh V, Berrang-Ford L, Scott ME, Lindsay LR. Expanding geographical distribution of the mosquito, Culex pipiens, in Canada under climate change. Appl Geogr. 2012;33:53–62.
Moiroux N, Bio-Bangana AS, Djènontin A, Chandre F, Corbel V, Guis H. Modelling the risk of being bitten by malaria vectors in a vector control area in southern Benin, West Africa. Parasit Vectors. 2013;6:71.
Cardo MV, Vezzani D, Rubio A, Carbajo AE. Integrating demographic and meteorological data in urban ecology: a case study of container-breeding mosquitoes in temperate Argentina: integrating demographic and meteorological data in urban ecology. Area. 2014;46:18–26.
TeneFossog B, Ayala D, Acevedo P, Kengne P, NgomoAbesoMebuy I, Makanga B, et al. Habitat segregation and ecological character displacement in cryptic African malaria mosquitoes. Evol Appl. 2015;8:326–45.
Roiz D, Ruiz S, Soriguer R, Figuerola J. Landscape effects on the presence, abundance and diversity of mosquitoes in Mediterranean wetlands. PLoS ONE. 2015;10:e0128112.
Cianci D, Hartemink N, Zeimes CB, Vanwambeke SO, Ienco A, Caputo B. High resolution spatial analysis of habitat preference of Aedes albopictus (Diptera: Culicidae) in an urban environment. J Med Entomol. 2015;52:329–35.
Adde A, Dusfour I, Roux E, Girod R, Briolant S. Anopheles fauna of coastal Cayenne, French Guiana: modelling and mapping of species presence using remotely sensed land cover data. Mem Inst Oswaldo Cruz. 2016;111:750–6.
Heersink DK, Meyers J, Caley P, Barnett G, Trewin B, Hurst T, et al. Statistical modeling of a larval mosquito population distribution and abundance in residential Brisbane. J Pest Sci. 2016;89:267–79.
Baldacchino F, Marcantonio M, Manica M, Marini G, Zorer R, Delucchi L, et al. Mapping of Aedes albopictus abundance at a local scale in Italy. Remote Sensing. 2017;9:749.
Tisseuil C, Velo E, Bino S, Kadriaj P, Mersini K, Shukullari A, et al. Forecasting the spatial and seasonal dynamic of Aedes albopictus oviposition activity in Albania and Balkan countries. PLoS Negl Trop Dis. 2018;12:e0006236.
Amadi JA, Ong’amo GO, Olago DO, Oriaso SO, Nyamongo IK, Estambale BBA. Mapping potential Anopheles gambiae s.l. larval distribution using remotely sensed climatic and environmental variables in Baringo, Kenya: mapping malaria vectors distribution. Med Vet Entomol. 2018;32:417–26.
Romero D, Olivero J, Real R, Guerrero JC. Applying fuzzy logic to assess the biogeographical risk of dengue in South America. Parasit Vectors. 2019;12:428.
Ibañez-Justicia A, Cianci D. Modelling the spatial distribution of the nuisance mosquito species Anopheles plumbeus (Diptera: Culicidae) in the Netherlands. Parasit Vectors. 2015;8:258.
Wieland R, Kerkow A, Früh L, Kampen H, Walther D. Automated feature selection for a machine learning approach toward modeling a mosquito distribution. Ecol Model. 2017;352:108–12.
Kerkow A, Wieland R, Früh L, Hölker F, Jeschke JM, Werner D, et al. Can data from native mosquitoes support determining invasive species habitats? Modelling the climatic niche of Aedes japonicus japonicus (Diptera, Culicidae) in Germany. Parasitol Res. 2020;119:31–42.
Nurjanah S, et al. Distribution modelling of Aedes aegypti in three dengue-endemic areas in Sumatera, Indonesia. Trop Biomed. 2022;39:373–83.
Hussain SSA, Dhiman RC. Distribution expansion of dengue vectors and climate change in India. GeoHealth. 2022;6:e2021GH000477. https://doi.org/10.1029/2021GH000477.
Adeleke ED, Shittu RA, Beierkuhnlein C, Thomas SM. High wind speed prevents the establishment of the disease vector mosquito Aedes albopictus in its climatic niche in Europe. Front Environ Sci. 2022;10:846243.
Liu X, Song C, Ren Z, Wang S. Predicting the geographical eistribution of malaria-associated Anopheles dirus in the South-East Asia and Western Pacific regions under climate change scenarios. Front Environ Sci. 2022;10:841966.
Holeva-Eklund WM, Young SJ, Will J, Busser N, Townsend J, Hepp CM. Species distribution modeling of Aedes aegypti in Maricopa County, Arizona from 2014 to 2020. Front Environ Sci. 2022;10:1001190.
Santos JM, Capinha C, Rocha J, Sousa CA. The current and future distribution of the yellow fever mosquito (Aedes aegypti) on Madeira Island. PLoS Negl Trop Dis. 2022;16:e0010715.
Furlong M, Adamu A, Hickson R, Horwood P, Golchin M, Hoskins A, et al. Estimating the distribution of Japanese encephalitis vectors in Australia using ecological niche modelling. TropicalMed. 2022;7:393.
Amdouni J, Conte A, Ippoliti C, Candeloro L, Tora S, Sghaier S, et al. Culex pipiens distribution in Tunisia: identification of suitable areas through random forest and MaxEnt approaches. Vet Med Sci. 2022;8:2703–15.
Acknowledgements
We would like to thank members of the Quantitative Disease Ecology and Conservation (QDEC) Lab for conversations and company while creating and revising this paper.
Funding
CAL and SJR were supported by CIBR: VectorByte: a Global Informatics Platform for studying the Ecology of Vector-Borne Diseases [Division of Biological Infrastructure, National Science Foundation (NSF) 2016265]. SJR and CJC were additionally supported by funding to the Viral Emergence Research Initiative (Verena; viralemergence.org), including NSF BII 2021909 and NSF BII 2213854.
Author information
Authors and Affiliations
Contributions
Conceptualization: CAL, SJM, and SJR. Analysis: CAL, SJM, RS, MF, AC, and GH. Visualizations: CAL, CJC, and SJR. First draft: CAL, SJM, SJR, and RS. Final draft and reviewing: all authors.
Corresponding authors
Ethics declarations
Ethics approval and consent to participate
Not applicable.
Consent for publication
Not applicable.
Competing interests
The authors declare that they have no competing interests.
Additional information
Publisher's Note
Springer Nature remains neutral with regard to jurisdictional claims in published maps and institutional affiliations.
Rights and permissions
Open Access This article is licensed under a Creative Commons Attribution 4.0 International License, which permits use, sharing, adaptation, distribution and reproduction in any medium or format, as long as you give appropriate credit to the original author(s) and the source, provide a link to the Creative Commons licence, and indicate if changes were made. The images or other third party material in this article are included in the article's Creative Commons licence, unless indicated otherwise in a credit line to the material. If material is not included in the article's Creative Commons licence and your intended use is not permitted by statutory regulation or exceeds the permitted use, you will need to obtain permission directly from the copyright holder. To view a copy of this licence, visit http://creativecommons.org/licenses/by/4.0/. The Creative Commons Public Domain Dedication waiver (http://creativecommons.org/publicdomain/zero/1.0/) applies to the data made available in this article, unless otherwise stated in a credit line to the data.
About this article

Cite this article
Lippi, C.A., Mundis, S.J., Sippy, R. et al. Trends in mosquito species distribution modeling: insights for vector surveillance and disease control. Parasites Vectors 16, 302 (2023). https://doi.org/10.1186/s13071-023-05912-z
Received:
Accepted:
Published:
DOI: https://doi.org/10.1186/s13071-023-05912-z