
Abstract
Background
Randomised controlled trials (RCTs) aim to estimate the causal effect of one or more interventions relative to a control. One type of outcome that can be of interest in an RCT is an ordinal outcome, which is useful to answer clinical questions regarding complex and evolving patient states. The target parameter of interest for an ordinal outcome depends on the research question and the assumptions the analyst is willing to make. This review aimed to provide an overview of how ordinal outcomes have been used and analysed in RCTs.
Methods
The review included RCTs with an ordinal primary or secondary outcome published between 2017 and 2022 in four highly ranked medical journals (the British Medical Journal, New England Journal of Medicine, The Lancet, and the Journal of the American Medical Association) identified through PubMed. Details regarding the study setting, design, the target parameter, and statistical methods used to analyse the ordinal outcome were extracted.
Results
The search identified 309 studies, of which 144 were eligible for inclusion. The most used target parameter was an odds ratio, reported in 78 (54%) studies. The ordinal outcome was dichotomised for analysis in 47 (\(33\%\)) studies, and the most common statistical model used to analyse the ordinal outcome on the full ordinal scale was the proportional odds model (64 [\(44\%\)] studies). Notably, 86 (60%) studies did not explicitly check or describe the robustness of the assumptions for the statistical method(s) used.
Conclusions
The results of this review indicate that in RCTs that use an ordinal outcome, there is variation in the target parameter and the analytical approaches used, with many dichotomising the ordinal outcome. Few studies provided assurance regarding the appropriateness of the assumptions and methods used to analyse the ordinal outcome. More guidance is needed to improve the transparent reporting of the analysis of ordinal outcomes in future trials.
Background
Randomised controlled trials (RCTs) aim to estimate the causal effect of one or more interventions relative to a control or reference intervention. Ordinal outcomes are useful in RCTs because the categories can represent multiple patient states within a single endpoint. The definition of an ordinal outcome is one that comprises monotonically ranked categories that are ordered hierarchically such that the distance between any two categories is not necessarily equal (or even meaningfully quantifiable) [1]. Ordinal outcomes should have categories that are mutually exclusive and unambiguously defined and can be used to capture improvement and deterioration relative to a baseline value where relevant [2]. If an ordinal scale is being used to capture change in patient status, then the ordinal outcome should also be symmetric to avoid favouring a better or worse health outcome [2]. Commonly used ordinal outcomes in RCTs include the modified-Rankin scale, a 7-category measure of disability following stroke or neurological insult [3,4,5,6], the Glasgow Outcome Scale-Extended (GOS-E), an 8-category measure of functional impairment post traumatic brain injury [7], and the World Health Organization (WHO) COVID-19 Clinical Progression Scale [8], an 11-point measure of disease severity among patients with COVID-19. The WHO Clinical Progression Scale, developed specifically for COVID-19 in 2020 [8], has been used in many RCTs evaluating COVID-19 disease severity and progression [9, 10] and has helped to increase the familiarity of ordinal data and modelling approaches for ordinal outcomes for clinicians and statisticians alike [11].
Randomised controlled trials that use ordinal outcomes need to be designed and analysed with care. This includes the need to explicitly define the target parameter to compare the intervention groups (i.e. the target of estimation, for example, a proportional odds ratio (OR)), the analysis approach, and whether assumptions used in the analysis are valid. Although this is true for all RCTs, these issues are more complex when using an ordinal outcome compared to a binary or continuous outcome. For example, the choice of target parameter for an ordinal outcome depends on both the research question [12, 13] and the assumptions that the analyst is willing to make about the data.
One option is to preserve the ordinal nature of the outcome, which can give rise to a number of different target parameters. Principled analysis of ordinal data often relies on less familiar statistical methods and underlying assumptions. Many statistical methods have been proposed to analyse ordinal outcomes. One approach to estimate the effect of treatment on the distribution of ordinal endpoints is to use a cumulative logistic model [14, 15]. This model uses the distribution of the cumulative log-odds of the ordinal outcome to estimate a set of ORs [16], which, for an increase in the value of a covariate, represents the odds of being in the same or higher category at each level of the ordinal scale [15]. Modelling is vastly simplified by assuming that each covariate in the model exerts the same effect on the cumulative log odds for each binary split of the ordinal outcome, regardless of the threshold. This is known as the proportional odds (PO) assumption, with the model referred to as ordered logistic regression or the PO model (we refer to the latter term herein). The PO model has desirable properties of palindromic invariance (where the estimates of the parameters are not equivalent when the order of the categories are reversed) and invariance under collapsibility (where the estimated target parameter is changed when categories of the response are combined or removed) [17]. Studies have shown that an ordinal analysis of the outcome using a PO model increases the statistical power relative to an analysis of the dichotomised scale [18, 19]. The target parameter from this model, the proportional or common OR, also has a relatively intuitive interpretation [20, 21], representing a shift in the distribution of ordinal scale scores toward a better outcome in an intervention group compared to a reference group.
The PO model approach makes the assumption that the odds are proportional for each binary split of the ordinal outcome. If this assumption is violated then the proportional OR may be misleading in certain circumstances. Specifically, violation to PO can affect type I or II errors and/or may distort the magnitude of the treatment effect. For example, violation of proportional odds can increase the likelihood of making a type I error since the model may incorrectly identify evidence of a relationship between the treatment and outcome. Violation of the proportional odds assumption may also increase the likelihood of a type II error as the model may fail to identify a relationship between the treatment and the ordinal outcome because the model may fail to capture the true complexity of the relationship. In addition, a treatment may exert a harmful effect for some categories of the ordinal outcome but exert a beneficial effect for the remaining categories, which can ‘average’ out to no treatment effect when assuming a constant OR across the levels of the ordinal scale. The violation of PO may be harmful if the interest is also to estimate predicted probabilities for the categories of the ordinal scale, which will be too low or high for some outcomes when PO is assumed. Although the PO assumption will ‘average’ the treatment effect across the categories of the ordinal outcome, this may not be a problem if all of the treatment effects for each cut-point are in the same direction and the research aim is to simply show whether the treatment is effective even in the presence of non-PO. If the PO assumption is meaningfully violated and the interest is either in the treatment effect on a specific range of the outcome or to obtain predicted probabilities for each category of the scale, the PO model can be extended to a partial proportional odds (PPO) model which allows the PO assumption to be relaxed for a specific set or for all covariates in the model [22]. There are two types of PPO models: the unconstrained PPO model, in which the cumulative log-ORs across each cut-point vary freely across some or all of the cut-points [23], and the constrained PPO model, which assumes some functional relationship between the cumulative log-ORs [21]. However, such an approach may be more inefficient than using a PO model [24, 25].
Alternative statistical methods that can be used to analyse the ordinal outcome include multinomial regression, which estimates an OR for each category of the ordinal outcome relative to the baseline category. The disadvantage of multinomial regression is that the number of ORs requiring estimation increases with the number of categories in the ordinal outcome. A larger sample size may therefore be required to ensure accurate precision of the many target parameters. Other methods are the continuation ratio model or adjacent-category logistic model, though these models lack two desirable properties: palindromic invariance and invariance under collapsibility [15, 17, 26].
Another option is to use alternative methods, such as the Mann-Whitney U test or Wilcoxon rank-sum test [27] (referred to as the Wilcoxon test herein). The Wilcoxon test is equivalent to the PO model with a single binary exposure variable [15, 28]. The treatment effect from a Wilcoxon test is the concordance probability that represents the probability that a randomly chosen observation from a treatment group is greater than a randomly chosen observation from a control group [29, 30]. This parameter closely mirrors the OR derived from the PO model. Importantly, the direction of the OR from the PO model always agrees with the direction of the concordance probability. The disadvantages of the Wilcoxon test are that the concordance probability may be unfamiliar to clinicians, and the Wilcoxon test cannot be adjusted for covariates.
Another option is to dichotomise the ordinal outcome and use an OR or risk difference as the target parameter, estimated using logistic or binomial regression. This produces an effect estimate with clear clinical interpretations that may be suitable for specific clinical settings. The disadvantage of dichotomising an ordinal outcome is that it means discarding potentially useful information within the levels of the scale. This means that the trial may require a larger sample size to maintain the same level of statistical power to detect a clinically important treatment effect [19], which may not be feasible in all RCTs depending on cost constraints or the rate of recruitment. The decision to dichotomise may also depend on when the outcome is being measured. This was highlighted in a study that showed that an ordinal analysis of the modified-Rankin scale captured differences in long-term outcomes in survivors of stroke better than an analysis that dichotomised the ordinal outcome [3, 31].
An alternative to dichotomisation is to treat the ordinal outcome as continuous and focus on the mean difference as the target parameter. This choice to treat the outcome as continuous may be based on the number of categories, where the more categories, the more the outcome resembles a continuum if proximate categories measure similar states or if the scale reflects a latent continuous variable. This has the advantage that modelling is straightforward and familiar, but it can lead to ill-defined clinical interpretations of the treatment effect since the difference between proximate categories is unequal nor quantifiable. Such an analysis also wrongly assumes that the outcome has an unbounded range.
Rationale
There has been commentary [32] and research conducted on the methodology of using ordinal outcomes in certain RCT settings that have mainly focused on the benefit of an ordinal analysis using a PO model [19, 33,34,35], including investigations into the use of a PPO model when the PO assumption is violated [36]. However, these studies have primarily focused on a limited number of statistical methods and in mostly specific medical areas such as neurology and may not be applicable more generally. Given the growing use of ordinal outcomes in RCTs, it is crucial to gain a deeper understanding of how ordinal outcomes are utilised in practice. This understanding will help identify any issues in the use of ordinal outcomes in RCTs and facilitate discussions on improving the reporting and analysis of such outcomes. To address this, we conducted a scoping review to systematically examine the use and analysis of ordinal outcomes in the current literature. Specifically, we aimed to:
-
Identify which target parameters are of interest in RCTs that use an ordinal outcome and whether these are explicitly defined.
-
Describe how ordinal outcomes are analysed in RCTs to estimate a treatment effect.
-
Describe whether RCTs that use an ordinal outcome adequately report key methodological aspects specific to the analysis of the ordinal outcome.
Methods
Protocol
A pre-specified protocol was developed for this scoping review [37]. Deviations from the protocol are outlined in Additional file 1. Here, we provide an overview of the protocol and present the findings from the review which have been reported using the Preferred Reporting Items for Systematic Reviews and Meta-Analyses extension for Scoping Reviews (PRISMA-ScR) checklist [38].
Eligibility criteria
Studies were included in the review if they were published in one of four highly ranked medical journals (British Medical Journal (BMJ), New England Journal of Medical (NEJM), Journal of the American Medical Association (JAMA), or The Lancet) between 1 January 2017 and 31 July 2022 and reported the results of at least one RCT (e.g. if reporting results from multiple trials) with either a primary or secondary outcome that was measured on an ordinal scale. These journals were chosen because they are leading medical journals that publish original and peer-reviewed research with primarily clinical aims and have been used in other reviews of trial methodology [39, 40]. RCTs were defined using the Cochrane definition of an RCT, which is a study that prospectively assigns individuals to one of two (or more) interventions using some random or quasi-random method of allocation [41].
Studies were excluded from this review if they were written in a language other than English, since we did not have sufficient resources to translate studies written in another language. We also excluded studies which were purely methodological, where the abstract or full-text was not available, which reported data from non-human subjects, and those that provided a commentary, review opinion, or were description only. Manuscripts that reported only a trial protocol or statistical analysis plan were also excluded, since one of the main objectives of this review was to determine which statistical methods are being used to analyse trial data. Studies that used ordinal outcomes that were measured on a numerical rating or visual analogue scale were also excluded. Although these scales are often considered ordinal, they imply equidistance between contiguous categories, and can conceivably be analysed as continuous data.
Information sources
Studies were identified and included in the review by searching the online bibliographic database, PubMed, executed on 3 August, 2022.
Search strategy
The search strategy for this review was developed by CJS in consultation with KJL and RKM. The search strategy employed terms that have been developed to identify RCTs [41] and terms that have been used to describe an ordinal outcome in published manuscripts for RCTs. The complete search strategy that was used in this review is described in Table 1.
Selection of sources of evidence
There was no pre-specified sample size for this review. All eligible studies that were identified via the search strategy were included in the review.
Piloting of the eligibility criteria was conducted by CJS and RKM who independently assessed the titles and abstracts of 20 studies to ensure consistency between reviewers. CJS then performed the search on the PubMed database. All titles and abstracts identified were extracted into Covidence, a web-based tool for managing systematic reviews [42]. A two-phase screening process was employed, where all abstracts and titles were screened by CJS in the first phase. Those studies that were not excluded were then moved to the second phase of the screening process, where the full text was evaluated against the eligibility criteria by CJS. A random sample of 40 studies were also assessed for eligibility by a second reviewer (one of KJL, RKM, BJM, or CLW). All studies that were deemed eligible were included in the data extraction.
Data extraction
A data extraction questionnaire was developed in Covidence [42] and piloted by CJS and RKM using a sample of 10 studies, which was further refined. The final version of the questionnaire is shown in Additional file 2, and a full list of the data extraction items is provided in Table 2. Data was extracted from both the main manuscript and any supplementary material, including statistical analysis plans. CJS extracted data from all eligible studies in the review. Double data extraction was performed by KJL and RKM on a random sample of 20 studies. Any uncertainties in the screening and data extraction process were discussed and resolved by consensus among all reviewers. Simplifications and assumptions that were made for eligibility and data extraction are outlined in Additional file 1.
Synthesis of results
The data extracted from Covidence were cleaned and analysed using Stata [43]. Descriptive statistics were used to summarise the data. Frequencies and percentages and medians and interquartile ranges (IQRs) were reported for categorical and continuous variables respectively. Qualitative data were synthesised in a narrative format.
Results
Results of the search
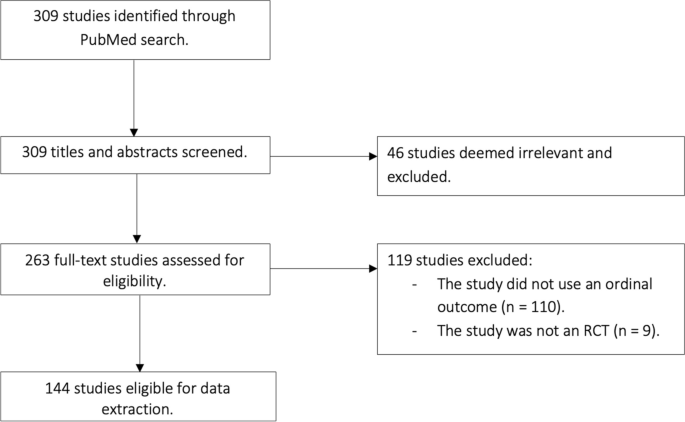
The initial search identified 309 studies, of which 46 were excluded for not being an RCT. There were 263 studies that underwent full text review. Of these, 119 were excluded: 110 because they did not have an ordinal outcome, and nine because they were not an RCT. In total, 144 studies were eligible for data extraction [44,45,46,47,48,49,50,51,52,53,54,55,56,57,58,59,60,61,62,63,64,65,66,67,68,69,70,71,72,73,74,75,76,77,78,79,80,81,82,83,84,85,86,87,88,89,90,91,92,93,94,95,96,97,98,99,100,101,102,103,104,105,106,107,108,109,110,111,112,113,114,115,116,117,118,119,120,121,122,123,124,125,126,127,128,129,130,131,132,133,134,135,136,137,138,139,140,141,142,143,144,145,146,147,148,149,150,151,152,153,154,155,156,157,158,159,160,161,162,163,164,165,166,167,168,169,170,171,172,173,174,175,176,177,178,179,180,181,182,183,184,185,186,187]. A flow diagram of the study selection is shown in Fig. 1. The questionnaire that was used to extract the data from each study is provided in Additional file 2.
Flow diagram of the study
Study characteristics
A summary of the study characteristics is presented in Table 3. The highest proportion of studies were published in the NEJM (61 studies, \(42\%\)), followed by JAMA (40, 28%) and The Lancet (34, 24%), with only nine studies published in the BMJ (\(6\%\)). The number of studies that used an ordinal outcome were higher in 2020 and 2021 (\(30, 21\%\) in each year) compared to earlier years (\(21, 15\%\) in 2019, \(24, 17\%\) in 2018 and \(23, 16\%\) in 2017). Nearly all studies were conducted in a clinical setting (\(141, 98\%\)). The most common medical condition being studied was stroke (\(39, 28\%\)), followed by COVID-19 (\(22, 16\%\)) and atopic dermatitis (\(6, 4\%\)). The most common medical field was neurology (\(54, 38\%\)) followed by infectious diseases (\(22, 16\%\), all of which were COVID-19 studies), dermatology (\(13, 9\%\)), and psychiatry (\(12, 9\%\)). Studies were mostly funded by public sources (\(104, 72\%\)). The median number of participants in the primary analysis of the ordinal outcome was 380 (interquartile range (IQR): 202–803).
Of the 144 included studies, 58 (40%) used some form of adaptive design, with 47 (\(33\%\)) having explicitly defined early stopping rules for efficacy or futility, 18 (\(13\%\)) used sample size re-estimation, three (\(2\%\)) used response adaptive randomisation, three (\(2\%\)) used covariate adaptive randomisation, three (\(2\%\)) were platform trials, and three (\(2\%\)) used adaptive enrichment that focused on specific subgroups of patients.
Ordinal outcomes and target parameters
A summary of the properties of the ordinal outcomes used in the studies is shown in Table 4. An ordinal scale was used as a primary outcome in 59 (\(41\%\)) of studies. Most studies used an ordinal scale to describe an outcome at a single point in time (\(128, 89\%\)), with 16 studies using an ordinal outcome to capture changes over time (\(11\%\)). One study used a Likert scale where the categories were ambiguously defined in the manuscript. Another study used an ordinal outcome to measure change over time, but it was asymmetric and biased towards a favourable outcome. The median number of categories in the ordinal outcome was 7 (IQR: 6–7) and ranged from 3 to 23 categories.
There were 32 studies that determined the sample size in advance based on the ordinal outcome, of which 26 out of 32 studies (\(81\%\)) used an analytical approach and 6 out of 32 studies (\(19\%\)) used simulation to estimate the sample size. Among those studies that used an analytical approach, five studies reported to have used the Whitehead method and three studies reported to have used a t-test. Among the remaining studies that used an analytical approach, it was unclear which specific method was used to compute the sample size.
The ordinal outcome was dichotomised for analysis in 47 (\(33\%\)) studies. Some justifications for the dichotomisation of the ordinal outcome included that it represented a clinically meaningful effect and/or that it was common in the analysis of the outcome in similar studies (reported in 24 studies), that the dichotomised outcome represented an agreeable endpoint based on feedback between clinicians and/or patients and families (two studies), or that the assumptions of the statistical model for the categorical outcome were violated (reported in three studies).
There were a variety of target parameters used for the ordinal outcomes. In 130 studies, the target parameter could be determined; however, 59 of these studies (\(45\%\)) did not clearly or explicitly define the target parameter of interest. Of those where the target parameter could be determined based on the information provided in the manuscript (e.g. since it was not reported), an OR was the most common target parameter (\(78, 54\%\)), followed by a risk difference (\(31, 22\%\)). A difference in mean or median was the target parameter in 11 (8%) and 8 (6%) studies respectively. There were 14 (\(10\%\)) studies that did not estimate a target parameter. This was either because the study was descriptive in nature, the analysis used a non-parametric procedure, or the target parameter could not be determined (or some combination thereof).
Statistical methods and assumptions
There was a variety of descriptive measures used to summarise the distribution of the ordinal outcome by intervention groups (Table 5). The most common descriptive statistics were frequencies and/or percentages in each category of the ordinal outcome (\(116, 81\%\)), followed by the median score across all categories (\(33, 23\%\)) and IQRs (\(31, 22\%\)). The mean and standard deviation across the categories of the ordinal outcome were only summarised in 16 (11%) and 10 (7%) studies respectively.
Many different statistical methods were used to analyse the ordinal outcome (Table 5). The PO model was the most common statistical method used to analyse the ordinal outcome (64, \(44\%\)) that was used to estimate a proportional OR in 62 studies. In studies that used a PO model for the analysis, the interpretation of the target parameter varied between studies (see Additional file 3). The most frequent definition used was that the proportional OR represented an ordinal shift in the distribution of ordinal scale scores toward a better outcome in the intervention relative to the control group (\(12, 19\%\)). When the outcome was dichotomised, logistic regression was used in 16 studies (\(11\%\) of all studies) that usually estimated an OR or a risk difference using g-computation. Seven studies estimated a risk difference or risk ratio using binomial regression. Studies also calculated and reported a risk difference with corresponding \(95\%\) confidence intervals estimated using methods such as the Wald method or bootstrapping (\(31, 22\%\)). There were 19 (13%) studies that used a non-parametric method to analyse the ordinal outcome (either dichotomised or not), including the Cochran-Mantel-Haenszel test (\(15, 10\%\)) to estimate an odds ratio, the Wilcoxon test (\(14, 10\%\)), of which no study reported a concordance probability as the target parameter, or the Fisher’s exact or Chi-Square test (12, \(8\%\)). Other statistical methods that were used were the Hodges-Lehmann estimator, used to estimate a median difference (\(3, 2\%\)) and the Van Elteren test (\(2, 1\%\)), an extension of the Wilcoxon test for comparing treatments in a stratified experiment. Linear regression was used in 16 (\(11\%\)) studies that tended to estimate a mean or risk difference (despite the model having an unbounded support).
The majority of studies (\(86, 60\%\)) did not explicitly check the validity of the assumptions for the statistical method(s) used. For example, no study that analysed the ordinal outcome using linear regression commented on the appropriateness of assigning specific numbers of the outcome categories. Among the 64 studies that used a PO model, 20 (31%) did not report whether the assumption of PO was satisfied. Overall, there were 46 studies that reported checking key modelling assumptions; however, the method that was used to check these assumptions were not reported in 6 (\(13\%)\) of these studies. The most common way to verify model assumptions was to use statistical methods (\(31, 67\%\)), followed by graphical methods (\(2, 4\%\)).
Among the 44 studies that assessed the validity of the PO assumption for a PO model, 13 studies (\(30\%\)) used a likelihood ratio test, 10 studies (\(23\%\)) used the Brant test, and 10 studies (\(23\%\)) also used the Score test. Six (\(14\%\)) studies assessed the robustness of the PO assumption by fitting a logistic regression model to every level of the ordinal outcome across the scale, in which the OR for each dichotomous break was presented. Two studies assessed the PO assumption using graphical methods, which plotted either the inverse cumulative log odds or the empirical cumulative log odds. It was unclear which method was used to assess the PO assumption in ten studies that reported to have checked the assumption.
There were 12 studies (\(8\%\)) that reported using a different statistical method than originally planned. Ten of these studies had originally planned to use a PO model, but the PO assumption was determined to have been violated and an alternative method was chosen. One study removed the covariate that was reported to have violated the PO assumption and still used a PO model to analyse the outcome. Two studies used an unconstrained PPO model that reported an adjusted OR for each binary split of the ordinal outcome. Three studies used a Wilcoxon test, with one study stratifying by a baseline covariate that violated the PO assumption. Another study dichotomised the ordinal outcome for the analysis. One study used a Van Elteren test that estimated a median difference (which inappropriately assumes that there is an equal distance between proximate categories), another used a Poisson model with robust standard errors, and one study retained the analysis despite the violation in PO. Notably, a PPO model was not reported to have been used in studies that reported that a covariate other than the treatment violated the PO assumption. Seven studies also did not report which covariate(s) violated the PO assumption.
Frequentist inference was the most common framework for conducting the analysis (133, 92%), with Bayesian methods being used in eight (6%) studies (where two studies used both), of which all eight studies used an adaptive design. Of those using Bayesian methods, seven studies used a Bayesian PO model for analysis. Of these studies, four used a Dirichlet prior distribution to model the baseline probabilities, and three used a normally distributed prior on the proportional log-OR scale. Two of these studies reported to use the median proportional OR with corresponding \(95\%\) credible interval, while one study reported the mean proportional OR. Three studies reported that the models were fitted with the use of a Markov-chain Monte Carlo algorithm with either 10, 000 (one study) or 100, 000 (two studies) samples from the joint posterior distribution. No study reported how the goodness-of-fit of the model was assessed.
For the 38 studies that collected repeated measurements on the ordinal outcome, 18 adjusted for the baseline measurement (\(47\%\)), 14 used mixed effects models (\(37\%\)), and four used generalised estimated equations (\(11\%\)) to capture the correlation among the repeated measures for an individual.
A range of statistical packages were used for the analysis of the ordinal outcome, with SAS (\(81, 56\%\)) and R (\(35, 24\%\)) being most common. Twelve (\(8\%\)) studies did not report the software used.
Discussion
This review has provided an overview of how ordinal outcomes are used and analysed in contemporary RCTs. We describe the insight this review has provided on the study design, statistical analyses and reporting of trials using ordinal outcomes.
Target parameter
The target parameter of interest is an important consideration when planning any trial and should be aligned with the research question [12, 13]. The most common target parameter in this review was an OR, either for a dichotomised version of the ordinal outcome or in an analysis that used the ordinal scale. When an ordinal analysis was used, it was common that the target parameter was a proportional OR, although there was variation in the interpretation of this parameter between studies. We found that it was most common to interpret the proportional OR as an average shift in the distribution of the ordinal scale scores toward a better outcome in the intervention, relative to the comparator(s) [19, 35, 188, 189]. In the studies that dichotomised the ordinal outcome, many lacked justification for doing so and, in one case, dichotomisation was used only due to the violation of PO, despite the fact that this changed the target parameter.
Some studies in our review treated the ordinal outcome as if it were continuous, and used a difference in means or medians as the target parameter. These quantities do not represent a clinically meaningful effect when the outcome is ordinal, since proximate categories in the scale are not necessarily separated by a quantifiable or equal distance, which can affect the translation of the trial results into practice. If a study is to use a mean difference then the researchers should justify the appropriateness of assigning specific numbers used to the ordinal outcome categories.
The target parameter and statistical method used to estimate it could not be determined in some studies. Notably, the definition of the target parameter was not explicitly defined in almost half of the studies, despite the current recommendations on the importance of clearly defining the estimand of interest, one component of which is the target parameter [12, 13]. Furthermore, there is a lack of clarity in defining the target parameter when a PO model was used, despite the interpretation being analogous to the OR for a binary outcome, but applying to an interval of the ordinal scale instead of a single value. Consistency in the definition of a target parameter in RCTs can allow easy interpretation for clinicians and applied researchers. Explicit definition of the target parameter of interest is essential for readers to understand the interpretation of a clinically meaningful treatment effect, and also reflects the present push within clinical research with regards to estimands [12, 13].
Statistical methods
It is important to summarise the distribution of the outcome by intervention group in any RCT. When the outcome is ordinal, frequencies and percentages in each category can provide a useful summary of this distribution. Most studies in this review reported frequencies and percentages in each category, although some studies that dichotomised the outcome only reported these summaries for the dichotomised scale. Some studies reported means and standard deviations across the categories which, as mentioned previously, may not have a valid interpretation.
Although there are a range of statistical methods that can be used to analyse an ordinal outcome, we found that the PO model was the most commonly used. This is likely because the PO model is relatively well-known among statisticians and is quite straightforward to fit in most statistical packages, and it possesses the desirable properties of palindromic invariance and invariance under collapsibility. However, when using this approach to estimate a specific treatment effect across all levels of the outcome, it is important to assess and report whether the PO assumption has been met when the aim is to estimate the treatment effect across the different categories or to estimate predicted probabilities in each category. The validity of the PO assumption is less important when the objective is to understand whether one treatment is ‘better’ on average compared to a comparator. In this review, it was common for studies that used a PO model to define the target parameter that related to a treatment benefiting patients with regard to every level of the outcome scale. However, only 44 out of 64 studies reported to have checked the PO assumption, which highlights the deficiency in this practice. Statistical methods were commonly used to assess the PO assumption, although it may be preferable to avoid hypothesis testing when assessing the PO assumption, particularly with small sample sizes, as these statistical tests can have poor statistical power [22, 190]. Also, researchers should keep in mind that when the PO assumption is tested, the type I error of the analysis may change and that p-values and confidence intervals based on the updated model ignore the model-fitting uncertainty [191].
When the PO assumption was violated, a PPO model was rarely used, and instead baseline covariates were removed from the model to address the departure to PO. The fact that the PPO model is underused could be due to a lack of knowledge that such models exist and can be used to address violations in PO. Such a model could have been particularly useful in these studies that had only covariates other than the treatment variable that violated the PO assumption, as the PPO model could have been used to estimate a single proportional OR for the treatment effect. Of note, however, is that an unconstrained PPO model does not necessarily require ordinality as the categories can be arranged and the model fit would be hardly affected [192], and that estimated probabilities can be negative [193].
There are other methods that can be used to assess the validity of the PO assumption, such as plotting the differences in predicted log-odds between different categories of the ordinal outcome that should be parallel [16]. Another option is to fit a logistic regression model to every level of the ordinal outcome across the scale and compare the estimated ORs and corresponding confidence interval for each binary split of the ordinal outcome or simulating predictive distributions. However, estimating separate ORs in this way can be inefficient, particularly when the ordinal outcome has a high number of categories. Arguably, more important than assessing the validity of the PO assumption is to assess the impact of making compared to not making the assumption. If the treatment effect goes in the same direction across each category of the ordinal scale and the objective is to simply understand whether one treatment is better overall, then departures from PO may not be important. If, however, the interest is in estimating a treatment effect for every level of the ordinal outcome and/or the treatment has a detrimental effect for one end of the ordinal scale but a beneficial effect for the remaining categories, there should be careful consideration as to the validity to the type I and II error and the treatment effect if the PO model is used.
Finally, a handful of studies also used the Wilcoxon, Chi-Square, or Fisher’s exact test (the latter being too conservative [194] and potentially providing misleading results), where commonly only a p-value, not a target parameter, was reported when these methods were used. The lack of a target parameter for the treatment effect can make it difficult for clinicians to translate the results to practice.
Strengths and limitations
The strengths of this study are that we present a review of a large number of RCTs that used ordinal outcomes published in four highly ranked medical journals to highlight the current state of practice for analysing ordinal outcomes. The screening and data extraction process was conducted systematically, and pilot tests and double data extraction ensured the consistency and reliability of the extracted data. The PRISMA-ScR checklist was used to ensure that reporting has been conducted to the highest standard.
This review does, however, have limitations. The restriction to the PubMed database and four highly ranked medical journals may affect the generalisability of this review. We made this decision given the scoping nature of the review, to ensure reproducibility and to ensure that the total number of studies included in the review was manageable. We also aimed to include studies that are likely to reflect best practice of how research using ordinal outcomes is being conducted and reported upon at present. Given the selected journals represent highly ranked medical journals, these findings are likely to reflect the best-case scenario given these journals' reputation for rigour. In addition, our search strategy may have missed certain phrases or variants (particularly related to an ordinal outcome); however, we attempted to mitigate this through our piloting phase. Finally, we also did not review the protocol papers of the trials that may have included additional information related to the statistical methodology. This includes methods that were planned to be used to assess the PO assumption, and any alternative methods that were to be used instead.
Implications of this research
This review has implications for researchers designing RCTs that use an ordinal outcome. Although the majority of studies included in this review were in the fields of neurology and infectious diseases, the results of this review would apply to RCTs in all medical fields that use an ordinal outcome. We have shown that there is substantial variation in the analysis and reporting of ordinal outcomes in practice. Our results suggest that researchers should carefully consider the target parameter of interest and explicitly report what the target parameter represents; this is particularly important for an ordinal outcome which can be unfamiliar to readers. Defining the target parameter upfront will help to ensure that appropriate analytical methods are used to analyse the ordinal outcome and make transparent the assumptions the researchers are willing to make.
Our review also highlights the need for careful assessment and reporting of the validity of the model assumptions made during the analysis of an ordinal outcome. Doing so will ensure that robust statistical methods that align with the research question and categorical nature of the ordinal outcome are used to estimate a valid, clinically relevant target parameter that can be translated to practice.
Availability of data and materials
The datasets and code generated and/or analysed during the current study are available on GitHub [195].
Abbreviations
- RCT:
-
Randomised controlled trial
- PO:
-
Proportional odds
- PPO:
-
Partial proportional odds
- SAP:
-
Statistical analysis plan
References
Velleman PF, Wilkinson L. Nominal, ordinal, interval, and ratio typologies are misleading. Am Stat. 1993;47(1):65–72.
MacKenzie CR, Charlson ME. Standards for the use of ordinal scales in clinical trials. Br Med J (Clin Res Ed). 1986;292(6512):40–3.
Banks JL, Marotta CA. Outcomes validity and reliability of the modified Rankin scale: implications for stroke clinical trials: a literature review and synthesis. Stroke. 2007;38(3):1091–6.
de la Ossa NP, Abilleira S, Jovin TG, García-Tornel Á, Jimenez X, Urra X, et al. Effect of direct transportation to thrombectomy-capable center vs local stroke center on neurological outcomes in patients with suspected large-vessel occlusion stroke in nonurban areas: the RACECAT randomized clinical Trial. JAMA. 2022;327(18):1782–94.
Hubert GJ, Hubert ND, Maegerlein C, Kraus F, Wiestler H, Müller-Barna P, et al. Association between use of a flying intervention team vs patient interhospital transfer and time to endovascular thrombectomy among patients with acute ischemic stroke in nonurban Germany. JAMA. 2022;327(18):1795–805.
Bösel J, Niesen WD, Salih F, Morris NA, Ragland JT, Gough B, et al. Effect of early vs standard approach to tracheostomy on functional outcome at 6 months among patients with severe stroke receiving mechanical ventilation: the SETPOINT2 Randomized Clinical Trial. JAMA. 2022;327(19):1899–909.
Wilson L, Boase K, Nelson LD, Temkin NR, Giacino JT, Markowitz AJ, et al. A manual for the glasgow outcome scale-extended interview. J Neurotrauma. 2021;38(17):2435–46.
Marshall JC, Murthy S, Diaz J, Adhikari N, Angus DC, Arabi YM, et al. A minimal common outcome measure set for COVID-19 clinical research. Lancet Infect Dis. 2020;20(8):e192–7.
Lovre D, Bateman K, Sherman M, Fonseca VA, Lefante J, Mauvais-Jarvis F. Acute estradiol and progesterone therapy in hospitalised adults to reduce COVID-19 severity: a randomised control trial. BMJ Open. 2021;11(11):e053684.
Song AT, Rocha V, Mendrone-Júnior A, Calado RT, De Santis GC, Benites BD, et al. Treatment of severe COVID-19 patients with either low-or high-volume of convalescent plasma versus standard of care: a multicenter Bayesian randomized open-label clinical trial (COOP-COVID-19-MCTI). Lancet Reg Health-Am. 2022;10:100216.
Mathioudakis AG, Fally M, Hashad R, Kouta A, Hadi AS, Knight SB, et al. Outcomes evaluated in controlled clinical trials on the management of COVID-19: a methodological systematic review. Life. 2020;10(12):350.
Akacha M, Bretz F, Ohlssen D, Rosenkranz G, Schmidli H. Estimands and their role in clinical trials. Stat Biopharm Res. 2017;9(3):268–71.
Mallinckrodt C, Molenberghs G, Lipkovich I, Ratitch B. Estimands, estimators and sensitivity analysis in clinical trials. CRC Press; 2019.
Walker SH, Duncan DB. Estimation of the probability of an event as a function of several independent variables. Biometrika. 1967;54(1–2):167–79.
McCullagh P. Regression models for ordinal data. J R Stat Soc Ser B Methodol. 1980;42(2):109–27.
Harrell FE, et al. Regression modeling strategies: with applications to linear models, logistic and ordinal regression, and survival analysis, vol 3. Springer; 2015.
Ananth CV, Kleinbaum DG. Regression models for ordinal responses: a review of methods and applications. Int J Epidemiol. 1997;26(6):1323–33.
Armstrong BG, Sloan M. Ordinal regression models for epidemiologic data. Am J Epidemiol. 1989;129(1):191–204.
Roozenbeek B, Lingsma HF, Perel P, Edwards P, Roberts I, Murray GD, et al. The added value of ordinal analysis in clinical trials: an example in traumatic brain injury. Crit Care. 2011;15(3):1–7.
Breheny P. Proportional odds models. 2015. MyWeb. https://myweb.uiowa.edu/pbreheny/uk/teaching/760-s13/notes/4-23.pdf.
Abreu MNS, Siqueira AL, Cardoso CS, Caiaffa WT. Ordinal logistic regression models: application in quality of life studies. Cad Saúde Pública. 2008;24:s581–91.
Peterson B, Harrell FE Jr. Partial proportional odds models for ordinal response variables. J R Stat Soc: Ser C: Appl Stat. 1990;39(2):205–17.
Fullerton AS. A conceptual framework for ordered logistic regression models. Sociol Methods Res. 2009;38(2):306–47.
Senn S, Julious S. Measurement in clinical trials: a neglected issue for statisticians? Stat Med. 2009;28(26):3189–209.
Maas AI, Steyerberg EW, Marmarou A, McHugh GS, Lingsma HF, Butcher I, et al. IMPACT recommendations for improving the design and analysis of clinical trials in moderate to severe traumatic brain injury. Neurotherapeutics. 2010;7:127–34.
McFadden D, et al. Conditional logit analysis of qualitative choice behavior. Front Econ. 1973;105–142.
Wilcoxon F. Individual comparisons by ranking methods. Springer; 1992.
Liu Q, Shepherd BE, Li C, Harrell FE Jr. Modeling continuous response variables using ordinal regression. Stat Med. 2017;36(27):4316–35.
Fay MP, Brittain EH, Shih JH, Follmann DA, Gabriel EE. Causal estimands and confidence intervals associated with Wilcoxon-Mann-Whitney tests in randomized experiments. Stat Med. 2018;37(20):2923–37.
De Neve J, Thas O, Gerds TA. Semiparametric linear transformation models: effect measures, estimators, and applications. Stat Med. 2019;38(8):1484–501.
Ganesh A, Luengo-Fernandez R, Wharton RM, Rothwell PM. Ordinal vs dichotomous analyses of modified Rankin Scale, 5-year outcome, and cost of stroke. Neurology. 2018;91(21):e1951–60.
French B, Shotwell MS. Regression models for ordinal outcomes. JAMA. 2022;328(8):772–3.
Bath PM, Geeganage C, Gray LJ, Collier T, Pocock S. Use of ordinal outcomes in vascular prevention trials: comparison with binary outcomes in published trials. Stroke. 2008;39(10):2817–23.
Scott SC, Goldberg MS, Mayo NE. Statistical assessment of ordinal outcomes in comparative studies. J Clin Epidemiol. 1997;50(1):45–55.
McHugh GS, Butcher I, Steyerberg EW, Marmarou A, Lu J, Lingsma HF, et al. A simulation study evaluating approaches to the analysis of ordinal outcome data in randomized controlled trials in traumatic brain injury: results from the IMPACT Project. Clin Trials. 2010;7(1):44–57.
DeSantis SM, Lazaridis C, Palesch Y, Ramakrishnan V. Regression analysis of ordinal stroke clinical trial outcomes: an application to the NINDS t-PA trial. Int J Stroke. 2014;9(2):226–31.
Selman CJ, Lee KJ, Whitehead CL, Manley BJ, Mahar RK. Statistical analyses of ordinal outcomes in randomised controlled trials: protocol for a scoping review. Trials. 2023;24(1):1–7.
Tricco AC, Lillie E, Zarin W, O’Brien KK, Colquhoun H, Levac D, et al. PRISMA extension for scoping reviews (PRISMA-ScR): checklist and explanation. Ann Intern Med. 2018;169(7):467–73.
Bell ML, Fiero M, Horton NJ, Hsu CH. Handling missing data in RCTs; a review of the top medical journals. BMC Med Res Methodol. 2014;14(1):1–8.
Berwanger O, Ribeiro RA, Finkelsztejn A, Watanabe M, Suzumura EA, Duncan BB, et al. The quality of reporting of trial abstracts is suboptimal: survey of major general medical journals. J Clin Epidemiol. 2009;62(4):387–92.
Higgins JP, Thomas J, Chandler J, Cumpston M, Li T, Page MJ, et al.. Cochrane handbook for systematic reviews of interventions. John Wiley & Sons; 2019.
Veritas Health Innovation. Covidence systematic review software. Melbourne; 2022.
StataCorp L. Stata statistical software: Release 17 (2021). College Station: StataCorp LP; 2021.
Hanley DF, Lane K, McBee N, Ziai W, Tuhrim S, Lees KR, et al. Thrombolytic removal of intraventricular haemorrhage in treatment of severe stroke: results of the randomised, multicentre, multiregion, placebo-controlled CLEAR III trial. Lancet. 2017;389(10069):603–11. https://doi.org/10.1016/S0140-6736(16)32410-2.
Nangia J, Wang T, Osborne C, Niravath P, Otte K, Papish S, et al. Effect of a scalp cooling device on alopecia in women undergoing chemotherapy for breast cancer: the SCALP randomized clinical trial. JAMA. 2017;317(6):596–605. https://doi.org/10.1001/jama.2016.20939. United States.
Ruzicka T, Hanifin JM, Furue M, Pulka G, Mlynarczyk I, Wollenberg A, et al. Anti-interleukin-31 receptor A antibody for atopic dermatitis. N Engl J Med. 2017;376(9):826–35. https://doi.org/10.1056/NEJMoa1606490. United States.
Németh G, Laszlovszky I, Czobor P, Szalai E, Szatmári B, Harsányi J, et al. Cariprazine versus risperidone monotherapy for treatment of predominant negative symptoms in patients with schizophrenia: a randomised, double-blind, controlled trial. Lancet. 2017;389(10074):1103–13. https://doi.org/10.1016/S0140-6736(17)30060-0. England.
Mathieson S, Maher CG, McLachlan AJ, Latimer J, Koes BW, Hancock MJ, et al. Trial of pregabalin for acute and chronic sciatica. N Engl J Med. 2017;376(12):1111–20. https://doi.org/10.1056/NEJMoa1614292. United States.
Baud O, Trousson C, Biran V, Leroy E, Mohamed D, Alberti C. Association between early low-dose hydrocortisone therapy in extremely preterm neonates and neurodevelopmental outcomes at 2 years of age. JAMA. 2017;317(13):1329–37. https://doi.org/10.1001/jama.2017.2692. United States.
van den Berg LA, Dijkgraaf MG, Berkhemer OA, Fransen PS, Beumer D, Lingsma HF, et al. Two-year outcome after endovascular treatment for acute ischemic stroke. N Engl J Med. 2017;376(14):1341–9. https://doi.org/10.1056/NEJMoa1612136. United States.
Kaufman J, Fitzpatrick P, Tosif S, Hopper SM, Donath SM, Bryant PA, et al. Faster clean catch urine collection (Quick-Wee method) from infants: randomised controlled trial. BMJ. 2017;357:j1341. https://doi.org/10.1136/bmj.j1341.
Costa Leme A, Hajjar LA, Volpe MS, Fukushima JT, De Santis Santiago RR, Osawa EA, et al. Effect of intensive vs moderate alveolar recruitment strategies added to lung-protective ventilation on postoperative pulmonary complications: a randomized clinical trial. JAMA. 2017;317(14):1422–32. https://doi.org/10.1001/jama.2017.2297. United States.
Breitenstein C, Grewe T, Flöel A, Ziegler W, Springer L, Martus P, et al. Intensive speech and language therapy in patients with chronic aphasia after stroke: a randomised, open-label, blinded-endpoint, controlled trial in a health-care setting. Lancet. 2017;389(10078):1528–38. https://doi.org/10.1016/S0140-6736(17)30067-3. England.
Wechsler ME, Akuthota P, Jayne D, Khoury P, Klion A, Langford CA, et al. Mepolizumab or placebo for eosinophilic granulomatosis with polyangiitis. N Engl J Med. 2017;376(20):1921–32. https://doi.org/10.1056/NEJMoa1702079.
Devinsky O, Cross JH, Laux L, Marsh E, Miller I, Nabbout R, et al. Trial of cannabidiol for drug-resistant seizures in the Dravet syndrome. N Engl J Med. 2017;376(21):2011–20. https://doi.org/10.1056/NEJMoa1611618. United States.
Anderson CS, Arima H, Lavados P, Billot L, Hackett ML, Olavarría VV, et al. Cluster-randomized, crossover trial of head positioning in acute stroke. N Engl J Med. 2017;376(25):2437–47. https://doi.org/10.1056/NEJMoa1615715. United States.
Juch JNS, Maas ET, Ostelo RWJG, Groeneweg JG, Kallewaard JW, Koes BW, et al. Effect of radiofrequency denervation on pain intensity among patients with chronic low back pain: the Mint randomized clinical trials. JAMA. 2017;318(1):68–81. https://doi.org/10.1001/jama.2017.7918.
Mohamed S, Johnson GR, Chen P, Hicks PB, Davis LL, Yoon J, et al. Effect of antidepressant switching vs augmentation on remission among patients with major depressive disorder unresponsive to antidepressant treatment: the VAST-D randomized clinical trial. JAMA. 2017;318(2):132–45. https://doi.org/10.1001/jama.2017.8036.
Kanes S, Colquhoun H, Gunduz-Bruce H, Raines S, Arnold R, Schacterle A, et al. Brexanolone (SAGE-547 injection) in post-partum depression: a randomised controlled trial. Lancet. 2017;390(10093):480–9. https://doi.org/10.1016/S0140-6736(17)31264-3. England.
Lapergue B, Blanc R, Gory B, Labreuche J, Duhamel A, Marnat G, et al. Effect of endovascular contact aspiration vs stent retriever on revascularization in patients with acute ischemic stroke and large vessel occlusion: the ASTER randomized clinical trial. JAMA. 2017;318(5):443–52. https://doi.org/10.1001/jama.2017.9644.
Lindley RI, Anderson CS, Billot L, Forster A, Hackett ML, Harvey LA, et al. Family-led rehabilitation after stroke in India (ATTEND): a randomised controlled trial. Lancet. 2017;390(10094):588–99. https://doi.org/10.1016/S0140-6736(17)31447-2. England.
Berlowitz DR, Foy CG, Kazis LE, Bolin LP, Conroy MB, Fitzpatrick P, et al. Effect of intensive blood-pressure treatment on patient-reported outcomes. N Engl J Med. 2017;377(8):733–44. https://doi.org/10.1056/NEJMoa1611179.
Hui D, Frisbee-Hume S, Wilson A, Dibaj SS, Nguyen T, De La Cruz M, et al. Effect of lorazepam with haloperidol vs haloperidol alone on agitated delirium in patients with advanced cancer receiving palliative care: a randomized clinical trial. JAMA. 2017;318(11):1047–56. https://doi.org/10.1001/jama.2017.11468.
Roffe C, Nevatte T, Sim J, Bishop J, Ives N, Ferdinand P, et al. Effect of routine low-dose oxygen supplementation on death and disability in adults with acute stroke: the stroke oxygen study randomized clinical trial. JAMA. 2017;318(12):1125–35. https://doi.org/10.1001/jama.2017.11463.
Dwivedi R, Ramanujam B, Chandra PS, Sapra S, Gulati S, Kalaivani M, et al. Surgery for drug-resistant epilepsy in children. N Engl J Med. 2017;377(17):1639–47. https://doi.org/10.1056/NEJMoa1615335. United States.
Nogueira RG, Jadhav AP, Haussen DC, Bonafe A, Budzik RF, Bhuva P, et al. Thrombectomy 6 to 24 hours after stroke with a mismatch between deficit and infarct. N Engl J Med. 2018;378(1):11–21. https://doi.org/10.1056/NEJMoa1706442. United States.
Zheng MX, Hua XY, Feng JT, Li T, Lu YC, Shen YD, et al. Trial of Contralateral seventh cervical nerve transfer for spastic arm paralysis. N Engl J Med. 2018;378(1):22–34. https://doi.org/10.1056/NEJMoa1615208. United States.
Atri A, Frölich L, Ballard C, Tariot PN, Molinuevo JL, Boneva N, et al. Effect of idalopirdine as adjunct to cholinesterase inhibitors on change in cognition in patients with Alzheimer disease: three randomized clinical trials. JAMA. 2018;319(2):130–42. https://doi.org/10.1001/jama.2017.20373.
Bassler D, Shinwell ES, Hallman M, Jarreau PH, Plavka R, Carnielli V, et al. Long-term effects of inhaled budesonide for bronchopulmonary dysplasia. N Engl J Med. 2018;378(2):148–57. https://doi.org/10.1056/NEJMoa1708831. United States.
Raskind MA, Peskind ER, Chow B, Harris C, Davis-Karim A, Holmes HA, et al. Trial of prazosin for post-traumatic stress disorder in military veterans. N Engl J Med. 2018;378(6):507–17. https://doi.org/10.1056/NEJMoa1507598. United States.
Albers GW, Marks MP, Kemp S, Christensen S, Tsai JP, Ortega-Gutierrez S, et al. Thrombectomy for stroke at 6 to 16 hours with selection by perfusion imaging. N Engl J Med. 2018;378(8):708–18. https://doi.org/10.1056/NEJMoa1713973.
Bath PM, Woodhouse LJ, Appleton JP, Beridze M, Christensen H, Dineen RA, et al. Antiplatelet therapy with aspirin, clopidogrel, and dipyridamole versus clopidogrel alone or aspirin and dipyridamole in patients with acute cerebral ischaemia (TARDIS): a randomised, open-label, phase 3 superiority trial. Lancet. 2018;391(10123):850–9. https://doi.org/10.1016/S0140-6736(17)32849-0.
Krebs EE, Gravely A, Nugent S, Jensen AC, DeRonne B, Goldsmith ES, et al. Effect of opioid vs nonopioid medications on pain-related function in patients with chronic back pain or hip or knee osteoarthritis pain: the SPACE randomized clinical trial. JAMA. 2018;319(9):872–82. https://doi.org/10.1001/jama.2018.0899.
Campbell BCV, Mitchell PJ, Churilov L, Yassi N, Kleinig TJ, Dowling RJ, et al. Tenecteplase versus alteplase before thrombectomy for ischemic stroke. N Engl J Med. 2018;378(17):1573–82. https://doi.org/10.1056/NEJMoa1716405. United States.
Mellor R, Bennell K, Grimaldi A, Nicolson P, Kasza J, Hodges P, et al. Education plus exercise versus corticosteroid injection use versus a wait and see approach on global outcome and pain from gluteal tendinopathy: prospective, single blinded, randomised clinical trial. BMJ. 2018;361. https://doi.org/10.1136/bmj.k1662.
Sprigg N, Flaherty K, Appleton JP, Al-Shahi Salman R, Bereczki D, Beridze M, et al. Tranexamic acid for hyperacute primary IntraCerebral Haemorrhage (TICH-2): an international randomised, placebo-controlled, phase 3 superiority trial. Lancet. 2018;391(10135):2107–15. https://doi.org/10.1016/S0140-6736(18)31033-X.
Jolly K, Sidhu MS, Hewitt CA, Coventry PA, Daley A, Jordan R, et al. Self management of patients with mild COPD in primary care: randomised controlled trial. BMJ. 2018;361. https://doi.org/10.1136/bmj.k2241.
Brock PR, Maibach R, Childs M, Rajput K, Roebuck D, Sullivan MJ, et al. Sodium thiosulfate for protection from cisplatin-induced hearing loss. N Engl J Med. 2018;378(25):2376–85. https://doi.org/10.1056/NEJMoa1801109.
Khatri P, Kleindorfer DO, Devlin T, Sawyer RN Jr, Starr M, Mejilla J, et al. Effect of alteplase vs aspirin on functional outcome for patients with acute ischemic stroke and minor nondisabling neurologic deficits: the PRISMS randomized clinical trial. JAMA. 2018;320(2):156–66. https://doi.org/10.1001/jama.2018.8496.
Wang Y, Li Z, Zhao X, Wang C, Wang X, Wang D, et al. Effect of a multifaceted quality improvement intervention on hospital personnel adherence to performance measures in patients with acute ischemic stroke in china: a randomized clinical trial. JAMA. 2018;320(3):245–54. https://doi.org/10.1001/jama.2018.8802. United States.
Fossat G, Baudin F, Courtes L, Bobet S, Dupont A, Bretagnol A, et al. Effect of in-bed leg cycling and electrical stimulation of the quadriceps on global muscle strength in critically ill adults: a randomized clinical trial. JAMA. 2018;320(4):368–78. https://doi.org/10.1001/jama.2018.9592.
Thomalla G, Simonsen CZ, Boutitie F, Andersen G, Berthezene Y, Cheng B, et al. MRI-guided thrombolysis for stroke with unknown time of onset. N Engl J Med. 2018;379(7):611–22. https://doi.org/10.1056/NEJMoa1804355. United States.
Perkins GD, Ji C, Deakin CD, Quinn T, Nolan JP, Scomparin C, et al. A randomized trial of epinephrine in out-of-hospital cardiac arrest. N Engl J Med. 2018;379(8):711–21. https://doi.org/10.1056/NEJMoa1806842. United States.
Wang HE, Schmicker RH, Daya MR, Stephens SW, Idris AH, Carlson JN, et al. Effect of a strategy of initial laryngeal tube insertion vs endotracheal intubation on 72-hour survival in adults with out-of-hospital cardiac arrest: a randomized clinical trial. JAMA. 2018;320(8):769–78. https://doi.org/10.1001/jama.2018.7044.
Benger JR, Kirby K, Black S, Brett SJ, Clout M, Lazaroo MJ, et al. Effect of a strategy of a supraglottic airway device vs tracheal intubation during out-of-hospital cardiac arrest on functional outcome: the AIRWAYS-2 randomized clinical trial. JAMA. 2018;320(8):779–91. https://doi.org/10.1001/jama.2018.11597.
Meltzer-Brody S, Colquhoun H, Riesenberg R, Epperson CN, Deligiannidis KM, Rubinow DR, et al. Brexanolone injection in post-partum depression: two multicentre, double-blind, randomised, placebo-controlled, phase 3 trials. Lancet. 2018;392(10152):1058–70. https://doi.org/10.1016/S0140-6736(18)31551-4. England.
Cooper DJ, Nichol AD, Bailey M, Bernard S, Cameron PA, Pili-Floury S, et al. Effect of early sustained prophylactic hypothermia on neurologic outcomes among patients with severe traumatic brain injury: the POLAR randomized clinical trial. JAMA. 2018;320(21):2211–20. https://doi.org/10.1001/jama.2018.17075.
Bonell C, Allen E, Warren E, McGowan J, Bevilacqua L, Jamal F, et al. Effects of the Learning Together intervention on bullying and aggression in English secondary schools (INCLUSIVE): a cluster randomised controlled trial. Lancet. 2018;392(10163):2452–64. https://doi.org/10.1016/S0140-6736(18)31782-3.
Stunnenberg BC, Raaphorst J, Groenewoud HM, Statland JM, Griggs RC, Woertman W, et al. Effect of mexiletine on muscle stiffness in patients with nondystrophic myotonia evaluated using aggregated N-of-1 trials. JAMA. 2018;320(22):2344–53. https://doi.org/10.1001/jama.2018.18020.
Burt RK, Balabanov R, Burman J, Sharrack B, Snowden JA, Oliveira MC, et al. Effect of nonmyeloablative hematopoietic stem cell transplantation vs continued disease-modifying therapy on disease progression in patients with relapsing-remitting multiple sclerosis: a randomized clinical trial. JAMA. 2019;321(2):165–74. https://doi.org/10.1001/jama.2018.18743.
Dennis M, Mead G, Forbes J, Graham C, Hackett M, Hankey GJ, et al. Effects of fluoxetine on functional outcomes after acute stroke (FOCUS): a pragmatic, double-blind, randomised, controlled trial. Lancet. 2019;393(10168):265–74. https://doi.org/10.1016/S0140-6736(18)32823-X.
Anderson CS, Huang Y, Lindley RI, Chen X, Arima H, Chen G, et al. Intensive blood pressure reduction with intravenous thrombolysis therapy for acute ischaemic stroke (ENCHANTED): an international, randomised, open-label, blinded-endpoint, phase 3 trial. Lancet. 2019;393(10174):877–88. https://doi.org/10.1016/S0140-6736(19)30038-8. England.
Basner M, Asch DA, Shea JA, Bellini LM, Carlin M, Ecker AJ, et al. Sleep and alertness in a duty-hour flexibility trial in internal medicine. N Engl J Med. 2019;380(10):915–23. https://doi.org/10.1056/NEJMoa1810641.
Bath PM, Scutt P, Anderson CS, Appleton JP, Berge E, Cala L, et al. Prehospital transdermal glyceryl trinitrate in patients with ultra-acute presumed stroke (RIGHT-2): an ambulance-based, randomised, sham-controlled, blinded, phase 3 trial. Lancet. 2019;393(10175):1009–20. https://doi.org/10.1016/S0140-6736(19)30194-1.
Hanley DF, Thompson RE, Rosenblum M, Yenokyan G, Lane K, McBee N, et al. Efficacy and safety of minimally invasive surgery with thrombolysis in intracerebral haemorrhage evacuation (MISTIE III): a randomised, controlled, open-label, blinded endpoint phase 3 trial. Lancet. 2019;393(10175):1021–32. https://doi.org/10.1016/S0140-6736(19)30195-3.
Turk AS 3rd, Siddiqui A, Fifi JT, De Leacy RA, Fiorella DJ, Gu E, et al. Aspiration thrombectomy versus stent retriever thrombectomy as first-line approach for large vessel occlusion (COMPASS): a multicentre, randomised, open label, blinded outcome, non-inferiority trial. Lancet. 2019;393(10175):998–1008. https://doi.org/10.1016/S0140-6736(19)30297-1. England.
Ma H, Campbell BCV, Parsons MW, Churilov L, Levi CR, Hsu C, et al. Thrombolysis guided by perfusion imaging up to 9 hours after onset of stroke. N Engl J Med. 2019;380(19):1795–803. https://doi.org/10.1056/NEJMoa1813046. United States.
Fischer K, Al-Sawaf O, Bahlo J, Fink AM, Tandon M, Dixon M, et al. Venetoclax and obinutuzumab in patients with CLL and coexisting conditions. N Engl J Med. 2019;380(23):2225–36. https://doi.org/10.1056/NEJMoa1815281. United States.
Shehabi Y, Howe BD, Bellomo R, Arabi YM, Bailey M, Bass FE, et al. Early sedation with dexmedetomidine in critically ill patients. N Engl J Med. 2019;380(26):2506–17. https://doi.org/10.1056/NEJMoa1904710. United States.
Johnston KC, Bruno A, Pauls Q, Hall CE, Barrett KM, Barsan W, et al. Intensive vs standard treatment of hyperglycemia and functional outcome in patients with acute ischemic stroke: the SHINE randomized clinical trial. JAMA. 2019;322(4):326–35. https://doi.org/10.1001/jama.2019.9346.
Widmark A, Gunnlaugsson A, Beckman L, Thellenberg-Karlsson C, Hoyer M, Lagerlund M, et al. Ultra-hypofractionated versus conventionally fractionated radiotherapy for prostate cancer: 5-year outcomes of the HYPO-RT-PC randomised, non-inferiority, phase 3 trial. Lancet. 2019;394(10196):385–95. https://doi.org/10.1016/S0140-6736(19)31131-6. England.
Pittock SJ, Berthele A, Fujihara K, Kim HJ, Levy M, Palace J, et al. Eculizumab in aquaporin-4-positive neuromyelitis optica spectrum disorder. N Engl J Med. 2019;381(7):614–25. https://doi.org/10.1056/NEJMoa1900866. United States.
Gunduz-Bruce H, Silber C, Kaul I, Rothschild AJ, Riesenberg R, Sankoh AJ, et al. Trial of SAGE-217 in patients with major depressive disorder. N Engl J Med. 2019;381(10):903–11. https://doi.org/10.1056/NEJMoa1815981. United States.
Nave AH, Rackoll T, Grittner U, Bläsing H, Gorsler A, Nabavi DG, et al. Physical Fitness Training in Patients with Subacute Stroke (PHYS-STROKE): multicentre, randomised controlled, endpoint blinded trial. BMJ. 2019;366:l5101. https://doi.org/10.1136/bmj.l5101.
Sands BE, Peyrin-Biroulet L, Loftus EV Jr, Danese S, Colombel JF, Törüner M, et al. Vedolizumab versus adalimumab for moderate-to-severe ulcerative colitis. N Engl J Med. 2019;381(13):1215–26. https://doi.org/10.1056/NEJMoa1905725. United States.
Cree BAC, Bennett JL, Kim HJ, Weinshenker BG, Pittock SJ, Wingerchuk DM, et al. Inebilizumab for the treatment of neuromyelitis optica spectrum disorder (N-MOmentum): a double-blind, randomised placebo-controlled phase 2/3 trial. Lancet. 2019;394(10206):1352–63. https://doi.org/10.1016/S0140-6736(19)31817-3. England.
Cooper K, Breeman S, Scott NW, Scotland G, Clark J, Hawe J, et al. Laparoscopic supracervical hysterectomy versus endometrial ablation for women with heavy menstrual bleeding (HEALTH): a parallel-group, open-label, randomised controlled trial. Lancet. 2019;394(10207):1425–36. https://doi.org/10.1016/S0140-6736(19)31790-8.
Reddihough DS, Marraffa C, Mouti A, O’Sullivan M, Lee KJ, Orsini F, et al. Effect of fluoxetine on obsessive-compulsive behaviors in children and adolescents with autism spectrum disorders: a randomized clinical trial. JAMA. 2019;322(16):1561–9. https://doi.org/10.1001/jama.2019.14685.
John LK, Loewenstein G, Marder A, Callaham ML. Effect of revealing authors’ conflicts of interests in peer review: randomized controlled trial. BMJ. 2019;367. https://doi.org/10.1136/bmj.l5896.
Yamamura T, Kleiter I, Fujihara K, Palace J, Greenberg B, Zakrzewska-Pniewska B, et al. Trial of satralizumab in neuromyelitis optica spectrum disorder. N Engl J Med. 2019;381(22):2114–24. https://doi.org/10.1056/NEJMoa1901747. United States.
Hoskin PJ, Hopkins K, Misra V, Holt T, McMenemin R, Dubois D, et al. Effect of single-fraction vs multifraction radiotherapy on ambulatory status among patients with spinal canal compression from metastatic cancer: the SCORAD randomized clinical trial. JAMA. 2019;322(21):2084–94. https://doi.org/10.1001/jama.2019.17913.
Lascarrou JB, Merdji H, Le Gouge A, Colin G, Grillet G, Girardie P, et al. Targeted temperature management for cardiac arrest with nonshockable rhythm. N Engl J Med. 2019;381(24):2327–37. https://doi.org/10.1056/NEJMoa1906661. United States.
Ständer S, Yosipovitch G, Legat FJ, Lacour JP, Paul C, Narbutt J, et al. Trial of nemolizumab in moderate-to-severe prurigo nodularis. N Engl J Med. 2020;382(8):706–16. https://doi.org/10.1056/NEJMoa1908316. United States.
Hill MD, Goyal M, Menon BK, Nogueira RG, McTaggart RA, Demchuk AM, et al. Efficacy and safety of nerinetide for the treatment of acute ischaemic stroke (ESCAPE-NA1): a multicentre, double-blind, randomised controlled trial. Lancet. 2020;395(10227):878–87. https://doi.org/10.1016/S0140-6736(20)30258-0. England.
Olsen HT, Nedergaard HK, Strøm T, Oxlund J, Wian KA, Ytrebø LM, et al. Nonsedation or light sedation in critically ill, mechanically ventilated patients. N Engl J Med. 2020;382(12):1103–11. https://doi.org/10.1056/NEJMoa1906759. United States.
Campbell BCV, Mitchell PJ, Churilov L, Yassi N, Kleinig TJ, Dowling RJ, et al. Effect of intravenous tenecteplase dose on cerebral reperfusion before thrombectomy in patients with large vessel occlusion ischemic stroke: the EXTEND-IA TNK Part 2 randomized clinical trial. JAMA. 2020;323(13):1257–65. https://doi.org/10.1001/jama.2020.1511.
Deyle GD, Allen CS, Allison SC, Gill NW, Hando BR, Petersen EJ, et al. Physical therapy versus glucocorticoid injection for osteoarthritis of the knee. N Engl J Med. 2020;382(15):1420–29. https://doi.org/10.1056/NEJMoa1905877. United States.
Koblan KS, Kent J, Hopkins SC, Krystal JH, Cheng H, Goldman R, et al. A non-D2-receptor-binding drug for the treatment of schizophrenia. N Engl J Med. 2020;382(16):1497–506. https://doi.org/10.1056/NEJMoa1911772. United States.
Cao B, Wang Y, Wen D, Liu W, Wang J, Fan G, et al. A trial of lopinavir-ritonavir in adults hospitalized with severe COVID-19. N Engl J Med. 2020;382(19):1787–99. https://doi.org/10.1056/NEJMoa2001282.
Wang Y, Zhang D, Du G, Du R, Zhao J, Jin Y, et al. Remdesivir in adults with severe COVID-19: a randomised, double-blind, placebo-controlled, multicentre trial. Lancet. 2020;395(10236):1569–78. https://doi.org/10.1016/S0140-6736(20)31022-9.
Yang P, Zhang Y, Zhang L, Treurniet KM, Chen W, Peng Y, et al. Endovascular thrombectomy with or without intravenous alteplase in acute stroke. N Engl J Med. 2020;382(21):1981–93. https://doi.org/10.1056/NEJMoa2001123. United States.
Martins SO, Mont’Alverne F, Rebello LC, Abud DG, Silva GS, Lima FO, et al. Thrombectomy for stroke in the public health care system of Brazil. N Engl J Med. 2020;382(24):2316–26. https://doi.org/10.1056/NEJMoa2000120. United States.
Kabashima K, Matsumura T, Komazaki H, Kawashima M. Trial of nemolizumab and topical agents for atopic dermatitis with pruritus. N Engl J Med. 2020;383(2):141–50. https://doi.org/10.1056/NEJMoa1917006. United States.
Johnston SC, Amarenco P, Denison H, Evans SR, Himmelmann A, James S, et al. Ticagrelor and aspirin or aspirin alone in acute ischemic stroke or TIA. N Engl J Med. 2020;383(3):207–17. https://doi.org/10.1056/NEJMoa1916870. United States.
Lebwohl MG, Papp KA, Stein Gold L, Gooderham MJ, Kircik LH, Draelos ZD, et al. Trial of roflumilast cream for chronic plaque psoriasis. N Engl J Med. 2020;383(3):229–39. https://doi.org/10.1056/NEJMoa2000073. United States.
Simpson EL, Sinclair R, Forman S, Wollenberg A, Aschoff R, Cork M, et al. Efficacy and safety of abrocitinib in adults and adolescents with moderate-to-severe atopic dermatitis (JADE MONO-1): a multicentre, double-blind, randomised, placebo-controlled, phase 3 trial. Lancet. 2020;396(10246):255–66. https://doi.org/10.1016/S0140-6736(20)30732-7. England.
Rowell SE, Meier EN, McKnight B, Kannas D, May S, Sheehan K, et al. Effect of out-of-hospital tranexamic acid vs placebo on 6-month functional neurologic outcomes in patients with moderate or severe traumatic brain injury. JAMA. 2020;324(10):961–74. https://doi.org/10.1001/jama.2020.8958.
van der Vlist AC, van Oosterom RF, van Veldhoven PLJ, Bierma-Zeinstra SMA, Waarsing JH, Verhaar JAN, et al. Effectiveness of a high volume injection as treatment for chronic Achilles tendinopathy: randomised controlled trial. BMJ. 2020;370. https://doi.org/10.1136/bmj.m3027.
Spinner CD, Gottlieb RL, Criner GJ, Arribas López JR, Cattelan AM, Soriano Viladomiu A, et al. Effect of remdesivir vs standard care on clinical status at 11 days in patients with moderate COVID-19: a randomized clinical trial. JAMA. 2020;324(11):1048–57. https://doi.org/10.1001/jama.2020.16349.
Horne AW, Vincent K, Hewitt CA, Middleton LJ, Koscielniak M, Szubert W, et al. Gabapentin for chronic pelvic pain in women (GaPP2): a multicentre, randomised, double-blind, placebo-controlled trial. Lancet. 2020;396(10255):909–17. https://doi.org/10.1016/S0140-6736(20)31693-7.
Furtado RHM, Berwanger O, Fonseca HA, Corrêa TD, Ferraz LR, Lapa MG, et al. Azithromycin in addition to standard of care versus standard of care alone in the treatment of patients admitted to the hospital with severe COVID-19 in Brazil (COALITION II): a randomised clinical trial. Lancet. 2020;396(10256):959–67. https://doi.org/10.1016/S0140-6736(20)31862-6.
Tomazini BM, Maia IS, Cavalcanti AB, Berwanger O, Rosa RG, Veiga VC, et al. Effect of dexamethasone on days alive and ventilator-free in patients with moderate or severe acute respiratory distress syndrome and COVID-19: the CoDEX randomized clinical trial. JAMA. 2020;324(13):1307–16. https://doi.org/10.1001/jama.2020.17021.
Beigel JH, Tomashek KM, Dodd LE, Mehta AK, Zingman BS, Kalil AC, et al. Remdesivir for the treatment of COVID-19 - final report. N Engl J Med. 2020;383(19):1813–26. https://doi.org/10.1056/NEJMoa2007764.
Goldman JD, Lye DCB, Hui DS, Marks KM, Bruno R, Montejano R, et al. Remdesivir for 5 or 10 days in patients with severe COVID-19. N Engl J Med. 2020;383(19):1827–37. https://doi.org/10.1056/NEJMoa2015301.
Cavalcanti AB, Zampieri FG, Rosa RG, Azevedo LCP, Veiga VC, Avezum A, et al. Hydroxychloroquine with or without azithromycin in mild-to-moderate COVID-19. N Engl J Med. 2020;383(21):2041–52. https://doi.org/10.1056/NEJMoa2019014.
Self WH, Semler MW, Leither LM, Casey JD, Angus DC, Brower RG, et al. Effect of hydroxychloroquine on clinical status at 14 days in hospitalized patients with COVID-19: a randomized clinical trial. JAMA. 2020;324(21):2165–76. https://doi.org/10.1001/jama.2020.22240.
Martínez-Fernández R, Máñez-Miró JU, Rodríguez-Rojas R, Del Álamo M, Shah BB, Hernández-Fernández F, et al. Randomized trial of focused ultrasound subthalamotomy for Parkinson’s disease. N Engl J Med. 2020;383(26):2501–13. https://doi.org/10.1056/NEJMoa2016311. United States.
Hutchinson PJ, Edlmann E, Bulters D, Zolnourian A, Holton P, Suttner N, et al. Trial of dexamethasone for chronic subdural hematoma. N Engl J Med. 2020;383(27):2616–27. https://doi.org/10.1056/NEJMoa2020473. United States.
Klein AL, Imazio M, Cremer P, Brucato A, Abbate A, Fang F, et al. Phase 3 trial of interleukin-1 trap rilonacept in recurrent pericarditis. N Engl J Med. 2021;384(1):31–41. https://doi.org/10.1056/NEJMoa2027892. United States.
Post R, Germans MR, Tjerkstra MA, Vergouwen MDI, Jellema K, Koot RW, et al. Ultra-early tranexamic acid after subarachnoid haemorrhage (ULTRA): a randomised controlled trial. Lancet. 2021;397(10269):112–8. https://doi.org/10.1016/S0140-6736(20)32518-6. England.
Suzuki K, Matsumaru Y, Takeuchi M, Morimoto M, Kanazawa R, Takayama Y, et al. Effect of mechanical thrombectomy without vs with intravenous thrombolysis on functional outcome among patients with acute ischemic stroke: the SKIP randomized clinical trial. JAMA. 2021;325(3):244–53. https://doi.org/10.1001/jama.2020.23522.
Zi W, Qiu Z, Li F, Sang H, Wu D, Luo W, et al. Effect of endovascular treatment alone vs intravenous alteplase plus endovascular treatment on functional independence in patients with acute ischemic stroke: the DEVT randomized clinical trial. JAMA. 2021;325(3):234–43. https://doi.org/10.1001/jama.2020.23523.
Veiga VC, Prats JAGG, Farias DLC, Rosa RG, Dourado LK, Zampieri FG, et al. Effect of tocilizumab on clinical outcomes at 15 days in patients with severe or critical coronavirus disease 2019: randomised controlled trial. BMJ. 2021;372. https://doi.org/10.1136/bmj.n84.
Gordon KB, Foley P, Krueger JG, Pinter A, Reich K, Vender R, et al. Bimekizumab efficacy and safety in moderate to severe plaque psoriasis (BE READY): a multicentre, double-blind, placebo-controlled, randomised withdrawal phase 3 trial. Lancet. 2021;397(10273):475–86. https://doi.org/10.1016/S0140-6736(21)00126-4. England.
Reich K, Papp KA, Blauvelt A, Langley RG, Armstrong A, Warren RB, et al. Bimekizumab versus ustekinumab for the treatment of moderate to severe plaque psoriasis (BE VIVID): efficacy and safety from a 52-week, multicentre, double-blind, active comparator and placebo controlled phase 3 trial. Lancet. 2021;397(10273):487–98. https://doi.org/10.1016/S0140-6736(21)00125-2. England.
Blauvelt A, Kempers S, Lain E, Schlesinger T, Tyring S, Forman S, et al. Phase 3 trials of tirbanibulin ointment for actinic keratosis. N Engl J Med. 2021;384(6):512–20. https://doi.org/10.1056/NEJMoa2024040. United States.
Simonovich VA, Burgos Pratx LD, Scibona P, Beruto MV, Vallone MG, Vázquez C, et al. A randomized trial of convalescent plasma in COVID-19 severe pneumonia. N Engl J Med. 2021;384(7):619–29. https://doi.org/10.1056/NEJMoa2031304.
Brannan SK, Sawchak S, Miller AC, Lieberman JA, Paul SM, Breier A. Muscarinic cholinergic receptor agonist and peripheral antagonist for schizophrenia. N Engl J Med. 2021;384(8):717–26. https://doi.org/10.1056/NEJMoa2017015.
Lundgren JD, Grund B, Barkauskas CE, Holland TL, Gottlieb RL, Sandkovsky U, et al. A neutralizing monoclonal antibody for hospitalized patients with COVID-19. N Engl J Med. 2021;384(10):905–14. https://doi.org/10.1056/NEJMoa2033130.
Bieber T, Simpson EL, Silverberg JI, Thaçi D, Paul C, Pink AE, et al. Abrocitinib versus placebo or dupilumab for atopic dermatitis. N Engl J Med. 2021;384(12):1101–12. https://doi.org/10.1056/NEJMoa2019380. United States.
Gordon AC, Mouncey PR, Al-Beidh F, Rowan KM, Nichol AD, Arabi YM, et al. Interleukin-6 receptor antagonists in critically ill patients with COVID-19. N Engl J Med. 2021;384(16):1491–502. https://doi.org/10.1056/NEJMoa2100433.
Rosas IO, Bräu N, Waters M, Go RC, Hunter BD, Bhagani S, et al. Tocilizumab in hospitalized patients with severe COVID-19 pneumonia. N Engl J Med. 2021;384(16):1503–16. https://doi.org/10.1056/NEJMoa2028700.
Aspvall K, Andersson E, Melin K, Norlin L, Eriksson V, Vigerland S, et al. Effect of an Internet-delivered stepped-care program vs in-person cognitive behavioral therapy on obsessive-compulsive disorder symptoms in children and adolescents: a randomized clinical trial. JAMA. 2021;325(18):1863–73. https://doi.org/10.1001/jama.2021.3839.
Langezaal LCM, van der Hoeven EJRJ, Mont’Alverne FJA, de Carvalho JJF, Lima FO, Dippel DWJ, et al. Endovascular therapy for stroke due to basilar-artery occlusion. N Engl J Med. 2021;384(20):1910–20. https://doi.org/10.1056/NEJMoa2030297. United States.
Roquilly A, Moyer JD, Huet O, Lasocki S, Cohen B, Dahyot-Fizelier C, et al. Effect of continuous infusion of hypertonic saline vs standard care on 6-month neurological outcomes in patients with traumatic brain injury: the COBI randomized clinical trial. JAMA. 2021;325(20):2056–66. https://doi.org/10.1001/jama.2021.5561.
Guttman-Yassky E, Teixeira HD, Simpson EL, Papp KA, Pangan AL, Blauvelt A, et al. Once-daily upadacitinib versus placebo in adolescents and adults with moderate-to-severe atopic dermatitis (Measure Up 1 and Measure Up 2): results from two replicate double-blind, randomised controlled phase 3 trials. Lancet. 2021;397(10290):2151–68. https://doi.org/10.1016/S0140-6736(21)00588-2. England.
Reich K, Teixeira HD, de Bruin-Weller M, Bieber T, Soong W, Kabashima K, et al. Safety and efficacy of upadacitinib in combination with topical corticosteroids in adolescents and adults with moderate-to-severe atopic dermatitis (AD Up): results from a randomised, double-blind, placebo-controlled, phase 3 trial. Lancet. 2021;397(10290):2169–81. https://doi.org/10.1016/S0140-6736(21)00589-4. England.
Dankiewicz J, Cronberg T, Lilja G, Jakobsen JC, Levin H, Ullén S, et al. Hypothermia versus normothermia after out-of-hospital cardiac arrest. N Engl J Med. 2021;384(24):2283–94. https://doi.org/10.1056/NEJMoa2100591. United States.
Tariot PN, Cummings JL, Soto-Martin ME, Ballard C, Erten-Lyons D, Sultzer DL, et al. Trial of pimavanserin in dementia-related psychosis. N Engl J Med. 2021;385(4):309–19. https://doi.org/10.1056/NEJMoa2034634. United States.
Guimarães PO, Quirk D, Furtado RH, Maia LN, Saraiva JF, Antunes MO, et al. Tofacitinib in patients hospitalized with COVID-19 pneumonia. N Engl J Med. 2021;385(5):406–15. https://doi.org/10.1056/NEJMoa2101643.
Lawler PR, Goligher EC, Berger JS, Neal MD, McVerry BJ, Nicolau JC, et al. Therapeutic anticoagulation with heparin in noncritically ill patients with COVID-19. N Engl J Med. 2021;385(9):790–802. https://doi.org/10.1056/NEJMoa2105911.
Goligher EC, Bradbury CA, McVerry BJ, Lawler PR, Berger JS, Gong MN, et al. Therapeutic Anticoagulation with heparin in critically ill patients with COVID-19. N Engl J Med. 2021;385(9):777–89. https://doi.org/10.1056/NEJMoa2103417.
Schwarzschild MA, Ascherio A, Casaceli C, Curhan GC, Fitzgerald R, Kamp C, et al. Effect of urate-elevating inosine on early Parkinson disease progression: the SURE-PD3 randomized clinical trial. JAMA. 2021;326(10):926–39. https://doi.org/10.1001/jama.2021.10207.
Halliday A, Bulbulia R, Bonati LH, Chester J, Cradduck-Bamford A, Peto R, et al. Second asymptomatic carotid surgery trial (ACST-2): a randomised comparison of carotid artery stenting versus carotid endarterectomy. Lancet. 2021;398(10305):1065–73. https://doi.org/10.1016/S0140-6736(21)01910-3.
Paget LDA, Reurink G, de Vos RJ, Weir A, Moen MH, Bierma-Zeinstra SMA, et al. Effect of platelet-rich plasma injections vs placebo on ankle symptoms and function in patients with ankle osteoarthritis: a randomized clinical trial. JAMA. 2021;326(16):1595–605. https://doi.org/10.1001/jama.2021.16602.
Estcourt LJ, Turgeon AF, McQuilten ZK, McVerry BJ, Al-Beidh F, Annane D, et al. Effect of convalescent plasma on organ support-free days in critically ill patients with COVID-19: a randomized clinical trial. JAMA. 2021;326(17):1690–702. https://doi.org/10.1001/jama.2021.18178.
LeCouffe NE, Kappelhof M, Treurniet KM, Rinkel LA, Bruggeman AE, Berkhemer OA, et al. A randomized trial of intravenous alteplase before endovascular treatment for stroke. N Engl J Med. 2021;385(20):1833–44. https://doi.org/10.1056/NEJMoa2107727. United States.
Korley FK, Durkalski-Mauldin V, Yeatts SD, Schulman K, Davenport RD, Dumont LJ, et al. Early convalescent plasma for high-risk outpatients with COVID-19. N Engl J Med. 2021;385(21):1951–60. https://doi.org/10.1056/NEJMoa2103784.
Bennell KL, Paterson KL, Metcalf BR, Duong V, Eyles J, Kasza J, et al. Effect of intra-articular platelet-rich plasma vs placebo injection on pain and medial tibial cartilage volume in patients with knee osteoarthritis: the RESTORE randomized clinical trial. JAMA. 2021;326(20):2021–30. https://doi.org/10.1001/jama.2021.19415.
Ospina-Tascón GA, Calderón-Tapia LE, García AF, Zarama V, Gómez-Álvarez F, Álvarez-Saa T, et al. Effect of high-flow oxygen therapy vs conventional oxygen therapy on invasive mechanical ventilation and clinical recovery in patients with severe COVID-19: a randomized clinical trial. JAMA. 2021;326(21):2161–71. https://doi.org/10.1001/jama.2021.20714.
Lebwohl MG, Stein Gold L, Strober B, Papp KA, Armstrong AW, Bagel J, et al. Phase 3 Trials of tapinarof cream for plaque psoriasis. N Engl J Med. 2021;385(24):2219–29. https://doi.org/10.1056/NEJMoa2103629. United States.
Berger JS, Kornblith LZ, Gong MN, Reynolds HR, Cushman M, Cheng Y, et al. Effect of P2Y12 Inhibitors on survival free of organ support among non-critically ill hospitalized patients with COVID-19: a randomized clinical trial. JAMA. 2022;327(3):227–36. https://doi.org/10.1001/jama.2021.23605.
Polizzotto MN, Nordwall J, Babiker AG, Phillips A, Vock DM, Eriobu N, et al. Hyperimmune immunoglobulin for hospitalised patients with COVID-19 (ITAC): a double-blind, placebo-controlled, phase 3, randomised trial. Lancet. 2022;399(10324):530–40. https://doi.org/10.1016/S0140-6736(22)00101-5.
Gadjradj PS, Rubinstein SM, Peul WC, Depauw PR, Vleggeert-Lankamp CL, Seiger A, et al. Full endoscopic versus open discectomy for sciatica: randomised controlled non-inferiority trial. BMJ. 2022;376. https://doi.org/10.1136/bmj-2021-065846.
Preskorn SH, Zeller S, Citrome L, Finman J, Goldberg JF, Fava M, et al. Effect of sublingual dexmedetomidine vs placebo on acute agitation associated with bipolar disorder: a randomized clinical trial. JAMA. 2022;327(8):727–36. https://doi.org/10.1001/jama.2022.0799.
Ruijter BJ, Keijzer HM, Tjepkema-Cloostermans MC, Blans MJ, Beishuizen A, Tromp SC, et al. Treating rhythmic and periodic EEG patterns in comatose survivors of cardiac arrest. N Engl J Med. 2022;386(8):724–34. https://doi.org/10.1056/NEJMoa2115998. United States.
Renú A, Millán M, San Román L, Blasco J, Martí-Fàbregas J, Terceño M, et al. Effect of intra-arterial alteplase vs placebo following successful thrombectomy on functional outcomes in patients with large vessel occlusion acute ischemic stroke: the CHOICE randomized clinical trial. JAMA. 2022;327(9):826–35. https://doi.org/10.1001/jama.2022.1645.
van der Steen W, van de Graaf RA, Chalos V, Lingsma HF, van Doormaal PJ, Coutinho JM, et al. Safety and efficacy of aspirin, unfractionated heparin, both, or neither during endovascular stroke treatment (MR CLEAN-MED): an open-label, multicentre, randomised controlled trial. Lancet. 2022;399(10329):1059–69. https://doi.org/10.1016/S0140-6736(22)00014-9. England.
Paskins Z, Bromley K, Lewis M, Hughes G, Hughes E, Hennings S, et al. Clinical effectiveness of one ultrasound guided intra-articular corticosteroid and local anaesthetic injection in addition to advice and education for hip osteoarthritis (HIT trial): single blind, parallel group, three arm, randomised controlled trial. BMJ. 2022;377:e068446. https://doi.org/10.1136/bmj-2021-068446.
Yoshimura S, Sakai N, Yamagami H, Uchida K, Beppu M, Toyoda K, et al. Endovascular therapy for acute stroke with a large ischemic region. N Engl J Med. 2022;386(14):1303–13. https://doi.org/10.1056/NEJMoa2118191. United States.
Pérez de la Ossa N, Abilleira S, Jovin TG, García-Tornel Á, Jimenez X, Urra X, et al. Effect of direct transportation to thrombectomy-capable center vs local stroke center on neurological outcomes in patients with suspected large-vessel occlusion stroke in nonurban areas: the RACECAT randomized clinical trial. JAMA. 2022;327(18):1782–94. https://doi.org/10.1001/jama.2022.4404.
Bösel J, Niesen WD, Salih F, Morris NA, Ragland JT, Gough B, et al. Effect of early vs standard approach to tracheostomy on functional outcome at 6 months among patients with severe stroke receiving mechanical ventilation: the SETPOINT2 randomized clinical trial. JAMA. 2022;327(19):1899–909. https://doi.org/10.1001/jama.2022.4798.
Perry DC, Achten J, Knight R, Appelbe D, Dutton SJ, Dritsaki M, et al. Immobilisation of torus fractures of the wrist in children (FORCE): a randomised controlled equivalence trial in the UK. Lancet. 2022;400(10345):39–47. https://doi.org/10.1016/S0140-6736(22)01015-7. England.
Fischer U, Kaesmacher J, Strbian D, Eker O, Cognard C, Plattner PS, et al. Thrombectomy alone versus intravenous alteplase plus thrombectomy in patients with stroke: an open-label, blinded-outcome, randomised non-inferiority trial. Lancet. 2022;400(10346):104–15. https://doi.org/10.1016/S0140-6736(22)00537-2. England.
Mitchell PJ, Yan B, Churilov L, Dowling RJ, Bush SJ, Bivard A, et al. Endovascular thrombectomy versus standard bridging thrombolytic with endovascular thrombectomy within 4\(\cdot\)5 h of stroke onset: an open-label, blinded-endpoint, randomised non-inferiority trial. Lancet. 2022;400(10346):116–25. https://doi.org/10.1016/S0140-6736(22)00564-5. England.
Wu YW, Comstock BA, Gonzalez FF, Mayock DE, Goodman AM, Maitre NL, et al. Trial of erythropoietin for hypoxic-ischemic encephalopathy in newborns. N Engl J Med. 2022;387(2):148–59. https://doi.org/10.1056/NEJMoa2119660. United States.
Menon BK, Buck BH, Singh N, Deschaintre Y, Almekhlafi MA, Coutts SB, et al. Intravenous tenecteplase compared with alteplase for acute ischaemic stroke in Canada (AcT): a pragmatic, multicentre, open-label, registry-linked, randomised, controlled, non-inferiority trial. Lancet. 2022;400(10347):161–9. https://doi.org/10.1016/S0140-6736(22)01054-6. England.
Valenta Z, Pitha J, Poledne R. Proportional odds logistic regression—effective means of dealing with limited uncertainty in dichotomizing clinical outcomes. Stat Med. 2006;25(24):4227–34.
Saver JL. Novel end point analytic techniques and interpreting shifts across the entire range of outcome scales in acute stroke trials. Stroke. 2007;38(11):3055–62.
Fullerton AS, Xu J. The proportional odds with partial proportionality constraints model for ordinal response variables. Soc Sci Res. 2012;41(1):182–98.
Faraway JJ. On the cost of data analysis. J Comput Graph Stat. 1992;1(3):213–29.
Clogg CC, Shihadeh ES. Statistical models for ordinal variables. AGE Publications; 1994.
McCullagh P. Generalized linear models. Routledge; 2019.
Crans GG, Shuster JJ. How conservative is Fisher’s exact test? A quantitative evaluation of the two-sample comparative binomial trial. Stat Med. 2008;27(18):3598–611.
Selman CJ. Statistic analyses of ordinal outcomes in RCTs: scoping review data. GitHub. 2023. https://github.com/chrisselman/ordscopingreview. Accessed 31 May 2023.
Acknowledgements
Not applicable.
Funding
This work forms part of Chris Selman’s PhD, which is supported by the Research Training Program Scholarship, administered by the Australian Commonwealth Government and The University of Melbourne, Australia. Chris Selman’s PhD was also supported by a Centre of Research Excellence grant from the National Health and Medical Research Council of Australia ID 1171422, to the Australian Trials Methodology (AusTriM) Research Network. Research at the Murdoch Children’s Research Institute is supported by the Victorian Government’s Operational Infrastructure Support Program. This work was supported by the Australian National Health and Medical Research Council (NHMRC) Centre for Research Excellence grants to the Victorian Centre for Biostatistics (ID1035261) and the Australian Trials Methodology Research Network (ID1171422), including through seed funding awarded to Robert Mahar. Katherine Lee is funded by an NHMRC Career Development Fellowship (ID1127984). Brett Manley is funded by the NHMRC Investigator Grant (Leadership 1). The funding bodies played no role in the study conception, design, data collection, data analysis, data interpretation, or writing of the report.
Author information
Authors and Affiliations
Contributions
CJS, RKM, KJL, CLW, and BJM conceived the study and CJS wrote the first draft of the manuscript. All authors contributed to the design of the study, revision of the manuscript, and take responsibility for its content.
Corresponding author
Ethics declarations
Ethics approval and consent to participate
As data and information was only extracted from published studies, ethics approval was not required.
Consent for publication
Not applicable.
Competing interests
The authors declare that they have no competing interests.
Additional information
Publisher's Note
Springer Nature remains neutral with regard to jurisdictional claims in published maps and institutional affiliations.
Supplementary information
Additional file 1.
Deviations from the protocol. This presents a summary of the deviations from the protocol, with reasons. We also provide an explanation of any simplifications and assumptions that were made for eligibility criteria and data extraction.
Additional file 2.
Data extraction questionnaire. This is a copy of the data extraction questionnaire that will be used for this review in PDF format.
Additional file 3.
Interpretation of the proportional odds ratio in proportional odds models. This presents a summary of the ways that the proportional odds ratio was interpreted across the studies.
Rights and permissions
Open Access This article is licensed under a Creative Commons Attribution 4.0 International License, which permits use, sharing, adaptation, distribution and reproduction in any medium or format, as long as you give appropriate credit to the original author(s) and the source, provide a link to the Creative Commons licence, and indicate if changes were made. The images or other third party material in this article are included in the article's Creative Commons licence, unless indicated otherwise in a credit line to the material. If material is not included in the article's Creative Commons licence and your intended use is not permitted by statutory regulation or exceeds the permitted use, you will need to obtain permission directly from the copyright holder. To view a copy of this licence, visit http://creativecommons.org/licenses/by/4.0/. The Creative Commons Public Domain Dedication waiver (http://creativecommons.org/publicdomain/zero/1.0/) applies to the data made available in this article, unless otherwise stated in a credit line to the data.
About this article

Cite this article
Selman, C.J., Lee, K.J., Ferguson, K.N. et al. Statistical analyses of ordinal outcomes in randomised controlled trials: a scoping review. Trials 25, 241 (2024). https://doi.org/10.1186/s13063-024-08072-2
Received:
Accepted:
Published:
DOI: https://doi.org/10.1186/s13063-024-08072-2