
Abstract
Background
Time-restricted feeding is an emerging dietary intervention that is becoming increasingly popular. There are, however, no randomised clinical trials of time-restricted feeding in overweight patients with type 2 diabetes. Here, we explored the effects of time-restricted feeding on glycaemic regulation and weight changes in overweight patients with type 2 diabetes over 12 weeks.
Methods
Overweight adults with type 2 diabetes (n = 120) were randomised 1:1 to two diet groups: time-restricted feeding (n = 60) or control (n = 60). Sixty patients participated in a 10-h restricted feeding treatment program (ad libitum feeding from 8:00 to 18:00 h; fasting between 18:00 and 8:00 h) for 12 weeks.
Results
Haemoglobin A1c and body weight decreased in the time-restricted feeding group (− 1.54% ± 0.19 and − 2.98 ± 0.43 kg, respectively) relative to the control group over 12 weeks (p < 0.001). Homeostatic model assessment of β-cell function and insulin resistance changed in the time-restricted feeding group (0.73 ± 0.21, p = 0.005; − 0.51 ± 0.08, p = 0.02, respectively) compared with the control group. The medication effect score, SF-12 score, and the levels of triglycerides, total cholesterol and low-density lipoprotein cholesterol were improved in the time-restricted feeding group (− 0.66 ± 0.17, p = 0.006; 5.92 ± 1.38, p < 0.001; − 0.23 ± 0.08 mmol/L, p = 0.03; − 0.32 ± 0.07 mmol/L, p = 0.01; − 0.42 ± 0.13 mmol/L, p = 0.02, respectively) relative to the control group. High-density lipoprotein cholesterol was not significantly different between the two groups.
Conclusion
These results suggest that 10-h restricted feeding improves blood glucose and insulin sensitivity, results in weight loss, reduces the necessary dosage of hypoglycaemic drugs and enhances quality of life. It can also offer cardiovascular benefits by reducing atherosclerotic lipid levels.
Trial registration: This study was registered with the Chinese Clinical Trial Registry (ChiCTR-IPR-15006371).
Introduction
Diabetes mellitus has become an important global public health issue; it imposes a huge economic burden on the global healthcare system of $827 billion a year. Approximately 90% of people with diabetes have type 2 diabetes, which is often associated with being overweight or obese. This crisis will continue until a solution is found [1, 2]. In fact, the early observation linking calorie restriction (CR) to improved health is now a century old. McCay found that pups fed a limited diet lived longer than pups fed randomly [3]. The positive effects of CR on longevity and health have been demonstrated in many model organisms, such as fruit flies, mice and primates [4,5,6]. In addition, CR interventions can prevent and treat a variety of metabolic disorders, including diabetes [7,8,9].
While CR has many benefits, this type of diet may be difficult because it requires a vigilant daily calorie count [10]. Intermittent fasting, as an alternative to calorie restriction, has become increasingly popular over the past few decades [11, 12]. Intermittent fasting is divided into three subtypes [13]: alternate-day fasting, the 5:2 diet, and time-restricted feeding (TRF). Alternate-day fasting is defined as alternating between "fasting days" and “free feast days". The 5:2 diet involves fasting for just two days a week, followed by five free eating days. These two diets require a strict calorie count on fasting days and a calorie limit of 800 kcal. Unlike these two diets, time-limited feeding (TRF) does not require individuals to deliberately count calories and monitor food intake. TRF only restricts eating time to 4–12 h per day, where one does not consume any calories during the remaining hours of the day [14]. Therefore, as an emerging dietary strategy, TRF has attracted great attention.
To date, more than a dozen animal studies have examined the effects of TRF on metabolic disease [15, 16]. Gill [17] subjected Drosophila melanogaster adults to 12-h TRF of a standard cornmeal diet for 5 weeks. Their endurance, motor control and cardiac function improved significantly. For cafeteria diet-induced obesity in rats, the 8-h TRF regimen for 16 weeks is an effective strategy to enhance body weight gain, lipid profiles, and atherogenic indices [18]. In mutant mice, 10-h TRF for 12 weeks prevented obesity and metabolic syndrome [19]. Mice fed 8-h TRF for 16 weeks were protected against obesity, hyperinsulinemia, hepatic steatosis, and inflammation, and their motor coordination was improved [20]. Thus, TRF has multiple metabolic benefits, preventing chronic disease in mice and flies and, more importantly, reversing the consequences of obesity [21] and aging [22].The beneficial effects were also evident in high-fat fed mice when TRF was administered 5 days a week and free access to food was allowed on weekends [23].
The effects of TRF in humans have been poorly studied. To date, TRF has been studied in only seven human trials [24,25,26,27,28,29,30]. Human data on the benefits of TRF have focused on healthy humans who are overweight or obese [24, 25] [28,29,30]. Studies in overweight people showed that 10–12-h TRF for 10 weeks decreased fat mass and fasting plasma glucose concentration [29], and 10-h TRF for 12 weeks reduced visceral fat [30]. However, few studies have been performed on people with metabolic disorders. A single-arm trial in people with metabolic syndrome supported that 10-h TRF for 12 weeks induced reductions in body weight, adiposity, lipaemia and blood pressure [27]. In men with prediabetes in a crossover study, 6-h TRF for 5 weeks reduced signs of IR [26].
However, TRF as a behavioural intervention has never been studied in patients with type 2 diabetes. It is not known whether patients who have already received pharmacotherapy can benefit from adopting TRF. Previous studies have shown that further narrowing of the feeding window brings no additional benefits [28]. Therefore, we designed a 12-week 10-TRF intervention in overweight patients with type 2 diabetes. We hypothesised that 10-h TRF would improve blood glucose levels. It is also not known whether the types and amounts of antidiabetic drugs could be reduced or even stopped after adopting TRF as a therapy.
Our research is the first randomised controlled clinical trial to explore the effect of TRF on type 2 diabetes. We hypothesised that compared with the control condition, a 10-h TRF intervention for 12 weeks would result in a greater improvement in glucose regulation and insulin sensitivity. We also anticipated weight loss and improvements in cardiovascular disease (CVD) risk markers, such as atherogenic lipid levels. Finally, we expected that the 10-h TRF group would have better quality of life and require fewer medications.
Methods
Patients
Researchers recruited subjects from diabetes clinics by placing advertisements around the Zhu Xianyi Hospital of Tianjin Medical University. Participants were screened by questionnaire and body mass index (BMI) assessment. A total of 137 participants (Fig. 1) provided consent and were evaluated for eligibility. Of these, 17 were excluded according to the inclusion and exclusion criteria. The inclusion criteria were as follows: type 2 diabetes according to the WHO's 1999 Diabetes Diagnostic Criteria; BMI ≥ 25 kg/m2; age between 18 and 70 years; stable weight for 3 months prior to the beginning of the study (gain or loss < 2 kg); and ability to complete this study independently. The exclusion criteria were as follows: previous weight loss surgery; pregnancy or intent to become pregnant; moderate or severe chronic hepatorenal diseases or cardio-cerebrovascular diseases; current acute complications of diabetes, such as diabetic ketosis, hyperglycaemia and hypertonicity; in the past 3 months, stress diseases such as surgery, trauma, and cardiovascular and cerebrovascular events; and mental disorders requiring antipsychotic drugs.
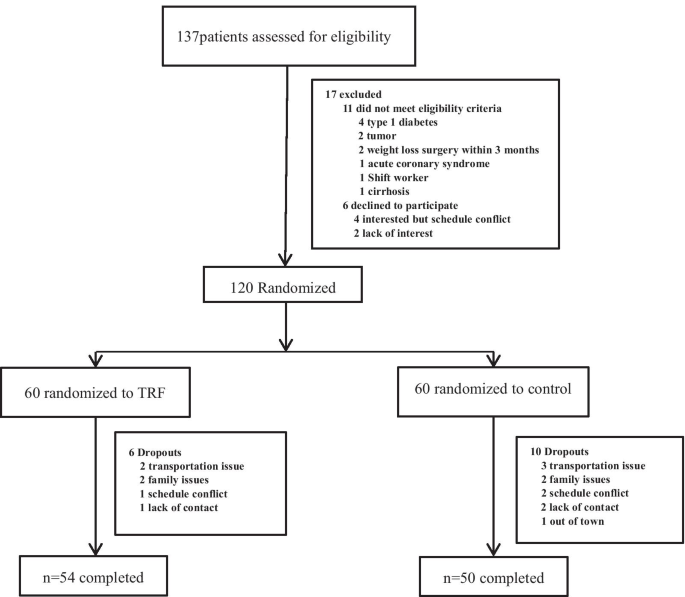
Flow diagram of the study participants from eligibility criteria screening to study completion. A total of 137 people were screened, of whom 17 were excluded based on the inclusion and exclusion criteria. A total of 120 participants were randomly assigned to a 10-h TRF or a control group. At the end of the trial, 54 participants in the 10-h TRF group had completed treatment, and 50 participants in the control group had completed treatment
The study started in APR 2019 and was completed by December 2019. The clinical trial number is ChiCTR-IPR-15006371. The experimental protocol was approved by the Ethics Committee of Tianjin Medical University, and all research participants provided written informed consent to participate in the trial. The study was conducted in accordance with the Helsinki Declaration of 1964 and its subsequent amendments.
Randomisation and bias minimisation
Patients were assigned in a 1:1 ratio to the TRF therapy or control group. Assignment of treatment groups was based on a serially numbered label created using an electronic random number generator. The labels were placed in corresponding numbered opaque envelopes by the statistician who did not participate in the inclusion of patients or the subsequent experimental process. Investigators were masked to group allocation, but masking to the TRF intervention implementer was not possible. There was an independent assessment team, and none of the assessment staff were informed of the assignment of participants. Clinical tests were conducted in separate buildings, and participants were often reminded to not disclose their grouping to the assessors. Trial groups were masked for the analysis by an independent statistician, and those performing the analysis were unaware of the group allocation.
Experimental design
A 14-week trial was conducted to compare the influences of 10-h TRF with those of the control condition. The trial consisted of a 2-week baseline weight stabilisation period and a 12-week TRF intervention period. The 10-h TRF group fed freely from 8:00 to 18:00 and fasted from 18:00 to 8:00 daily (a 14-h fast) (Fig. 2) in the 12-week intervention. TRF participants did not need to restrict caloric intake during the feeding window. In the fasting period, TRF participants are only allowed to intake water or tea without any calories. The control group was asked to maintain their normal diet throughout the trial. However, to prevent any investigator interaction bias, the frequency at which the control group visited the research centre was the same as that of the 10-h TRF group.
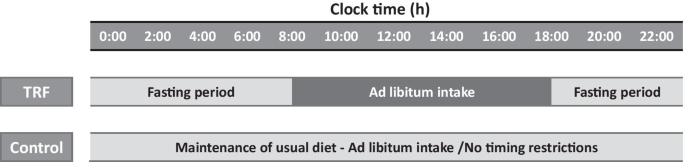
A time-limited feeding intervention was administered for 12 weeks. The 10-h TRF group was free to eat from 8:00 to 18:00 every day (fasting for 14 h). The control group was instructed to continue their usual eating pattern without any time restrictions on eating
Medication management
Drug management protocols were developed by endocrinologists. All participants were supervised by intervention implementers in consultation with endocrinologists. All participants were given capillary blood glucose metres. All participants were asked to measure their blood glucose levels at their fingers at their daily fasting and before going to bed. If the fasting or bedtime finger blood glucose reading was less than 8 mmol/L, the participant had their insulin reduced by approximately 4 units per day. The dose of insulin did not change if the blood glucose reading was higher than 8 mmol/L and less than 9 mmol/L. If the blood glucose level was higher than 9 mmol/L, the endocrinologist adjusted the participant’s medication. To reduce bias, endocrinologists did not know the group of the participant. Participants were asked to contact an implementer immediately if their blood sugar levels fell below 3.9 mmol/L. Implementers consulted with endocrinologists over the phone to make changes. Doses were recorded daily, and changes were quantified using the medication efficacy score (MES) [31]. The MES was calculated as (actual drug dose/maximum drug dose) × drug mean adjustment factor. A smaller MES corresponded to a reduced dose of diabetes medication. For example, an MES change of 0.5 is equivalent to a decrease of 1000 mg of metformin hydrochloride.
Outcome measures
The primary outcomes were haemoglobin A1c (HbA1c), fasting plasma glucose and body weight. The secondary outcomes were homeostatic model assessment of β-cell function (HOMA-β), insulin resistance (HOMA-IR), MES, SF-12 score, adverse events and cardiovascular risk lipid markers (including triglycerides, total cholesterol, low-density lipoprotein (LDL) cholesterol and high-density lipoprotein (HDL) cholesterol.
Body weight and BMI
Body weight was assessed to the nearest 0.1 kg of participants without shoes and in light clothing using a digital scale (Shanghai Yaohua, XK3190-A12+E). Height was evaluated using a sitting height metre (Shanghai Keda, TZG) to the nearest 1 cm. BMI was calculated as weight (kg)/height (m)2.
Adherence to the TRF protocols
A daily log was used to measure adherence by having each participant record the time at which caloric intake was started and stopped every day. If the records showed that the participant ate only within the given 10 h, that day was marked as "consistent." If the records showed eating outside of the arranged 10-h feeding window, that day was marked as "non-consistent." The number of days per week was used to assess compliance with the TRF diet. Throughout the pilot period, TRF participants met weekly with the research supervisor. At each meeting, the research director reviewed their dietary adherence records, highlighted the importance of eating and addressed any problems they observed to improve compliance.
Blood analyses
All fasting blood analyses were conducted at baseline (week 1 of the study) and at 12 weeks (week 14 of the study). Fasting plasma glucose, insulin, HbA1c, triglycerides, total cholesterol, LDL cholesterol and HDL cholesterol concentrations were measured by the laboratory of Zhu Xianyi Hospital. β-cell function and IR were assessed using the homeostasis model assessment (HOMA) method by applying the following formulas: [HOMA-β = 20 × fasting insulin (mlU/ml)/(fasting glucose -3.5)] and [HOMA-IR = fasting insulin (mlU/ml) × fasting glucose (mmol/L)/22.5].
Sleep analysis
Sleep data were collected by means of a self-administered questionnaire.
Dietary intake and physical activity
A seven-day diet record was completed at baseline and the end of the trial. A nutritionist provided guidance on how to estimate portion sizes and keep detailed food records to obtain accurate dietary intake. Participants were asked to calculate the amount of food consumed using household measurement tools (i.e., a cup or spoon). The time of eating was also logged in the food record. Another nutritionist calculated the total for the day. The physical activity level of all participants was asked to be maintained throughout the trial. To avoid hypoglycaemia, participants in the TRF group were asked to exercise outside of the fasting window. Steps were measured using a belt-mounted pedometer, which participants had to wear at all times.
Statistical analysis
We hypothesised that the 10-h TRF group would drop 5% of their body weight and that the control group would lose 2% after 12 weeks to calculate the sample size [24]. If 90% power was anticipated to discover a distinct superiority of 3% of body weight for the 10-h TRF group patients, n = 23 participants per group was calculated. We estimated a dropout rate of 20%. Thus, we assumed that 58 patients (n = 29 each group) would finish the clinical trial. However, we recruited 120 participants (n = 60 per group), which was a relatively large sample.
Outcome analyses used the intention-to-treat principle and involved all participants in the group to which they were randomised. The normality tests were conducted in the model, and nonnormally distributed data were converted into a normal distribution by natural logarithm and then analysed statistically. Independent samples t tests and Pearson χ2 tests were used to analyse differences between groups at baseline. To determine the effects of time-restricted feeding, we used repeated measures analysis of variance. Pearson correlation was used to determine independent factors associated with major outcome measures. Analyses were performed using SPSS, version 25 (IBM Corp., Armonk, NY, USA), and the data are shown as the mean (standard error of the mean). A 2-tailed p < 0.05 was considered significant.
Results
Participants
As shown in Fig. 2, 137 participants were recruited to the study. Of those, 11 were excluded based on the inclusion and exclusion criteria. Four patients were interested, but their schedules conflicted, and two patients lost interest later. The specific items for the inclusion or exclusion criteria are described in the Methods section. A total of 120 patients were randomised into the 10-h TRF group (n = 60) or the control group (n = 60). A total of 54 participants in the 10-h TRF group and 50 in the control group completed the study. No one withdrew from the study because they did not like the TRF intervention (Fig. 1). Table 1 indicates the baseline characteristics of all participants and completers. At baseline, in all participant and completion analyses, there was no significant difference between the 10-h TRF group and the control group in terms of primary outcome measures or any secondary outcome measure. There were also no significant differences in sleep duration or physical activity, which may lead to bias.
Adherence to eating pattern and adverse effects
At baseline, the average eating window was not notably different (p = 0.62) between the 10-h TRF (15.02 ± 1.23 h) and control (15.24 ± 1.41 h) groups. The eating window was significantly reduced by 29.49% (4.43 ± 1.16 h) compared with the baseline value (p < 0.001). Compliance with the TRF intervention was excellent (Additional file 1: Figure S1). TRF participants adhered to the intervention by delaying the time of their first caloric intake and consuming their last calories at an earlier time in the day. The first caloric intake was delayed by 2.01 ± 1.18 h, and their last caloric intake was advanced by 2.51 ± 1.27 h relative to baseline. Mean daily caloric intake, which was self-reported and estimated, decreased △ = − 531 ± 102 kcal/d [28%] in the 10-h TRF group compared with the control group △ = − 76 ± 42 kcal/d [5%], p < 0.05 (Table 2). Regarding adverse effects, participants in the 10-h TRF intervention group did not experience any adverse events, including headaches, thirst, and diarrhoea. The number of hypoglycaemic events was one in the control group; there were no hypoglycaemic events in the TRF group.
Glucose regulation and body weight
As shown in Table 3 and Fig. 3, after 12 weeks of intervention, TRF, compared with the control, resulted in a significant reduction in HbA1c (− 1.54% ± 0.19 mmol/L [18%] vs. − 0.66% ± 0.16 mmol/L [8%]; p < 0.001), FPG (− 1.47 ± 0.25 mmol/L [15%] vs. − 0.78 ± 0.21 mmol/L [8%], p < 0.001), body weight (− 2.98 ± 0.43 kg [4%] vs. 0.83 ± 0.32 kg [1%], p < 0.001), BMI (− 1.64 ± 0.38 kg/m2 [6%] vs. 0.42 ± 0.24 kg/m2 [2%], p < 0.001) and HOMA-IR (− 0.51 ± 0.08 [14%] vs. − 0.12 ± 0.06 [3%], p = 0.02) and a significant increase in HOMA-β (0.73 ± 0.21% [24%] vs. 0.27 ± 0.10 [9%], p = 0.005).
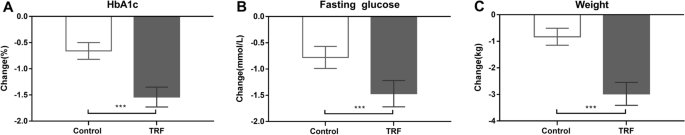
Effects of the 12-week TRF (54 participants) or control (50 participants) conditions on HbA1c, fasting glucose and weight. A, B and C display the data as the raw means ± SDs. ***p < 0.001, obtained from repeated measures ANOVA
Weight change directly correlated with HbA1c change between baseline and 12 weeks (r = 0.5, p = 0.01).
Medication and SF-12 score
Measures of change in MES and SF-12 from baseline to the 12-week follow-up are presented in Table 3. Compared with the control, TRF resulted in a more significant reduction in the total MES (− 0.66 ± 0.17 [31%] vs. − 0.21 ± 0.04 [10%]; p = 0.006). The MES for oral hypoglycaemic agents in the TRF group decreased more (△ = − 0.33 ± 0.27, [19%]) than that in the control group (△ = − 0.09 ± 0.24, [5%], p < 0.001), which did not correlate with HbA1c (r = − 0.1; p = 0.34). The MES insulin change was similar in the TRF group (△ = − 0.32 ± 0.26, [16%]) and the control group (△ = − 0.11 ± 0.24, [6%], p < 0.001), which also did not account for any difference in HbA1c (r = − 0.2; p = 0.20).
The change in SF-12 score at 12 weeks was notably different (p < 0.001) between the TRF group (△ = 5.92 ± 1.38, [9%]) and the control group (△ = 1.71 ± 1.41 mmol/L, [3%]).
CVD risk markers
Measures of the change in CVD risk markers from baseline to the 12-week follow-up are presented in Table 3. After 12 weeks of intervention, TRF, compared with the control, resulted in a significant reduction in TGs (− 0.23 ± 0.08 mmol/L, [9%] vs. 0.13 ± 0.06 mmol/L, [5%]; p = 0.03), TC (− 0.32 ± 0.07 mmol/L [6%] vs. − 0.15 ± 0.06 mmol/L [3%], p = 0.01) and LDL-c (− 0.42 ± 0.13 mmol/L [11%] vs. − 0.21 ± 0.13 mmol/L [6%], p = 0.02). However, TRF did not affect the level of HDL-c (− 0.16 ± 0.04 mmol/L vs. − 0.15 ± 0.05 mmol/L, p = 0.33).
Activity
Step count remained below baseline levels at 12 weeks in the TRF group and the control group. Despite this, the total step count remained similar in both groups at 12 weeks (6139.28 ± 288.32 steps in the TRF group vs. 6272.23 ± 223.45 steps in the control group; p = 0.62). The activity change between baseline and 12 weeks did not correlate with weight change (r = − 0.07; p = 0.41).
Discussion
This study is the first to test the effects of TRF on weight, blood sugar, and CVD risk factors in overweight patients with type 2 diabetes. Furthermore, we designed a randomized controlled trial, which provides a relatively higher level of evidence, and included type 2 diabetes patients treated only with medication as a control group and an intervention group with TRF as the treatment. Our results showed that the control group had slight improvements in related indicators due to medications, while the TRF group had more significant improvements, which was consistent with our expectations.
To our knowledge, no study has explored the effect of 10-h TRF on type 2 diabetes; thus, there are no data for comparison with our findings. Only a few trials have studied the effect of TRF on weight in obese patients. A recent 8-h TRF study reported a 2.6% weight loss after 12 weeks [24]. Similarly, 10-h TRF resulted in a 3.6% weight loss over 16 weeks [25] and a 3.0% weight decrease after 12 weeks [27]. Compared with the effects of calorie restriction with exercise in patients with glucose intolerance, the degree of weight loss observed in our trial with TRF (additional 3% reduction) was consistent. These studies found weight loss rates of 1% [32] and 3% [33]. Regarding glucose regulation, Wei tested another form of intermittent fasting (fasting mimicking diet) and reported that when the baseline fasting plasma glucose was > 5.5 mmol/L, a reduction was observed in the fasting plasma glucose [34]. However, Hutchison reported no change in fasting glucose levels among healthy overweight people after TRF [35]. Additionally, a 6-h TRF intervention in overweight prediabetic patients did not alter fasting glucose levels but did increase insulin sensitivity and β-cell function [26]. Do patients at high risk of more severe metabolic diseases benefit more from TRF than those at low risk? Our findings suggest an answer to this question. In our trial, the fasting plasma glucose level in type 2 diabetes patients was 9.73 ± 1.38 mmol/L at baseline. TRF intervention decreased fasting glucose levels by 15% and HbA1c values by 18%, approximately twice the effect of medicine, which surprised us. Moreover, notable improvements were detected in HOMA-β and HOMA-IR. However, these parameters were evaluated as short-term effects, and further research is needed to determine the long-term effects.
The degree of MES observed in our study with TRF (mean, − 31% from baseline) was greater than that in studies examining the effects of 5:2 intermittent fasting (2 nonconsecutive days/week and their usual diet for 5 days/week) with type 2 diabetes, which reported MES declines of 22% [36] and 25% [37]. Our study achieved a better result, which may be due to the presence of more severe metabolic disorders because the HbA1c baseline level was 7.3 ± 0.1% and 7.5 ± 1.4% in the two previous trials, respectively. To our surprise, compared with the MES in the control group, that in the experimental group was reduced by an additional 21%. This finding is meaningful for diabetic patients. In addition, our research showed that the TRF intervention improved the overall SF-12 score of the experimental group participants by 9%. The SF-12 [38] is a 12-item health questionnaire used to assess several areas of health-related quality of life, including physical health, mental health, and general health perceptions. This indicator has a score ranging from 0 to 100, with higher scores indicating better health. Our study indicates that the TRF intervention improved people's perception of physical function and daily activity.
The improvement in blood glucose was positively associated with changes in lipids. Therefore, we hypothesised that the level of dyslipidaemia would gradually recover with the reduction in blood sugar levels. In our study, none of the participants used statins or fibrates. Total cholesterol, triglycerides and LDL cholesterol in the control group decreased by 5%, 3% and 6%, respectively. However, the reduction in the TRF group was almost twice that in the control group. There were obvious reductions in triglycerides (9%), total cholesterol (6%), and LDL cholesterol (11%) in the TRF group of this study. The effect of intermittent fasting on blood lipids varies widely. Most studies have shown no effect on blood lipid indicators [24, 39]. HDL cholesterol is also not affected by these diets, although one study observed a slight increase [40]. Neither 4-h TRF nor 6-TRF intervention affected blood lipid levels in obese adults at week 8 [28]. However, it is important to note that the participants in these reports did not have hyperlipidaemia. In a recent study exploring 10-h TRF in patients with metabolic syndrome, the single-arm trial revealed decreases in total cholesterol (7%) and LDL-C (11%) compared with baseline. The results in our experiment were comparable to those of this trial.
Many people are concerned with adverse effects. One crossover 6-h TRF study included reports of detected vomiting (n = 1), headache, diarrhoea, and increased thirst (n = 2) [26]. Another study on 8-h TRF reported a nonsignificant increase in the incidence of adverse events, such as nausea, diarrhoea and dizziness [41]. Additionally, 10-h TRF in individuals with metabolic syndrome was associated with muscle discomfort (n = 1), which was considered unrelated to the experiment [27]. Participants in our trial of 10-h TRF intervention did not experience any of these adverse events. The number of hypoglycaemic events was zero in the TRF group. In our study, adherence to the TRF intervention was very good.
There are several hypotheses about the mechanism of TRF-induced metabolic benefits. One study observed that restriction of feeding could prevent weight gain, dyslipidaemia and fatty liver disease by reversing the phase of clock genes in peripheral organs in mice [42]. However, other studies found that natural eating patterns only weakly affect the body clock. Instead, in normally fed mice, the central pacemaker in the brain may phase the peripheral organs through pathways unrelated to feeding behaviour. Results in rats and mice showed that food rhythm is not necessary to support in sync peripheral organs [43], and in the absence of food rhythm, adrenaline connects the central and peripheral clock signal [44]. The results of human studies have also yielded no positive results. A crossover study compared the effects of early (8 am to 5 pm) and late (12 pm to 9 pm) time-restricted eating on glucose tolerance. The authors demonstrated that time-limited feeding improved glycaemic responses regardless of mealtime (late or early) [35]. In a study by Gill S [25], no additional effect of daily feeding time was observed, but the benefits of TRF were found to be due to energy restriction, which is consistent with our study. Our results showed that 10 h of daily eating reduced caloric intake without deliberate caloric counting. As a result, the participants in the TRF group lost approximately 4% of their bodyweight and showed improvements in other indicators, which was consistent with Gabel K [24] and Cienfuegos S [28]. If TRF can inadvertently lead to reduced calorie intake under normal conditions, it is a relatively attractive way to reduce calorie intake because individuals and doctors do not need to employ expensive and laborious methods to accurately track calories. Therefore, TRF is an effective way to improve health.
Limitations
This study has several limitations. First, although this was a study with a relatively large sample, the sample size could be further expanded. Second, the time of intervention was short, and further follow-up is needed to observe the long-term results of TRF. Third, a subgroup design was not implemented for the legacy effect of TRF in our study. Fourth, the BMIs of the patients in this study were relatively low, and racial restrictions may have limited wider global use. Fifth, self-reports, such as food records and adherence to the intervention, were included. Last, we did not design a crossover study. A crossover trial has the advantages of self-matching, such as reducing the impact of individual differences on processing factors.
Conclusion
Our research is the first randomised controlled trial to explore the effects of TRF in humans with type 2 diabetes. Our study showed that 10-h TRF reduced body weight and blood glucose and improved insulin sensitivity in overweight patients with type 2 diabetes. These results occurred without deliberate attempts to increase physical activity and change the quality or quantity of diet. Importantly, we also found significant improvement in CVD risk markers (triglycerides, total cholesterol and LDL cholesterol) without the use of stains or fibrates. Additionally, when all of the above indicators were significantly controlled, after the TRF intervention, the dosage of hypoglycaemic drugs in the experimental group of participants was significantly reduced, and their perception of physical functions and daily activities were improved. Furthermore, the good compliance, high level of adherence to TRF, and low dropout rate in our study indicate that the 10-h window for TRF may be feasible for patients with type 2 diabetes to follow.
Availability of data and materials
The datasets used during the present study are available from the corresponding author upon reasonable request.
Abbreviations
- BMI:
-
Body mass index
- FPG:
-
Fasting plasma glucose
- HbA1c:
-
Haemoglobin A1c
- HOMA-β:
-
Homeostasis model of assessment-estimated β function
- HOMA-IR:
-
Homeostasis model of assessment-estimated insulin resistance
- HDL:
-
High-density lipoprotein
- LDL:
-
Low-density lipoprotein
- MES:
-
Medication effects score
- OHA:
-
Oral hypoglycaemic agents
- TG:
-
Triglyceride
- TC:
-
Total cholesterol
References
Schmidt AM. Highlighting diabetes mellitus: the epidemic continues. Arterioscler Thromb Vasc Biol. 2018;38:e1–8.
Colagiuri S, Lee CM, Colagiuri R, Magliano D, Shaw JE, Zimmet PZ, Caterson ID. The cost of overweight and obesity in Australia. Med J Aust. 2010;192:260–4.
McCay CM, Crowell MF, Maynard LA. The effect of retarded growth upon the length of life span and upon the ultimate body size. 1935. Nutrition. 1989;5:155–71 (discussion 172).
Bruce KD, Hoxha S, Carvalho GB, Yamada R, Wang HD, Karayan P, He S, Brummel T, Kapahi P, Ja WW. High carbohydrate-low protein consumption maximizes Drosophila lifespan. Exp Gerontol. 2013;48:1129–35.
Speakman JR, Mitchell SE, Mazidi M. Calories or protein? The effect of dietary restriction on lifespan in rodents is explained by calories alone. Exp Gerontol. 2016;86:28–38.
Mattison JA, Colman RJ, Beasley TM, Allison DB, Kemnitz JW, Roth GS, Ingram DK, Weindruch R, de Cabo R, Anderson RM. Caloric restriction improves health and survival of rhesus monkeys. Nat Commun. 2017;8:14063.
Zubrzycki A, Cierpka-Kmiec K, Kmiec Z, Wronska A. The role of low-calorie diets and intermittent fasting in the treatment of obesity and type-2 diabetes. J Physiol Pharmacol. 2018;69:10–26402.
Goday A, Bellido D, Sajoux I, Crujeiras AB, Burguera B, Garcia-Luna PP, Oleaga A, Moreno B, Casanueva FF. Short-term safety, tolerability and efficacy of a very low-calorie-ketogenic diet interventional weight loss program versus hypocaloric diet in patients with type 2 diabetes mellitus. Nutr Diabetes. 2016;6:e230.
Taylor R. Calorie restriction for long-term remission of type 2 diabetes. Clin Med (Lond). 2019;19:37–42.
Das SK, Gilhooly CH, Golden JK, Pittas AG, Fuss PJ, Cheatham RA, Tyler S, Tsay M, McCrory MA, Lichtenstein AH, et al. Long-term effects of 2 energy-restricted diets differing in glycemic load on dietary adherence, body composition, and metabolism in CALERIE: a 1-y randomized controlled trial. Am J Clin Nutr. 2007;85:1023–30.
de Cabo R, Mattson MP. Effects of intermittent fasting on health, aging, and disease. N Engl J Med. 2019;381:2541–51.
Grajower MM, Horne BD. Clinical management of intermittent fasting in patients with diabetes mellitus. Nutrients. 2019;11:473.
Welton S, Minty R, O’Driscoll T, Willms H, Poirier D, Madden S, Kelly L. Intermittent fasting and weight loss: systematic review. Can Fam Phys. 2020;66:117–25.
Chaix A, Manoogian ENC, Melkani GC, Panda S. Time-restricted eating to prevent and manage chronic metabolic diseases. Annu Rev Nutr. 2019;39:291–315.
Rothschild J, Hoddy KK, Jambazian P, Varady KA. Time-restricted feeding and risk of metabolic disease: a review of human and animal studies. Nutr Rev. 2014;72:308–18.
Melkani GC, Panda S. Time-restricted feeding for prevention and treatment of cardiometabolic disorders. J Physiol. 2017;595:3691–700.
Gill S, Le HD, Melkani GC, Panda S. Time-restricted feeding attenuates age-related cardiac decline in Drosophila. Science. 2015;347:1265–9.
Aouichat S, Chayah M, Bouguerra-Aouichat S, Agil A. Time-restricted feeding improves body weight gain, lipid profiles, and atherogenic indices in cafeteria-diet-fed rats: role of browning of inguinal white adipose tissue. Nutrients. 2020;12:2185.
Chaix A, Lin T, Le HD, Chang MW, Panda S. Time-restricted feeding prevents obesity and metabolic syndrome in mice lacking a circadian clock. Cell Metab. 2019;29:303-319.e304.
Hatori M, Vollmers C, Zarrinpar A, DiTacchio L, Bushong EA, Gill S, Leblanc M, Chaix A, Joens M, Fitzpatrick JA, et al. Time-restricted feeding without reducing caloric intake prevents metabolic diseases in mice fed a high-fat diet. Cell Metab. 2012;15:848–60.
Chaix A, Zarrinpar A, Miu P, Panda S. Time-restricted feeding is a preventative and therapeutic intervention against diverse nutritional challenges. Cell Metab. 2014;20:991–1005.
Duncan MJ, Smith JT, Narbaiza J, Mueez F, Bustle LB, Qureshi S, Fieseler C, Legan SJ. Restricting feeding to the active phase in middle-aged mice attenuates adverse metabolic effects of a high-fat diet. Physiol Behav. 2016;167:1–9.
Olsen MK, Choi MH, Kulseng B, Zhao CM, Chen D. Time-restricted feeding on weekdays restricts weight gain: a study using rat models of high-fat diet-induced obesity. Physiol Behav. 2017;173:298–304.
Gabel K, Hoddy KK, Haggerty N, Song J, Kroeger CM, Trepanowski JF, Panda S, Varady KA. Effects of 8-hour time restricted feeding on body weight and metabolic disease risk factors in obese adults: a pilot study. Nutr Healthy Aging. 2018;4:345–53.
Gill S, Panda S. A smartphone app reveals erratic diurnal eating patterns in humans that can be modulated for health benefits. Cell Metab. 2015;22:789–98.
Sutton EF, Beyl R, Early KS, Cefalu WT, Ravussin E, Peterson CM. Early time-restricted feeding improves insulin sensitivity, blood pressure, and oxidative stress even without weight loss in men with prediabetes. Cell Metab. 2018;27:1212-1221.e1213.
Wilkinson MJ, Manoogian ENC, Zadourian A, Lo H, Fakhouri S, Shoghi A, Wang X, Fleischer JG, Navlakha S, Panda S, Taub PR. Ten-hour time-restricted eating reduces weight, blood pressure, and atherogenic lipids in patients with metabolic syndrome. Cell Metab. 2020;31:92-104.e105.
Cienfuegos S, Gabel K, Kalam F, Ezpeleta M, Wiseman E, Pavlou V, Lin S, Oliveira ML, Varady KA. Effects of 4- and 6-h time-restricted feeding on weight and cardiometabolic health: a randomized controlled trial in adults with obesity. Cell Metab. 2020;32:366-378.e363.
Antoni RRT, Robertson MD, Johnston JD. A pilot feasibility study exploring the effects of a moderate time-restricted feeding intervention on energy intake, adiposity and metabolic physiology in free-living human subjects. J Nutr Sci. 2018;7:1–6.
Chow LS, Manoogian ENC, Alvear A, Fleischer JG, Thor H, Dietsche K, Wang Q, Hodges JS, Esch N, Malaeb S, et al. Time-restricted eating effects on body composition and metabolic measures in humans who are overweight: a feasibility study. Obesity (Silver Spring). 2020;28:860–9.
Nathan DM, Buse JB, Davidson MB, Ferrannini E, Holman RR, Sherwin R, Zinman B, American Diabetes A. European Association for Study of D: medical management of hyperglycemia in type 2 diabetes: a consensus algorithm for the initiation and adjustment of therapy: a consensus statement of the American Diabetes Association and the European Association for the Study of Diabetes. Diabetes Care. 2009;32:193–203.
Bhopal RS, Douglas A, Wallia S, Forbes JF, Lean ME, Gill JM, McKnight JA, Sattar N, Sheikh A, Wild SH, et al. Effect of a lifestyle intervention on weight change in south Asian individuals in the UK at high risk of type 2 diabetes: a family-cluster randomised controlled trial. Lancet Diabetes Endocrinol. 2014;2:218–27.
Ackermann RT, Liss DT, Finch EA, Schmidt KK, Hays LM, Marrero DG, Saha C. A randomized comparative effectiveness trial for preventing type 2 diabetes. Am J Public Health. 2015;105:2328–34.
Wei M, Brandhorst S, Shelehchi M, Mirzaei H, Cheng CW, Budniak J, Groshen S, Mack WJ, Guen E, Di Biase S, et al. Fasting-mimicking diet and markers/risk factors for aging, diabetes, cancer, and cardiovascular disease. Sci Transl Med. 2017;9:1–12.
Hutchison AT, Regmi P, Manoogian ENC, Fleischer JG, Wittert GA, Panda S, Heilbronn LK. Time-restricted feeding improves glucose tolerance in men at risk for type 2 diabetes: a randomized crossover trial. Obesity (Silver Spring). 2019;27:724–32.
Carter S, Clifton PM, Keogh JB. The effect of intermittent compared with continuous energy restriction on glycaemic control in patients with type 2 diabetes: 24-month follow-up of a randomised noninferiority trial. Diabetes Res Clin Pract. 2019;151:11–9.
Carter S, Clifton PM, Keogh JB. The effects of intermittent compared to continuous energy restriction on glycaemic control in type 2 diabetes; a pragmatic pilot trial. Diabetes Res Clin Pract. 2016;122:106–12.
Galenkamp H, Stronks K, Mokkink LB, Derks EM. Measurement invariance of the SF-12 among different demographic groups: the HELIUS study. PLoS ONE. 2018;13:e0203483.
Moro T, Tinsley G, Bianco A, Marcolin G, Pacelli QF, Battaglia G, Palma A, Gentil P, Neri M, Paoli A. Effects of eight weeks of time-restricted feeding (16/8) on basal metabolism, maximal strength, body composition, inflammation, and cardiovascular risk factors in resistance-trained males. J Transl Med. 2016;14:290.
Trepanowski JF, Kroeger CM, Barnosky A, Klempel MC, Bhutani S, Hoddy KK, Gabel K, Freels S, Rigdon J, Rood J, et al. Effect of alternate-day fasting on weight loss, weight maintenance, and cardioprotection among metabolically healthy obese adults: a randomized clinical trial. JAMA Intern Med. 2017;177:930–8.
Gabel K, Hoddy KK, Varady KA. Safety of 8-h time restricted feeding in adults with obesity. Appl Physiol Nutr Metab. 2019;44:107–9.
Yasumoto Y, Hashimoto C, Nakao R, Yamazaki H, Hiroyama H, Nemoto T, Yamamoto S, Sakurai M, Oike H, Wada N, et al. Short-term feeding at the wrong time is sufficient to desynchronize peripheral clocks and induce obesity with hyperphagia, physical inactivity and metabolic disorders in mice. Metabolism. 2016;65:714–27.
Xie X, Kukino A, Calcagno HE, Berman AM, Garner JP, Butler MP. Natural food intake patterns have little synchronizing effect on peripheral circadian clocks. BMC Biol. 2020;18:160.
Su Y, Cailotto C, Foppen E, Jansen R, Zhang Z, Buijs R, Fliers E, Kalsbeek A. The role of feeding rhythm, adrenal hormones and neuronal inputs in synchronizing daily clock gene rhythms in the liver. Mol Cell Endocrinol. 2016;422:125–31.
Acknowledgements
The authors would like to thank the staff and participants of Chu Hsien-I Memorial Hospital. We also thank American Journal Experts (AJE) for English language editing.
Funding
This work was supported by the National Natural Science Foundation of China (No. 81671835), the Key Projects of Tianjin Natural Science Foundation (No. 19JCZDJC36900) and Tianjin Commission of Science and Technology (Nos. RC20165 and ZC20143).
Author information
Authors and Affiliations
Contributions
Conception and design: ZW, XL, TC; Data collection and interpretation: TC, CY, DT; Data analyses: XZ; Manuscript draft and critical review: all authors. Final approval of the study content and manuscript and accountability for data integrity: all authors. All authors read and approved the final manuscript.
Corresponding authors
Ethics declarations
Ethics approval and consent to participate
This study was approved by the Ethics Committee of Tianjin Medical University. Written informed consent was obtained from all of the participants.
Consent for publication
Not applicable.
Competing interests
The authors declare that they have no competing interests.
Additional information
Publisher's Note
Springer Nature remains neutral with regard to jurisdictional claims in published maps and institutional affiliations.
Supplementary Information
Additional file 1: Figure S1
. The number of adherent days to the dietary regimen for the TRF group
Rights and permissions
Open Access This article is licensed under a Creative Commons Attribution 4.0 International License, which permits use, sharing, adaptation, distribution and reproduction in any medium or format, as long as you give appropriate credit to the original author(s) and the source, provide a link to the Creative Commons licence, and indicate if changes were made. The images or other third party material in this article are included in the article's Creative Commons licence, unless indicated otherwise in a credit line to the material. If material is not included in the article's Creative Commons licence and your intended use is not permitted by statutory regulation or exceeds the permitted use, you will need to obtain permission directly from the copyright holder. To view a copy of this licence, visit http://creativecommons.org/licenses/by/4.0/. The Creative Commons Public Domain Dedication waiver (http://creativecommons.org/publicdomain/zero/1.0/) applies to the data made available in this article, unless otherwise stated in a credit line to the data.
About this article

Cite this article
Che, T., Yan, C., Tian, D. et al. Time-restricted feeding improves blood glucose and insulin sensitivity in overweight patients with type 2 diabetes: a randomised controlled trial. Nutr Metab (Lond) 18, 88 (2021). https://doi.org/10.1186/s12986-021-00613-9
Received:
Accepted:
Published:
DOI: https://doi.org/10.1186/s12986-021-00613-9