

Abstract
Background
Molecular hydrogen (H2 gas) has emerged as a promising therapeutic agent with reported benefits across oxidative stress, inflammation, cardiovascular, and neurodegenerative conditions. Among administration routes, inhalation provides direct systemic delivery but has been hindered by a lack of individualization, methodological inconsistencies, misinterpretation of concentration, and safety concerns. We propose that fraction of inspired hydrogen (FiH2), defined at the airway opening rather than by source gas concentration (FH2) or flow rate, should be considered the standardized metric for dosing, akin to oxygen therapy. This directly links inspired H2 at the airway opening to resulting blood concentrations via Dalton’s and Henry’s laws, thereby enabling consistent dosing, interpretation of clinical data, and comparability across studies.
Methods
A targeted analysis of experimental and clinical literature was used to identify H2 concentration ranges associated with minimum and optimal biological effects. Deterministic respiratory-physiology in silico modeling was then used to estimate the FiH2 during nasal cannula H2 administration under practical breathing conditions, accounting for minute ventilation, inspiratory flow dynamics, and duty cycle, and to derive H2 flow-rate requirements.
Results
Evidence indicates that therapeutic effects typically require blood concentrations of ~2–10 µM, corresponding to ~1% FiH2; whereas optimal FiH2 remains elusive with trends favoring 2% over 4% in some settings and possibly the reverse in others. Use of H2 source gas exceeding 4% introduces intrinsic flammability risk that scales with flow rate, particularly if FiH2 exceeds 4%, and should be avoided. Modeling suggests that ~200–300 mL/min absolute hydrogen achieves ~1% FiH2 via nasal cannula in average adults, whereas higher flows (~600–1200 mL/min) may be required for 2–4% and may still fail to reach 1%. Thus, flow rate cannot reliably ensure a precise or therapeutic FiH2. In order to truly determine and provide minimum/optimal H2 concentrations, researchers must measure or estimate and report the specific FiH2 based on the provided equations.
Conclusions
FiH2 provides the only physiologically meaningful metric for hydrogen dosing because it determines airway partial pressure and tissue concentrations. Flow rate or device concentration alone cannot predict delivered FiH2. Standardizing FiH2 as the reported dosing metric will improve reproducibility, enable study comparisons, and personalized, safe dosing.
Background
Molecular hydrogen (H2) has emerged as a compelling therapeutic agent over the past two decades due to its selective antioxidant properties, anti-inflammatory effects, and the modulation of key cellular signaling pathways [1]. Its biological efficacy, coupled with an excellent safety profile, has driven numerous preclinical and clinical studies investigating therapeutic applications in conditions such as cardiovascular disorders, neurological diseases, metabolic syndromes, and inflammatory conditions [1]. Despite growing interest and promising early outcomes, the clinical translation and widespread adoption of hydrogen therapy have encountered significant methodological challenges, primarily due to inconsistencies in dosing and administration methods that are not directly personalized and tailored to the individual.
Globally, molecular hydrogen inhalation therapy is gaining recognition, albeit at varying levels of regulatory acceptance. In Japan, the Ministry of Health, Labour and Welfare (MHLW) has authorized hydrogen inhalation as an "Advanced Medical Care" treatment specifically for post-cardiac arrest syndrome [2], signifying both recognition and encouragement of clinical exploration in controlled environments. Similarly, in China, a hydrogen inhalation device has received Class III medical device approval [3], facilitating its integration into clinical research settings. In the United States, hydrogen therapy remains under investigational status, permitted through Investigational New Drug (IND) applications approved by the Food and Drug Administration (FDA) [4], underscoring the ongoing need for rigorous standardization and translational validation.
A pivotal safety consideration in hydrogen inhalation therapy is the flammability of hydrogen gas, which becomes explosive at concentrations that exceed approximately 4.0% v/v in ambient air [5,6,7]. This intrinsic hazard underscores the necessity of precise control over inspired hydrogen concentration, particularly when using low-flow delivery interfaces such as nasal cannulas. Although safety parameters and practical mitigation strategies are discussed comprehensively later, it is essential to emphasize upfront the necessity of careful dosing control to ensure safety alongside therapeutic efficacy. Basing dosing on device flow rates alone does not allow reliable translation of results from animals to humans, across studies, or across patient populations, including pediatric cohorts.
Central to addressing these dosing challenges is the introduction and rigorous application of the Fraction of Inspired Hydrogen (FiH2) as the clinically relevant dosing metric, analogous to the well-established Fraction of Inspired Oxygen (FiO2) in respiratory medicine [8]. FiH2 accurately reflects the fraction of hydrogen gas in the inspired mixture at the airway opening (rather than colloquial use referring to source gas concentration/fraction at the cannula, i.e., FiH2 vs F \({H}_{2}\)). The resulting alveolar hydrogen fraction (FAH2) is lower and depends on ambient air entrainment and varies with patient-specific ventilatory mechanics. Nevertheless, FiH2 ultimately determines the equilibrium alveolar partial pressure of hydrogen and, consequently, the dissolved hydrogen concentration in blood and tissues.
The overarching aim of this article is to formalize FiH2 as a standardized, physiology-based dosing parameter; to define literature-supported minimum and near-optimal therapeutic concentration ranges; and to translate these targets into practical, clinically applicable nasal cannula flow-rate guidance. By explicitly integrating respiratory physiology, safety constraints, and individualized breathing dynamics, this framework seeks to resolve existing ambiguities, improve reproducibility, and facilitate the safe and effective clinical translation of molecular hydrogen inhalation therapy.
Methods
Aim, design, and setting
This is an in silico, physiology-grounded computational modeling study with targeted literature synthesis. The objective was to (i) formalize the fraction of inspired hydrogen (FiH2) as the clinically relevant dosing metric for inhaled H2, (ii) translate established low-flow nasal cannula gas-delivery concepts from clinical respiratory physiology (as used in oxygen therapy) into an FiH2 framework for H2 gas medicine, and (iii) identify literature-informed minimum and optimal FiH2 targets and derive corresponding H2 flow-rate recommendations under realistic breathing conditions, while contextualizing safety constraints. FiH2 was mapped to expected dissolved H2 concentrations using Dalton’s law of partial pressures and Henry’s law at physiological temperature (37 °C). No new experimental or clinical data were generated.
Respiratory physiology modeling and FiH2 computation
FiH2 was computed using deterministic first-order mass-balance/entrainment formulations adapted from established low-flow nasal cannula oxygen-delivery physiology, with explicit treatment of inspiratory-phase dilution. Ventilatory descriptors included \(\dot{{V_E}}\), VT, RR, inspiratory time (Ti), and duty cycle (DC = Ti/Ttot). Inspiratory flow was represented using both mean inspiratory flow (MIF) and peak inspiratory flow (PIF) to bracket breath-averaged versus instantaneous dilution. Where applicable, a compact upper-airway reservoir term, and an inspiratory capture/entrainment efficiency term (η) were included to represent imperfect cannula capture and short-timescale buffering in the upper airway. Consistent with respiratory physiology conventions, FiH2 is treated as the controllable dosing variable, while alveolar hydrogen fraction and tissue concentrations are treated as downstream equilibrated outcomes.
Model-derived flow-rate recommendations and safety bounds
Model outputs provided forward estimates of delivered FiH2 (given H2 flow and respiratory mechanics) and inverse estimates of the H2 flow required to achieve literature-informed minimum and optimal FiH2 targets. Modeled scenarios were additionally used to contextualize practical safety bounds, including flammability and oxygen-displacement (hypoxia) considerations. Because the analysis is deterministic, no inferential statistics were applied; uncertainty was explored via bounded parameter variation across physiologically plausible breathing conditions.
Results and discussion
Definition and importance of FiH2
The Fraction of Inspired Hydrogen (FiH2) refers to the proportion of hydrogen gas that actually reaches the trachea during inspiration. This is analogous to the well-established Fraction of Inspired Oxygen (FiO2) commonly used in respiratory care [8, 9]. It is defined mathematically as follows:
(definition)
(Dalton’s law; dry inspired gas)
where:
-
\({P}_{I,}{\text{H}}_{2}\) = partial pressure of inspired hydrogen gas
-
Pb = barometric pressure (total atmospheric pressure)
-
\({P}_{{\text{H}}_{2}\text{o}}\) = water vapor pressure in the airways (≈ 47 mmHg; 0.062 atm, at 37 °C)
FiH2 is defined as \({\text{FiH}}_{2}={F}_{I,}{\text{H}}_{2}\). Adopting FiH2 as a standardized metric in hydrogen inhalation therapy allows clinicians and researchers to accurately quantify and replicate hydrogen concentrations administered to patients, thus enhancing therapeutic consistency, reproducibility, and safety.
Crucially, the use of FiH2 is superior to reporting absolute hydrogen flow rates (mL/min) or the percentage concentration generated by inhalation devices, as these latter measures do not reflect the true physiological dose reaching the lungs (see Table 1).
By accurately specifying the inspired hydrogen fraction FiH2, the inspired partial pressure of hydrogen (\({P}_{{\text{H}}_{2}}\)) is fixed (Eq. 2), which, via Henry’s Law determines the dissolved hydrogen concentration in the blood.
Henry’s Law: translating inhaled concentration to cellular levels
Henry’s Law mathematically expresses the direct proportionality between the concentration of a gas dissolved in a liquid (C) and the partial pressure (P) of that gas above the liquid, as described by:
Here, KH is Henry’s constant, which varies based on the specific gas, temperature, and solvent. This relationship permits a precise translation of inhaled hydrogen concentrations (FiH2) into the corresponding H2 partial pressure (\({P}_{{\text{H}}_{2}})\) and subsequently the dissolved concentrations in plasma and tissues [10]. Table 2 translates commonly used FiH2 targets to partial pressure and consequently estimated plasma H2 concentration. We used KH = 650 μM/atm for H2 at 37 °C in plasma (van’t Hoff extrapolation, plus salting-out and protein corrections) [11]. All concentrations were computed by adjusting for water vapor pressure at 1 atm, yielding an apparent KH of 610 µM/atm consistent with experimental data [10]. Although compressed gases are typically stored dry, inspired gases are rapidly humidified within the respiratory tract; even if humidification were incomplete, the resulting reduction in PH2O would produce only a minimal change in calculated FiH2 (≤ 0.25 percentage points over the 1–4% range), and would not materially affect these estimates.
The estimated plasma H2 concentrations in Table 2 are consistent with values reported in the preclinical and clinical literature where FiH2 was precisely controlled (e.g., animal chambers, sealed facemasks), supporting that dissolved H2 concentrations achieved during inhalation align with those predicted by Henry’s law. Specifically, FiH2 values of 1–4% correspond to measured blood H2 concentrations of approximately 5–28 µM [12,13,14,15], which closely match the Henry’s law–based estimates shown in Table 2. Once steady state is achieved, FiH2 approaches FeH2 [16], indicating gas–blood equilibrium. According to Fick’s law of diffusion, the rate at which this equilibrium is reached depends on factors governing gas transport, including the partial pressure gradient, ventilation, cardiac output, and tissue perfusion. Consistent with this, experimental data suggest that blood equilibration may occur within minutes in rats [17], whereas human studies report plateau blood concentrations after approximately 20 min of inhalation [13, 18].
Importantly, the FiH2-derived estimates in Table 2 assume a barometric pressure of 1 atm. At higher elevations, where ambient pressure is lower, the corresponding partial pressure of H2 and resulting dissolved concentrations will decrease proportionally. For example, at elevations exceeding ~ 4000 m (e.g., Bolivia) [19], the partial pressure corresponding to 1% H2 is approximately 0.006 atm, yielding an estimated plasma concentration of ~ 3.9 µM rather than ~ 6.1 µM. Conversely, environments with higher barometric pressure (e.g., below sea level or hyperbaric conditions) would proportionally increase the resulting dissolved H2 concentrations. Accordingly, barometric pressure should be considered when designing experiments or therapeutic protocols involving inhaled H2.
FiH2, not ventilation, dictates cellular H2 concentration
This precise relationship underscores why simply increasing the total volume of inhaled hydrogen gas, without altering its fractional concentration, does not elevate the cellular hydrogen concentration. For example, a rat inhaling 2% H2 will have an identical tissue H2 concentration post-equilibrium as a human inhaling 2% H2 despite major differences in relative ventilation rates. Similarly, inhaling a 4% hydrogen gas mixture at different ventilation rates (e.g., 6 L/min vs. 12 L/min) does not change the equilibrium hydrogen concentration at the tissue level, as this is solely dictated by the FiH2. This key concept is critical for accurate clinical dosing and highlights the importance of focusing on gas concentration that reaches the lungs rather than total inhalation volume.
Therefore, it becomes evident that accurate clinical and therapeutic dosing of hydrogen gas should emphasize the consistent delivery of a defined FiH2 rather than the total flow rate or the percentage produced by a given generator. Current ambiguities in defining dose by flow rate or produced concentration can lead to significant miscalculations, resulting in subtherapeutic values and reduced clinical efficacy.
Minimum therapeutic threshold from cell culture
Given the proportional relationship between the partial pressure of hydrogen (and thus FiH2) and its resulting cellular concentration, it is essential to identify the minimal effective concentration of dissolved H2 required to elicit measurable biological effects. This framework is agnostic to the precise mechanism of action, whether through direct interaction with molecular targets such as the mitochondrial Rieske iron–sulfur protein [20] or through indirect pathways such as microbiome-mediated signaling [21]; in either case, a minimum H2 concentration in the relevant target compartment is required to elicit biological effects. This knowledge is fundamental for optimizing and standardizing hydrogen inhalation protocols. Because FiH2 directly determines tissue hydrogen concentrations via Henry’s Law, effective dosing ranges can be estimated based on in vivo studies where a precise FiH2 is used with guidelines from several in vitro studies. These studies indicate that at least some biological effects of molecular hydrogen initiate at dissolved hydrogen concentrations in the range of approximately 2–10 µM. Therefore, at physiological temperature (37 °C), this lower end concentration translates into a partial pressure of approximately 0.01 atm, which is corresponds to an FiH2 of 1%.
For example, when cells were incubated under a precise partial pressure of H2, the lowest reported concentration that had an effect was 0.3% (≈1.8 µM) [22]. However, this was in a purely chemical (cell-free) system, in which H2 suppressed the autooxidation of linoleic acid at 37 °C. However, their cell-culture experiments found that 0.3% had no effect, and 0.6% had a trend, but only 1.3% significantly inhibited Ca2⁺ signaling triggered by oxidized phospholipid mediators [22]. Another study [23] in a non-living system demonstrated that 0.5% H2 (≈3 µM), could significantly improve egg quality and storage but was not as effective as 3% H2 [23].
Importantly, many in vivo animal studies show that an FiH2 of at least only 0.5 to 1% is required to elicit biological effects [24, 25]. There are currently no human clinical studies that directly determine the lowest required FiH2. However, the measured or estimated FiH2 of most clinical studies is typically between 1–4% [2, 12, 26, 27], as high as over 20% [28], and as low as ≈0.2–0.3% [29,30,31,32]. However, not all human studies with FiH2 below 0.5% show favorable effects on the outcomes measured [33, 34].
Although more investigation is needed to determine minimal therapeutic thresholds for concentration and duration, the collective data provides some guidance. The most instructive evidence is from the in vivo data where a precise and controlled concentration of H2 was provided. However, taken together, the in vitro and in vivo data indicate that an H2 concentration of at least several micromolar, which corresponds to an FiH2 of approximately at least 1%, is sufficient to induce certain therapeutic effects [35,36,37].
Concentration-dependent effects
The optimal concentration is also complex and not fully elucidated. However, as mentioned several in vitro studies have demonstrated clear concentration-dependent effects [14, 38]. Nevertheless, focusing on in vivo inhalation studies where the FiH2 is precise and controlled, it is observed that most studies that compare different concentrations indicate concentration-dependent effects with 2% being more effective than 1% [14].
For example, in the seminal 2007-Nat. Med. paper using neonatal hypoxia–ischemia models [14], cortical infarct sizes were smaller with 2% FiH2 compared to both 1% and 4% FiH2. Likewise, another study revealed that FiH2 of 1% and 2% reduced I/R-induced infarct size, whereas 4% appeared to not be as not as protective, suggesting a biphasic dose–response [15]. In swine, 2% improved myocardial stunning but only 4% reduced infarct size [39]. Furthermore, in a neonatal I/R rat model 2.9% FiH2 pre-treatment increased infarct size and, when given to non-ischemic sham animals, it significantly elevated MDA levels [40]. Perhaps a lower (or higher) FiH2 concentration would have been effective in this study.
Accordingly, once a therapeutic threshold is reached, H2 may exhibit a concentration-dependent effect, whereas in other contexts, elevated concentrations may yield neutral or even adverse effects. For instance, higher FiH2 levels (e.g., 4%) may be more effective than lower ones (e.g., 2%) in certain conditions such as cancer [38], whereas the opposite may hold true in neurological disorders [14], in which lower concentrations may confer greater benefit.
These divergent responses suggest that H2 may exhibit true hormetic behavior, where low concentrations elicit adaptive, non-toxic effects, while higher concentrations induce pathological stress. Further investigation is needed to clarify the interplay between inhaled concentration and exposure duration. For example, in studies where 2% FiH2 appeared to not be as effective as 4% [14], would a shorter duration at 4% have yielded therapeutic effects, or a longer exposure to 2% become less effective? Although speculative, it is also conceivable that while a greater total dose of H2 might initially appear neutral or harmful, continued administration may eventually be more therapeutic than what is observed at lower doses. These findings highlight the need to standardize FiH2 for future clinical research.
Clinical studies and optimal FiH2
Translating cellular and animal studies to clinical practice requires careful interpretation due to the complexities of human physiology. Nevertheless, preliminary clinical trials and large-animal studies largely align with cellular findings, consistently indicating therapeutic efficacy within the range of approximately 1–4% FiH2 [2, 3, 12, 27, 41].
For example, clinical research on post-cardiac-arrest syndrome utilized approximately 2% FiH2 for 18 h, significantly increased the 90-day survival (61% vs 85%) and tended to have favorable neurological improvements (56% vs 39%) without adverse effects [2]. Similarly, a clinical pilot trial in acute ischemic stroke patients demonstrated reduced infarct growth on diffusion-weighted MRI after inhalation of 3% FiH2 for 60 min twice per day [12].
Collectively, the available evidence supports the establishment of a practical therapeutic window of approximately 1–4% FiH2. Concentrations below 1% may prove insufficient, while exceeding 4% FiH2 presents unnecessary risks without proven incremental benefits. This concentration range effectively balances therapeutic efficacy and practical safety considerations, ensuring reliable clinical outcomes while avoiding flammability concerns [42, 43]. Future controlled studies are essential to further refine these dosing recommendations, particularly across varying clinical conditions and patient populations.
In sum, while the optimal FiH2 is not yet fully elucidated and requires further investigation, the current data appear to converge on 2–4% FiH2 being an optimal concentration [44]. Although there are no human studies showing that an FiH2 of 4% and higher is not effective or harmful, most studies likely provide a range of FiH2 0.5–4%, which also keeps it below the flammability level. Future research might illustrate that some conditions respond better or worse to a specific FiH2 such as 2%, 4%, or higher, which is why providing a precise FiH2 is essential. Similarly, understanding the duration of treatment is critical to elucidating the minimum and optimal dose of H2.
Respiratory parameters influencing FiH2
Ideally, plasma hydrogen (H2) concentration or the fraction of exhaled hydrogen (FeH2) would be monitored to confirm that the target H2 exposure is achieved. However, unlike oxygen, where arterial oxygenation can be easily monitored using pulse oximetry (SpO2) and oxygen flow can be titrated to achieve a desired inspired oxygen fraction (FiO2), there is currently no simple or widely available method for real-time monitoring of plasma H2 levels. Hydrogen is a diamagnetic gas, in contrast to oxygen, which is paramagnetic and readily detectable using conventional sensing technologies. As a result, measurement of H2 typically requires specialized analytical methods such as gas chromatography.
To provide a precise FiH2, many studies simply ensure that all the ambient air contains the desired H2 concentration, thereby consistently attaining the target FiH2. For example, by connecting a tank of mixed gas with regulators to the cell culture incubation chamber, the animal cage [14], or directly to a facemask for humans [12], the FiH2 can be precisely controlled.
As inhalation therapy has grown in popularity, various electrolysis units have been developed that deliver the H2 via a nasal cannula. Although convenient, a nasal cannula makes it difficult to provide a consistent and precise FiH2, or to even ensure a therapeutic FiH2 without flammability risks [42, 43]. These limitations represent major shortcomings that need to be addressed. For example, as suggested in the animal research, it is possible that one FiH2 is more (or exclusively) effective than another FiH2 [14, 39]. Moreover, unless a sufficient FiH2 is achieved there will not be a therapeutic cellular H2 concentration, which may result in spurious conclusions that H2 is ineffective [13]. Finally, providing high flow rates and/or high concentration H2 gas can be dangerous, with documented catastrophes [42] being likely worse than possible benefits. Addressing these safety and efficacy concerns begins with accurately determining the FiH2 a patient receives.
Accordingly, we provide a critical discussion of the variables that influence inspired hydrogen fractions, along with equations that allow researchers to estimate the inspired hydrogen fraction (FiH2). These estimates are then compared with published literature to support validation, interpretation, and recommendations for appropriate H2 flow rates.
Minute ventilation (\({\dot{\mathrm V}}_{\mathrm E}\))
Accurately estimating FiH2 requires a physiologically grounded understanding of respiratory mechanics and the dynamic parameters that influence gas dilution during inspiration. By applying the principles learned from medical oxygen therapy to medical hydrogen therapy, we can provide practical guidelines for using a nasal cannula.
Textbook resting minute ventilation (\(\dot{V_E}\)) is the volume of air breathed per minute, and is often cited as 4–8 L/min, a range derived from measurements in fully relaxed, motionless individuals (e.g., supine rest without mental or physical stimulation) [45]. However, in real-world conditions, referred to here as “practical rest” (e.g., awake, seated breathing during typical sedentary activities), ventilation is typically higher. Seated activities such as computer work or reading are influenced by residual metabolic activity from prior movement, mild sympathetic activation from cognitive or emotional engagement, and postural muscle tone, often elevating \(\dot{V_E}\) to > 12 L/min [45, 46]. Light talking, gesturing, or experiencing anxiety or mild stress can increase \(\dot{V_E}\) to ≥ 12 L/min through higher tidal (VT) volumes and respiratory rates (RR) [47]. Similarly, individuals with health conditions associated with tachypnea (elevated respiratory rate) may further increase \(\dot{V_E}\) and should also be considered.
Minute ventilation tracks metabolic rate. Resting O2 consumption is around 3.5 mL/kg/min, which is defined as 1 MET [48]. The \(\dot{V}\text{O}_{2}\) of quiet sitting and light mental activity is approximately 1.2–1.5 METs. Using a practical resting ventilatory equivalent (\(\dot{V_E}\)/VO2) of ≈25–30, minute ventilation can be estimated as: \(\dot{V_E}=\dot{V}\text{O}_{2}\) × (\(\dot{V_E}\)/VO2) ≈ (0.105–0.158) × body mass (kg) L/min [48,49,50]. Table 3 provides practical examples illustrating how \(\dot{V_E}\) scales with body mass based on MET-derived estimates.
FiH2 calculations that assume the commonly cited textbook resting minute ventilation (\(\dot{V_E}\)) of ~ 6 L/min (derived from tidal volume ≈500 mL and respiratory rate ≈12 breaths/min) [51, 52] may underestimate dilution effects under typical waking conditions. In practice, minute ventilation during “practical rest” is frequently higher due to mild metabolic activity, cognitive engagement, posture, speech, and sympathetic activation [52]. For example, at rest or during seated quiet activity, minute ventilation is commonly around 9–13 L/min, seated activities often produce \(\dot{V_E}\) values of approximately 8–10 L/min, while speaking or light seated activity can increase ventilation to ≥ 19 L/min [53, 54]. Figure 1 illustrates representative \(\dot{V_E}\) ranges across physiological and behavioral states, from deep sleep to light activity, synthesized from respiratory physiology literature and metabolic-equivalent–based estimates [52,53,54].
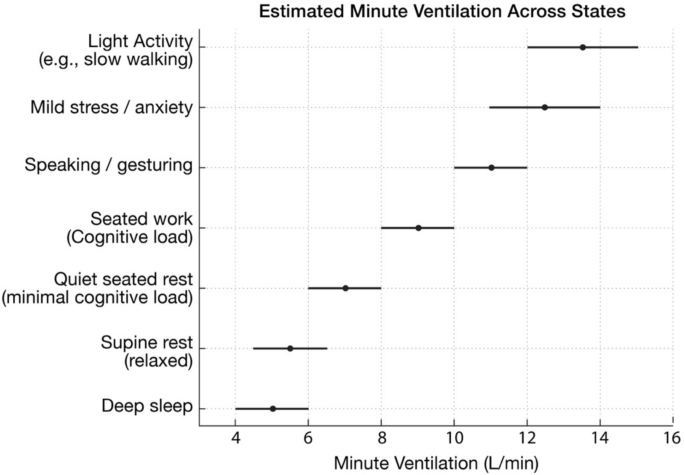
Typical minute ventilation ranges for various physiological and behavioral states for a 70 kg individual, illustrating higher values in practical conditions compared with textbook resting estimates
Furthermore, conditions that increase ventilatory drive, including metabolic acidosis with Kussmaul respirations and acute hypoxemia, and in some circumstances COPD, can substantially raise minute ventilation, in some cases to more than twice baseline [55]. For accurate dosing, it is therefore essential to account for this broader and more variable practical ventilation range (≈8–12 + L/min), which more closely represents the conditions under which hydrogen inhalation therapy is administered. Elevations in \(\dot{V_E}\) are not solely due to increased oxygen demand but also reflect neurophysiological arousal and behavioral factors [47]. Additionally, the individual breathing style, such as the duration of each inspiration must also be considered.
Mean inspiratory flow
H2 enters the lungs only during the inspiratory phase. Depending on breathing pattern, the inspiratory phase may last 1–2 s per breath. At typical practical resting respiration rates this corresponds to a total inspiratory time of roughly 12–24 s per minute, with the remainder devoted to exhalation and brief transition phases [52]. The average flow during the inspiratory portion of the cycle is known as the mean inspiratory flow (MIF). It is related to \(\dot{V_E}\) by accounting for the inspiratory duty cycle (DC) [51].
Let RR be the respiration rate (breaths per min); VT, the tidal volume; \(\dot{V_E}\) the minute ventilation (\(\dot{V_E}\) = VT x RR); Ti, is inspiratory time; TE, is the exhalation time including pauses (non-inspiratory time), and \(DC={T}_{i}/{(T}_{E}+{T}_{i})\) the operational inspiratory duty cycle. The mean inspiratory flow is:
A conceptual mathematical definition is
Therefore
Accordingly, a \(\dot{V_E}\) of 10 L/min achieved over 20 s of inspiratory time corresponds to a DC of 0.33 (i.e., 20/60 = 0.33), yielding an MIF of 500 mL/s or 30 L/min (i.e., 10/0.33 = 30 L/min). MIF is directly influenced by \(\dot{V_E}\) and the fraction of time spent inhaling (i.e., duty cycle; DC) which are variables in the MIF equation. Table 2 illustrates that even at a constant \(\dot{V_E}\), MIF can vary substantially depending on the breathing pattern.
This shows that MIF can be altered significantly without changing \(\dot{V_E}\), as occurs during intentional breathing techniques. In other words, in conscious or focused breathing, DC becomes the primary driver of MIF because it can change without hypo- or hyperventilation. Stress, anxiety, and other factors can increase MIF by increasing \(\dot{V_E}\) and/or decreasing DC [47]. Thus, a low \(\dot{V_E}\) with a short DC can yield a higher MIF than a high \(\dot{V_E}\) with a long DC and vice versa. Therefore, although \(\dot{V_E}\) is related to estimating FiH2, MIF is the essential dependent variable [56].
Table 6 provides a general rule of thumb for estimating MIF based on \(\dot{V_E}\). It is noted that 30 L/min (i.e., 500 mL/s) is a well-accepted average for a practical resting MIF [57], which has been used in other H2 studies to estimate the FiH2 [58, 59]. For estimating MIF, focusing primarily on \(\dot{V_E}\) is appropriate for subconscious normal breathing, whereas focusing on DC at a set \(\dot{V_E}\) becomes primary when various breathing techniques are employed.
In practice, a heuristic approach to determine MIF based on various breathing patterns (subconscious or conscious efforts) is to simply divide the estimated \(\dot{V_E}\) by the estimated (or measured) number of seconds per minute spent inhaling (e.g., \(\dot{V_E}\) = 12,000 mL/min \(\div\) 24 s = 500 mL/s or 30 L/min).
FiH2 estimation using mean inspiratory flow
Under first-order mixing assumptions for a low-flow nasal cannula (LFNC), the breath-averaged inspired fraction of H2 (FiH2) and the desired H2 flow rate (\(\dot{Q}\text{H}_2\)) for a targeted FiH2 can be approximated in the same ways as is for oxygen [56] as follows:
where:
-
\(\dot{Q}\text{H}_2\): device H2 flow rate (L/min)
-
MIF: mean inspiratory flow (typically 20–35 L/min at rest; higher with exertion)
-
η (inspiratory capture efficiency): fraction of cannula flow that enters the airway during inspiration (~ 0.95–0.99 for mouth-closed nasal breathing; η can fall below ~ 0.7 with poor nasal patency, discussed in Effect of Breathing Route and Nasal Patency on FiH2).
However, a “reservoir” effect may occur if cannula flow during non-inspiratory time pre-fills the nasal/nasopharyngeal space and is inhaled at the start of the next inspiration [60]. This pre-/front loading contribution can be added to Eqs. 3 and 4 as follows:
where:
-
ξ is the retention factor representing the fraction of cannula flow accumulated in the upper-airway reservoir during expiration that is subsequently inhaled during the next inspiration. For H2, ξ is modeled here as a bounded first-order parameter informed by oxygen-therapy literature describing anatomic reservoir and expiratory dead-space effects during low-flow nasal-cannula delivery [60] Under typical conditions ξ is assumed to lie within ~ 0–0.2 and may approach ~ 0.3 with coached nose-in/mouth-out and a brief end-expiratory pause.
-
\(\dot{Q}\) is the device flow rate in mL/s;
-
TE is the expiration time (including pauses) in seconds (s);
-
Vgeo is the estimated geometric re-inhalable volume (mL) of the reservoir (nostrils, nasal passages, nasopharynx); adults range 20–40 mL; decreases with poor nasal patency (e.g., congestion, swelling).
-
The term “min” denotes the minimum of the two quantities, i.e., the product of \(\dot{Q}\text{H}_{2}\) x TE or Vgeo, which is then divided by the tidal volume (VT). This is because the reservoir term saturates when \(\dot{Q}\text{H}_{2}\)TE ≥ Vgeo.
Accordingly, using Eq. 3, with an η ≈0.99, the expected FiH2 for an H2 flow rate (\(\dot{Q}\text{H}_{2}\)) of 600 mL/min can be calculated by dividing \(\dot{Q}\text{H}_{2}\) by the estimated MIF (e.g., 30 L/min) (i.e., 0.99 × 0.6 L/min \(\div\) 30 L/min), which yields an FiH2 of ≈1.98%. However, assuming a possible reservoir effect, this value will be slightly increased using Eq. 5. In this case, let’s assume a TE of 2 s, VT of 500 mL, ξ of 0.2, Vgeo of 40 mL, and \(\dot Q{\text{H}}_2\) of 600 mL/min (or 10 mL/s). In this case, the reservoir is not saturated (\(\dot{Q}\text{H}_{2}\)TE < Vgeo; i.e., 2 × 10 = 20 mL < 40 mL). Thus, 0.2 x (20 mL/500 mL) = 0.8%, which brings the FiH2 up to 2.78% (i.e., 1.98% + 0.8%).
To estimate the required H2 flow rate to achieve a targeted FiH2, multiply the estimated MIF (see Table 6) by the desired FiH2, divided by the estimated capture efficiency (η) (e.g., for an FiH2 of 4%; 0.04 × 30,000 mL/min \(\div\) 0.98 = 1224 mL/min). However, the required amount might be lower if there is a significant reservoir effect. This can be estimated by using Eq. 6, which following similar assumptions as before, the required H2 flow rate is only 860 mL/min.
The Vgeo and VT influence how large of a reservoir effect there might be. Depending on if the reservoir is saturated, it’s capacity, and the retention factor, the reservoir effect can be either insignificant or be clinically meaningful.
Influence of breathing styles on the reservoir effect and FiH2
The non-inspiratory time (TE) dictates what flow rate (\(\dot{Q}\text{H}_{2}\)) is required to saturate the reservoir (i.e., \(\dot{Q}\text{H}_{2}\cdot{T}_E\) ≥ Vgeo), while VT, the denominator (Eqs. 5, 6), determines the dilution factor. For the same \(\dot{V_E}\) a greater TE allows more time to fill the reservoir but will proportionately increase the VT and thus cancel out via dilution the increased reservoir volume. Similarly, reducing the diluting effect via a lower VT results in a lower TE, thus requiring a higher \(\dot{Q}\) to fill the reservoir. TE directly affects both MIF via altering DC and the magnitude of the reservoir effect [60]. In normal practical breathing TE is between 2–3 s, and in common coached breath work practices it is 4 −12 s. Importantly, although I:E ratio is often used to coach breath work, it may only represent relative timing, not absolute duration, thus the same 1:6 ratio could mean a TE of 3 s or 12 s depending on total breath length. However, in this paper E and TE represents the entire non-inspiratory phase, which includes expiratory phase, transition and any pauses (breath holds).
Maintaining the same \(\dot{V}_{E}\) while extending TE, reduces the required flow rate to saturate the reservoir, but it also increases MIF, which reduces FiH2. This also results in less time spent inspiring. That is, instead of having H2 directly fill the lungs, it is filling the nasal passages of which only a fraction(ξ) gets inspired.
The reservoir has the greatest impact when it is saturated prior to inspiration, which can only occur if the flow rate is relatively high. Consequently, the reservoir effect tends to be weakest when FiH2 is ≤ 1%, and strongest when FiH2 is already relatively high. For example, at low flow rates, where the direct cannula term yields FiH2 values below ~ 1%, the reservoir contribution is typically small (on the order of < 0.5–1 percentage point) and should not be relied upon either to achieve a therapeutic threshold (e.g., ≥ 1%). However, as the cannula-only FiH2 rises into the ~ 2–4% range, a saturated reservoir can add an additional ≈1–3 percentage points to the inspired fraction. This boost to FiH2 spans the entire therapeutic range once a therapeutic threshold is reached. That is, if cannula flow reaches ≥ 1%, then the reservoir effect can increase it to 2–4%+. This directly impacts the ability to target a precise FiH2.
Furthermore, once the cannula-delivered FiH2 is ≥ 4%, the reservoir effect can further elevate the effective FiH2 and may contribute to transient local regions with H2 concentrations exceeding 10% v/v in the immediate breathing zone. Thus, the reservoir effect is not an appropriate mechanism to “rescue” low-dose delivery but becomes increasingly important as both a clinically meaningful and an intrinsic flammability risk once the cannula flow settings are sufficient to produce FiH2 values of ≈2% or higher.
Thus, to determine the desired H2 flow rate, one must first determine the targeted FiH2, and then second determine the type of breathing (normal resting, calm resting, or various breathing practices), and then determine the most suitable flow rate to reach the targeted FiH2.
A simple approach is to simply estimate the FiH2 based on the expected MIF with minimal reliance on the reservoir effect, which can be considered as a bonus. However, this approach doesn’t work if the FiH2 must be kept below the flammability level, or if a precise H2 concentration is needed for therapeutic or experimental work.
Moreover, the reservoir effect is dependent upon a nose-in, mouth-out breathing pattern that allows hydrogen to accumulate in the nasal cavity during exhalation and be reinhaled on the subsequent breath [60]. When exhalation occurs exclusively through the nose, the stored hydrogen is vented to the environment rather than retained, thereby abolishing any reservoir-derived contribution to FiH2.
Another limitation of using MIF to estimate FiH2 is that it fails to consider the non-rectangular inspiratory flow profile, which increases dilution during the early high-flow phase. For this reason, clinical respiratory physiology relies on peak inspiratory flow (PIF) as the standardized dilution reference for low-flow interfaces when it is essential that the instantaneous inspired fraction never falls below a minimum threshold [61].
Peak Inspiratory Flow (PIF)
Peak Inspiratory Flow (PIF) is defined as the maximum instantaneous airflow rate attained during the inspiratory phase of a single tidal breath [62]. PIF reflects the interplay between inspiratory effort, airway resistance, and lung–chest wall compliance. The resulting flow profile is nonlinear in character and often approximates a triangular flow–time waveform, characterized by (i) rapid acceleration, (ii) peak, and (iii) deceleration as driving pressure equilibrates with elastic and resistive loads [63]. The initial phase of inspiration favors entrainment of ambient air, thereby reducing the effective concentration of the administered gas.
Peak inspiratory flow relates to MIF via a dimensionless waveform (shape) factor k:
Here k is the inverse of the area under the normalized inspiratory flow waveform (see Table 4), is unitless, and k ≥ 1.
Typical k values [64](closed-form exemplars with physiologic mapping).
-
Nearly rectangular (closed-form k = 1). Physiologic: k ≈ 1.1–1.3 (slow, even breathing with conscious effort/coaching).
-
Half-sine (closed-form k = π/2 ≈ 1.57). Physiologic: k ≈ 1.5–1.7 (quiet resting breathing).
-
Symmetric/triangular (closed-form k = 2; for any linear triangular profile with unit peak on τ ∈ [0,1], area = 1/2 ⇒ k = 2, even if the peak is time-skewed). Physiologic: k ≈ 1.7–2.0 (rapid rise/fall; talking, mild exertion, shorter Tᵢ).
In general, the PIF is approximately 3–6 times the mean \(\dot{V}_{E}\). Therefore, a more realistic PIF in healthy adults at practical rest may range from 45–55 L/min and easily exceed 70 L/min with mild exertion, speech, or sympathetic arousal [64, 65].
FiH2 estimation using peak inspiratory flow
If the fraction of inspired H2 must not fall below a certain targeted threshold for clinical or research purposes, then dosing should reference PIF with a justified waveform factor (k) rather than relying solely on MIF or \(\dot{V}_{E}\). That is FiH2 ≈ \(\eta\dot QH_2/PIF\), which means the required H2 flow rate will be higher than MIF by a factor of k. This is critical for breathing practices using short inhalations and prolonged exhalations (e.g., I:E ≈ 1:4–1:6; physiological sigh, pranayama, Buteyko-style CO2 tolerance and HRV training). If total inspiratory time is 8 s per minute (DC ≈ 0.13) at \(\dot{V}_{E}\) = 8 L/min, then MIF = 1000 mL/s, and with a k ≈2, then PIF ≈2000 mL/s (120 L/min). Therefore, estimating required H2 flow as a fraction of MIF would therefore underdose by 1/ k (i.e., deliver only ~ 50% of the targeted FiH2 when k = 2).
Figure 2 illustrates the time course of instantaneous FiH2 under nasal-cannula delivery using a first-order, no-reservoir mixing model. Inspiratory flow was modeled as a decelerating waveform with MIF ≈ 30 L/min and PIF ≈ 60 L/min (k = PIF/MIF = 2; η ≈ 1). With a cannula H2 flow ≈ 1.2 L/min, FiH2 is diluted to ~ 2% during inspiration, then rises as inspiratory flow decelerates, peaking just before the zero-crossing; during expiration it returns rapidly toward a baseline near 4% set by MIF. Thus, instantaneous FiH2 varies from ~ 2%–7% while the breath-averaged value remains ~ 4%.
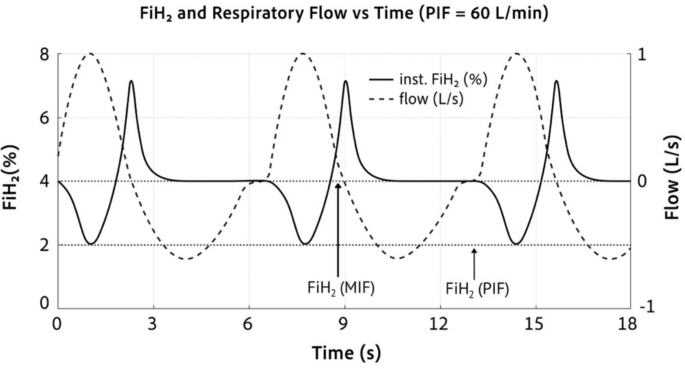
FiH2 and Respiratory Flow vs Time. Instantaneous FiH2 (solid) and respiratory flow (dashed) for a nasal-cannula delivery modeled without reservoir (η≈1). Parameters: I:E = 1:2, pause ≈0.7 s, MIF = 30 L/min, PIF = 60 L/min (k = 2); \(\dot{Q}\text{H}_{2}\)≈1.2 L/min. Dashed horizontal lines at 2% (instantaneous FiH2 at PIF) and 4% (breath cycle-average FiH2 at MIF)
In practice, the instantaneous FiH2 can transiently exceed 20% whenever the inspiratory flow falls below the cannula H2 cannula flow, such as late in inspiration. These dynamics demonstrate the dosing consequences of choosing MIF versus PIF as the reference flow. If the clinical, therapeutic, or experimental requirement is that instantaneous FiH2 must never fall below a threshold, then dosing should reference PIF rather than MIF. The figure also underscores that a nasal cannula cannot deliver a precise, constant instantaneous FiH2. This is because FiH2 is inversely coupled to the patient’s moment-to-moment inspiratory flow. Therefore, if a fixed FiH2 is required at the airway throughout inspiration, or simply to ensure that the FiH2 remains below the 4.0% lower flammability limit, then more controlled interfaces (e.g., tight face mask or ventilator/blender) are required.
Effect of breathing route and nasal patency on FiH2
Estimating FiH2 using these methods (PIF or MIF with or without a reservoir) assumes closed-mouth nasal breathing with a well-seated cannula [66]. Deviations from this assumption (e.g., oral or oronasal inspiration) bypass the cannula jet, reduce capture efficiency (η), and lower the realized FiH2 even if device flow is increased. Contributors include habitual mouth breathing and structural or mucosal causes of impaired nasal patency (e.g., turbinate hypertrophy, rhinitis/congestion, nasal valve collapse, prior trauma, or septal deviation). Based on population prevalences of nasal obstruction, approximately 10–15% of the general adult population and 20–25% of adults ≥ 65 years have sufficiently poor nasal patency to plausibly yield η ≲ 0.6 during low-flow nasal-cannula delivery [67,68,69,70,71].
In oxygen therapy, dilution can often be offset by titrating O2 flow or changing the interface (e.g., simple mask, Venturi, or HFNC) to achieve a target FiO2 [72]. For hydrogen delivery, although similar strategies exist in principle, two constraints are salient: (i) geometric and comfort limits of standard low-flow nasal cannulas (narrow prongs and small-bore tubing increase entrainment and discomfort at higher flows), and (ii) safety limits imposed by hydrogen’s lower flammability limit (LFL ≈ 4% v/v in air). Accordingly, when nasal patency is poor or mouth breathing predominates, a face mask is generally preferable. If a nasal cannula is used, FiH2 should be estimated with conservative MIF-based calculations using a realistic η, while remaining cognizant that higher flow rates proportionally increase the flammability risk.
Minimum required H2 flow rates for 1% FiH2
If a nasal cannula is used, the H2 flow rate should be enough to ensure that at least 1% FiH2 is achieved. However, as exhaustively discussed, it is impossible to provide a specific H2 flow rate that ensures a 1% FiH2 is achieved for every individual or even for the same individual. FiH2 directly depends on MIF, which the average adult with normal breathing (\(\dot{V}_{E}\) = 6–12 L/min) has a typical resting range of 20–35 L/min, but is modifiable to a very wide range (< 10 to > 100 L/min; see Tables 5 and 6) with conscious effort (e.g., different or same \(\dot{V}_{E}\) and/or different I:E ratios, i.e., DC), as well as on the reservoir effect.
Moreover, the required H2 flow rate depends directly on reservoir retention factor (ξ), and nasal patency (η), which as mentioned, up to around 20% of adults may have η ≲ 0.6, which should be considered when making estimations and recommendations.
Figure 3 illustrates the required H2 flow to achieve a 1% FiH2 based on either \(\dot{V}_{E}\) or MIF using various assumptions to provide realistic upper and lower bound estimations, along with a typical expected range. The upper (pessimistic) required H2 flow rate-rate curve uses slow, relaxed respiration with an I:E ratio 1:4 (DC = 0.20), poor nasal patency (η = 0.7), and a low retention (ξ = 0.07) for the reservoir capture. Figure 3A shows that under these conditions a \(\dot{V}_{E}\) of 8–12 L/min would require ≈400 mL/min to > 600 mL/min to reach a 1% FiH2. In contrast, the lower bound (optimistic) curve uses a high-nasal patency and well-seated cannula (η = 1.0), with coached, nasal-only relaxed breathing at an I:E 1:1 (DC = 0.50) achieving a high retention (ξ = 0.35); under these conditions a \(\dot{V}_{E}\) of 8–12 L/min would require only ≈120–180 mL/min. A more typical curve follows decent nasal patency (η = 0.85) and a standard resting I:E 1:1.5 (DC = 0.40) with realistic retention (ξ = 0.2), which requires an H2 flow rate from ≈170 mL/min to ≈260 mL/min. Thus, estimated required H2 flow rates can vary substantially depending on various factors.

Required H2 Flow for 1% FiH2; calculations modified (see below) from Eqs. 3, 4 and 5. Figure 3 A H2 Flow vs \(\dot{V}_{E}\). Curves are upper (pessimistic) and lower (optimistic) with a more likely/typical in the average population based on a given \(\dot{V}_{E}\). The knee in the upper curve denotes Qsat of the reservoir. The vertical shading highlights the typical \(\dot{V}_{E}\) regions. Figure 3B. H2 Flow vs MIF with curves for upper, lower, and typical/average population. Solid segments denote MIF with range implied by normal \(\dot{V}_{E}\) (∈ [6,20] L/min. Gradient highlights a typical practical resting MIF region
If \(\dot{Q}H_{2}\)×TE < Vgeo, then: \(Q{\mathrm H}_2=\frac{F_{I,}{\mathrm H}_2\left(MIF\right)1000}{\upeta+\upxi{\displaystyle\frac{1-DC}{DC}}};\)
If \(\dot{Q}H_{2}\)×TE ≥ Vgeo, then: \(QH_2=\frac{F_{I,}{\mathrm H}_2\left(MIF\right)1000}\upeta-\frac{\xi V_{geo}RR}{DC\eta}\)
The most important factor in determining FiH2 is the MIF. Because MIF = \({\dot V}_E/\mathrm{DC}\), the same MIF can arise from different combinations of \(\dot{V}_{E}\) and DC ratios (Tables 3 and 5). For example, a \(\dot{V}_{E}\) of 10 L/min can have an MIF between 15 and 100 L/min across an extreme DC range (0.67 to 0.1). Therefore, FiH2 is better estimated from MIF than from VE alone. Although DC also affects FiH2 via influencing reservoir refill in the unsaturated regime, this effect is modest compared with its impact via MIF.
Accordingly, Fig. 3B illustrates the required H2 flow as a function of MIF to reach 1% FiH2, following the same upper, lower, and typical assumptions as Fig. 5A. Realistic extremes for the upper and lower required H2 flow rate may range from as little as 60 mL/min (e.g., MIF = 7 L/min, ξ = 0.35, η = 1.0, DC = 0.67) to as high as over 2000 mL/min (e.g., MIF = 90 L/min, ξ < 0.07, η < 0.6, DC = 0.1). It could be higher if η dropped lower due to excess mouth breathing such as from congestion, and/or if ξ were lower (e.g., nasal-only exhalation preventing any refill time, or unfavorable anatomy).
Minimum recommended H2 flow rates for 1%, 2%, and 4% FiH2
The minimum required H2 flow rate is most strongly influenced by the MIF (Figs. 4 and 5). As a general recommendation we can adopt 30 L/min (500 mL/s) as the practical “real-world” resting MIF while recognizing substantial inter-individual variability. As for nasal patency, η = 1 indicates a well-seated nasal cannula with a clear nasal passage during coached breathing (nose-in/mouth-out). However, since 15–25% of the population have poor nasal patency such that η ≲ 0.6, requiring nearly twice the flow rate to achieve the same FiH2. An estimated typical η ≈ 0.85 is a reasonable approximation for the average adult. Similarly, a moderate reservoir retention factor of ξ = 0.20 with a Vgeo ≈ 40 mL is in line with the LFNC assumptions. Finally, the DC can be set at a normal range of 0.33 to 0.4.

FiH2 as function of flowrate and MIF. Figure 4A represents the required flow rate to reach various targeted values of FiH2 (1,2, 4%) following typical parameters (η = 0.85, ξ = 0.20, Vgeo = 30 mL, RR≈15/min). Figure 4B illustrates FiH2 vs flow rate at different parameters. Figure 4B. FiH2 vs flow rate at different values of MIF. All calculations used DC = 0.4

Modeled FiH2 heatmaps as a function of \(\dot{Q}\text{H}_{2}\) and MIF under representative nasal-cannula conditions. The top row assumes no reservoir (ξ = 0) with inspiratory capture efficiencies η = 1.0, 0.8, and 0.6. The bottom row includes a reservoir effect (ξ = 0.2) with the same η values. Warmer colors indicate higher FiH2, illustrating how lower MIF, higher η, and the presence of a reservoir increase FiH2 for a given \(\dot{Q}\text{H}_{2}\)
Figure 4 illustrates how the relationships between the required H2 flow rate and the various parameters to reach a targeted FiH2. For example, Fig. 4A shows the required H2 flow rate to achieve various targets of FiH2 as a function of MIF under typical parameters (i.e., η = 0.85, ξ = 0.20, Vgeo = 30 mL, RR≈15/min). The flow rates have a very wide range depending on targeted FiH2 and MIF. Figure 4B focuses on 30 L/min since this value is used as guideline for practical alert rest and demonstrates how the required flow rate changes based on nasal patency. Figure 4C demonstrates more specifically how changes in MIF drastically influence the FiH2.
To further visualize these dependencies more intuitively, Fig. 5 presents modeled FiH2 heatmaps across a grid of hydrogen flow rates (\(\dot{Q}\text{H}_{2}\)) and MIF values for representative combinations of inspiratory capture efficiency (η) and reservoir retention (ξ) using Eq. 5. Under a fixed DC of 0.4 and typical geometry (Vgeo ≈ 40 mL), the heatmaps highlight three key features: (i) at any given device flow, FiH2 falls steeply as MIF increases; (ii) reductions in η (e.g., due to poor nasal patency or mouth breathing) markedly reduce FiH2 across the entire range; and (iii) even a modest reservoir effect (ξ ≈ 0.2) substantially elevates FiH2 at low-to-moderate MIF.
Targeting an FiH2 of 2–4% would be in line with the current literature. However, as depicted in Fig. 4, the required flow rates vary significantly. Moreover, there are other extremes in which a lower or higher H2 flow rate may be required. Due to such wide variability in the flow needed to reach a given FiH2, a single “correct” flow rate is neither realistic nor safe. Instead, it is more pragmatic to define conservative coverage bands, analogous to the empirical rule of the normal distribution, that bracket lower, typical, and upper combinations of MIF, nasal patency, and reservoir behavior. To do this, we can recommend a set value or range for each variable in the equation that influences FiH2.
Table 7 summarizes MIF-based recommendations for the minimum H2 flow rate needed to achieve 1, 2, and 4% FiH2 at various coverage targets based on MIF. The MIF was based on modified Eqs. 3–5 using a resting DC = 0.4. If the same MIF is achieved with a different DC (i.e., different \(\dot{V}_{E}\)), the reservoir preload changes the required flow ± 10% across DC = 0.32–0.5. The nasal patency coefficient, retention factor, and MIF were adjusted to increase percent coverage from the estimated median. Coverage labels reflect engineering margins under stated assumptions based on LFNC, not empirical population percentiles. The extreme upper and lower bounds were also added for illustrative/comparison purposes.
FiH2 in-silico estimations compared to in vivo and real-world measurements
As nasal cannulas are not an ideal method to ensure a targeted FiH2, there are limited studies that directly provide this information. However, these estimates, including their wide ranges, are in line with the literature that used nasal cannulas, reported the flowrate, and measured the concentrations. For example, in patients with severe tracheal stenosis, H2 was delivered through a nasal cannula at an absolute H2 flow of approximately 4 L/min [73]. Because the study did not report inspiratory flow, tidal volume, inspiratory time, nasal patency, or other parameters needed to directly calculate FiH2, estimation requires physiologically plausible assumptions based on the cohort’s body size, severe airway obstruction, dyspnea, and near-rest condition. Accordingly, using Eq. 5 yields an estimated FiH2 of approximately 30 ± 5%, which is consistent with the reported intratracheal H2 concentrations of 30–35% in the study [73].
In a different population of apparently healthy subjects under more practical breathing conditions, the absolute H2 flow via a nasal cannula was approximately 2 L/min [74]. Again, because inspiratory flow and other breathing parameters were not reported, FiH2 can only be estimated using plausible LFNC assumptions. Under the present Eq. 5 framework, the expected FiH2 in this cohort is in the low single digits, approximately 2–5%, which is consistent with the measured exhaled-breath H2 concentrations of approximately 0.9–3.8% [74]. The lower measured values may reflect factors such as reduced nasal patency, mouth breathing, or other interface-related losses.
In another pilot study, dissolved plasma H2 concentration was measured after equilibrium was reached during hydrogen inhalation [18]. Back-calculation of FiH2 from the measured plasma H2 concentration using Dalton’s and Henry’s laws closely match the FiH2 predicted by Eq. 5
Together, these studies support two important conclusions. First, they validate the adaptation of FiO2-based respiratory mixing equations from the oxygen literature for estimating FiH2. Second, they directly underscore the need to standardize FiH2 as a dosing metric and to report the key breathing and interface parameters required for accurate FiH2 estimation.
Practical recommend flow rates
These analyses indicate that reaching literature-informed FiH2 targets (~ 1–4%) may require a wide range of H2 flow rates, depending strongly on inspiratory flow dynamics. Accordingly, minimum required H2 flow rate to achieve a 1–4% FiH2 may range from ≈60 mL/min to > 5000 mL/min. This illustrates the impossibility of making specific flow rate recommendations since flow rate alone does not equal FiH2. Nevertheless, there are important guidelines and trends that can be applied for rough estimates.
For example, estimating the required flow rate as a function of MIF while disregarding η (assuming η ≈0.85 is reasonable) and the reservoir effect is viable heuristic approach, as a decrease in η reduces/negates any reservoir advantage. However, this approach is discouraged when precise dosing is required for clinical or experimental work or flammability assessments.
When lower device flows (e.g., ~ 200 mL/min) are used, simply advising patients to “breathe slowly” may be counterproductive if it lengthens expiration (I:E ~ 1:3–1:4) and thereby reduces FiH2. Instead, at these low flow rates, the average person would have to have longer, slower inspirations with an I:E ratio maintained at ≥ 1:1 in order to preserve the target FiH2 concentration, which can be difficult to sustain for the duration of the treatment.
Patient adherence to specific breathing patterns, particularly over prolonged periods, cannot be relied upon to ensure a targeted FiH2. Accordingly, delivery strategies that minimize dependence on patient behavior, such as use of a facemask with a reservoir, are preferable; otherwise, appropriate adjustment of flow rates based on the governing equations is required when using LFNC systems.
Special scenarios for required H2 flow rates to reach targeted FiH2
There are additional nuances to the required H2 flow rate that should also be considered. We have already mentioned that different breathing practices significantly influence the required H2 flow rate. Some individuals, such as those in the wellness community, may engage in breath work while inhaling H2 that drastically lowers or raises the required H2 flow rate. Similarly, an individuals required flow rate may change from being more restful (e.g., supine, sleeping and relaxed) compared to feeling more anxious, mentally alert, light working (typing, gesturing, light talking), etc.
Thus, a flow rate that is adequate for one situation of the same individual may, under realistic breathing patterns, not even meet the minimum therapeutic threshold in another scenario. It is tempting to simply choose a very high H2 flow rate to ensure that a minimum therapeutic FiH2 is achieved, but by so doing, it increases the flammability risk, especially during scenarios where the required H2 flow rate is much lower and the FiH2 is well above the 4.0% flammability level.
In order to avoid flammability risks while still ensuring a therapeutic FiH2 is achieved, it is possible for individuals to maintain their normal V̇E (as to not hypoventilate) and lower their MIF by long inhales and short exhales (high DC and I:E ratio). However, this practice is difficult to sustain for a total inhalation session (e.g., ≈1 h), and it may have unwanted effects since this breathing style is more sympathetic in nature [75]. Similarly, prolonged hypoventilation is unstainable as is hyperventilation. Therefore, the H2 flow rate should really be calibrated not only to the individual, but the specific inhalation session scenario.
Specifically calibrating the flow rate to match the breathing style is also important if a precise H2 concentration is required either for experimental or clinical use. For example, a 400 mL/min H2 flow rate could result in H2 concentrations below 1% to above 10% depending on how the scenario the individual is inhaling. Some animal studies indicate that a higher concentration is less effective than a lower concentration (e.g., 4% less effective than 2%) for certain end points [14, 39]. If this is true in specific disease conditions in humans, then precise dosing with a nasal cannula becomes difficult without careful calibration between ventilation and flow rate, which may include specific coaching.
Additionally, these flow rates are all based on estimating the minute average FiH2, not the instantaneous FiH2. Therefore, if there are situations where it is required that the target H2 concentration never fall below a precise FiH2, then estimations based on the expected peak inspiratory flow (PIF) are required. It should also be noted that there can be substantial variability across hydrogen delivery devices (e.g., gas purity, flow accuracy, and delivery characteristics) which influence the FiH2 in practice, highlighting the importance of calibration and verification of gas composition and not simply trusting manufacturer/company claims.
Health conditions resulting in tachypnea/hyperpnea
Some patients have an abnormally high “resting” ventilatory demand. In these patients, tachypnea and/or shortened inspiratory time increases inspiratory flow, so higher cannula flow may be required to achieve the same target FiH2. Common clinical scenarios include: (i) metabolic acidosis with Kussmaul-type breathing (e.g., diabetic ketoacidosis, lactic acidosis/sepsis, renal failure), (ii) obstructive lung disease such as COPD or asthma exacerbations (often with rapid breathing and mouth breathing that can further reduce nasal capture efficiency), and (iii) severe hypoxemic or high–dead-space states (e.g., pneumonia, pulmonary edema, ARDS, pulmonary embolism). The MIF in these patients can easily exceed 40–60 L/min and even above 100 L/min in severe cases [55]. Therefore, the required H2 flow may need to be 2–3 × higher to reach the targeted FiH2, which raises flammability concerns/risks.
Elevation
Another major consideration that undermines the entire basis of FiH2 is the differences in elevation. So far, all calculations and recommendations are done under the assumption of 1 atm. This results in 1% FiH2, resulting in a partial pressure of 0.01 atm, which is the original definition of fraction of inspired gas (Eq. 1). Accordingly, a higher elevation even at the same percent (v/v) of H2 will result in a lower partial pressure and thus a lower dissolved H2 concentration. For example, attempting H2 inhalation therapy in Bolivia where the elevation is around 3,650 m [19], would reduce 1% FiH2 from 0.01 atm to 0.0064 atm. This results in plasma H2 concentration below the estimated therapeutic threshold. Instead, a target of 1.56% v/v would be required to achieve as 1% FiH2 at sea level. If it takes 318 mL/min to reach 1% FiH2 at sea level, then it would require ≈ 500 mL/min to reach 1% at that elevation (i.e., 318 × 1.56 = 496).
The higher required FiH2 also increases the risk of hypoxia more than otherwise because already the equivalent O2 concentration is reduced from 20.95% to 13.4%. Thus, for every fractional increase in FiH2, the O2 concentration is proportionately decreased. Ensuring an equivalent FiO2 above 10% is critical, which still allows an FiH2 of ≈23%. Ideally, the FiH2 would not be higher than 4% to reduce flammability risks and would only reduce the equivalent FiO2 to 12.9%. Regardless, SpO2 monitoring is highly recommended in these scenarios.
Maximal FiH2 recommendations based on biological safety
To propose a rational upper limit for H2 flow rates, it is necessary to first consider an appropriate maximal FiH2. The biological safety of H2 is well established, with no known intrinsic toxicity even at very high concentrations [10]. Currently, there is insufficient evidence to define a biologically based upper threshold for FiH2. While it is conceivable that in certain scenarios higher concentrations of H2 could produce diminishing or ostensibly paradoxical effects as discussed earlier, there insufficient data to draw any firm conclusions. On the contrary, several animal studies have demonstrated that even hyperbaric exposure to H2 at concentrations that would effectively exceed 100% at 1 atm are safe, and therapeutically effective in certain experimental contexts [76]. These findings indicate that H2 itself does not obviously impose biological toxicity even at high concentrations. Accordingly, the primary reasons to recommend a maximal FiH2 are to mitigate risks of flammability and hypoxia. Importantly, these points only apply to H2-mixed air, not oxyhydrogen.
Maximal FiH2 and H2% v/v to reduce flammability risk
Hydrogen has a lower and upper flammability limit of approximately 4% and 75% v/v, respectively in air [5,6,7]. Although ignition behavior depends on conditions, the risk of combustion increases with concentration and becomes notably higher above ~ 10% v/v. Mixtures above roughly 18% v/v enter the detonation range under suitable confinement and ignition conditions [77]. The minimum spark energy for ignition of hydrogen in air is ~ 0.017 mJ. Thus, even weak electrostatic discharges (e.g., from the human body) can be sufficient to ignite a flammable mixture (and in confinement, lead to an explosion) [78]. Accordingly, it is recommended to ensure that the method of administration and flow rate are such that the H2 concentration never exceeds 4%, and especially no higher than 10–18% [77].
This recommendation is impossible to follow explicitly when using pure H2 nasal cannula systems since the concentration passes through the flammability/detonatable range as it gets diluted from ≈100% to the targeted 1–4% FiH2 [77]. Instead, the best mitigation strategy is to tailor the flow rate for each individual to achieve an FiH2 < 4%.
Importantly, the flammability risk of FiH2 and % H2 v/v need to be addressed separately when a nasal cannula is used. On the surface, a nasal cannula flow of pure H2 that gets diluted to a 4% FiH2 would not have any risk of flammability. However, the FiH2 is the minute average concentration, and the instantaneous fraction will be higher and lower than the average. For example, at the end of the inspiratory phase, the H2 flow rate transiently equals and exceeds the inspiratory flow resulting in temporal pockets of highly combustible gas. Theoretically, this could be true for flow rates that are too low to exert therapeutic effects as they cannot constantly elevate FiH2 above even 1%, but they can create local pockets/plumbs around the nares that exceed flammability thresholds.
Additionally, gas mixtures exceeding 4% H2 (v/v) enter the flammable range in air and are therefore subject to more stringent regulatory and safety requirements under established fire and building codes (e.g., NFPA standards) and occupational safety guidelines (e.g., OSHA), typically requiring appropriate engineering controls, ventilation, and institutional authorization for use in clinical environments [79, 80].
Consequently, the safest recommendation is to use a method that does not provide an H2 concentration above 4% v/v at either the delivered concentration (FH2) or the diluted inspired concentration (FiH2). This necessarily requires a facemask, which also ensures a precise FiH2 is achieved. If, a nasal cannula is the only option and FiH2 does not have to be precisely maintained, then pure H2 should be used, and the flow rate should target a ≈2% average FiH2 allowing for transient peaks in the H2 concentration during the end inspiratory phase. However, if it is reasonable that a 4% FiH2 should be targeted, then more caution should be used to ensure there are no ignition sources, since instantaneous concentrations will exceed 4%. Moreover, exceeding a 4% FiH2 will result post equilibrium in an exhaled H2 concentration of 4%. Exhaling through the nose may further elevate the concentration since it will include the H2 flow from the cannula. However, exhaling through the mouth also is problematic as it ensures that the nasal reservoir contains a flammable mixture of H2 gas.
Finally, it is strongly discouraged to use any flow rates that would result in an FiH2 that might transiently exceed 10–18% [77]. There are documented cases where commercial H2 inhalation units have exploded, causing property damage, personal injury, and in some cases, serious trauma including complex facial fractures, bronchial laceration, internal bleeding, etc. [42, 43, 77, 81].
Maximal H2 flowrate recommendations to reduce flammability risk
It is impossible to have a flow rate of pure H2 that does not pose an intrinsic flammability risk. Indeed, even flow rates of only 10 mL/min could be captured, diluted, and ignited. It is also understood that the greater the flow rate, the greater the risk because the diameter of the flammable plumb increases proportionately. Thus, recommended flow rates that ensure the FiH2 stays below flammability threshold, does not eliminate the intrinsic flammability of pure H2 being diluted during transit.
As indicated in Table 7 and Figs. 4 and 5, the required flow rates to reach targeted FiH2 values, show that in some situations, flow rates less than 300 mL/min can result in a flammable FiH2. Doubling the flow, increases the flammability risk such that at flows > 600 mL/min, the risk becomes more significant, while at > 1200 mL/min the risk of flammability, including detonation, becomes eminent in the presence of an ignition source. Accordingly, a flow rate of 300–600 mL/min and not exceeding 1200 mL/min is a defensible, but not a risk-free recommendation for the average practical population.
Maximal FiH2 to reduce hypoxia risk
Another recommendation for maximal FiH2 is to reduce the risk of hypoxia arising from displacement of O2 in the inspired gas. Atmospheric air contains approximately 20.95% O2. Healthy adults can typically tolerate transient exposures to FiO2 levels as low as ~ 10%, and many human populations chronically reside at altitudes where the inspired O2 equivalent is ~ 13–15% [82, 83]. Conservatively, FiO2 should ideally remain above 15% to minimize risk, especially in individuals with respiratory or cardiovascular impairments or at higher elevations where the partial pressure of inspired O2 is already reduced.
Because FiO2 decreases as FiH2 increases in a closed mixture, an FiH2 of ~ 30% would reduce FiO2 to ~ 14.7%, which is generally well tolerated by healthy individuals at sea level but could pose risks to vulnerable populations or at altitude [83]. Consequently, while molecular hydrogen itself is biologically safe even at 100% concentration, extended inhalation of pure H2 would ultimately be fatal due to oxygen deprivation. From a medical perspective, it is therefore prudent to recommend that FiH2 not exceed ~ 30% under normoxic conditions unless supplemental oxygen is concurrently administered.
Maximal H2 flowrate recommendations to reduce hypoxia risk
To translate a 30% FiH2 in terms of device flow rate, we can estimate the expected upper, lower, and typical ventilation rates in terms of MIF. At the one extreme at an MIF of 7/min (ξ = 0.35, η = 1.0, DC = 0.67) a flow rate of ≈ 1800 mL/min is required, on the other extreme of an MIF of 130 L/min (ξ = 0.07, η = 0.6, DC = 0.1) a flow rate of ≈65 L/min is needed. However, at a typical MIF of 30 L/min (ξ = 0.2, η = 0.85, DC = 0.4) a flow rate of ≈10 L/min is required.
Thus, under normobaric sea-level conditions, the flow needed to attain FiH2 ≈ 30% (and thus reduce FiO2 to ≈15%) spans roughly 2–10 L/min for most adults, with extreme ventilatory patterns demanding far higher flows. At higher altitudes, these flow rates should be proportionally reduced to maintain an effective FiO2 of around 15%. However, this depends on several factors, including breathing patterns (e.g., \(\dot{V}_{E}\) and duty cycle), health status, altitude, and duration of exposure. Variations in the I:E ratio (duty cycle) directly effects FiH2 and FiO2 even at fixed flow rates (i.e., a flow rate that my not induce hypoxia in one scenario can induce hypoxia in another).
To safely achieve FiH2 values > 30%, despite the increased flammability risks, blood oxygen saturation (SpO2) should be monitored and supplemental oxygen provided as needed. In effect, this is similar to providing oxyhydrogen gas (66.67% H2, 33.33% O2) at high flow rates, which to reach > 30% FiH2 under typical conditions, would require a total flow rate of ≈15.5 L/min, which exceeds the rated range of standard low-flow nasal cannulas. Moreover, such high flows substantially increase flammability risk and are rarely practical or ideal as they may not be as clinically effective as lower flows/concentrations.
Oxyhydrogen
Oxyhydrogen is the mixture of gas produced by water electrolysis, consisting of approximately 66.7% H2 and 33.3% O2. It represents one approach for molecular hydrogen inhalation. Some marketing and anecdotal reports claim that oxyhydrogen is either superior or inferior to pure hydrogen, but such assertions are unsupported by controlled studies and are more likely attributable to differences in H2 flow rate rather than inherent superiority of one method over the other. Importantly, when calculating FiH2, only the hydrogen flow rate, not the total gas flow, should be considered.
At higher flow rates (≈3–6 L/min), oxyhydrogen can provide modest oxygen supplementation. For individuals with mild pulmonary impairment and SpO2 < 90%, FiO2 may rise from 21% to ~ 26%, a level corresponding to the lower range of medical oxygen therapy. This may help maintain normoxemia without inducing hyperoxemia. By contrast, healthy individuals do not require supplemental oxygen, which is why humans can live at altitudes corresponding to 10–15% FiO2 [82]. However, although chronic exposure to this such low levels are associated with adverse effects [84], intermittent exposure may exert beneficial effects [85]. Moreover, humans tend to thrive under slightly reduced oxygen pressures equivalents to an FiO2 of 15–18% [86, 87], and excessive oxygen (e.g., FiO2 > 21%) could promote hyperoxemia, oxidative stress, and other adverse effects [88, 89].
Most commercial oxyhydrogen devices operating at lower flow rates (~ 1–3 L/min), will not significantly increase the normal FiO2. Although inhaling a 33% O2 mixture might appear to substantially raise FiO2, at a total flow of 1 L/min this provides only ~ 333 mL/min O2. After accounting for displacement of ambient air by the 67% H2 fraction, the net O2 delivered is only ~ 123 mL/min. With a MIF of 30 L/min (and \(\dot{V}_{E}\) ≈10 L/min) this is only an additional 40 mL of O2 that is actually inspired, which the raises FiO2 to only ~ 21.36% (roughly equivalent to descending 160 m, ~ 45 stories, in altitude).
Even at higher flows (e.g. 6 L/min, providing ~ 2 L/min of O2) at a 30 L/min MIF (and \(\dot{V}_{E}\) ≈10 L/min), the additional inspired O2 is only 250 mL, which raises FiO2 to only 23%. Therefore, in patients with a lower MIF and \(\dot{V}_{E}\) that suffer from mild hypoxemia, high-flow oxyhydrogen might provide some benefit to raise SpO2 [90]. However, for those with normal pulmonary function, such use would be unnecessary and potentially harmful [91].
The principal concern with oxyhydrogen therapy is its intrinsic high flammability and being detonatable at any flow rate. While serious accidents are uncommon, the risk of ignition or detonation cannot be underestimated, and serious injury has been reported [42, 43, 77, 81].
Moreover, no scientific evidence demonstrates oxyhydrogen to be superior to H2 therapy, and instead clinical and physiochemical evidence shows they are comparable as long as the FiH2 is the same [92,93,94]. Mechanistically, the small amount of supplemental oxygen delivered at typical flow rates is unlikely to exert meaningful physiological effects. At higher flow rates, the oxygen contribution may be clinically relevant but must be weighed against risks of oxygen toxicity and substantially elevated flammability. Accordingly, in the absence of compelling evidence and appropriate engineering controls, the use of oxyhydrogen for therapeutic inhalation should generally be avoided due to its intrinsic flammability and detonation risk [42].
Minimum, maximum, and optimal duration and frequency of H2 inhalation
As FiH2 determines the partial pressure of H2 and subsequently the achieved cellular hydrogen concentration, the duration of inhalation governs the length of cellular exposure. The in vitro studies indicate that H2 can induce biological effects within minutes once intracellular levels reach ~ 2–10 µM; however, equilibration between inhaled gas and circulating tissues requires longer. Based on diffusion principles and clinical evidence, inhalation sessions of at least 20–30 min are generally required to ensure sufficient systemic uptake and cellular exposure. Following cessation, systemic H2 levels typically return to baseline within 30–90 min, depending on concentration [13, 17, 95].
No definitive maximum duration has been established in humans. Clinical protocols have employed up to 18 h per day at 2% FiH2 without adverse events [2]. While prolonged exposures may be beneficial, at least one animal study suggests that continuous administration could reduce responsiveness compared to intermittent dosing [96]. Most clinical and animal studies have employed durations of 30 min to several hours, administered once or multiple times daily.
The optimal relation among concentration, duration, and frequency remains unresolved and is likely context dependent. At present, practical guidance is to do sessions of at least 20–30 min, but more likely more than one hour. Further studies are required to define the ideal algorithms for duration, concentration, and frequency across specific diseases and patient populations.
Summary of key points
Inhalation of molecular hydrogen is a growing area of clinical research and commercial use. The cellular/plasma H2 concentration is directly proportional to the partial pressure of H2 via Henry’s law and thus to the fraction of inspired hydrogen (FiH2). In order to ensure therapeutic efficacy of H2, the plasma/cellular concentration needs to reach a minimum therapeutic threshold of ≈2–10 µM. This corresponds to an FiH2 of ≈1%, with the optimal concentration around 2–4%. Translating FiH2 to H2 device flow rate can be challenging because it depends on numerous variables including the individual’s breathing dynamics including \(\dot{V}_{E}\), MIF, inspiratory-expiratory exchange ratio, respiration rate, nasal patency, the gas retention from the nasal reservoir, altitude adjustments, etc. The variables may also change for the same individual but on a different session. For example, resting \(\dot{V}_{E}\) is often cited as ranging from 5–8 L/min, but that is usually in a supine motionless position, whereas practical resting can range from 8 to > 12 L/min. Therefore, minimum and optimal flow rates should be tailored accordingly as they can vary substantially from person to person and from session to session.
Practical flow rate recommendations
Determining the device H2 flow rate with a nasal cannula system begins with selecting the target FiH2. As reviewed, most studies converge on a 1–4% window with 2–4% often more effective than 1%, and with condition-specific optima 2% more effective than 4%. It is feasible that some conditions will have an optimal FiH2 at 2% and others at ≥ 4% showing a more concentration-dependent effect. However, concentrations above 4% are flammable, and when a nasal cannula is used of pure H2 higher flow rates are required (Eq. 5), which further increases the flammability risk. Regardless, once the target FiH2 is determined the required H2 flow rate can be estimated. Table 8 provides generalized guidelines based on typical \({\dot V}_E/\mathrm{MIF}\) values to reach targeted FiH2 values. Values are presented as ranges reflecting physiological variability and are derived from the upper and lower bounds of the underlying equations; accordingly, the number of significant figures varies.
Ideally, estimates account for nasal patency and the reservoir effect. However, because these variables are often unknown, and may offset each other, a pragmatic heuristic is to disregard them and rely on MIF alone.
For quick real-world practical rest estimations of FiH2, one can simply divide the H2 flow rate by an MIF of 30 L/min (500 mL/s). For example, if the H2 low rate were 600 mL/min, then the math would be \(\frac{0.6 L/min}{30 L/min} or \frac{10 mL/s}{500 mL/s}=2\%\). The true FiH2 might be higher or lower depending on the precise MIF, and all the other variables previously mentioned.
Following this approach, optimal flow rates to achieve an FiH2 of 2–4% likely range from 600 to 1,200 mL/min. This upper bound is also recommended to limit the risk of flammability and detonation. The upper limit to prevent hypoxia (2–10 L/min, depending on MIF) is above the flammability-based limit, which corresponds to the fact that flammability risk increases at an FiH2 above 4–10%, whereas hypoxia risk occurs at a higher FiH2. Reports of bodily harm [42] from accidental ignitions underscore the flammability risk.
Because MIF and breathing dynamics vary widely, MIF-based flow rates allow for more nuance when accounting for differences in anxiety, alertness, nasal patency, or breathing style. An individual practicing relaxed, slow inhalations will have a very different MIF than the same person when anxious and breathing rapidly. As a result, the flow rate required to achieve the targeted FiH2 can vary dramatically from one person, or even one session, to another.
For example, a flow rate that reaches 4% FiH2 for one individual based on their size, nasal patency, and breathing pattern may be subtherapeutic (< 1%) for another, while a flow rate appropriate in one scenario may pose risks such as flammability or, in extreme cases (e.g., adult vs. child), even hypoxia in another. This underscores the challenge of balancing therapeutic efficacy with safety. Perfect optimization with a nasal cannula is not possible, since the flow rates using pure H2 that are needed to achieve a therapeutic FiH2 inherently carry flammability risk. Therefore, tailoring H2 flow to the targeted FiH2 for the specific individual (including pediatrics) and session remains the best approach for managing these competing considerations.
Given that hydrogen can be generated at relatively low cost (e.g., via electrolysis), and that preliminary studies suggest potential therapeutic benefit, the overall benefit–cost profile may be favorable and supports further clinical investigation. However, rigorous assessment of cost-effectiveness will ultimately depend on high-quality clinical evidence, which in turn requires standardized and precise dosing metrics such as FiH2.
Limitations
These recommendations are derived from deterministic, physiology-grounded in silico modeling that adapts well-established low-flow nasal cannula concepts from oxygen therapy. However, the framework was not prospectively validated against patient-level measurements of delivered FiH2 across defined H2 flow rates and breathing conditions. Unlike oxygen therapy, where flow is readily titrated to a measurable clinical endpoint (e.g., SpO2), hydrogen delivery cannot typically be monitored in real time, increasing the importance of individualized flow selection to achieve the intended FiH2 target. Accordingly, the reported flow rates should be interpreted as mechanistically constrained ranges and starting points. Future bench and clinical studies directly measuring FiH2 across patients and conditions are needed to refine and further validate these estimates.
Conclusion
Hydrogen inhalation therapy is most accurately and safely implemented through the framework of the Fraction of Inspired Hydrogen (FiH2). Because FiH2 directly determines airway partial pressure and the resulting plasma and tissue concentrations via Henry’s Law, it provides the only physiologically meaningful dosing metric. Device output/concentration (FH2) or flow rate alone cannot predict inspired concentration (FiH2) and thus complicates the interpretation of clinical findings.
For practical clinical use, facemasks or other interfaces that ensure both the delivered H2 concentration and the resulting FiH2 remain below the 4% v/v flammability limit are preferred. Such interfaces prevent subtherapeutic dosing as well as the formation of transient flammable or detonatable mixtures, which cannot be avoided when diluting pure H2 or oxyhydrogen at the point of inhalation. Facemasks that provide the precise non-flammable concentrations also enable precise targeting of therapeutic concentrations (e.g., 2% vs. 4%), which may be essential where efficacy is concentration dependent. Under these controlled conditions, FiH2 is stable, reproducible, and safely constrained.
If nasal cannulas are used, FiH2 cannot be inferred from flow rate alone. The delivered concentration depends on minute ventilation, mean and/or peak inspiratory flow, duty cycle, nasal patency, and reservoir capture. These listed parameters vary substantially both across individuals and within the same individual over time. As demonstrated in this work, identical flow rates may produce therapeutic, subtherapeutic, or unsafe (flammable or hypoxic) concentrations depending on the individual and their breathing pattern, anatomy, or session context. Thus, nasal-cannula dosing requires first determining the target FiH2 and then tailoring the H2 flow rate to the individual’s ventilatory characteristics, while also accounting for altitude-dependent changes in partial pressure.
Inhalation of oxyhydrogen is a viable method for H2 delivery but warrants particular caution because of its intrinsic flammability and detonation risk. Moreover, it offers no therapeutic advantage when FiH2 is matched to hydrogen-in-air systems and oxygen saturation is normal. Its use should be limited to appropriately certified devices with adequate engineering controls.
Adopting an FiH2-based framework unifies the language, dosing, and physiological interpretation of hydrogen inhalation therapy and provides a rigorous foundation for methodological consistency across experimental and clinical studies, and establish the long-term safety of H2 inhalation. To advance the field, researchers and clinicians are strongly encouraged to standardize reporting of inhaled hydrogen exposure by specifically including FiH2, either measured directly or calculated from the discussed respiratory parameters and flow-rate relationships, along with interface characteristics and elevation, rather than device output alone. Standardized FiH2 will enhance reproducibility, allow for personalized flow rates tailored to the individual patient to reach targeted FiH2, and accelerate the safe, personalized, and clinically reliable translation of hydrogen inhalation therapy.
Data availability
No datasets were generated or analysed during the current study.
Abbreviations
- ARDS:
-
Acute respiratory distress syndrome
- COPD:
-
Chronic obstructive pulmonary disease
- DC:
-
Duty cycle (inspiratory duty cycle; DC = Tᵢ/Tₜₒₜ)
- FH2 :
-
Fraction of H2 delivered
- FiH2 :
-
Fraction of inspired hydrogen
- FiO2 :
-
Fraction of inspired oxygen
- HFNC:
-
High-flow nasal cannula
- HRV:
-
Heart rate variability
- I:E:
-
Inspiratory:expiratory ratio
- I/R:
-
Ischemia–reperfusion
- IND:
-
Investigational New Drug
- LFL:
-
Lower flammability limit
- LFNC:
-
Low-flow nasal cannula
- MDA:
-
Malondialdehyde
- MET:
-
Metabolic equivalent of task (METs)
- MIF:
-
Mean inspiratory flow
- PIF:
-
Peak inspiratory flow
- Q̇H2 :
-
Device hydrogen flow rate
- RR:
-
Respiratory rate
- TE :
-
Expiratory time (non-inspiratory time)
- TI (Ti):
-
Inspiratory time
- V̇E :
-
Minute ventilation
- VT :
-
Tidal volume
- Vgeo:
-
Geometric re-inhalable volume (reservoir volume)
- η:
-
Inspiratory capture efficiency
- ξ:
-
Reservoir retention factor
References
Yıldız F, LeBaron TW, Alwazeer D. A comprehensive review of molecular hydrogen as a novel nutrition therapy in relieving oxidative stress and diseases: mechanisms and perspectives. Biochem Biophys Rep. 2025;41:101933.
Tamura T, Suzuki M, Homma K, Sano M, Iizuka R, Narimiya H, et al. Efficacy of inhaled hydrogen on neurological outcome following brain ischaemia during post-cardiac arrest care (HYBRID II): a multi-centre, randomised, double-blind, placebo-controlled trial. eClinicalMedicine. 2023;58. https://www.thelancet.com/journals/eclinm/article/PIIS2589-5370(23)00084-6/fulltext
Bai JC, Yang HX, Zhan CC, Zhao LQ, Liu JR, Yang W. Hydrogen alleviates right ventricular hypertrophy by inhibiting ferroptosis via restoration of the Nrf2/HO-1 signaling pathway. World J Cardiol. 2025;17(6):104832.
Habet V, DeWaard T, Boggs KM, Fetch A, Puente BN, Sleeper LA, et al. Hydrogen’s feasibility and safety as a therapy in extracorporeal cardiopulmonary resuscitation (Hydrogen-FAST): study protocol for a trial of inhaled hydrogen gas as an adjunctive therapy in refractory cardiac arrest. Trials. 2025;26(1):481.
Leyse M. Preventing hydrogen explosions in severe nuclear accidents. NRDC report. 2014.
McQueen S, Stanford J, Satyapal S, Miller E, Stetson N, Papageorgopoulos D, et al. Department of energy hydrogen program plan. US Department of Energy (USDOE), Washington, DC (United States); 2020.
Coward HF, Jones GW. Limits of flammability of gases and vapors: US Government Printing Office; 1952.
West JB. Respiratory physiology: the essentials: Lippincott Williams & Wilkins; 2012.
Fuentes S, Chowdhury YS. Fraction of inspired oxygen. 2020.
LeBaron TW, Sharpe R, Pyatakovich FA, Artamonov MY. Hydrogen: From Stars to Fuel to Medicine. Molecular Hydrogen in Health and Disease: Springer; 2024. p. 1–20.
Sander R. Compilation of Henry’s law constants (version 5.0. 0) for water as solvent. Atmos Chem Phys. 2023;23(19):10901–2440.
Ono H, Nishijima Y, Ohta S, Sakamoto M, Kinone K, Horikosi T, et al. Hydrogen Gas Inhalation Treatment in Acute Cerebral Infarction: A Randomized Controlled Clinical Study on Safety and Neuroprotection. J Stroke Cerebrovasc Dis. 2017;26(11):2587–94. https://doi.org/10.1016/j.jstrokecerebrovasdis.2017.06.012.
Ono H, Nishijima Y, Adachi N, Sakamoto M, Kudo Y, Kaneko K, et al. A basic study on molecular hydrogen (H2) inhalation in acute cerebral ischemia patients for safety check with physiological parameters and measurement of blood H2 level. Med Gas Res. 2012;2(1):21.
Ohsawa I, Ishikawa M, Takahashi K, Watanabe M, Nishimaki K, Yamagata K, et al. Hydrogen acts as a therapeutic antioxidant by selectively reducing cytotoxic oxygen radicals. Nat Med. 2007;13(6):688–94.
Hayashida K, Sano M, Ohsawa I, Shinmura K, Tamaki K, Kimura K, et al. Inhalation of hydrogen gas reduces infarct size in the rat model of myocardial ischemia-reperfusion injury. J Card Fail. 2008;14(7):S168-S.
Shimouchi A, Nose K, Mizukami T, Che DC, Shirai M. Molecular hydrogen consumption in the human body during the inhalation of hydrogen gas. Adv Exp Med Biol. 2013;789:315–21.
Liu C, Kurokawa R, Fujino M, Hirano S, Sato B, Li XK. Estimation of the hydrogen concentration in rat tissue using an airtight tube following the administration of hydrogen via various routes. Sci Rep. 2014;4:5485.
Ostojic SM, Todorović N, Nedeljkovic D, Panic J, Borović TTV, Vranes M. Post-Intervention Kinetics of Hydrogen Gas Inhalation: Influence of Variable Exposure Durations. Adv Pharmacol Pharm. 2026.
Storz JF, Quiroga-Carmona M, Liphardt S, Herrera ND, Bautista NM, Opazo JC, et al. Extreme high-elevation mammal surveys reveal unexpectedly high upper range limits of Andean mice. Am Nat. 2024;203(6):726–35.
Negishi S, Ito M, Hasegawa T, Otake H, Ohkawara B, Masuda A, et al. The Rieske iron-sulfur protein is a primary target of molecular hydrogen. Redox Biol. 2025;88:103952.
Zaheer M, Tarnava A, Lebaron TW, Asgharzadeh F, Saroughi M, Yaghoubi A, et al. The effects of hydrogen-rich water on gut microbiota and related health outcomes: A systematic review. Lett Drug Des Discovery. 2025;22(9):100150.
Iuchi K, Imoto A, Kamimura N, Nishimaki K, Ichimiya H, Yokota T, et al. Molecular hydrogen regulates gene expression by modifying the free radical chain reaction-dependent generation of oxidized phospholipid mediators. Sci Rep. 2016;6:18971.
Wang Y, Wang J, Kuang Y, Shen W. Packaging with hydrogen gas modified atmosphere can extend chicken egg storage. J Sci Food Agric. 2022;102(3):976–83.
Kurioka T, Matsunobu T, Satoh Y, Niwa K, Shiotani A. Inhaled hydrogen gas therapy for prevention of noise-induced hearing loss through reducing reactive oxygen species. Neurosci Res. 2014.
Hayashi T, Yoshioka T, Hasegawa K, Miyamura M, Mori T, Ukimura A, et al. Inhalation of hydrogen gas attenuates left ventricular remodeling induced by intermittent hypoxia in mice. Am J Physiol Heart Circ Physiol. 2011;301(3):H1062-9.
Kura B, Bacova BS, Barancik M, Sykora M, Okruhlicova L, Tribulova N, et al. Perioperative Mitigation of Oxidative Stress with Molecular Hydrogen During Simulated Heart Transplantation in Pigs. In: Slezak J, Kura B, editors., et al., Molecular Hydrogen in Health and Disease. Cham: Springer Nature Switzerland; 2024. p. 179–93.
Rahman MH, Bajgai J, Sharma S, Jeong ES, Goh SH, Jang YG, et al. Effects of Hydrogen Gas Inhalation on Community-Dwelling Adults of Various Ages: A Single-Arm, Open-Label, Prospective Clinical Trial. Antioxidants (Basel). 2023;12(6).
Liu B, Jiang X, Xie Y, Jia X, Zhang J, Xue Y, et al. The effect of a low dose hydrogen-oxygen mixture inhalation in midlife/older adults with hypertension: A randomized, placebo-controlled trial. Front Pharmacol. 2022;13:1025487.
Salomez-Ihl C, Giai J, Barbado M, Paris A, Touati S, Alcaraz JP, et al. H2 inhalation therapy in patients with moderate COVID-19 (H2COVID): a prospective ascending-dose phase I clinical trial. Antimicrob Agents Chemother. 2024;68(8):e00573-24.
Gao YH, Chen J, Zhong H, Zhao Q. Effect of hydrogen–oxygen inhalation on sleep disorders and abnormal mood: a single-blind, randomized controlled trial. Med Gas Res. 2026;16(2):98–102.
Korovljev D, Trivic T, Štajer V, Drid P, Sato B, Ostojic S. Short-term H2 inhalation improves cognitive function in older women: a pilot study. Int J Gerontol. 2020;14:149–50.
Hirano SI, Ichikawa Y, Sato B, Takefuji Y, Satoh F. Successful treatment of myalgic encephalomyelitis/chronic fatigue syndrome using hydrogen gas: four case reports. Med Gas Res. 2024;14(2):84–6.
Hirayama M, Ito M, Minato T, Yoritaka A, LeBaron TW, Ohno K. Inhalation of hydrogen gas elevates urinary 8-hydroxy-2′-deoxyguanine in Parkinson’s disease. Med Gas Res. 2018;8(4):144.
Yoritaka A, Kobayashi Y, Hayashi T, Saiki S, Hattori N. Randomized double-blind placebo-controlled trial of hydrogen inhalation for Parkinson’s disease: a pilot study. Neurol Sci. 2021;42(11):4767–70.
Nakashima-Kamimura N, Mori T, Ohsawa I, Asoh S, Ohta S. Molecular hydrogen alleviates nephrotoxicity induced by an anti-cancer drug cisplatin without compromising anti-tumor activity in mice. Cancer Chemother Pharmacol. 2009.
Kumagai K, Toyooka T, Takeuchi S, Otani N, Wada K, Tomiyama A, et al. Hydrogen gas inhalation improves delayed brain injury by alleviating early brain injury after experimental subarachnoid hemorrhage. Sci Rep. 2020;10(1):12319.
Kimura A, Suehiro K, Mukai A, Fujimoto Y, Funao T, Yamada T, et al. Protective effects of hydrogen gas against spinal cord ischemia-reperfusion injury. J Thorac Cardiovasc Surg. 2022;164(6):e269–83.
Zan R, Wang H, Cai W, Ni J, Luthringer-Feyerabend BJC, Wang W, et al. Controlled release of hydrogen by implantation of magnesium induces P53-mediated tumor cells apoptosis. Bioact Mater. 2022;9:385–96.
Sakai K, Cho S, Shibata I, Yoshitomi O, Maekawa T, Sumikawa K. Inhalation of hydrogen gas protects against myocardial stunning and infarction in swine. Scand Cardiovasc J. 2012;46(3):183–9.
Matchett GA, Fathali N, Hasegawa Y, Jadhav V, Ostrowski RP, Martin RD, et al. Hydrogen gas is ineffective in moderate and severe neonatal hypoxia-ischemia rat models. Brain Res. 2009;1259:90–7.
Kura B, Pavelkova P, Kalocayova B, Sykora M, Vlkovicova J, Kluknavsky M, et al. Comparison of hydrogen administration methods in the treatment of radiation-induced heart disease in rats. Can J Physiol Pharmacol.0(ja):null.
Ichikawa Y, Sato B, Takefuji Y, Satoh F. Preventable in-body hydrogen explosions from high-concentration H2 inhalers in Japan—Switch to safe, low-concentration hydrogen therapy. Int J Risk Safe Med. 2026;0(0):09246479251414573.
Kurokawa R, Hirano SI, Ichikawa Y, Matsuo G, Takefuji Y. Preventing explosions of hydrogen gas inhalers. Med Gas Res. 2019;9(3):160–2.
Johnsen HM, Hiorth M, Klaveness J. Molecular Hydrogen Therapy-A Review on Clinical Studies and Outcomes. Molecules. 2023;28(23).
Levitan R. Avoid Airway Catastrophes on the Extremes of Minute Ventilation. ACEPNow-The official Voice of Emergency Medicine. 2015.
Hoit JD, Lohmeier HL. Influence of continuous speaking on ventilation. J Speech Lang Hear Res. 2000;43(5):1240–51.
Tipton MJ, Harper A, Paton JFR, Costello JT. The human ventilatory response to stress: rate or depth? J Physiol. 2017;595(17):5729–52.
American Thoracic S, American College of Chest P. American Thoracic Society/American College of Chest Physicians Statement on Cardiopulmonary exercise testing. Am J Respir Crit Care Med. 2003;167:211–77.
Society AT, Physicians ACoC. American Thoracic Society/American College of Chest Physicians statement on cardiopulmonary exercise testing. Am J Respir Crit Care Med. 2003;167:211–77.
Mezzani A. Cardiopulmonary exercise testing: basics of methodology and measurements. Ann Am Thorac Soc. 2017;14(Supplement 1):S3–11.
Hall JE, Hall ME. Guyton and Hall Textbook of Medical Physiology E-Book: Guyton and Hall Textbook of Medical Physiology E-Book: Elsevier Health Sciences; 2020.
West JB, Luks AM. West's respiratory physiology: Lippincott Williams & Wilkins; 2020.
Philip KE, Lewis A, Buttery SC, McCabe C, Manivannan B, Fancourt D, et al. Physiological demands of singing for lung health compared with treadmill walking. BMJ Open Respir Res. 2021;8(1).
McArdle WD, Katch FI, Katch VL. Exercise physiology: nutrition, energy, and human performance: Lippincott Williams & Wilkins; 2010.
Hickey S, Sankari A, Giwa A. Mechanical ventilation. StatPearls. 2024.
Nunn JF. Applied respiratory physiology: Butterworth-Heinemann; 2013.
Clark FJ, von Euler C. On the regulation of depth and rate of breathing. J Physiol. 1972;222(2):267–95.
Shibayama Y, Dobashi S, Arisawa T, Fukuoka T, Koyama K. Impact of hydrogen-rich gas mixture inhalation through nasal cannula during post-exercise recovery period on subsequent oxidative stress, muscle damage, and exercise performances in men. Med Gas Res. 2020;10(4):155–62.
Dong G, Liu H, Chen Y, Bao D, Xu W, Zhou J. Hydrogen-rich gas enhanced sprint-interval performance: metabolomic insights into underlying mechanisms. Nutrients. 2024;16(14):2341.
Zhou S, Chatburn RL. Effect of the anatomic reservoir on low-flow oxygen delivery via nasal cannula: constant flow versus pulse flow with portable oxygen concentrator. Respir Care. 2014;59(8):1199–209.
Rau J, Shelledy D. The effect of varying inspiratory flow waveforms on peak and mean airway pressures with a time-cycled volume ventilator: a bench study. Respir Care. 1991;36(5):347–56.
Barnes CN, Mahler DA, Ohar JA, Lombardi DA, Crater GD. Peak inspiratory flows: defining repeatability limits and a predictive equation for different inhalers. Chest. 2020;158(4):1413–9.
Marini J. Monitoring the Mechanically Ventilated Patient. Crit Care Clin. 2007.
Gurung P, Higgins TL. Principles and Practice of Mechanical Ventilation 3rd Ed. Anesth Analg. 2013;117(5):1264.
Jõgi R, Mattila L, Vahteristo M, Takala A, Lähelmä S, Vartiainen VA, et al. Inspiratory Flow Parameters Through Dry Powder Inhalers in Healthy Volunteers and Patients with Chronic Obstructive Pulmonary Disease (COPD): Device Resistance Does Not Limit Use in COPD. Int J Chron Obstruct Pulmon Dis. 2021;16(null):1193–201.
Liu H, Qu P, Liu Q, Xiao F, Yang Y, Xu L, et al. High-flow nasal cannula oxygen therapy: physiological basis and clinical applications in anesthesia. Front Med. 2025;12.
Stewart M, Ferguson B, Fromer L. Epidemiology and burden of nasal congestion. Int J Gen Med. 2010;3:37–45.
Slavin RG. Treating rhinitis in the older population: special considerations. Allergy Asthma Clin Immunol. 2009;5(1):9.
Dąbrowska-Bień J, Skarżyński H, Górski SF, Skarżyński PH. Quality of life in patients with nasal obstruction after septoplasty: a single institution prospective observational study. Int Arch Otorhinolaryngol. 2021;25(4):e575–9.
Värendh M, Andersson M, Bjørnsdottir E, Hrubos-Strøm H, Johannisson A, Arnardottir ES, et al. Nocturnal nasal obstruction is frequent and reduces sleep quality in patients with obstructive sleep apnea. J Sleep Res. 2018;27(4):e12631.
Baptist AP, Nyenhuis S. Rhinitis in the elderly. Immunol Allergy Clin North Am. 2016;36(2):343–57.
Batool S, Garg R. Appropriate use of oxygen delivery devices. Open Anesth J. 2017;11(1).
Zhou Z-Q, Zhong C-H, Su Z-Q, Li X-Y, Chen Y, Chen X-B, et al. Breathing hydrogen-oxygen mixture decreases inspiratory effort in patients with tracheal stenosis. Respiration. 2018;97(1):42–51.
Lin H-Y, Lai P-C, Chen W-L. A narrative review of hydrogen-oxygen mixture for medical purpose and the inhaler thereof. Med Gas Res. 2020;10(4):193–200.
Van Diest I, Verstappen K, Aubert AE, Widjaja D, Vansteenwegen D, Vlemincx E. Inhalation/exhalation ratio modulates the effect of slow breathing on heart rate variability and relaxation. Appl Psychophysiol Biofeedback. 2014;39(3–4):171–80.
Dole M, Wilson FR, Fife WP. Hyperbaric hydrogen therapy: a possible treatment for cancer. Science. 1975;190(4210):152–4.
Ichikawa Y, Hirano S-i, Sato B, Yamamoto H, Takefuji Y, Satoh F. Guidelines for the selection of hydrogen gas inhalers based on hydrogen explosion accidents. Med Gas Res. 2023;13(2):43–8.
Ordin PM. Safety standard for hydrogen and hydrogen systems guidelines for hydrogen system design, materials selection, operations, storage and transportation. 1997.
Ennis R. Electrical Safety-Related Work Practices: OSHA Manual. CRC Press; 2024.
Sharma S, Ghoshal SK. Hydrogen the future transportation fuel: from production to applications. Renew Sustain Energy Rev. 2015;43:1151–8.
Tsuchikane M, Yamagiwa T, Takada T, Wakai S, Inokuchi S. A case of lung injury due to a hydrogen explosion caused by the simultaneous use of two home folk remedies devices. Acute Med Surg. 2024;11(1):e70019.
Julian CG, Gore CJ, Wilber RL, Daniels JT, Fredericson M, Stray-Gundersen J, et al. Intermittent normobaric hypoxia does not alter performance or erythropoietic markers in highly trained distance runners. J Appl Physiol. 2004;96(5):1800–7.
Knaupp W, Khilnani S, Sherwood J, Scharf S, Steinberg H. Erythropoietin response to acute normobaric hypoxia in humans. J Appl Physiol (1985). 1992;73(3):837–40.
Sydykov A, Mamazhakypov A, Maripov A, Kosanovic D, Weissmann N, Ghofrani HA, et al. Pulmonary hypertension in acute and chronic high altitude maladaptation disorders. Int J Environ Res Public Health. 2021;18(4):1692.
Bestavashvili A, Glazachev O, Bestavashvili A, Suvorov A, Zhang Y, Zhang X, et al. Intermittent hypoxic-hyperoxic exposures effects in patients with metabolic syndrome: correction of cardiovascular and metabolic profile. Biomedicines. 2022;10(3):566.
Burtscher M. Effects of living at higher altitudes on mortality: a narrative review. Aging Dis. 2014;5(4):274–80.
Burtscher J, Kopp M, Gassmann M, Burtscher M. Health benefits of life at moderate altitude: does hypoxia matter? Front Physiol. 2025;16.
Singer M, Young PJ, Laffey JG, Asfar P, Taccone FS, Skrifvars MB, et al. Dangers of hyperoxia. Crit Care. 2021;25(1):440.
Diop S, Mounier R. Partial pressure of oxygen, hyperoxemia and hyperoxia in the intensive care or anesthesia setting. Med Gas Res. 2026;16(1):53–8.
Guan WJ, Wei CH, Chen AL, Sun XC, Guo GY, Zou X, et al. Hydrogen/oxygen mixed gas inhalation improves disease severity and dyspnea in patients with Coronavirus disease 2019 in a recent multicenter, open-label clinical trial. J Thorac Dis. 2020;12(6):3448–52.
O’Driscoll BR, Howard LS, Earis J, Mak V. British thoracic society guideline for oxygen use in adults in healthcare and emergency settings. BMJ Open Respir Res. 2017;4(1):e000170.
Wu F, Liang T, Liu Y, Wang C, Sun Y, Wang B. Effects of perioperative hydrogen inhalation on brain edema and prognosis in patients with glioma: a single-center, randomized controlled study. Front Neurol. 2024;15:1413904.
Zheng ZG, Sun WZ, Hu JY, Jie ZJ, Xu JF, Cao J, et al. Hydrogen/oxygen therapy for the treatment of an acute exacerbation of chronic obstructive pulmonary disease: results of a multicenter, randomized, double-blind, parallel-group controlled trial. Respir Res. 2021;22(1):149.
Punampalam R. Examination of molecular hydrogen (H2) treatment and electromagnetic field (EMF) radiation effects on the growth of animal (zebrafish embryos) and plant (Chlorella vulgaris). Karlsruher Institut für Technologie (KIT), Karlsruhe (Germany). KIT-Fakultät …; 2022.
Yamamoto R, Homma K, Suzuki S, Sano M, Sasaki J. Hydrogen gas distribution in organs after inhalation: real-time monitoring of tissue hydrogen concentration in rat. Sci Rep. 2019;9(1):1255.
Ito M, Hirayama M, Yamai K, Goto S, Ichihara M, Ohno K. Drinking hydrogen water and intermittent hydrogen gas exposure, but not lactulose or continuous hydrogen gas exposure, prevent 6-hydorxydopamine-induced Parkinson’s disease in rats. Med Gas Res. 2012;2(1):15.
Acknowledgements
Not applicable.
Funding
JNK reports federal funding from the following grants: NIH/NHLBI 4R33HL164373, NIH/NHLBI 1R01HL175158-01, NIH/NICHD 1R43HD116647-01.
Author information
Authors and Affiliations
Contributions
Conceptualization: TWL; methodology: TWL, KO; writing—original draft preparation: TWL, KO; writing—review and editing: KO, CSI, PC, FB, MS, JNK; supervision: KO, MS, JNK. All authors read and approved the final manuscript.
Corresponding author
Ethics declarations
Ethics approval and consent to participate
Not applicable. This study did not involve human participants, human data, or human tissue, and did not involve animal experiments.
Consent for publication
Not applicable.
Competing interests
TWL serves as Scientific Officer of InhaleH2.com; MS has received advisory fees and research funding from Doctors Man Co., Ltd. JNK reports federal funding from the following grants: NIH/NHLBI 4R33HL164373, NIH/NHLBI 1R01HL175158-01, NIH/NICHD 1R43HD116647-01. All other authors declare that they have no competing interests.
Additional information
Publisher’s Note
Springer Nature remains neutral with regard to jurisdictional claims in published maps and institutional affiliations.
Rights and permissions
Open Access This article is licensed under a Creative Commons Attribution-NonCommercial-NoDerivatives 4.0 International License, which permits any non-commercial use, sharing, distribution and reproduction in any medium or format, as long as you give appropriate credit to the original author(s) and the source, provide a link to the Creative Commons licence, and indicate if you modified the licensed material. You do not have permission under this licence to share adapted material derived from this article or parts of it. The images or other third party material in this article are included in the article’s Creative Commons licence, unless indicated otherwise in a credit line to the material. If material is not included in the article’s Creative Commons licence and your intended use is not permitted by statutory regulation or exceeds the permitted use, you will need to obtain permission directly from the copyright holder. To view a copy of this licence, visit http://creativecommons.org/licenses/by-nc-nd/4.0/.
About this article

Cite this article
LeBaron, T.W., Ohno, K., Salomez-Ihl, C. et al. Respiratory-physiology modeling of therapeutic hydrogen inhalation: defining the fraction of inspired hydrogen (FiH2) and flow-rate requirements. Respir Res 27, 259 (2026). https://doi.org/10.1186/s12931-026-03664-9
Received:
Accepted:
Published:
Version of record:
DOI: https://doi.org/10.1186/s12931-026-03664-9