
Abstract
Background
Understanding prognostic information can help patients know what may happen to their health over time and make informed decisions. However, communicating prognostic information well can be challenging.
Purpose
To conduct a systematic review to identify and synthesize research that has evaluated visual presentations that communicate quantitative prognostic information to patients or the public.
Data sources
MEDLINE, EMBASE, CINAHL, PsycINFO, ERIC and the Cochrane Central Register of Controlled Trials (CENTRAL) (from inception to December 2020), and forward and backward citation search.
Study selection
Two authors independently screened search results and assessed eligibility. To be eligible, studies required a quantitative design and comparison of at least one visual presentation with another presentation of quantitative prognostic information. The primary outcome was comprehension of the presented information. Secondary outcomes were preferences for or satisfaction with the presentations viewed, and behavioral intentions.
Data extraction
Two authors independently assessed risk of bias and extracted data.
Data synthesis
Eleven studies (all randomized trials) were identified. We grouped studies according to the presentation type evaluated. Bar graph versus pictograph (3 studies): no difference in comprehension between the groups. Survival vs mortality curves (2 studies): no difference in one study; higher comprehension in survival curve group in another study. Tabular format versus pictograph (4 studies): 2 studies reported similar comprehension between groups; 2 found higher comprehension in pictograph groups. Tabular versus free text (3 studies): 2 studies found no difference between groups; 1 found higher comprehension in a tabular group.
Limitations
Heterogeneity in the visual presentations and outcome measures, precluding meta-analysis.
Conclusions
No visual presentation appears to be consistently superior to communicate quantitative prognostic information.
Introduction
Shared decision making is a bidirectional communication process in which clinicians and patients collaborate on making a health decision and discuss the available options (based on the best available evidence), the benefits and harms of each option, and the patient’s values, preferences, and circumstances [1, 2]. As part of making decisions about the prevention or management of a health condition, patients need to know about more than just treatment options; they also need to know about the prognosis of the condition, with and without treatment.
Communication of prognostic information is essential as it helps patients to know what may happen to their health over time, to make appropriate preparations, and to make informed decisions about whether to intervene and if so, how. If prognostic information is not communicated adequately, patients may have inaccurate expectations about the likely course of their illness [3,4,5]. Poor communication of prognostic information can also make patients anxious, confused, and damage the relationship between clinician and patient [6, 7].
Prognosis communication can be complex and challenging for clinicians and patients. Clinicians sometimes try to avoid or delay this kind of communication, while patients often wait for their clinicians to initiate the process [8]. As with the communication of treatment information, a contributor to the challenge of communicating prognostic information well is the difficulty that clinicians and patients can have understanding relevant quantitative information [9,10,11].
To facilitate discussion about prognosis, clinicians may use visual means (such as a graph) to present the quantitative information. Although there is a large body of synthesized evidence on how to communicate the quantitative benefits and harms of treatments, we are unaware of any synthesis about the various visual presentations that can be used to communicate quantitative prognostic information.
Methods
The protocol of this systematic review is registered at (CRD42020192564) and can be found in the Open Science Framework osf.io/ze26g.
Objective
This systematic review aimed to identify and synthesize research that has evaluated visual presentations that communicate quantitative prognostic information to patients or the public.
Information sources
We searched for studies in six databases: MEDLINE, EMBASE, CINAHL, ERIC, PsycINFO, and the Cochrane Central Register of Controlled Trials (CENTRAL), each from date of inception till December 2020. We used a tailored search strategy for each database (see Additional file 1). Forward and backward citation analysis of the included studies was performed using Web of Science.
Eligibility criteria
Study types and participants
We included only studies with a quantitative design that looked at the prognosis of any health condition (real condition, hypothetical scenario, or fictitious condition). The only participation restriction was the exclusion of health professionals or health professional students. Studies of mixed populations (e.g. health professionals and patients) were eligible if data were reported separately for the eligible group. There was no limitation on study setting or publication language.
Interventions
Studies were eligible if they compared a visual presentation (e.g. a graph, words and numbers displayed in tabular format) with at least one another type of presentation (e.g. another type of graph, or free text) to display quantitative prognostic information and included a specified time frame (e.g. over the next 5 years) or time point (e.g. at 1 year). Prognostic information was defined as information about the likelihood of any future outcome in patients with a given health condition including those who received no treatment (natural history) or those who did.
Outcomes
Our primary outcome was comprehension of the presented information that was assessed using questions that required a quantitative answer (e.g. likelihood or duration of the outcome). For this reason, only some of the questions asked were eligible. Studies/data that assessed comprehension with questions requiring qualitative responses were ineligible. Secondary outcomes included: preferences for any of the presentations evaluated; satisfaction with the presentation; and behavioral intentions relevant to the information presented (e.g. intention to be screened).
Study selection
Two authors (EA and MB) independently screened the titles and abstracts, and then the full text of potentially included studies. Discrepancies were resolved through consultation with the other two senior authors (CDM and TH).
Data extraction and risk of bias assessment
Data were extracted into a custom-designed spreadsheet. The studies’ characteristics (e.g., study settings, sampling methods, study design) and participants’ characteristics (e.g., age, sex, educational level, health literacy level, numeracy level, and the health condition studied). Intervention details (including type of presentation (e.g., bar graph), the presented information, who delivered the information, how, where and when the information was delivered), outcome details (including the eligible outcomes, how they were measured and at what timepoints) and result details (including number of responses analysed, follow up rate, results of eligible studies) are tabulated in the Additional file 1 and show the data extracted. Two authors (EA and MB) independently extracted relevant data and assessed risk of bias of included studies using the Cochrane Risk of Bias tool for randomized trials—version 2 (RoB2) [12]. Any discrepancies either in data extraction or risk of bias assessment were resolved by consulting the other two senior authors (CDM and TH).
Analysis
Due to heterogeneity of the primary outcome measures (comprehension) and visual presentations used, we were unable to conduct a meta-analysis and therefore report the results narratively. The percentage of participants who answered each eligible question correctly are reported separately for each question and we calculated the average percentage correct across the eligible questions in each study. In studies that did not report the percentage correct for an individual question, we extracted the overall percentage correct for all comprehension questions as reported in the studies.
Modifications from the protocol
After reviewing the articles generated from our search, we added explicit exclusion criteria that were not detailed in our protocol. Studies that compared alternative statistical formats (e.g. relative risk reduction vs. absolute risk reduction) and studies that compared the framing (i.e. positive or negative) of health information were excluded as they have been previously synthesized [13, 14]. Also excluded were studies that only compared methods of wording free text for conveying prognostic information. The eligibility of the primary outcome measure was also clarified to include questions that required participants to perform a quantitative calculation and then select the answer from categorical or dichotomous response options. The search strategy (see Additional file 1) was slightly modified by adding more MeSH terms (e.g., Comprehension, Knowledge, Data Display, Communication, Perception, “Decision Making, Shared”) at the request of reviewers during the peer-review process. This resulted in no additional eligible studies.
Results
Study selection
Our search identified 5648 articles across the databases and 614 articles identified through forward and backward citation analysis of the included studies (6262 in total), 5133 remained after duplicates were removed. After the full-text screening, we identified 9 articles: in 2 of these, 2 separate studies were reported, resulting in 11 eligible studies [15,16,17,18,19,20,21,22,23] (Fig. 1).

PRISMA flow chart of systematic search and selection
Characteristics of included studies
All 11 included studies were randomized trials. Seven studies were conducted in the United States, 3 in Germany, and 1 in the United Kingdom. The total number of participants was 9737 (mean 885, range 120 to 2305). All participants were adults; 4 studies included only men, 3 studies included only women, 3 included both, and 1 did not report this. Eight studies were conducted online and 3 face-to-face. Health information in the interventions related to the prognosis of cancer (9 studies), middle ear infection (1 study), and multiple sclerosis (1 study). Details of the included studies are presented in the Table of characteristics (see Additional file 1).
Risk of bias assessment
The overall assessment of the risk of bias of the 11 studies was judged at “some concerns” level. All included articles were judged to have “some concerns” for at least one domain of risk of bias. Ten studies had “some concerns” for the selection of reported results and six had “some concerns” for their randomization process. (Fig. 2a, b).

Risk of bias assessment of the included studies. a: overall, b: individual studies
Visual presentations evaluated
Details of the visual presentations evaluated are provided in the Additional file 1 (Table of interventions). Studies were grouped into 4 categories according to the presentation type they used: 6 studies compared a graphic format to another graphic format: 3 studies compared a bar graph to a pictograph/icon array, 2 studies compared survival curves to mortality curves, and 1 study compared two variations of pictographs (the last is covered in “other comparisons”. Four studies compared a graphic format to a tabular format (also known as a ‘fact box’), Three studies compared a tabular format to free text. (Fig. 3).
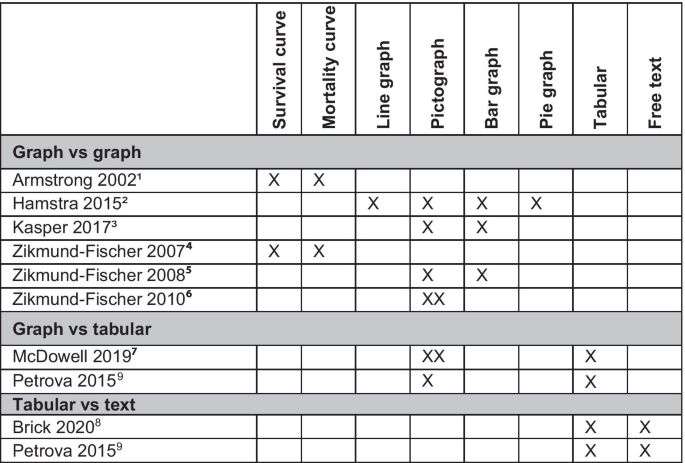
Interventions compared in the included studies. 1A third group received both survival and mortality curve. 2Eight interventions with variation of each format type were tested (3 pictographs, 2 bar graphs, 1 line graph, 2 pie graphs). 3Four interventions: 2 static (bar graph, pictograph) and 2 animated (bar graph, pictograph). 4Survival curves were delivered either in 5y or 15y worth data and the same for mortality curves. 5Four interventions were tested (4-options pictograph, 4-options bar graph, 2-options pictograph, 2-options bar graph). 6Two pictographs; a graph with survival only outcome versus a graph with multiple outcomes. 7The three formats were embedded in fact box format, two studies were reported one face to face and one online. 8Two conditions were tested in this study; only one contained prognostic information (middle ear infection) and was included. 9Two studies were reported (breast cancer screening, female participants) and (prostate cancer screening, male participants). Each study tested 3 interventions (pictograph, tabular, free text). X refers to a study group
Primary outcome: comprehension
Graph versus graph (6 studies)
Bar graph versus pictograph (i.e. icon array) (3 studies)
Three studies compared bar graphs to pictographs (see Fig. 4a). There was no statistically significant difference in comprehension between these types of graphs [17, 18, 21]. One of the studies enrolled 420 men and randomized them to 1 of 8 graph variations communicating the likelihood of recurrence of prostate cancer over 3-time points (including: 3 pictographs and 2 bar graphs variations). It found that 89% of participants who viewed pictographs (regardless of the variation shown) answered comprehension questions correctly compared to 87% of those who viewed bar graphs (regardless of the variation shown) [17].

Comprehension results of visual presentation comparisons (a-d). Graphs are different in each study (see Table of interventions in the Additional file 1). Questions are different in each study, for exact wording (see Table of outcomes in the Additional file 1). Kasper 2017 has 1 eligible question. Petrova 2015-1 and 2 reported the overall comprehension per format
In a study on breast cancer prognosis, 1619 participants were randomized to 1 of 4 graph variations (2 pictographs, 2 bar graphs), 51% of participants who viewed pictographs (regardless of the variation) answered comprehension questions correctly compared to 42% who viewed bar graphs (regardless of the variation) [21]. In a study with 682 people with multiple sclerosis, participants were randomized to 1 of 4 graph variations (2 pictographs, 2 bar graphs). The question about prognosis was answered correctly by 91% of those who viewed the pictograph, compared to 64% who viewed the bar graph [18].
Survival curves versus mortality curves (2 studies)
Two studies measured comprehension after presenting participants with either survival curves or mortality curves (Fig. 4b). A study on the communication of breast cancer prognosis analyzed responses of 1461 participants and found that there was no difference in comprehension regardless of whether a survival or mortality curve was presented [22]. A study of 451 participants, using a colon cancer scenario, found that those who viewed survival curves scored significantly better than those who viewed mortality curves, with an average correct difference of 13%. A group of participants in the same study who were shown both survival and mortality curves performed slightly better than the group who only saw mortality curves, but the difference was not significant [15].
Graph versus tabular format (i.e. fact box) format (4 studies)
Four studies compared pictographs to a tabular format (Fig. 4c). Two studies (reported in the same article, one conducted face-to-face and one online) used three groups to compare a tabular format alone, to a tabular format plus a single pictograph (that showed both benefits and harms), to a tabular format plus two pictographs (one showing benefits and one showing harms). In both studies, the authors reported that the interventions had a similar effect in facilitating comprehension. An average of 74% of participants who viewed the tabular format in the face-to-face study (75% in the online study) compared to 80% who viewed the pictographs (results from both pictograph formats combined) (60% in the online study) correctly answered comprehension questions [20].
Another article reported two studies: a study communicating prostate cancer screening information for male participants and a study communicating breast cancer screening for female participants. The study about prostate cancer found that the use of a pictograph format significantly improved comprehension (P = 0.003) compared to a tabular format, with 72% and 61% of participants answered correctly, respectively. Similar results were reported in the breast cancer study, with 62% of those who viewed the pictograph were able to answer the questions correctly compared to 58% who viewed the tabular format [19].
Tabular format versus text (3 studies)
Three studies compared a tabular format to a free text format (Fig. 4d). Two studies (reported in the same article) found no significant difference between using a tabular format and free text to communicate prostate cancer prognosis to male participants and prognosis of breast cancer to female participants. In the prostate cancer study, 64% of participants who viewed the text format compared to 61% who viewed the tabular format answered the questions correctly. In the breast cancer study, 61% of those who viewed the text format answered correctly compared to 60% of those who viewed tabular format [19]. A study communicating prognosis of acute middle ear infection with and without antibiotics found that participants who saw a tabular format scored significantly higher on comprehension questions than those who saw a free text format (85% vs 72% correctly answering) [16].
Other comparisons
Static formats were better understood than animated formats when displayed online in a German web-based study of 682 people with multiple sclerosis [18]. Displays that contained less information were generally better understood than those with more as found in two studies conducted by the same author [21, 23]. One of these found that pictographs with information about the outcome of two treatment alternatives, compared to those with four, were significantly better understood [21]. In the other study, pictographs that presented data for only one outcome (survival only; the number of women alive after 10 years who had treatment) were significantly better understood than pictographs that presented information about multiple outcomes (survival, mortality due to cancer, mortality due to all causes) [23].
Secondary outcomes
Format preference (1 study)
In the study that randomized participants to 1 of 8 formats (3 pictographs, 2 bar graphs, 1 line graph, 2 pie graphs), participants preferred the bar graph and thought they would understand it better than other formats. The pictograph was rated the lowest on both preference and expected understanding, regardless of the format they were randomized to. Overall, there was no statistically significant difference between graph preference and comprehension in this study [17].
Satisfaction (2 studies)
In a study that compared 4 visual presentations (2 bar graph variations, 2 pictograph variations), both the pictograph formats (4-options pictograph and 2-options pictograph) received statistically significantly higher satisfaction scores compared to the 4-options bar graph. However, even though participants were significantly more satisfied with the 2-options bar graph compared to the 4-options bar graph, the satisfaction scores were not as high as for the pictograph formats [21]. In another study, a pictograph that contained only survival data had significantly higher satisfaction scores than a pictograph showing multiple outcomes [23]. Participants of the study involving middle ear infection prognostic information reported being more engaged with the tabular format compared to the free text format [16].
Behavioral intentions (4 studies)
Participants in the communication of breast cancer prognosis study who viewed the survival-only pictograph were statistically significant less likely to say that they would have both chemotherapy and hormonal therapy compared to those who viewed the multiple outcome pictograph (P = 0.04) [23]. In a 3-arm study that used colon cancer information to compare survival curves, mortality curves, and both curves, participants who viewed survival curves were more likely to choose a preventive colectomy than an annual exam compared to the other two groups [15]. In the study of providing middle ear infection prognostic information, the format did not affect participants’ recommendation to a family member to use antibiotics [16]. Two studies on the communication of prostate cancer prognosis screening outcomes found no association between the type of presentation and the intention to be screened for prostate cancer at any measurement time point in two studies (one conducted online, one conducted face to face) [20].
Discussion and conclusion
Discussion
Our main finding is that from the existing studies there does not appear to be a single type of visual presentation that is consistently superior over another for improving the comprehension of quantitative prognostic information for members of the public. In the few studies that examined this, simpler formats (such as one outcome instead of multiple, and fewer intervention options presented at one time) were generally better understood and achieved higher levels of satisfaction. The impact of various types of visual presentations on behavioral intention is inconsistent.
Many primary studies and reviews [9, 10, 13, 14, 24,25,26,27,28,29,30,31], have investigated various methods of communicating treatment benefits and harms. While there are similarities between the communication of treatment benefits and harms and the communication of prognosis information, the extent to which methods identified as superior for communicating treatment quantitative information are also suitable for facilitating the comprehension of prognosis information is unknown. Similar to the findings of a review of methods of communicating quantitative treatment information [9], we found little difference between bar graphs and pictographs in facilitating comprehension and that there is no superior single method for conveying quantitative information.
Research on the comprehension of information from a survival curve with different variations found that comprehension was generally good across each variation [32]. Our review found inconsistent findings of the comparative effect of survival and mortality curves for the comprehension of prognosis information. However, we only identified two studies that had examined this. Details of the chosen curve, such as the complexity of information and the time frame used in the curve, maybe as important as the type of curve [33,34,35,36,37].
The strengths of our systematic review arise from the rigorous method of systematically identifying, screening, and reviewing the relevant literature. Our search was not limited by language; however, studies that do not have an English language title or abstract in the databases might have been missed. Although we searched six databases and conducted citation analysis of the included studies, we may have missed eligible studies. A meta-analysis was precluded due to heterogeneity of the included studies as they used many variations of visual presentations and comprehension was assessed with different measures. Most of the included studies were conducted online, using hypothetical scenarios with participants who did not have the condition being presented. Studies involving participants with the condition of interest may generate different impacts on comprehension, satisfaction, and decisions.
Few primary studies have compared the effectiveness of different visual presentations on the comprehension of quantitative prognostic information and more are needed. Most of the existing studies used cancer scenarios and so future research that explores other conditions would address this research gap, as would head-to-head studies that compare the different presentations. As the superiority of any single visual presentation was not established in this review, visual presentations should be co-designed and piloted with the target population before widespread use.
Conclusions
From the existing research, there is inconsistency about the superiority of a particular visual presentation to use when discussing quantitative prognostic information with patients. Any of the existing visual presentations that were identified in this review may be suitable to use to aid comprehension.
Practice implication
Any of the visual presentations identified may be suitable to aid clinicians in discussing prognostic information with patients or their carers. More primary research is needed to identify how patients or the general public understand the prognostic information. Piloting any newly developed tool to communicate prognosis with the target population is highly recommended.
Availability of data and materials
The protocol of this review is registered at PROSPERO (CRD42020192564) and can be found in the Open Science Framework osf.io/ze26g. More information is provided in the Additional file 1. The datasets used and/or analysed during the current study are available from the corresponding author on reasonable request.
References
Charles C, Gafni A, Whelan T. Shared decision-making in the medical encounter: what does it mean? (or it takes at least two to tango). Soc Sci Med. 1997;44(5):681–92.
Hoffmann TC, Montori VM, Del Mar C. The connection between evidence-based medicine and shared decision making. JAMA. 2014;312(13):1295–6.
Hawley ST, Janz NK, Griffith KA, Jagsi R, Friese CR, Kurian AW, et al. Recurrence risk perception and quality of life following treatment of breast cancer. Breast Cancer Res Treat. 2017;161(3):557–65.
Janssens AC, de Boer JB, van Doorn PA, van ver Ploeg HM, van ver Meche FG, Passchier J, et al. Expectations of wheelchair-dependency in recently diagnosed patients with multiple sclerosis and their partners. Eur J Neurol. 2003;10(3):287–93.
Kendel F, Helbig L, Neumann K, Herden J, Stephan C, Schrader M, et al. Patients’ perceptions of mortality risk for localized prostate cancer vary markedly depending on their treatment strategy. Int J Cancer. 2016;139(4):749–53.
Paladino J, Lakin JR, Sanders JJ. Communication strategies for sharing prognostic information with patients: beyond survival statistics. JAMA. 2019.
Sisk BA, Dobrozsi S, Mack JW. Teamwork in prognostic communication: addressing bottlenecks and barriers. Pediatr Blood Cancer. 2020;67(5):e28192.
van der Wal MHL, Hjelmfors L, Stromberg A, Jaarsma T. Cardiologists' attitudes on communication about prognosis with heart failure patients. ESC Heart Fail. 2020.
Zipkin DA, Umscheid CA, Keating NL, Allen E, Aung K, Beyth R, et al. Evidence-based risk communication: a systematic review. Ann Intern Med. 2014;161(4):270–80.
Ancker JS, Senathirajah Y, Kukafka R, Starren JB. Design features of graphs in health risk communication: a systematic review. J Am Med Inform Assoc. 2006;13(6):608–18.
Garcia-Retamero R, Cokely ET. Designing visual aids that promote risk literacy: a systematic review of health research and evidence-based design heuristics. Hum Factors. 2017;59(4):582–627.
Higgins JP, Altman DG, Gotzsche PC, Juni P, Moher D, Oxman AD, et al. The cochrane Collaboration's tool for assessing risk of bias in randomised trials. BMJ. 2011;343:d5928.
Akl EA, Oxman AD, Herrin J, Vist GE, Terrenato I, Sperati F, et al. Using alternative statistical formats for presenting risks and risk reductions. Cochrane Database Syst Rev. 2011(3):CD006776.
Akl EA, Oxman AD, Herrin J, Vist GE, Terrenato I, Sperati F, et al. Framing of health information messages. Cochrane Database Syst Rev. 2011(12):CD006777.
Armstrong K, Schwartz JS, Fitzgerald G, Putt M, Ubel PA. Effect of framing as gain versus loss on understanding and hypothetical treatment choices: survival and mortality curves. Med Decis Making. 2002;22(1):76–83.
Brick C, McDowell M, Freeman ALJ. Risk communication in tables versus text: a registered report randomized trial on 'fact boxes'. R Soc Open Sci. 2020;7(3):190876.
Hamstra DA, Johnson SB, Daignault S, Zikmund-Fisher BJ, Taylor JM, Larkin K, et al. The impact of numeracy on verbatim knowledge of the longitudinal risk for prostate cancer recurrence following radiation therapy. Med Decis Mak. 2015;35(1):27–36.
Kasper J, van de Roemer A, Pottgen J, Rahn A, Backhus I, Bay Y, et al. A new graphical format to communicate treatment effects to patients—a web-based randomized controlled trial. Health Expect. 2017;20(4):797–804.
Petrova D, Garcia-Retamero R, Cokely ET. Understanding the harms and benefits of cancer screening: a model of factors that shape informed decision making. Med Decis Mak. 2015;35(7):847–58.
McDowell M, Gigerenzer G, Wegwarth O, Rebitschek FG. Effect of tabular and icon fact box formats on comprehension of benefits and harms of prostate cancer screening: a randomized trial. Med Decis Mak. 2019;39(1):41–56.
Zikmund-Fisher BJ, Fagerlin A, Ubel PA. Improving understanding of adjuvant therapy options by using simpler risk graphics. Cancer. 2008;113(12):3382–90.
Zikmund-Fisher BJ, Fagerlin A, Ubel PA. Mortality versus survival graphs: improving temporal consistency in perceptions of treatment effectiveness. Patient Educ Couns. 2007;66(1):100–7.
Zikmund-Fisher BJ, Fagerlin A, Ubel PA. A demonstration of “less can be more” in risk graphics. Med Decis Mak. 2010;30(6):661–71.
Garcia-Retamero R, Okan Y, Cokely ET. Using visual aids to improve communication of risks about health: a review. ScientificWorldJournal. 2012;2012:562637.
Lipkus IM, Hollands JG. The visual communication of risk. J Natl Cancer Inst Monogr. 1999;25:149–63.
Trevena LJ, Zikmund-Fisher BJ, Edwards A, Gaissmaier W, Galesic M, Han PK, et al. Presenting quantitative information about decision outcomes: a risk communication primer for patient decision aid developers. BMC Med Inform Decis Mak. 2013;13(Suppl 2):S7.
Edwards A, Elwyn G, Mulley A. Explaining risks: turning numerical data into meaningful pictures. BMJ. 2002;324(7341):827–30.
Lipkus IM. Numeric, verbal, and visual formats of conveying health risks: suggested best practices and future recommendations. Med Decis Mak. 2007;27(5):696–713.
Wills CE, Holmes-Rovner M. Patient comprehension of information for shared treatment decision making: state of the art and future directions. Patient Educ Couns. 2003;50(3):285–90.
Fischhoff B, Brewer N, Downs J. Communicating risks and benefits: an evidence based user's guide. MD: US Department of Health and Human Services, Food and Drug Administration (FDA) Silver Spring; 2011.
Naik G, Ahmed H, Edwards AG. Communicating risk to patients and the public. Br J Gen Pract. 2012;62(597):213–6.
Rakow T, Wright RJ, Bull C, Spiegelhalter DJ. Simple and multistate survival curves: can people learn to use them? Med Decis Mak. 2012;32(6):792–804.
Zikmund-Fisher BJ, Fagerlin A, Ubel PA. What’s time got to do with it? Inattention to duration in interpretation of survival graphs. Risk Anal. 2005;25(3):589–95.
Mazur DJ, Hickam DH. Patients’ and physicians’ interpretations of graphic data displays. Med Decis Mak. 1993;13(1):59–63.
Mazur DJ, Hickam DH. Interpretation of graphic data by patients in a general medicine clinic. J Gen Intern Med. 1990;5(5):402–5.
Mazur DJ, Hickam DH. Five-year survival curves: how much data are enough for patient-physician decision making in general surgery? Eur J Surg. 1996;162(2):101–4.
Mazur DJ, Merz JF. How the manner of presentation of data influences older patients in determining their treatment preferences. J Am Geriatr Soc. 1993;41(3):223–8.
Acknowledgements
We thank Justin Clark for his consultation and valuable advice in the development of the search strategy.
Funding
No specific funding was received for this systematic review; however, the first author is supported on a PhD scholarship which is funded by the Centre for Research Excellence in Minimising Antibiotic Resistance in the Community (CRE-MARC), funded by the National Health and Medical Research Council (NHMRC), Australia (Reference Number: 1153299). CDM and TH are chief investigators of CREMARC and MB is employed as a postdoctoral research fellow on this grant.
Author information
Authors and Affiliations
Contributions
EA, TH, CDM conceived the study, EA developed the search strategy with consultation from TH, CDM and information specialist Justin Clark. EA and MB screened, assessed the eligibility, and assessed the quality of the included studies with consultation from TH and CDM. EA analysed the data and created the figures with consultation from TH and CDM. EA is responsible for the data management and storage. EA drafted the manuscript, and all authors reviewed the manuscript and approved the final version for submission.
Corresponding author
Ethics declarations
Ethics approval and consent to participate
Not applicable.
Consent for publication
Not applicable.
Competing interests
The authors declare that they have no competing interests.
Additional information
Publisher's Note
Springer Nature remains neutral with regard to jurisdictional claims in published maps and institutional affiliations.
Supplementary Information
Additional file 1
: the additional file includes: Search strategy, Table of characteristics, Table of interventions,Table of outcomes, and Table of excluded studies.
Rights and permissions
Open Access This article is licensed under a Creative Commons Attribution 4.0 International License, which permits use, sharing, adaptation, distribution and reproduction in any medium or format, as long as you give appropriate credit to the original author(s) and the source, provide a link to the Creative Commons licence, and indicate if changes were made. The images or other third party material in this article are included in the article's Creative Commons licence, unless indicated otherwise in a credit line to the material. If material is not included in the article's Creative Commons licence and your intended use is not permitted by statutory regulation or exceeds the permitted use, you will need to obtain permission directly from the copyright holder. To view a copy of this licence, visit http://creativecommons.org/licenses/by/4.0/. The Creative Commons Public Domain Dedication waiver (http://creativecommons.org/publicdomain/zero/1.0/) applies to the data made available in this article, unless otherwise stated in a credit line to the data.
About this article

Cite this article
Abukmail, E., Bakhit, M., Del Mar, C. et al. Effect of different visual presentations on the comprehension of prognostic information: a systematic review. BMC Med Inform Decis Mak 21, 249 (2021). https://doi.org/10.1186/s12911-021-01612-9
Received:
Accepted:
Published:
DOI: https://doi.org/10.1186/s12911-021-01612-9