
Abstract
Background
Insulin resistance (IR) in skeletal muscle is a key feature of the pre-diabetic state, hypertension, dyslipidemia, cardiovascular diseases and also predicts type 2 diabetes. However, the underlying molecular mechanisms are still poorly understood.
Methods
To explore these mechanisms, we related global skeletal muscle gene expression profiling of 38 non-diabetic men to a surrogate measure of insulin sensitivity, i.e. homeostatic model assessment of insulin resistance (HOMA-IR).
Results
We identified 70 genes positively and 110 genes inversely correlated with insulin sensitivity in human skeletal muscle, identifying autophagy-related genes as positively correlated with insulin sensitivity. Replication in an independent study of 9 non-diabetic men resulted in 10 overlapping genes that strongly correlated with insulin sensitivity, including SIRT2, involved in lipid metabolism, and FBXW5 that regulates mammalian target-of-rapamycin (mTOR) and autophagy. The expressions of SIRT2 and FBXW5 were also positively correlated with the expression of key genes promoting the phenotype of an insulin sensitive myocyte e.g. PPARGC1A.
Conclusions
The muscle expression of 180 genes were correlated with insulin sensitivity. These data suggest that activation of genes involved in lipid metabolism, e.g. SIRT2, and genes regulating autophagy and mTOR signaling, e.g. FBXW5, are associated with increased insulin sensitivity in human skeletal muscle, reflecting a highly flexible nutrient sensing.
Background
Insulin resistance (or low insulin sensitivity) in skeletal muscle is a key feature of the pre-diabetic state and a predictor of type 2 diabetes (T2D) [1, 2]. It is also observed in individuals with hypertension, dyslipidemia, and cardiovascular diseases [3]. Insulin resistance (IR) in skeletal muscle has been attributed to different pathological conditions such as mitochondrial dysfunction [4], impaired glycogen synthesis [5], and accumulation of diacylglycerol with subsequent impairment of insulin signaling [6]. One hypothesis that has been put forward is a re-distribution of lipid stores from adipose tissue to non-adipose tissues (e.g. skeletal muscle, liver and the insulin-producing β-cells), the so-called overflow or ectopic fat distribution hypothesis. In support, studies have reported a strong correlation between intramuscular triacylglycerol (IMTG) content and IR [7, 8]. However, and in contrast, endurance-trained athletes have been shown to be highly insulin sensitive despite having large IMTG depots [9, 10]. One possible explanation for this discrepancy is that it is not the IMTG content per se that is important for the development of IR, but rather the relationship between IMTG content and muscle oxidative capacity. A reduced oxidative capacity in skeletal muscle from T2D individuals [11, 12], and in lean, insulin resistant offspring of T2D patients [13] has been found, supporting the hypothesis that IR in skeletal muscle is associated with dysregulation of intramyocellular fatty acid metabolism. Interestingly in a cohort of elderly twins, IMTG content seems to have a greater influence on hepatic as opposed to peripheral IR [14]. Furthermore, an association between mitochondrial dysfunction and decreased expression of autophagy-related genes in skeletal muscle from severely insulin resistant patients with T2D has previously been shown [15]. Conversely, enhancing autophagy in mice leads to an anti-ageing phenotype, including leanness and increased insulin sensitivity [16].
The aim of this study was therefore to investigate molecular mechanisms, e.g. IMTG content, associated with insulin sensitivity in skeletal muscle by relating global skeletal muscle gene expression with a surrogate measure of insulin sensitivity, i.e. homeostatic model assessment of insulin resistance (HOMA-IR).
Methods
Human participants and clinical measurements
Results from two separate clinical studies (studies A and B) are reported here.
Study A
To identify genes correlated to insulin sensitivity in skeletal muscle, we studied 39 non-diabetic men from Malmö, Sweden [17, 18]. Briefly, the Malmö Exercise Intervention cohort consists of 50 sedentary but otherwise healthy male subjects from southern Sweden. They all have European ancestry and 24 of them have a first-degree family member with T2D. Muscle biopsies were collected from 39 of the subjects. The mean age and body mass index (BMI) were 37.71 ± 4.38 years and 28.47 ± 2.96 kg/m2, respectively, and the mean 1/the homeostatic model assessment-insulin resistance (HOMA-IR) was 0.69 ± 0.25 (Supplementary Table S1).
Study B
To replicate the findings from study A, we studied an additional 10 healthy young non-diabetic men without any family history of diabetes, from a previously described study [19]. The mean age and BMI were 25.33 ± 0.99 years and 24.57 ± 1.86 kg/m2, respectively, and the mean 1/HOMA-IR was 1.17 ± 0.36 (Supplementary Table S2). Here, we included baseline gene expression profile data (i.e. only before bed rest) from part of a larger study on the influence of physical inactivity in healthy and prediabetic individuals [19].
None of the study participants were directed to avoid extreme physical exercise and alcohol intake for at least 2 days before the studies [20]. The participants were asked to fast for 10–12 h before examination days. Fasting blood samples and anthropometric data were obtained from all participants. All participants underwent an oral glucose tolerance test (OGTT; 75 g) and glucose tolerance was classified in accordance with World Health Organization criteria [21]. Homeostasis model assessment -insulin resistance (1/HOMA-IR = 22.5 / (fasting plasma insulin (μU/ml) x fasting plasma glucose (mmol/l))) was calculated for all participants in both studies and used as a surrogate measure of insulin sensitivity [22, 23]. The muscle biopsies were obtained from the vastus lateralis muscle under local anesthesia in individuals participating in all studies using a modified Bergström needle [24, 25].
We excluded data from two participants (one from each studies A and B) with extreme values of insulin sensitivity (more than 1.5 * interquartile range) for further analysis. Both studies were approved by local ethics committees and all participants gave their informed consent for participation.
RNA extraction and hybridization
Muscle biopsies were taken from the right vastus lateralis muscle under local anesthesia (Lidocaine 1%), using a 6 mm Bergström needle (Stille AB, Sweden). In both studies, biopsies were immediately stored in RNAlater (Ambion, Austin, TX) and after overnight incubation at 4 °C snap frozen at − 80 °C until further processing. The double staining method was used for capillary staining. Myofibrillar ATPase histochemistry was performed by preincubation at pH 4.4, 4.6, and 10.3 to identify muscle fiber types [18]. Computer image analysis was performed using BioPix IQ 2.0.16 software (BioPix AB, Sweden). RNA was extracted using Tri reagent (Sigma-Aldrich, St. Louis, MO) followed by RNeasy Midi kit (Qiagen, Düsseldorf, Germany). The RNA was further concentrated by RNeasy MiniElute (Qiagen, Düsseldorf, Germany) and SpeedVac (DNA 120 SpeedVac, Thermo Savant, Waltham, MA).
For study A, synthesis of biotin-labeled cRNA and hybridization to the Affymetrix Custom Array NuGO-Hs1a520180 GeneChip (http://www.nugo.org) were performed according to the manufacturer’s recommendation. This GeneChip contains 23,941 probesets for interrogation, including known genes and expressed sequenced tags. Images were analyzed using the GeneChip Operating System (GCOS; Affymetrix) software. For each array, the percentage present call was greater than 40.
For study B, targets were hybridized to the one-color (Cy3, green) Agilent Whole Human Genome Oligo Microarray (G4112F (Feature Number version)) which contains 44,000 60-mer oligonucleotide probes representing 41,000 unique genes and transcripts. Probe labeling and hybridization were performed according to manufacturer’s recommendation. Images were analyzed using the Agilent Feature Extraction Software (version 9.5).
Quantitative real-time PCR (QPCR)
A technical replication of the key findings from the microarray data, as well as expression analysis of key genes to be correlated with insulin stimulated glucose update, was conducted using QPCR. Reverse transcription was performed on 250 ng RNA (from 36 subjects in study A) or 200 ng RNA (from 7 subjects in the Muscle SATellite cell (MSAT) cohort) using the QuantiTect Reverse Transcription kit (Qiagen). QPCR was performed on a ViiA 7 real-time PCR system (Thermo Fisher Scientific) with 2 ng cDNA in 10 μl reactions and TaqMan Expression PCR Master Mix with duplex assays according to the manufacturer’s instructions. Samples were analyzed in triplicates on the same 384 well plate with 3 endogenous controls (POL2A (Hs00172187_m1), HPRT1 (4326321E, VIC-MGB) and PPIA (4326316E, VIC-MGB)) for both studies A and B. The expression levels were calculated and normalized by geometric averaging of the endogenous controls as previously described [26]. Assays: SIRT2 (Hs00247263_m1), FBXW5 (Hs00382591_g1) and CPT1B (Hs00189258_m1). Endogenous control assays: POLR2A (Hs00172187_m1), HPRT1 (4326321E, VIC-MGB) and PPIA (4326316E, VIC-MGB) for the 7 subjects in the Muscle SATellite cell (MSAT) cohort.
Isolation and cultivation of human muscle satellite cells
Muscle satellite cells were isolated from 7 subjects from an ongoing unpublished MSAT study. Subjects were male with a mean age of 35.6 ± 10.6 years, a mean BMI of 25.1 ± 3.6 kg/m2 and a mean fasting plasma glucose value of 5.2 ± 0.2 mmol/L. Muscle biopsies were obtained from the vastus lateralis muscle under local anesthesia in individuals participating in all studies using a modified Bergström needle. Biopsies were minced into small pieces with scissors and digested in a digestion solution (Ham’s F-10 Nutrient mix (Gibco®, #31550015), Trypsin-EDTA (0.25%) (HyClone, SV30031.01), Collagenase IV (1 mg/ml) (Sigma, C5138), BSA (5 mg/ml) (Sigma, A2153)) at 37 °C for a total of 15–20 min. After this, cells were passed through a 70 μm cell strainer and centrifuged at 800 g for 7 min. The pellet was washed and resuspended in growth medium (Ham’s F-10 Nutrient Mix, GlutaMAX™ Supplement (Gibco®, #41550021), FBS (20%) (Sigma, F7524), Antibiotic/Antimycotic Solution (Gibco®, #15240062)) and cells were pre-plated on a culture dish and incubated for 3 h at 37 °C and 5% CO2 to allow fibroblast to attach to the plate. After this, the suspended cells were transferred to a flask pre-coated with matrigel (Corning #356234) and were incubated for 4 days at 37 °C and 5% CO2 in growth medium. Medium was then changed every other day. After about a week, cells were detached using TrypLE (TrypLE™ Express, no phenol red (Gibco®, #15090046)) and re-plated on the same flask to allow even distribution of cells over the surface.
At 70–80% confluence medium was changed first to an intermediate medium (DMEM, low glucose, GlutaMAX™ Supplement, pyruvate, No HEPES (Gibco® #21885025), FBS (10%) (Sigma, F7524), Antibiotics) for 24 h, and then to a differentiation medium (DMEM, low glucose, GlutaMAX™ Supplement, pyruvate, No HEPES (Gibco® #21885025), Horse serum (2%) (Invitrogen, #16050–130), Antibiotics) for 8 days, where glucose uptake experiments were performed. After 3 days of differentiation, Cytarabine (Ara-C) (10 μg/ml) (Sigma, C1768) was added to the differentiation medium, for 2 days, to prevent excessive growth of proliferating cells, e.g. fibroblasts [27].
Measurement of glucose uptake in cultured muscle cells
Measurement of glucose uptake in cultured muscle cells was performed using an enzymatic fluorometric assay as previously described [28]. Briefly, cells differentiated for 8 days grown in 12-well plates, were starved for 3 h in FBS-free DMHG low glucose medium (Gibco® #21885025) at 37 °C and 5% CO2. The cells were then washed in warm PBS and treated with either Cytochalasin B (10 μM) (Sigma, C6762) (for non-specific glucose uptake), Krebs-Ringer-HEPES (KRH) buffer only (basal glucose uptake) or with 100 nM insulin (Actrapid 100 IE/ml, Novo Nordisk) (stimulated glucose uptake) in a KRH buffer containing 0.1% BSA (pH 7.4) for 1 h at 37 °C and 5% CO2. After this, cells were incubated in a KRH buffer containing 2-Deoxy-D-glucose (2DG) (1 mM) (Sigma, D6134) for 15 min at room temperature, after which the cells were washed in ice-cold PBS and then frozen and stored at − 80 °C (for less than a week). Lysis was done by adding 0.1 M ice cold NaOH to the cells and incubate at 70 °C for 60 min, after which HCL and triethanolamine (TEA) buffer (pH 8.1) (Sigma, T1502) at final concentrations of 0.1 M and 50 mM respectively, were added to neutralize the lysate. Lysates and prepared series 2-Deoxy-D-glucose 6-phosphate (DG6P) (Santa Cruz, SC-220734) dilution standards (30, 15, 7.5, 3.75, 1.875, 0 μM) (dissolved in “lysate buffer” (0.1 M NaOH / 0.1 M HCl / 50 mM TEA buffer, pH 8.1; same proportion as samples), were transferred to a black 96-well assay plate (Greiner Bio-one International, 655076), 250 μl of assay solution (TEA buffer (50 mM) with KCl (50 mM) (pH 8), BSA (0.02%), NADP (0.1 mM) (Sigma, N8035), Diaphorase (0.2 U/ml) (Sigma, D2197), Resazurin (6 μM) (Sigma, R7017), G6PDH (15.4 U/ml) (Sigma, G8404)) was added to each well, and the plates were incubated for 60 min at 37 °C. Fluorescence was measured using the microplate reader (Infinite M200 Pro, Tecan) at wavelengths λex = 545 nm and λem = 590 nm. DG6P was then quantified by comparing the fluorescence intensity from the experimental samples to the DG6P standard curve. Value were adjusted for protein concentration determined with the Pierce™ Coomassie (Bradford) Protein Assay Kit (Thermo Fisher Scientific, 23200).
Quantification of mtDNA content
DNA was isolated from the muscle biopsies by phenol/chloroform/isoamyl alcohol extraction according to the manufacturer’s recommendation (Diagenode, Belgium). Concentration and purity were measured using a NanoDrop ND-1000 spectrophotometer (A260/A280 > 1.6 and A260/A230 > 1.0) (NanoDrop Technologies, Wilmington, DE, USA). QPCR was carried out using an Applied Biosystems 7900HT sequence detection system with 5 ng genomic DNA in 10 μl reactions and TaqMan Expression PCR Master Mix according to the manufacturer’s recommendations. All samples were analyzed in triplicates on the same 384 well plate (maximum accepted standard deviation in Ct-value of 0.1 cycles). Two assays (16S and ND6) were used to analyze mitochondrial DNA content (mtDNA) targeting the heavy and light strand, respectively. To analyze nuclear DNA (nDNA) content RNaseP was used as a target. The mtDNA content is calculated as the mean value of ND6 and 16S divided by 2 x RNaseP. Assays used: ND6 (Hs02596879_g1), 16S (Hs02596860_s1) and RNaseP (4316838).
Statistical analysis
Study A
We used ENTREZ custom chip definition files (http://brainarray.mbni.med.umich.edu) to regroup the individual probes into consistent probesets and remap to the correct sets of genes for Affymetrix Custom Array NuGO-Hs1a520180 array which resulted in a total of 16,313 genes from study A. We used three different procedures for normalization and summarization as described previously [29]: (1) The GC-content robust multi-array average (GC-RMA) method, (2) Probe logarithmic intensity error (PLIER) method (Affymetrix), and (3) Robust multi-array average (RMA) method [30,31,32,33,34]. We conducted filtering based on the Affymetrix microarray suite version 5.0 (MAS5.0) present/absent calls which classified each gene as expressed above background (present call) or not (absent or marginal call). We included genes, which have detection call as present call in at least 25% of arrays [35], which left 7947 genes out of 16,313 for further analysis in study A.
To identify a reliable list of genes regulating insulin sensitivity, Spearman partial correlation analysis was performed to determine the individual effects of each gene expression on a surrogate measure of insulin sensitivity (1/HOMA-IR) after adjusting for BMI, age and family history of T2D for each of three normalization methods namely GC-RMA, PLIER and RMA separately. We considered only those genes that were significantly correlated with insulin sensitivity with a P < 0.05 in all three different normalization methods.
To technically validate the microarray findings, real time quantitative PCR (QPCR) was used to measure the mRNA expression of FBXW5 and SIRT2 in human skeletal muscle from study A. Correlation between the microarray and QPCR experiments was determined using Spearman’s rank correlation coefficient test.
In the study A cohort, correlation between the QPCR expression values of SIRT2, FBXW5, CPT1B, FABP3, MLYCD, PPARG1A and ESRRA with % fiber type and mitochondrial DNA was determined using Spearman’s rank correlation coefficient test. All data except that of SIRT2 and FBXW5 was collected and reanalyzed from a previously described study [17, 18].
Enrichment analyses were performed on the genes whose expression levels in skeletal muscle were significantly correlated with insulin sensitivity in study A using the WEB-based GEne SeT AnaLysis Toolkit (WebGestalt) which implements the hypergeometric test [36].
Study B
The median intensities of each spot on the array were calculated using the GenePix Pro software (version 6). We performed quantile-based normalization between arrays without background subtraction using linear models for microarray data (limma) package in R [37, 38]. We removed poor quality probes that were either saturated (i.e. > 50% of the pixels in a feature are above the saturation threshold) or flagged as non-uniformity outlier (i.e. the pixel noise of feature exceeds a threshold for a uniform feature) in at least one array, which left 29,297 probes for further analysis [39].
Spearman partial correlation analysis was performed to determine the individual effects of each gene expression on a surrogate measure of insulin sensitivity (1/HOMA-IR) after adjusting for BMI and age. Due to the exploratory nature of the study, no correction for multiple testing was performed. Instead, we considered only those genes that were significantly, positively or inversely, correlated with insulin sensitivity in both studies A and B with a significance level set to 0.05. Paired Wilcoxon signed-rank test was conducted to assess for the change before and after insulin-stimulated glucose uptake. Spearman correlation analysis was between basal- and insulin-stimulated glucose uptake and mRNA expression of FBXW5, SIRT2 and CPT1B. All statistical analyses were performed using IBM® SPSS® Statistics, MATLAB® and R statistical software. The microarray data both studies have been deposited in the National Center for Biotechnology Information’s Gene Expression Omnibus (GEO) database (http://www.ncbi.nlm.nih.gov/geo); series accession number is GSE161721.
Results
To identify genes with skeletal muscle expression related to insulin sensitivity, we obtained muscle biopsies from 38 non-diabetic participants in study A (the data from one participant was excluded, Methods). Clinical characteristics of these participants are shown in Supplementary Table S1. We then profiled muscle gene expression using Affymetrix oligonucleotide microarrays. To replicate the findings from study A, we included 9 non-diabetic participants from study B (the data from one participant was excluded, Methods). Clinical characteristics of these participants are shown in Supplementary Table S2. We performed skeletal muscle gene expression profiling from these participants using the Agilent oligonucleotide microarrays. Insulin sensitivity was estimated using the 1/HOMA-IR method calculated from OGTT values (Methods).
Correlation with insulin sensitivity
Study A
We identified 70 genes positively (Supplementary Table S3) and 110 genes inversely (Supplementary Table S4) correlated with insulin sensitivity in human skeletal muscle. Using WebGestalt [36], we performed enrichment analyses of genes significantly correlated to insulin sensitivity. Of the Gene Ontology (GO) categories overrepresented in the 70 genes positively correlated to insulin sensitivity (Supplementary Table S3), several were related to autophagy (Supplementary Table S5). Among enriched Wikipathways of the positively correlated genes were mTOR signaling and thermogenesis (Supplementary Table S6). Enriched GO categories of the genes inversely correlated to insulin sensitivity (Supplementary Table S4) included platelet-derived growth factor binding, fibrillar collagen trimer, banded collagen fibril and complex of collagen trimers (Supplementary Table S7).
Among genes positively correlated with insulin sensitivity, several, including F-box and WD repeat domain containing 5 (FBXW5), TSC2, ULK1, ATG13, AKT1S1, SQSTM1 and TFEB were found to be regulated by or regulating mammalian target-of-rapamycin (mTOR) signaling and autophagy. Among genes involved in lipid metabolism were carnitine palmitoyltransferase 1B (CPT1B) (Fig. 1), the rate limiting enzyme for fatty acid oxidation, SLC27A1 (also known as long chain-fatty acid transport protein 1), a major transporter of fatty acids across the plasma membrane and PNPLA2 (also known as adipocyte triglyceride lipase (ATGL)) a triglyceride lipase known to be expressed in human skeletal muscle [40]. Also, the sirtuin 2 (SIRT2) gene positively correlated with insulin sensitivity, which is a family member of SIRT1 with well-known effects on peripheral insulin signaling [41]. Other interesting genes with relevance for skeletal muscle insulin sensitivity were uncoupling protein 2 (UCP2), an inner mitochondrial membrane protein, and genes with direct functional roles in skeletal muscle, e.g. obscurin, histidine rich calcium binding protein (HCR) and myocyte enhancer factor 2D (MEF2D) (Supplementary Table S3).
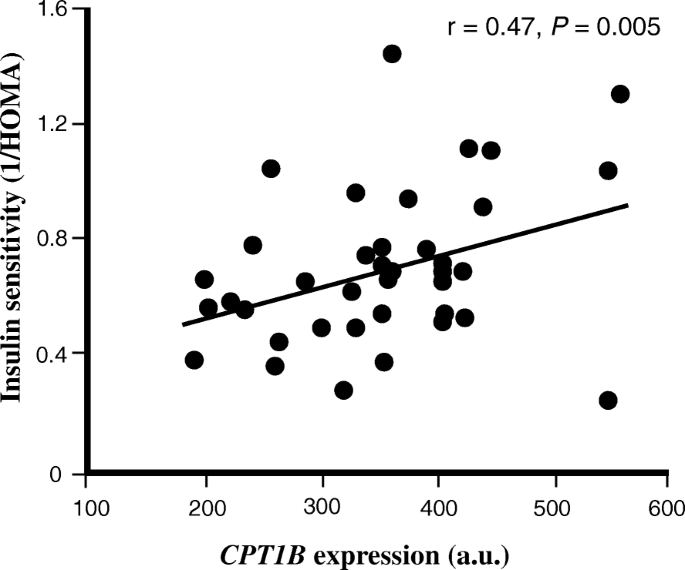
The skeletal muscle expression of CPT1B correlates with insulin sensitivity (1/HOMA-IR) in study A. The relationship between insulin sensitivity (1/HOMA-IR) and skeletal muscle expression of CPT1B in study A (n = 38). For illustration, gene expression data is shown for only GC-content robust multi-array average (GC-RMA) method
Among the genes inversely correlated with insulin sensitivity, several were associated with the extracellular matrix, such as collagen type I alpha 1 chain (COL1A1), collagen type I alpha 2 chain (COL1A2), collagen type III alpha 1 chain (COL3A1) and laminin subunit alpha 4 (LAMA4) (Supplementary Table S4).
Study B
In order to replicate the findings in study A, we analyzed muscle expression in an additional 9 healthy young non-diabetic men without any family history of diabetes. Of the genes found to be correlated with insulin sensitivity, 10 were replicated in study B. Seven of these genes were positively correlated (SIRT2, FBXW5, RAB11FIP5, CPT1B, C16orf86, UCKL1 and ARFGAP2) and three were inversely correlated (ZNF613, UTP6 and LEO1) with insulin sensitivity (Table 1).
Technical validation of the microarray data using real time quantitative PCR (QPCR)
To technically validate the microarray findings, QPCR was used to measure the mRNA expression of FBXW5 and SIRT2 in human skeletal muscle from study A. Significant correlation between the microarray and QPCR experiments was observed for both FBXW5 (r = 0.70, P < 0.001), SIRT2 (r = 0.60, P < 0.001) (Fig. 2) and CPT1B (r = 0.74, P < 0.001) (previously shown [18]). The expression of FBXW5 and SIRT2 analyzed with QPCR was also positively correlated with each other (r = 0.81, P < 0.001) and with the QPCR expression value of CPT1B (Table 2).
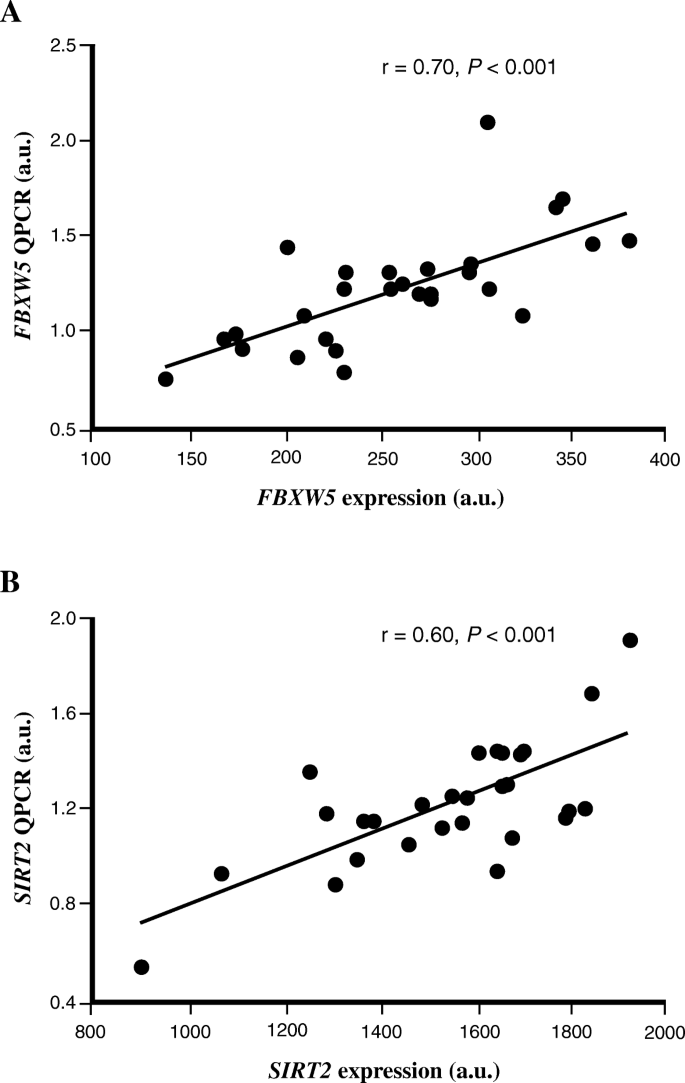
Technical replication of the microarray data using QPCR. The relative expression level of (a) FBXW5 and (b) SIRT2 genes were measured in study A using both microarray (x-axis) and QPCR (y-axis). Data was analyzed with Spearman’s rank correlation coefficient test (n = 29). For illustration, gene expression data is shown for only GC-content robust multi-array average (GC-RMA) method
Correlation between the QPCR expression of the replicated genes FBXW5, SIRT2 and CPT1B with the expression of key metabolic genes, fiber type and mitochondrial DNA content in skeletal muscle from study A participants and with in vitro glucose uptake in human myotube cells
The expression of FBXW5, SIRT2 and CPT1B, was positively correlated with malonyl-CoA decarboxylase (MLYCD) and fatty acid binding protein 3 (FABP3), key genes involved in transport and mitochondrial uptake and oxidation of fatty acids in muscle, and with estrogen related receptor alpha (ESRRA) and PPARGC1A (also known as PGC1α) (Table 2), i.e. with genes playing central roles in regulating mitochondrial biogenesis and oxidative phosphorylation in muscle [42]. Also, expression of FBXW5, SIRT2 and CPT1B was positively correlated with percent type I and inversely correlated with percent type II B fibers in skeletal muscle, and the expression of SIRT2 and CPT1B was also positively correlated with the amount of mitochondrial DNA (Table 3).
From the Muscle SATellite cell (MSAT) study, skeletal muscle myoblast cells were isolated and differentiated to myotubes. Insulin stimulation of the myotubes led to a ~ 35% increase (P = 0.018) in glucose uptake (Fig. 3a). Expression of FBXW5 (r = 0.79, P = 0.036) and SIRT2 (r = 0.79, P = 0.036), but not CPT1B (r = 0.49, P = 0.268) were positively correlated with glucose uptake during the basal, non-insulin-stimulated state (Fig. 3b-d). Similar correlations were observed in the insulin-stimulated state, i.e. FBXW5 (r = 0.86, P = 0.014) and SIRT2 (r = 0.82, P = 0.023), but not for CPT1B (r = 0.43, P = 0.333) (Fig. 3b-d).

Glucose uptake in isolated human myotube cells. a Insulin-stimulated glucose uptake: Insulin stimulation (1 h) led to a ~ 35% increase (P = 0.018) in glucose uptake. Correlation between basal- and insulin-stimulated glucose uptake and mRNA expression of (b) FBXW5 (rbasal = 0.79, P = 0.036 and rinsulin = 0.86, P = 0.014) (c) SIRT2 (rbasal = 0.79, P = 0.036 and rinsulin = 0.82, P = 0.023) and (d) CPT1B (rbasal = 0.49, P = 0.268 and rinsulin = 0.43, P = 0.333). n = 7 average values from 1 to 3 independent experiments per individual. For illustration, data were transformed using the natural logarithm (b-d)
Discussion
The objective of this study was to identify genes for which expression levels are correlated with insulin sensitivity in human skeletal muscle. Genes involved in fatty acid metabolism (CPT1B and SIRT2) and in autophagy and mTOR signaling (FBXW5), TSC complex subunit 2 (TSC2) and unc-51 like autophagy activating kinase 1 (ULK1) were found to be associated with insulin sensitivity and related traits (muscle fiber type distribution and mitochondrial number).
We replicated the findings for 10 genes from Study A in Study B using Agilent oligonucleotide microarrays, consisting of 60-mers probes compared to the short 25-mers probes utilized by Affymetrix. The expressions of SIRT2, FBXW5, RAB11FIP5, CPT1B, C16orf86, UCKL1 and ARFGAP2 were positively, whereas the expressions of ZNF613, UTP6 and LEO1 were inversely correlated with insulin sensitivity as assessed by 1/HOMA-IR in both studies.
Among the replicated genes positively correlated with insulin sensitivity was CPT1B. CPT1B regulates the transport of long-chain fatty acyl-CoAs from the cytoplasm into the mitochondria, a key regulatory step in lipid β-oxidation. There is strong evidence that β-oxidation, plays a crucial role in the development of IR, where inhibition of Cpt1b induces [43] and overexpression of Cpt1b ameliorates [44] IR in rats. Also, a common haplotype of CPT1B has been associated with the metabolic syndrome in male participants [45]. The krüppel-like transcription factor (KLF5) together with C/EBP-β and PPARδ regulate the expression of CPT1B and UCP2 (also positively correlated with insulin sensitivity (Supplementary Table S3) in skeletal muscle) [46]. Moreover, expression of Cpt1b and Ucp2 in skeletal muscle is up-regulated in the klf5-knockout heterozygous mouse, which is resistant to high fat-induced obesity and glucose intolerance. The skeletal muscle expression of CPT1B in humans is increased after treatment with a PPARδ agonist [47], and this agonist is also shown to increase muscle mitochondrial biogenesis and improve glucose homeostasis, the latter suggested to be mediated by enhanced fatty acid catabolism in muscle [48]. It is likely that the beneficial effect of the PPARδ agonist is partly due to induction of CPT1B in skeletal muscle. Other genes coupled to lipid metabolism whose expression positively correlated with insulin sensitivity include PNPLA2 (ATGL) and SLC27A1 (long chain-fatty acid transport protein 1; FATP-1). Although no correlation between insulin sensitivity and muscle ATGL expression has previously been reported, ATGL mRNA is shown to be strongly coupled to mRNA levels of CPT1B in human muscle [49]. Atgl, Cpt1b and Slc27a1 are highly expressed in insulin responsive oxidative type I fibers, and insulin-stimulated fatty acid uptake is largely dependent on Slc27a1 in rodent muscle [50]. Taken together, data presented here are in-line with and support previous findings that skeletal muscle lipid metabolism, and lipid β-oxidation in particular, plays an important role in the development of IR.
Another replicated gene in this study positively correlated with insulin sensitivity was SIRT2, a predominantly cytoplasmic deacetylase expressed in a wide range of metabolically relevant tissues. Increasing evidence suggests that the expression of SIRT2 is modulated in response to energy availability, being induced during low-energy status [51]. Conversely, dietary obesity and associated pathologies, e.g. IR, is linked to the capacity to suppress β-oxidation in visceral adipocytes, in part through transcriptional repression of SIRT2 with negative effects on the SIRT2-PGC1α regulatory axis [52]. SIRT2 is also described as a novel AKT interactor, critical for AKT activation by insulin, and the potential usefulness of SIRT2 activators in the treatment of insulin-resistant metabolic disorders has been discussed [53]. Unlike the well-documented effects of SIRT1 in skeletal muscle insulin signaling [41], the role of SIRT2 in skeletal muscle is much less defined. A study using mouse C2C12 skeletal muscle cells showed that down-regulation of Sirt2 in insulin resistant cells improved insulin sensitivity [54], raising the possibility that Sirt2 has tissue-specific roles regarding insulin sensitivity. The opposite findings presented here, showing a positive association between insulin sensitivity and SIRT2 gene expression in human skeletal muscle could highlight a differential role in various metabolic conditions, or species differences.
Of the enriched Gene Ontology (GO) categories of genes whose expression positively correlated with insulin sensitivity, several were related to autophagy, process utilizing autophagic mechanism and regulation of macroautophagy. Interestingly, we found the expression of FBXW5 to be positively correlated to insulin sensitivity in both study A and B. FBXW5 is part of an E3 ubiquitin ligase that regulates TSC2 protein stability and complex turnover [55], with indirect effects on mTOR. Moreover, a variant (rs546064512) in FBXW5 is shown to be associated with total cholesterol (odds ratio = 0.56 and P = 8.93 × 10− 4) in 12,940 individuals of multiple ancestries ([56] and The T2D Knowledge Portal: http://www.type2diabetesgenetics.org/). In the fed state insulin signaling activates mTOR, whereas in the fasted state AMPK has the opposite effect leading to inactivation of mTOR and activation of autophagy. ULK1 negatively regulates and is negatively regulated by mTOR, making mTOR a major convergence point for the regulation of autophagy [57]. ULK1 is also a key regulator of mitophagy, and it’s phosphorylation by AMPK is required for mitochondrial homeostasis and cell survival during starvation [58]. The large number of autophagy-related genes positively correlating with insulin sensitivity might result from the fasted state of the subjects (10–12 h) and could be a reflection of metabolic flexibility, i.e., the ability to switch from high rates of fatty acid uptake and lipid oxidation to suppression of lipid metabolism with a paralleled increase in glucose uptake, storage and oxidation in response to, e.g., feeding or exercise. Impaired autophagy has been implicated in ageing and IR, and induction of autophagy is required for muscle glucose homeostasis mediated by exercise in mice [59]. A crucial link between autophagy and insulin sensitivity in humans has been suggested in a study where skeletal muscle from severely insulin resistant subjects with T2D show a highly altered gene expression related to mitochondrial dysfunction and abnormal morphology, and that this is associated with decreased expression of autophagy-related genes [15].
Future studies are required to determine the potential role of the remaining replicated genes in the regulation of insulin sensitivity in human skeletal muscle, although it should be mentioned that RAB11FIP5, an AS160- and Rab-binding protein, is suggested to coordinate the protein kinase signaling and trafficking machinery required for insulin-stimulated glucose uptake in adipocytes [60]. Also, RAB11FIP5 is an effector protein of RAB11, a GTPase that regulates endosomal trafficking shown to be required for autophagosome formation [61], suggesting yet another link between the regulation of insulin sensitivity and autophagy in skeletal muscle.
The positive correlation of CPT1B, SIRT2 and FBXW5 expression with insulin sensitivity in this study is supported by the observed positive correlation of these genes with the expression of key genes promoting the phenotype of an insulin sensitive myocyte, e.g. transport and mitochondrial uptake and oxidation of fatty acids and positive regulation of mitochondrial biogenesis and oxidative phosphorylation (Tables 2 and 3). For SIRT2 and FBXW5, this was also supported by the correlation of these genes with glucose uptake measurements in human myotube cells (Fig. 3).
There are several issues to consider in the interpretation of the results. In both studies, we used 1/HOMA-IR as a surrogate measure of insulin sensitivity. The HOMA-IR index is based upon fasting measurements of insulin and glucose and thus more reflects variation in hepatic than in peripheral insulin sensitivity [62]. Although several studies have shown significant correlations between HOMA-IR and insulin-stimulated glucose uptake as measured by an euglycemic hyperinsulinemic clamp, this correlation cannot be expected to be very strong given the different physiological conditions they reflect [22, 63]. On the other hand, biopsies in both studies were obtained in the fasting state and should thus more correspond to conditions as measured by 1/HOMA-IR.
Conclusions
In conclusion, we present a catalog with muscle expression of 180 genes correlated with insulin sensitivity. This data provides compelling evidence that activation of genes involved in lipid metabolism, including SIRT2, and of genes involved the regulation of autophagy and mTOR signaling, e.g. FBXW5, are associated with increased insulin sensitivity in human skeletal muscle. Determining if these genes are causally related with insulin sensitivity in humans should be the aim of future studies.
Availability of data and materials
The microarray data both studies have been deposited in the National Center for Biotechnology Information’s Gene Expression Omnibus (GEO) database (http://www.ncbi.nlm.nih.gov/geo); series accession number is GSE161721.
Abbreviations
- 2DG:
-
2-Deoxy-D-glucose
- ATGL:
-
Adipocyte triglyceride lipase
- BMI:
-
Body mass index
- COL1A1:
-
Collagen type I alpha 1 chain
- COL1A2:
-
Collagen type I alpha 2 chain
- COL3A1:
-
Collagen type III alpha 1 chain
- CPT1B:
-
Carnitine palmitoyltransferase 1B
- DG6P:
-
2-Deoxy-D-glucose 6-phosphate
- ESRRA:
-
Estrogen related receptor alpha
- FABP3:
-
Fatty acid binding protein 3
- FBXW5:
-
F-box and WD repeat domain containing 5
- GCOS:
-
GeneChip Operating System
- GC-RMA:
-
Guanine cytosine-content robust multi-array analysis
- GEO:
-
Gene Expression Omnibus
- GO:
-
Gene Ontology
- HCR:
-
histidine rich calcium binding protein
- HOMA-IR:
-
Homeostatic model assessment-insulin resistance
- IMTG:
-
Intramuscular triacylglycerol
- IR:
-
Insulin resistance
- KLF5:
-
Krüppel-like transcription factor
- KRH:
-
Krebs-Ringer-HEPES
- LAMA4:
-
Laminin subunit alpha 4
- Limma:
-
Linear models for microarray data
- MAS5.0:
-
Affymetrix microarray suite version 5.0
- MEF2D:
-
Myocyte enhancer factor 2D (MEF2D)
- MLYCD:
-
Malonyl-CoA decarboxylase
- MSAT:
-
Muscle SATellite cell
- mtDNA:
-
mitochondrial DNA content
- mTOR:
-
mammalian target-of-rapamycin
- nDNA:
-
nuclear DNA
- OGTT:
-
Oral glucose tolerance test
- PLIER:
-
Probe logarithmic intensity error estimation
- PPARGC1A:
-
Peroxisome proliferator-activated receptor gamma coactivator 1 alpha
- QPCR:
-
Quantitative real-time polymerase chain reaction
- RMA:
-
Robust multi-array analysis
- SIRT2:
-
Sirtuin 2
- T2D:
-
Type 2 diabetes
- TEA:
-
Triethanolamine
- TSC2:
-
TSC complex subunit 2
- UCP2:
-
Uncoupling protein 2
- ULK1:
-
Unc-51 like autophagy activating kinase 1
- WebGestalt:
-
WEB-based GEne SeT AnaLysis Toolkit
References
Lillioja S, Mott DM, Spraul M, Ferraro R, Foley JE, Ravussin E, Knowler WC, Bennett PH, Bogardus C. Insulin resistance and insulin secretory dysfunction as precursors of non-insulin-dependent diabetes mellitus. Prospective studies of Pima Indians. N Engl J Med. 1993;329(27):1988–92.
Martin BC, Warram JH, Krolewski AS, Bergman RN, Soeldner JS, Kahn CR. Role of glucose and insulin resistance in development of type 2 diabetes mellitus: results of a 25-year follow-up study. Lancet. 1992;340(8825):925–9.
Bloomgarden ZT. Insulin resistance: current concepts. Clin Ther. 1998;20(2):216–31 discussion 215.
Kim JA, Wei Y, Sowers JR. Role of mitochondrial dysfunction in insulin resistance. Circ Res. 2008;102(4):401–14.
Sesti G. Pathophysiology of insulin resistance. Best Pract Res Clin Endocrinol Metab. 2006;20(4):665–79.
Petersen KF, Shulman GI. Etiology of insulin resistance. Am J Med. 2006;119(5 Suppl 1):S10–6.
Krssak M, Falk Petersen K, Dresner A, DiPietro L, Vogel SM, Rothman DL, Roden M, Shulman GI. Intramyocellular lipid concentrations are correlated with insulin sensitivity in humans: a 1H NMR spectroscopy study. Diabetologia. 1999;42(1):113–6.
Perseghin G, Scifo P, De Cobelli F, Pagliato E, Battezzati A, Arcelloni C, Vanzulli A, Testolin G, Pozza G, Del Maschio A, et al. Intramyocellular triglyceride content is a determinant of in vivo insulin resistance in humans: a 1H-13C nuclear magnetic resonance spectroscopy assessment in offspring of type 2 diabetic parents. Diabetes. 1999;48(8):1600–6.
Goodpaster BH, He J, Watkins S, Kelley DE. Skeletal muscle lipid content and insulin resistance: evidence for a paradox in endurance-trained athletes. J Clin Endocrinol Metab. 2001;86(12):5755–61.
Thamer C, Machann J, Bachmann O, Haap M, Dahl D, Wietek B, Tschritter O, Niess A, Brechtel K, Fritsche A, et al. Intramyocellular lipids: anthropometric determinants and relationships with maximal aerobic capacity and insulin sensitivity. J Clin Endocrinol Metab. 2003;88(4):1785–91.
Mootha VK, Lindgren CM, Eriksson KF, Subramanian A, Sihag S, Lehar J, Puigserver P, Carlsson E, Ridderstrale M, Laurila E, et al. PGC-1alpha-responsive genes involved in oxidative phosphorylation are coordinately downregulated in human diabetes. Nat Genet. 2003;34(3):267–73.
Patti ME, Butte AJ, Crunkhorn S, Cusi K, Berria R, Kashyap S, Miyazaki Y, Kohane I, Costello M, Saccone R, et al. Coordinated reduction of genes of oxidative metabolism in humans with insulin resistance and diabetes: potential role of PGC1 and NRF1. Proc Natl Acad Sci U S A. 2003;100(14):8466–71.
Befroy DE, Petersen KF, Dufour S, Mason GF, de Graaf RA, Rothman DL, Shulman GI. Impaired mitochondrial substrate oxidation in muscle of insulin-resistant offspring of type 2 diabetic patients. Diabetes. 2007;56(5):1376–81.
Grunnet LG, Laurila E, Hansson O, Almgren P, Groop L, Brons C, Poulsen P, Vaag A. The triglyceride content in skeletal muscle is associated with hepatic but not peripheral insulin resistance in elderly twins. J Clin Endocrinol Metab. 2012;97(12):4571–7.
Moller AB, Kampmann U, Hedegaard J, Thorsen K, Nordentoft I, Vendelbo MH, Moller N, Jessen N. Altered gene expression and repressed markers of autophagy in skeletal muscle of insulin resistant patients with type 2 diabetes. Sci Rep. 2017;7:43775.
Pyo JO, Yoo SM, Ahn HH, Nah J, Hong SH, Kam TI, Jung S, Jung YK. Overexpression of Atg5 in mice activates autophagy and extends lifespan. Nat Commun. 2013;4:2300.
Ekman C, Elgzyri T, Strom K, Almgren P, Parikh H, Dekker Nitert M, Ronn T, Manderson Koivula F, Ling C, Tornberg AB, et al. Less pronounced response to exercise in healthy relatives to type 2 diabetic subjects compared with controls. J Appl Physiol (1985). 2015;119(9):953–60.
Elgzyri T, Parikh H, Zhou Y, Dekker Nitert M, Ronn T, Segerstrom AB, Ling C, Franks PW, Wollmer P, Eriksson KF, et al. First-degree relatives of type 2 diabetic patients have reduced expression of genes involved in fatty acid metabolism in skeletal muscle. J Clin Endocrinol Metab. 2012;97(7):E1332–7.
Alibegovic AC, Sonne MP, Hojbjerre L, Bork-Jensen J, Jacobsen S, Nilsson E, Faerch K, Hiscock N, Mortensen B, Friedrichsen M, et al. Insulin resistance induced by physical inactivity is associated with multiple transcriptional changes in skeletal muscle in young men. Am J Physiol Endocrinol Metab. 2010;299(5):E752–63.
Parikh H, Carlsson E, Chutkow WA, Johansson LE, Storgaard H, Poulsen P, Saxena R, Ladd C, Schulze PC, Mazzini MJ, et al. TXNIP regulates peripheral glucose metabolism in humans. PLoS Med. 2007;4(5):e158.
Alberti KG, Zimmet PZ. Definition, diagnosis and classification of diabetes mellitus and its complications. Part 1: diagnosis and classification of diabetes mellitus provisional report of a WHO consultation. Diabet Med. 1998;15(7):539–53.
Matthews DR, Hosker JP, Rudenski AS, Naylor BA, Treacher DF, Turner RC. Homeostasis model assessment: insulin resistance and beta-cell function from fasting plasma glucose and insulin concentrations in man. Diabetologia. 1985;28(7):412–9.
Muniyappa R, Lee S, Chen H, Quon MJ. Current approaches for assessing insulin sensitivity and resistance in vivo: advantages, limitations, and appropriate usage. Am J Physiol Endocrinol Metab. 2008;294(1):E15–26.
Eriksson KF, Saltin B, Lindgarde F. Increased skeletal muscle capillary density precedes diabetes development in men with impaired glucose tolerance. A 15-year follow-up. Diabetes. 1994;43(6):805–8.
Parikh H, Nilsson E, Ling C, Poulsen P, Almgren P, Nittby H, Eriksson KF, Vaag A, Groop LC. Molecular correlates for maximal oxygen uptake and type 1 fibers. Am J Physiol Endocrinol Metab. 2008;294(6):E1152–9.
Vandesompele J, De Preter K, Pattyn F, Poppe B, Van Roy N, De Paepe A, Speleman F. Accurate normalization of real-time quantitative RT-PCR data by geometric averaging of multiple internal control genes. Genome Biol. 2002;3(7):RESEARCH0034.
Doynova MD, Markworth JF, Cameron-Smith D, Vickers MH, O'Sullivan JM. Linkages between changes in the 3D organization of the genome and transcription during myotube differentiation in vitro. Skelet Muscle. 2017;7(1):5.
Yamamoto N, Ueda-Wakagi M, Sato T, Kawasaki K, Sawada K, Kawabata K, Akagawa M, Ashida H. Measurement of Glucose Uptake in Cultured Cells. Curr Protoc Pharmacol. 2015;71:12 14 11–26.
Parikh H, Lyssenko V, Groop LC. Prioritizing genes for follow-up from genome wide association studies using information on gene expression in tissues relevant for type 2 diabetes mellitus. BMC Med Genet. 2009;2:72.
Irizarry RA, Bolstad BM, Collin F, Cope LM, Hobbs B, Speed TP. Summaries of Affymetrix GeneChip probe level data. Nucleic Acids Res. 2003;31(4):e15.
Irizarry RA, Hobbs B, Collin F, Beazer-Barclay YD, Antonellis KJ, Scherf U, Speed TP. Exploration, normalization, and summaries of high density oligonucleotide array probe level data. Biostatistics. 2003;4(2):249–64.
Kibriya MG, Jasmine F, Argos M, Verret WJ, Rakibuz-Zaman M, Ahmed A, Parvez F, Ahsan H. Changes in gene expression profiles in response to selenium supplementation among individuals with arsenic-induced pre-malignant skin lesions. Toxicol Lett. 2007;169(2):162–76.
Millenaar FF, Okyere J, May ST, van Zanten M, Voesenek LA, Peeters AJ. How to decide? Different methods of calculating gene expression from short oligonucleotide array data will give different results. BMC Bioinformatics. 2006;7:137.
Seo J, Hoffman EP. Probe set algorithms: is there a rational best bet? BMC Bioinformatics. 2006;7:395.
McClintick JN, Edenberg HJ. Effects of filtering by present call on analysis of microarray experiments. BMC Bioinformatics. 2006;7:49.
Liao Y, Wang J, Jaehnig EJ, Shi Z, Zhang B. WebGestalt 2019: gene set analysis toolkit with revamped UIs and APIs. Nucleic Acids Res. 2019;47(W1):W199–205.
Smyth GK, Speed T. Normalization of cDNA microarray data. Methods. 2003;31(4):265–73.
Zahurak M, Parmigiani G, Yu W, Scharpf RB, Berman D, Schaeffer E, Shabbeer S, Cope L. Pre-processing Agilent microarray data. BMC Bioinformatics. 2007;8:142.
Gandemer V, Rio AG, de Tayrac M, Sibut V, Mottier S, Ly Sunnaram B, Henry C, Monnier A, Berthou C, Le Gall E, et al. Five distinct biological processes and 14 differentially expressed genes characterize TEL/AML1-positive leukemia. BMC Genomics. 2007;8:385.
Zimmermann R, Strauss JG, Haemmerle G, Schoiswohl G, Birner-Gruenberger R, Riederer M, Lass A, Neuberger G, Eisenhaber F, Hermetter A, et al. Fat mobilization in adipose tissue is promoted by adipose triglyceride lipase. Science. 2004;306(5700):1383–6.
Kitada M, Kume S, Kanasaki K, Takeda-Watanabe A, Koya D. Sirtuins as possible drug targets in type 2 diabetes. Curr Drug Targets. 2013;14(6):622–36.
Mootha VK, Handschin C, Arlow D, Xie X, St Pierre J, Sihag S, Yang W, Altshuler D, Puigserver P, Patterson N, et al. Erralpha and Gabpa/b specify PGC-1alpha-dependent oxidative phosphorylation gene expression that is altered in diabetic muscle. Proc Natl Acad Sci U S A. 2004;101(17):6570–5.
Dobbins RL, Szczepaniak LS, Bentley B, Esser V, Myhill J, McGarry JD. Prolonged inhibition of muscle carnitine palmitoyltransferase-1 promotes intramyocellular lipid accumulation and insulin resistance in rats. Diabetes. 2001;50(1):123–30.
Bruce CR, Hoy AJ, Turner N, Watt MJ, Allen TL, Carpenter K, Cooney GJ, Febbraio MA, Kraegen EW. Overexpression of carnitine palmitoyltransferase-1 in skeletal muscle is sufficient to enhance fatty acid oxidation and improve high-fat diet-induced insulin resistance. Diabetes. 2009;58(3):550–8.
Auinger A, Rubin D, Sabandal M, Helwig U, Ruther A, Schreiber S, Foelsch UR, Doring F, Schrezenmeir J. A common haplotype of carnitine palmitoyltransferase 1b is associated with the metabolic syndrome. Br J Nutr. 2013;109(5):810–5.
Oishi Y, Manabe I, Tobe K, Ohsugi M, Kubota T, Fujiu K, Maemura K, Kubota N, Kadowaki T, Nagai R. SUMOylation of Kruppel-like transcription factor 5 acts as a molecular switch in transcriptional programs of lipid metabolism involving PPAR-delta. Nat Med. 2008;14(6):656–66.
Riserus U, Sprecher D, Johnson T, Olson E, Hirschberg S, Liu A, Fang Z, Hegde P, Richards D, Sarov-Blat L, et al. Activation of peroxisome proliferator-activated receptor (PPAR)delta promotes reversal of multiple metabolic abnormalities, reduces oxidative stress, and increases fatty acid oxidation in moderately obese men. Diabetes. 2008;57(2):332–9.
Reilly SM, Lee CH. PPAR delta as a therapeutic target in metabolic disease. FEBS Lett. 2008;582(1):26–31.
Yao-Borengasser A, Varma V, Coker RH, Ranganathan G, Phanavanh B, Rasouli N, Kern PA. Adipose triglyceride lipase expression in human adipose tissue and muscle. Role in insulin resistance and response to training and pioglitazone. Metabolism. 2011;60(7):1012–20.
Wu Q, Ortegon AM, Tsang B, Doege H, Feingold KR, Stahl A. FATP1 is an insulin-sensitive fatty acid transporter involved in diet-induced obesity. Mol Cell Biol. 2006;26(9):3455–67.
Gomes P, Fleming Outeiro T, Cavadas C. Emerging role of Sirtuin 2 in the regulation of mammalian metabolism. Trends Pharmacol Sci. 2015;36(11):756–68.
Krishnan J, Danzer C, Simka T, Ukropec J, Walter KM, Kumpf S, Mirtschink P, Ukropcova B, Gasperikova D, Pedrazzini T, et al. Dietary obesity-associated Hif1alpha activation in adipocytes restricts fatty acid oxidation and energy expenditure via suppression of the Sirt2-NAD+ system. Genes Dev. 2012;26(3):259–70.
Ramakrishnan G, Davaakhuu G, Kaplun L, Chung WC, Rana A, Atfi A, Miele L, Tzivion G. Sirt2 deacetylase is a novel AKT binding partner critical for AKT activation by insulin. J Biol Chem. 2014;289(9):6054–66.
Arora A, Dey CS. SIRT2 negatively regulates insulin resistance in C2C12 skeletal muscle cells. Biochim Biophys Acta. 2014;1842(9):1372–8.
Hu J, Zacharek S, He YJ, Lee H, Shumway S, Duronio RJ, Xiong Y. WD40 protein FBW5 promotes ubiquitination of tumor suppressor TSC2 by DDB1-CUL4-ROC1 ligase. Genes Dev. 2008;22(7):866–71.
Flannick J, Fuchsberger C, Mahajan A, Teslovich TM, Agarwala V, Gaulton KJ, Caulkins L, Koesterer R, Ma C, Moutsianas L, et al. Sequence data and association statistics from 12,940 type 2 diabetes cases and controls. Sci Data. 2017;4:170179.
Bach M, Larance M, James DE, Ramm G. The serine/threonine kinase ULK1 is a target of multiple phosphorylation events. Biochem J. 2011;440(2):283–91.
Egan DF, Shackelford DB, Mihaylova MM, Gelino S, Kohnz RA, Mair W, Vasquez DS, Joshi A, Gwinn DM, Taylor R, et al. Phosphorylation of ULK1 (hATG1) by AMP-activated protein kinase connects energy sensing to mitophagy. Science. 2011;331(6016):456–61.
He C, Bassik MC, Moresi V, Sun K, Wei Y, Zou Z, An Z, Loh J, Fisher J, Sun Q, et al. Exercise-induced BCL2-regulated autophagy is required for muscle glucose homeostasis. Nature. 2012;481(7382):511–5.
Welsh GI, Leney SE, Lloyd-Lewis B, Wherlock M, Lindsay AJ, McCaffrey MW, Tavare JM. Rip11 is a Rab11- and AS160-RabGAP-binding protein required for insulin-stimulated glucose uptake in adipocytes. J Cell Sci. 2007;120(Pt 23):4197–208.
Longatti A, Lamb CA, Razi M, Yoshimura S, Barr FA, Tooze SA. TBC1D14 regulates autophagosome formation via Rab11- and ULK1-positive recycling endosomes. J Cell Biol. 2012;197(5):659–75.
Tripathy D, Almgren P, Tuomi T, Groop L. Contribution of insulin-stimulated glucose uptake and basal hepatic insulin sensitivity to surrogate measures of insulin sensitivity. Diabetes Care. 2004;27(9):2204–10.
Radikova Z. Assessment of insulin sensitivity/resistance in epidemiological studies. Endocr Regul. 2003;37(3):189–94.
Acknowledgments
We are grateful to Dr. Peter Osmark for valuable comments.
Funding
This work was supported by grants from the Swedish Knowledge Foundation through the Industrial Ph.D. program in Medical Bioinformatics at the Center for Medical Innovations (CMI) at the Karolinska Institute (HMP), The Diabetes Programme at Lund University (HMP), Diabetesföreningen in Malmö (HMP), The Medical Faculty at Lund University (HMP), Linnaeus grant from the Swedish Research Council (LCG), ERC grant (EXGENESIS) (LCG), the Knut and Alice Wallenberg Foundation (LCG) for equipment, Swedish Research Council (OH), Crafoord foundation (OH), ALF (OH), Novo Nordisk foundation (OH), Magnus Bergvall foundation (OH), Påhlsson foundation (OH), Diabetes Wellness (OH) and the Swedish Diabetes foundation (OH). LUDC-IRC: Swedish Foundation for Strategic Research, Dnr IRC15–0067, EXODIAB: Swedish Research Council, Strategic Research Area, Dnr 2009–1039. Open Access funding provided by Lund University.
Author information
Authors and Affiliations
Contributions
HMP conceived the project, designed the study, analyzed the microarray data, performed the statistical analysis, and drafted the manuscript. TE, OE, and KFE conducted clinical study, processed the samples, analyzed and prepared the data for Study A. AA, NH, and AV conducted clinical study, processed the samples, analyzed and prepared the data for Study B. KS, and OH designed the QPCR experiments and interpreted the data. LCG, KS, and OH designed the project and supervised all phases of the project, including the writing of the manuscript. All authors read and approved the final version of the manuscript.
Corresponding author
Ethics declarations
Ethics approval and consent to participate
Study A was approved by the local ethics committee at Lund University, and written, informed consent was obtained from all participants. Study B was approved by the Copenhagen and Frederiksberg Regional Ethics Committee (ref. no. 01–262546) and informed written consent was obtained from all of the subjects before participation. Both studies were conducted according to the principles of the Helsinki Declaration. Muscle SATellite cell (MSAT) study was approved by the local ethics committee at Lund University, and written, informed consent was obtained from all participants (ethical approval: Dnr 2015/593).
Consent for publication
Not applicable.
Competing interests
The authors declare that there are no conflicts of interest regarding the publication of this article.
Additional information
Publisher’s Note
Springer Nature remains neutral with regard to jurisdictional claims in published maps and institutional affiliations.
Supplementary Information
Additional file 1: Supplementary Table S1.
Clinical and biochemical characteristics of male subjects from study A. Supplementary Table S2. Clinical and biochemical characteristics of male subjects from study B. Supplementary Table S3. Genes of which expression levels in skeletal muscle were positively correlated with insulin sensitivity (1/HOMA-IR) in study A. Supplementary Table S4. Genes of which expression levels in skeletal muscle were inversely correlated with insulin sensitivity (1/HOMA-IR) in study A. Supplementary Table S5. Significantly enriched Gene Ontology (GO) categories in the 70 genes whose expression level in skeletal muscle positively correlated with insulin sensitivity in Study A, analyzed with the WEB-based GEne SeT AnaLysis Toolkit (WebGestalt). Supplementary Table S6. Significantly enriched Wikipathways, in the 70 genes whose expression level in skeletal muscle positively correlated with insulin sensitivity in Study A, analyzed with the WEB-based GEne SeT AnaLysis Toolkit (WebGestalt). Supplementary Table S7. Significantly enriched Gene Ontology (GO) categories in the 110 genes whose expression level in skeletal muscle was inversely correlated with insulin sensitivity in Study A, analyzed with the WEB-based GEne SeT AnaLysis Toolkit (WebGestalt).
Rights and permissions
Open Access This article is licensed under a Creative Commons Attribution 4.0 International License, which permits use, sharing, adaptation, distribution and reproduction in any medium or format, as long as you give appropriate credit to the original author(s) and the source, provide a link to the Creative Commons licence, and indicate if changes were made. The images or other third party material in this article are included in the article's Creative Commons licence, unless indicated otherwise in a credit line to the material. If material is not included in the article's Creative Commons licence and your intended use is not permitted by statutory regulation or exceeds the permitted use, you will need to obtain permission directly from the copyright holder. To view a copy of this licence, visit http://creativecommons.org/licenses/by/4.0/. The Creative Commons Public Domain Dedication waiver (http://creativecommons.org/publicdomain/zero/1.0/) applies to the data made available in this article, unless otherwise stated in a credit line to the data.
About this article

Cite this article
Parikh, H.M., Elgzyri, T., Alibegovic, A. et al. Relationship between insulin sensitivity and gene expression in human skeletal muscle. BMC Endocr Disord 21, 32 (2021). https://doi.org/10.1186/s12902-021-00687-9
Received:
Accepted:
Published:
DOI: https://doi.org/10.1186/s12902-021-00687-9