Abstract
Background
‘Candidatus Phytoplasma mali’, the causal agent of apple proliferation disease, exerts influence on its host plant through various effector proteins, including SAP11CaPm which interacts with different TEOSINTE BRANCHED1/ CYCLOIDEA/ PROLIFERATING CELL FACTOR 1 and 2 (TCP) transcription factors. This study examines the transcriptional response of the plant upon early expression of SAP11CaPm. For that purpose, leaves of Nicotiana occidentalis H.-M. Wheeler were Agrobacterium-infiltrated to induce transient expression of SAP11CaPm and changes in the transcriptome were recorded until 5 days post infiltration.
Results
The RNA-seq analysis revealed that presence of SAP11CaPm in leaves leads to downregulation of genes involved in defense response and related to photosynthetic processes, while expression of genes involved in energy production was enhanced.
Conclusions
The results indicate that early SAP11CaPm expression might be important for the colonization of the host plant since phytoplasmas lack many metabolic genes and are thus dependent on metabolites from their host plant.
Background
‘Candidatus Phytoplasma mali’ (‘Ca. P. mali’) is a plant pathogen, associated to Apple proliferation disease in apple (Malus x domestica Borkh.). This cell wall-less bacterium belongs to the class of Mollicutes and has one of the smallest genomes among all so far fully sequenced phytoplasma species [1]. Phytoplasmas reside in the plant phloem and are transmitted by phloem sucking psyllids. ‘Ca. P. mali’ manipulates its host plant by secreting effector proteins via a sec-dependent secretion system [2]. Several effector proteins are known from different phytoplasma [3]. So far, in ‘Ca. P. mali’ four effector proteins, namely SAP11CaPm [4], PME2 [5], PM19_00185 [6] and SAP05CaPm [7], as well as the virulence factor AAA + ATPase AP460 [8] have been identified as host manipulating factors. While little or nothing is known about PME2’s, SAP05CaPm´s and PM19_00185´s function in apple trees, the potential function of the ‘Ca. P. mali’ SAP11, homolog of SAP11AYWB (from ‘Candidatus Phytoplasma asteris’), has been also described in apple [4, 9,10,11]. SAP11AYWB binds and destabilizes three different TCP (TEOSINTE BRANCHED1/ CYCLOIDEA/ PROLIFERATING CELL FACTOR 1 and 2) transcription factors and is involved in the development of different symptoms [12, 13]. In contrast to SAP11AYWB, SAP11CaPm localizes not only to the cell nucleus, but also to the cytoplasm [14]. However, it has been shown that it binds (similar as SAP11AYWB) two class II CIN-like TCPs, namely MdTCP4a (orthologue to AtTCP4) and MdTCP13a (orthologue to AtTCP13) [4], formerly known as MdTCP25 and MdTCP24 respectively [15] as well as to the class II CYC/TB1 TCP MdTCP18a (orthologue to AtTCP18) (formerly known as MdTCP16 as described in [16]). SAP11CaPm-binding to its TCP-interaction partners causes severe growth aberrations, early bud break and hormonal disbalance within the plant [14]. Effector binding of MdTCP4a and MdTCP13a is supposed to be at the basis of the changes in jasmonate (JA) and abscisic acid (ABA) levels observed in infected plants and might be the reason for the development of late flowers, leaf reddening and altered root architecture [4]. The binding of MdTCP18a is supposed to counteract the MdTCP18a upregulation in infected plants, leading to an early bud break and uncontrolled shoot outgrowth [16].
The stable overexpression of SAP11AYWB in Arabidopsis plants resulted in a total of 59 upregulated and 104 downregulated genes as revealed by RNA-seq [17]. From the 59 upregulated genes, 18 genes were functionally annotated as inorganic phosphorus (Pi) starvation-induced genes. In the group of downregulated genes, LIPOXYGENASE2 (LOX2), a gene encoding an enzyme involved in JA biosynthesis, and PATHOGENESIS-RELATED GENE1 (PR1) and ELICITOR-ACTIVATED GENE3-1 (ELI3-1), two salicylic acid (SA) responsive genes, were found. This indicates that SAP11AYWB suppresses the defense response while enhancing bacterial growth in Arabidopsis plants. In addition, it has been shown that defense response to insect vectors is also reduced in SAP11AYWB overexpressing Arabidopsis plants [18]. Nicotiana occidentalis H.-M. Wheeler plants directly infected with ‘Ca. P. mali’ showed 157 proteins with an increased and 173 with a decreased expression compared to healthy plants. This highlights the fact that a single effector, such as SAP11, is only partially involved in the pathogen induced transcriptional changes [19]. The proteins encoded by genes with an increased expression comprised mainly the alpha-linolenic acid synthesis, while those with downregulation were involved in porphyrin and chlorophyll metabolism [19]. This was in line with increased JA levels and leaf yellowing of infected plants.
Even though such studies help to understand possible functions of SAP11CaPm, only little is known so far about the very early role of SAP11CaPm during early infection of plants with ‘Ca. P. mali’. Thus, the aim of this study was to gain a better understanding of the transcriptional changes that occur in the plant host during early occurrence of the effector protein. Infiltration RNA-seq [20] was used to unravel expression networks and effector function in healthy plants upon expression of SAP11CaPm. Moreover, N. occidentalis H.-M. Wheeler was chosen since it has been described as the appropriate model plant to study ‘Ca. P. mali’ effector functions [10, 19, 21,22,23]. Therefore, the gene encoding the effector protein SAP11CaPm was transiently expressed by agroinfiltration in N. occidentalis H.-M. Wheeler leaves and differential gene expression was analyzed until 5 days post infiltration in the respective leaf tissue. Transcriptional changes in the infiltrated leaves revealed that SAP11CaPm affects mainly genes involved in defense responses, photosynthesis, and pathways involved in the production of energy equivalents at early time points of its occurrence in the cells.
Methods
Plant material and agroinfiltration
Nicotiana occidentalis H.-M. Wheeler seeds were kindly provided by Kajohn Boonrod from RLP AgroScience GmbH, Neustadt, Germany [10, 21]. Seedlings were grown in a plant growth chamber (Percival AR22L, Percival Scientific, Perry, IA, USA) under long photoperiod conditions (16 h/8 h, 24 °C/22°C, 70% rH). Four to five-week-old plants were used for agroinfiltration.
For agroinfiltration the coding sequence of the mature SAP11CaPm effector protein from ‘Ca. P. mali’ strain STAA (Accession: KM501063) was subcloned into the GreenGate-entry module pGGC00 [24] using the primer pair ATP00189pP_Cfw (AACAGGTCTCAGGCTCCATGTCTCCTCCTAAAAAAGATTCTA) / ATP00189pP_Drv (AACAGGTCTCACTGATTTTTTTCCTTTGTCTTTATTGTTA).
Transformation constructs coding for SAP11CaPm:GFP under the control of CaMV 35 S promoter and flanked by the RBCS terminator and a plant kanamycin resistance marker were assembled using modules from the GreenGate-kit [24]. In detail, a GreenGate reaction containing 150 ng pGGA004 (p35S), 150 ng pGGB003 (B-dummy), 150 ng pGGC000- SAP11CaPm, 150 ng pGGD001 (linker-GFP), 150 ng pGGE001 (tRBCS), 150 ng pGGF007 (pNOS::KanR: tNOS), and 100 ng pGGZ001 (empty destination vector) was combined in a total volume of 15 µL. For the GreenGate reaction 1.5 µL 10× CutSmart Buffer (New England Biolab, Ipswich, MA, USA), 1.5 µL ATP (10 mM), 1.0 µL T4 DNA Ligase (5 u/µL) (Thermo Fisher Scientific, Waltham, MA, USA), and 1.0 µL BsaI-HF®v2 (20,000 u/mL) (New England Biolab, Ipswich, MA, USA) were added to the module-mixture, and 30 cycles at 37 °C and at 16 °C for 2 in each, followed by 50 °C for 5 min and 80 °C for 5 min were performed. Subsequently, 5 µL of the reaction mixture were used for heat-shock transformation of ccdB-sensitive One Shot® TOP10 chemically competent E. coli (Invitrogen, Carlsbad, CA, USA). A second vector containing only the GFP gene fused to a nuclear localization signal was assembled, using the pGGC012 module (GFP-NLS). The correctness of the assembled plant expression vectors was confirmed by sequencing.
The validated GreenGate expression vectors, 35 S::SAP11CaPm:GFP and 35 S::GFP-NLS were transferred together with pSOUP helper plasmid into electrocompetent A. tumefaciens strain EHA105. The A. tumefaciens clones were cultured for 2 days at 28 °C in selective LB medium. For infiltration 0.5 OD/mL were resuspended in infiltration medium (10 mM MgCl2, 10 mM MES, 200 µM acetosyringone, pH 5.7), regenerated for 4 h at 28 °C and infiltrated with a blunt syringe into three leaves from four- to five-week-old N. occidentalis H.-M. Wheeler plants. Six plants were infiltrated with the effector expressing 35 S::SAP11CaPm:GFP construct and six plants were infiltrated with 35 S::GFP-NLS serving as controls. Additional six plants were not infiltrated and used as non-infiltrated controls. The infiltrated area was marked with a pen on the adaxial leaf side and six leaf discs with a size of 1 cm² (two/infiltrated area) were excised immediately after infiltration from one plant of each variant. Leaf disc excision was repeated on different plants in a 24-h-rhythm. Leaf discs were immediately flash frozen in liquid nitrogen. Infiltration and leaf disc sampling were repeated with three independent plant sets, grown at three different time points.
cDNA library construction and sequencing
A total of 36 leaf discs samples of plants from all three treatments for the timepoints 0 h, 24 h, 72 h and 120 h were sent on dry ice for RNA extraction, library preparation and sequencing to StarSEQ (Mainz, Germany). Additionally, 15 samples were prepared from different growth stages of untreated N. occidentalis H.-M. Wheeler plants and send on dry ice to StarSEQ. RNA of those samples together with RNA of the 36 leaf disc samples was pooled and used for the de novo transcriptome assembly.
The stranded RNA sequencing library was prepared using the NEBNext Ultra II Directional RNA Library Prep Kit for Illumina (New England Biolab, Ipswich, MA, USA). The library for the de novo transcriptome assembly was sequenced on a Illumnia NextSeq500 platform in 2 × 150 nt paired-end mode. The libraries of the 36 leaf samples were sequenced on the same platform in 1 × 75 nt single-end mode.
Quality assessment of the reads was performed using the FASTQC tool [25].
Adapter trimming of paired end reads was done with the FASTQ Toolkit (BaseSpace Labs) retaining reads with a minimum read length of 32 nt.
De novo transcriptome assembly of Nicotiana occidentalis
The workflow for the de novo assembly of the transcriptome and the RNA-seq analysis was carried out as follows: First, all adapter trimmed paired end reads were quality trimmed with a sliding window of 4 nt, a minimum phred quality score of 20 and a minimal read length of 75 nt using the tool Trimmomatic v.0.36 [26]. The de novo assembly was then performed in strand-specific mode using Trinity v. 2.9 [27]. The whole de novo assembled transcriptome was first annotated using Trinotate v.3.2.0 [28] with the help of Transdecoder v.5.5.0 [29] to estimate all possible coding regions. Since the annotation contained several transcripts not belonging to Nicotiana, the whole transcriptome was decontaminated using the MCSC Decontamination method [30] filtering for transcripts belonging to the order of Solanales. The remaining decontaminated transcriptome was reannotated with Trinotate v.3.2.1 using homology search to SwissProt sequence database with Blast 2.12.0+ [31], to PFAM database for protein domain identification with HMMER (hmmer v.3.3.2) [32] and for the prediction of a signal peptide with SignalP v.5.0.b [33] and of a transmembrane domain with tmhmm v.2.0c [34]. The annotated transcripts were visualized using the build in TrinotateWeb tool.
Differential expression analysis, go enrichment analysis
Transcripts were quantified using Trinity v.2.11.0 build in Salmon (v.1.4.0) [35] pipeline. Selection of differentially expressed transcripts (DETs) was afterwards performed with the Trinity v.2.11.0 build in DESeq2 pipeline [36], where parameters for filtering are set to > 4-fold change and a false discovery rate (FDR) < 0.001.
Lists of DETs were annotated by homology search with Blast 2.12.0+ [31] against standard nucleotide collection database (nt) with an e-value cut off set to 0.001.
The lists of DETs were further analyzed and subset by Venn diagrams using jvenn [37].
Gene ontology (GO) assignments were first extracted from Trinotate output and then all lists of up and downregulated DETs and the Venn subsets were functional enriched with the Trinity v2.11.0 build in GOseq [38] pipeline, using the de-novo assembled and decontaminated N. occidentalis H.-M. Wheeler transcriptome as background.
The functional enrichment was visualized using RStudio 2022.07.1 (RStudio, PBC) with R v4.2.0 [39] and the Bioconductor packages goseq v.1.48.0 [40] and rrvgo v.1.8.0 [41].
For a detailed analysis of enriched transcripts, the GO assignments were filtered with a script for defence or stress related terms and phytohormone related terms. In detail, files with GO assignments were searched using strings for defence/stress (“stress”, “defence”, “immune”) and for phytohormone related terms (“salicylic”, “auxin”, “gibberel*”, “jasmonic”, “ethylene”, “cytokinine”, “abscisic”, “brassinosteroi*”; asterisks in the term indicate placeholder for any letter).
For further functional characterization of up- and downregulated transcripts the different subsets were analyzed with STRING database v.12.0 [42] using the whole N. tabacum L. genome as background for network analysis. In detail the protein sequences of DETs were uploaded to the multiple sequences search interface, annotated with STRING by homology search within the N. tabacum L. genome and network was visualized with protein interactions based on functional and physical protein associations. The network was then clustered with MCL (Markov Cluster Algorithm) [43] clustering using an inflation parameter of 4. Enriched gene ontologies and KEGG pathways of the biggest cluster were downloaded.
RNA extraction, cDNA synthesis and qPCR
For validation of DETs, the agroinfiltration approach was repeated with a new set of plants, using three biological replicates. The excised leaf discs were immediately flash frozen in liquid nitrogen, grinded using a mortar and pistil, and 100 mg of frozen leaf powder was used for RNA extraction with Spectrum™ Plant Total RNA Kit (Merck, Darmstadt, Germany) following protocol A of the manual. RNA concentration was measured with a spectrophotometer (Implen N60). Using 2 µg of RNA, genomic DNA removal and cDNA synthesis was performed with SuperScript™ IV VILO™ Master Mix with ezDNase™ enzyme.
To find suitable and stable expressed reference genes, primer pairs for NbPP2a, NbNQO, NbGAPDH and NbEF1a, identified as reference genes in N. benthamiana Domin [44] as well as the endogenous universal qPCR control UNI28S [45] were selected. They in-silico matched (tested with Geneious R11.1.5) to transcripts within the de-novo assembled N. occidentalis H.-M. Wheeler transcriptome and were thus tested in a qPCR assay. The qPCR data of all candidates were analyzed by RefFinder [46] and the two most stable genes, PP2a and NQO were used as reference genes.
Diluted cDNA was used for qPCR assays with three technical replicates, using SYBR chemistry. In detail, 2 µL of template were used in a 10 µL reaction mixture containing 5 µL 2x SYBR FAST qPCR Kit Master Mix (Kapa Biosystems), 2.6 µL nuclease-free water and 0.20 µL each of forward and reverse primer (10 µM). All qPCR reactions were run on a CFX384 Touch Real-Time PCR Detection system, using the following conditions: initial denaturation at 95 °C for 20 s; 35 cycles of 95 °C for 3 s and 60 °C for 30 s; and a melting curve ramp from 65 to 95 °C at increments of 0.5 °C every 5 s. Melting curve analysis was performed to confirm the generation of the correct amplicon. Specific melting curves for every target amplified by SYBR green qPCR are provided in Additional file 1.
To determine qPCR efficiency of the respective target together with each qPCR run a five-point serial dilution of N. occidentalis H.-M. Wheeler cDNA (1:10, 1:20, 1:50, 1:100, 1:200) was analyzed. As an additional quality control of qPCR, a three-point serial dilution (1:10, 1:50, 1:100) was analyzed, amplifying the reference genes NbNQO and NbPP2a. Data analysis was performed using CFX Manager Software (Bio-Rad) and RStudio 2022.07.1 (RStudio, PBC) with R v4.2.0 [39] using the MCMC qPCR package (v.1.2.4) [47] applying an informed model.
Results
Expression of SAP11CaPm in Nicotiana occidentalis
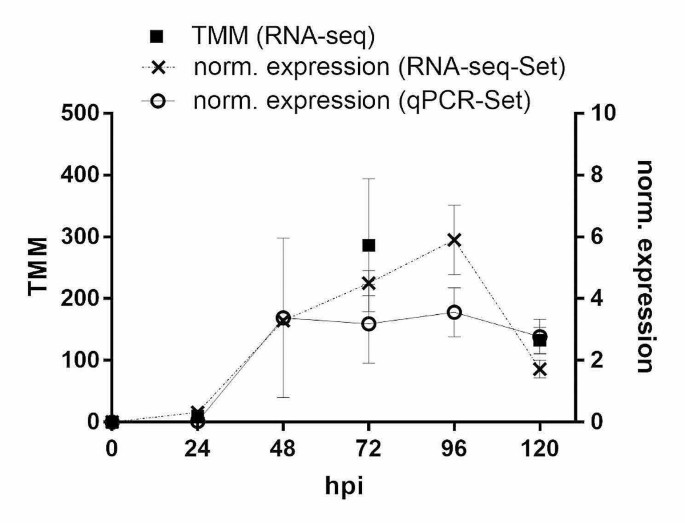
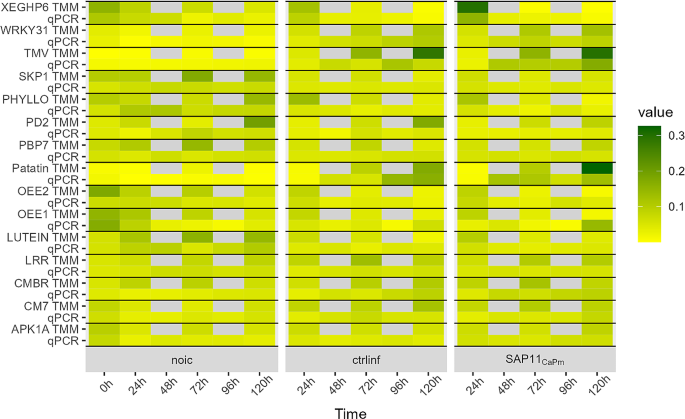
To analyze early effects of SAP11CaPm expression on the transcriptome of N. occidentalis H.-M. Wheeler, leaves were infiltrated with A. tumefaciens harboring a construct encoding SAP11CaPm fused to GFP. As controls, infiltration with nuclear localized GFP (GFP-NLS) and non-infiltrated plants were used. Samples were taken every 24 h up to 120 h and subjected to RNA-seq. To verify the expression of SAP11CaPm, leaf samples later used for RNA-seq as well as leaf samples from a second independent experiment, were analyzed by RT-qPCR (Fig. 1). Within 24 h after infiltration, the first transcript accumulation was detectable. In the leaf samples set used for RNA-seq, the expression reached its maximum 96 h after infiltration and decreased 120 h post infiltration. Coherently, the analysis on the number of reads obtained by RNA-seq and indicative for expression of SAP11CaPm showed this kinetics. In the second independent leaf set SAP11CaPm expression was stable between 48 h and 96 h after infiltration and dropped only slightly after 120 h.
Expression of SAP11CaPm in leaf samples analyzed by RNA-seq and qPCR. Beside the RNA-seq sample set a second independent sample set was analyzed only by qPCR. The RNA-seq set was analyzed at 0 h, 24 h, 72 h and 120 h, while the qPCR set was analyzed at every timepoint. Data represent the mean +/- SEM of 3 biological replicates. TMM = trimmed mean of M values [48]
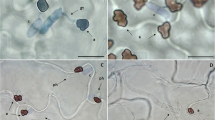
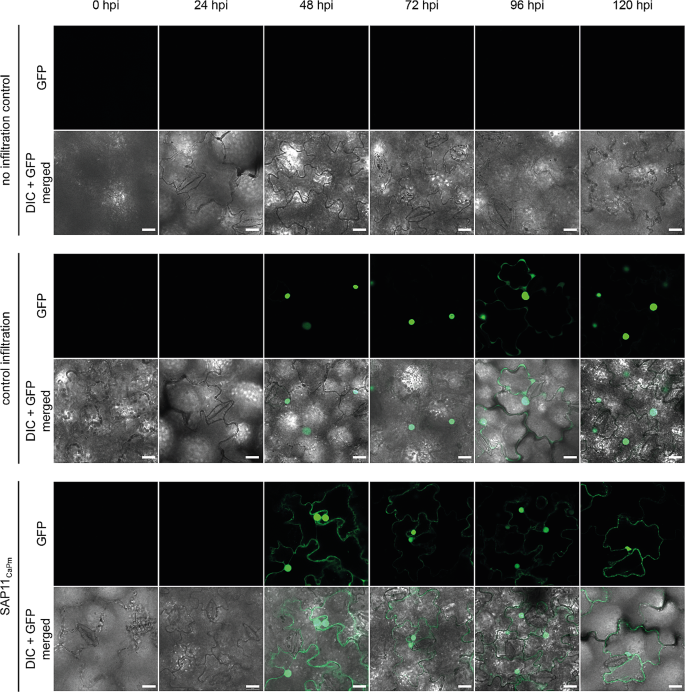
To verify the presence of SAP11CaPm fused to GFP in N. occidentalis H.-M. Wheeler cells, leaves were examined using confocal laser scanning microscopy. The occurrence of SAP11CaPm:GFP as well as of GFP-NLS from the control-infiltrations became visible at 48 h after infiltration, thereby lagging behind the rise of transcripts (Fig. 2). SAP11CaPm:GFP was observed to localize to the cell nucleus and the cytoplasm of infiltrated N. occidentalis H.-M. Wheeler cells, while the GFP-NLS in control-infiltration localized only to the cell nucleus.
Detection of GFP-NLS (green fluorescent protein fused to a nuclear localization sequence, control infiltration) and SAP11CaPm:GFP (SAP11CaPm) in infiltrated N. occidentalis leaves. No infiltration control shows images of leaves that were not infiltrated. GFP fluorescence was visualized by confocal laser scanning microscopy. Bars represent 20 μm. GFP = only GFP channel, DIC + GFP = Differential interference contrast microscopy merged to the GFP channel
De novo transcriptome assembly
A total of 54,704,261 (GC content: 43%) adapter and quality trimmed paired end reads from a pool of 51 RNA samples from N. occidentalis H.-M. Wheeler plants infiltrated or not were used for the de novo transcriptome assembly with Trinity v2.9. The clean reads were assembled, resulting in 166,787 transcripts, with an average length of 1,034 bp and an N50 of 1,504 bp.
The transcriptome was further decontaminated from sequences originating from species other than the order Solanales using the Model-based Categorical Sequence Clustering MCSC decontamination pipeline, that is based on the Model-based Categorical Sequence Clustering (MCSC) algorithm [30]. The decontaminated transcriptome contained 153,640 transcripts with an average length of 1,076 bp, N50 of 1,559 bp and a GC content of 39.57%.
This Transcriptome Shotgun Assembly project has been deposited at DDBJ/ENA/GenBank under the accession GKBG00000000. The version described in this paper is the first version, GKBG01000000.
The sequencing dataset used in this study is available in the NCBI repository with BioProject ID PRJNA871046.
Differential expression analysis
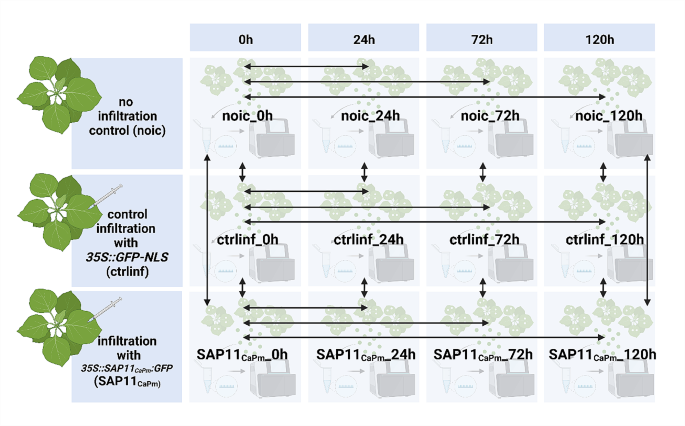
The RNA-seq libraries obtained from leaf samples infiltrated with A. tumefaciens to express either SAP11CaPm:GFP or GFP-NLS or non-infiltrated were subjected to transcriptome analysis. To get insights into SAP11CaPm-mediated changes, differential expression analysis was done using DEseq2 [36] within the Trinity Package (v2.11.0) [27], making pairwise comparisons of non-infiltrated (ni), control-infiltrated (ctrl) and SAP11CaPm infiltrated (SAP11CaPm) samples at different time points (Fig. 3).
Identification of DETs in leaf samples of three different treatment groups. The first control group was not infiltrated (ni), the second control group was infiltrated with GFP-NLS under control of 35S promoter (ctrl) and the third group was infiltrated with 35S::SAP11CaPm:GFP (SAP11CaPm). Arrows show the comparisons that were made with DEseq2 [36]
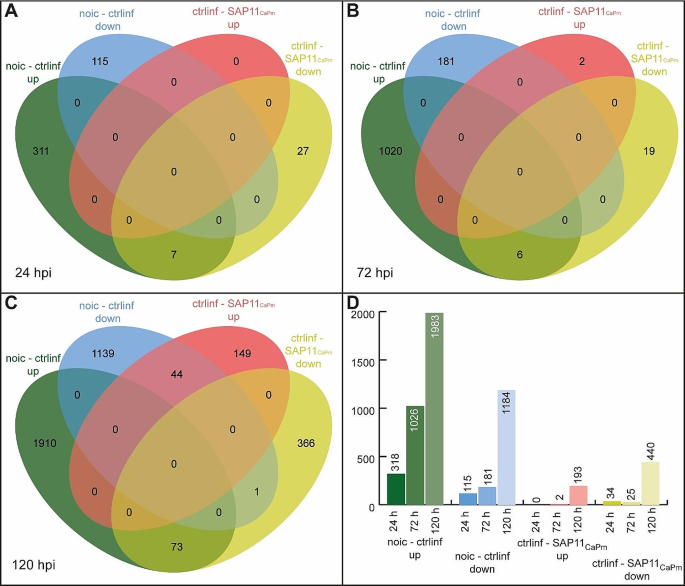
Differentially expressed transcripts (DETs) were identified, which occurred over time within a treatment group or between treatment groups at the same time point (Fig. 4).
Numbers of DETs at log2fold change (L2FC) of ≥ ± 2; 4-fold differential expression, p-value cutoff for FDR < 0.001. The VENN diagram shows DETs detected at (A) 24, (B) 72 and (C) 120 h after infiltration. Up- and downregulated transcripts in control-infiltrated samples and SAP11CaPm infiltrated samples were analyzed using jvenn [37]. (D) The barplot summarizes for each time point the total number of up- (green) and downregulated (blue) transcripts upon control- infiltration in comparison to non -infiltration and up- (red) or downregulated (yellow) transcripts due to infiltration with SAP11CaPm in comparison to control-infiltration
The first DETs in infiltrated leaves were detectable at 24 h after infiltration (Fig. 4A, D). In comparison to non-infiltrated leaves, control-infiltrated N. occidentalis H.-M. Wheeler leaves showed 318 upregulated and 115 downregulated transcripts. Only a few DETs were detectable between control-infiltrated and the SAP11CaPm-infiltrated samples: 34 transcripts were downregulated in SAP11CaPm expressing samples compared to the control-infiltration. Seven of these 34 transcripts were upregulated in control-infiltrated samples compared to the non-infiltrated samples.
At 72 h after infiltration (Fig. 4B, D). a more substantial number of DETs were evident. Control-infiltrated leaves exhibited 1026 upregulated and 181 downregulated transcripts compared to non-infiltrated leaves. In contrast, SAP11CaPm-expressing leaves showed only two upregulated and 25 downregulated transcripts compared to control-infiltrated leaves. Six out of these 25 downregulated transcripts were upregulated in control-infiltrated leaves.
The highest number of DETs was observed at 120 h after infiltration (Fig. 4C, D).
Control-infiltrated samples had 1983 upregulated and 1184 downregulated transcripts compared to non-infiltrated leaves. The comparison between SAP11CaPm infiltration and control-infiltration revealed that 193 transcripts were upregulated, and 440 transcripts were downregulated due to SAP11CaPm infiltration. Among these 44 of the upregulated transcripts were downregulated between non-infiltrated samples and control-infiltration and 73 downregulated transcripts were upregulated in the control-infiltrated leaves (Fig. 4C).
Table 1 shows transcripts that resulted differentially expressed at two different timepoints upon SAP11CaPm expression (compared to ctrl). Interestingly, a transcript encoding a protein modifier of snc1,1 (MOS1) was downregulated 24 h after infiltration (L2FC -11.54) but upregulated 120 h after infiltration (L2FC 12.40). Three transcripts were downregulated at 24 h and 120 h, but only for one of them, i.e. the preprotein translocase subunit SCY1, information regarding its function is available. The acyl-CoA thioesterase 2 was downregulated at 24 h and 72 h after infiltration with SAP11CaPm (L2FC − 11.38).
Six genes were downregulated at 72 h and 120 h after infiltration with SAP11CaPm (Table 1) in contrast to control-infiltration. Among those genes, genes encoding the serine/threonine-protein phosphatase BSL1, the protein CHROMATIN REMODELING 8 (CHR8) and a NTRC-like thioredoxin reductase were detected. Despite the downregulation in SAP11CaPm infiltrated samples after 72 h and 120 h, the NTRC-like thioredoxin reductase and the pre-mRNA-splicing factor prp12 and THO complex subunit 4D-like were upregulated upon infiltration (in the absence of SAP11CaPm): the NTRC-like thioredoxin reductase was upregulated after 72 h and 120 h, the pre-mRNA-splicing factor prp12 after 72 h and THO complex subunit 4D-like after 24 h and 72 h.
The putative DUF21 domain-containing protein At3g13070, as well as BSL1 and the pre-mRNA-splicing factor prp12 were not only downregulated in SAP11CaPm infiltrated samples in comparison to control-infiltration but also in comparison to the not-infiltrated samples.
qPCR validation of selected DETs
A total of 15 transcripts, that were differentially expressed between control-infiltration and SAP11CaPm infiltration, were selected as candidates for qPCR validation (Table 2).
RT-qPCR analyses from the 15 selected genes revealed high variance between biological replicates and no significant differences could be detected in the selected comparisons. The expression pattern, however, followed the same trend as those in RNA-seq data (Fig. 5). Taken together, these validation results of selected genes, the SAP11CaPm expression verified by qPCR (Fig. 1) and the RNA-seq data obtained, provide novel insight into the early effects of SAP11CaPm on the transcriptome of N. occidentalis H.-M. Wheeler.
Gene ontology (GO) enrichment and analysis
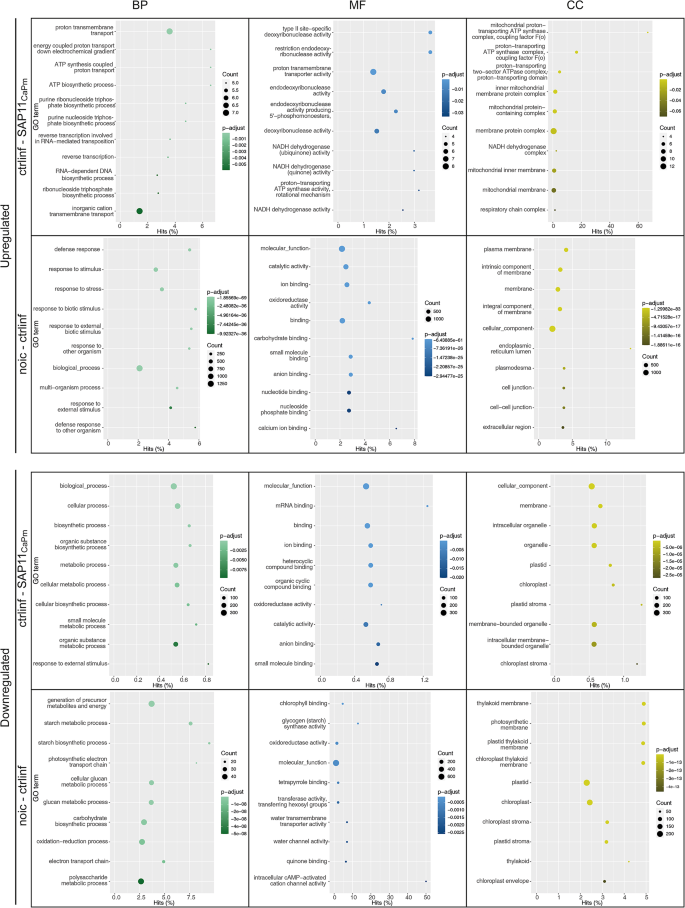
All groups of up- and downregulated DETs (Fig. 4) were analyzed using the Trinity v2.11.0 build in pipeline for GOseq [38]. The results were separated by the three sub-ontologies of GO: Molecular Function (MF), Cellular Component (CC) and Biological Process (BP) (Fig. 6). The datasets were further analyzed with the rrvgo package [41] which groups GO terms based on their semantic similarity and results were represented by a scatter plot (see Additional file 2).
After 24 h and 72 h no significant (FDR < 0.5) enriched GO terms were found in the group of SAP11CaPm downregulated transcripts in comparison to control-infiltration. The two upregulated transcripts in SAP11CaPm expressing samples at 72 h were assigned to the term “regulation of protein metabolic process” (BP). Enriched terms in the group of downregulated transcripts in SAP11CaPm expressing leaves compared to control-infiltration at 120 h comprised transcripts that were categorized into “cellular process”, “biosynthetic process” or “response to external stimulus” (Fig. 6). Enriched GO terms in MF were mainly related to binding processes, such as “mRNA binding”, “organic cyclic compound binding” or “magnesium chelatase activity”, whereas CC enriched terms were “plastid”, “chloroplast” or “membrane-bounded organelle” (Fig. 6). Employing the rrvgo analysis within the set of 366 transcripts (Fig. 4; ctrl-SAP11CaPm down) unaffected by infiltration but downregulated during SAP11CaPm expression unveiled a cluster associated with both “defence response” and “response to external stimulus”. The group of 149 upregulated transcripts (Fig. 3) in SAP11CaPm expressing samples after 120 h compared to the control-infiltration mainly contained transcripts that were assigned to BP GO terms like “proton transmembrane transport”, “reverse transcription involved in RNA − mediated transposition” and “ATP biosynthetic process”. The enriched MF GO terms were related to “endodeoxyribonuclease activity” and the enriched CC GO terms were mainly allocated to “mitochondrial protein − containing complex” and “proton − transporting ATP synthase complex, coupling factor F(o)”. The rrvgo analysis of all 193 upregulated transcripts at 120 h showed a cluster assigned to “ATP biosynthetic process” and “proton transmembrane transport” (Additional file 2).
In the group of upregulated transcripts found only in the control-infiltrated samples at 24 h, 72 h and 120 h after infiltration, GO terms for the category BP are enriched such as “defence response”, “response to biotic stimulus” or “response to stress. Downregulated transcripts after 24 h were enriched in BP GO terms related to “homeostasis”, while 72 h after infiltration the enriched BP terms were assigned to “photosynthesis, light harvesting”, “protein − chromophore linkage” or “electron transport chain”. At 120 h after infiltration the most enriched BP terms were “starch metabolic process”, “cation transport” and “photosynthetic electron transport chain” (Fig. 6). The rrvgo analysis revealed a cluster of transcripts related to “ATP biosynthetic process” that is, in contrast to infiltration with SAP11CaPm (ctrl - SAP11CaPm), upregulated upon control-infiltration (Additional file 2). For both timepoints, 72 h and 120 h most of the enriched CC terms are chloroplast related (“thylakoid membrane”, “photosystem”, “chloroplast”).
GO enrichment in samples taken 120 h after infiltration. The GO enrichment is separated by biological process (green), molecular function (blue) and cellular component (yellow). The y-axis represents the top 10 GO terms, while the x-axis displays the percentage of enriched GO terms within each category. The size of the filled circles corresponds to the number of transcripts associated with the GO term, and the color of the circles reflects the adjusted p-value
Functional analysis of groups
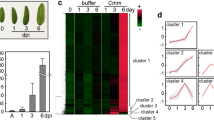
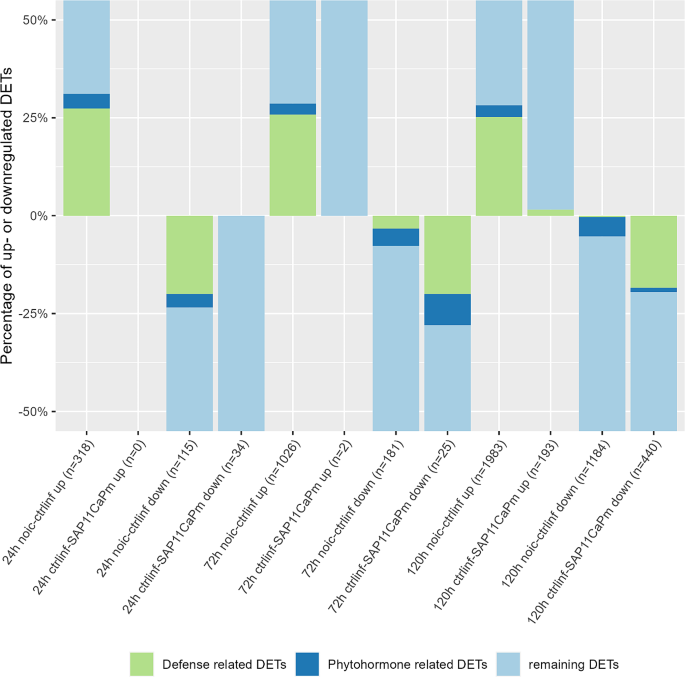
The GO annotations were selectively refined to include transcripts associated with defense or stress terms and phytohormone-related terms. As depicted in Fig. 7, the distribution of defense/stress and phytohormone-related terms in single DET groups is illustrated. Over 25% of the upregulated transcripts in the control-infiltrated samples were identified as defense or stress-related. Notably, in the downregulated DETs of control-infiltrated samples, the proportion of defense/stress-related transcripts decreases over time. In the group of upregulated DETs in SAP11CaPm-infiltrated leaves compared to control-infiltrated samples, almost no defense/stress or phytohormone-related transcripts were observed after 72 h (0%) or 120 h (0.5%). Conversely, in the downregulated transcripts of the same group, 28% of the transcripts (72 h) and 19.5% (120 h) are associated with defense/stress or phytohormone-related terms. The Additional file 3 lists all transcripts that were assigned to defense/stress or phytohormone-related terms.
Network analysis
A network analysis of the different groups of DETs was performed using STRING [42].
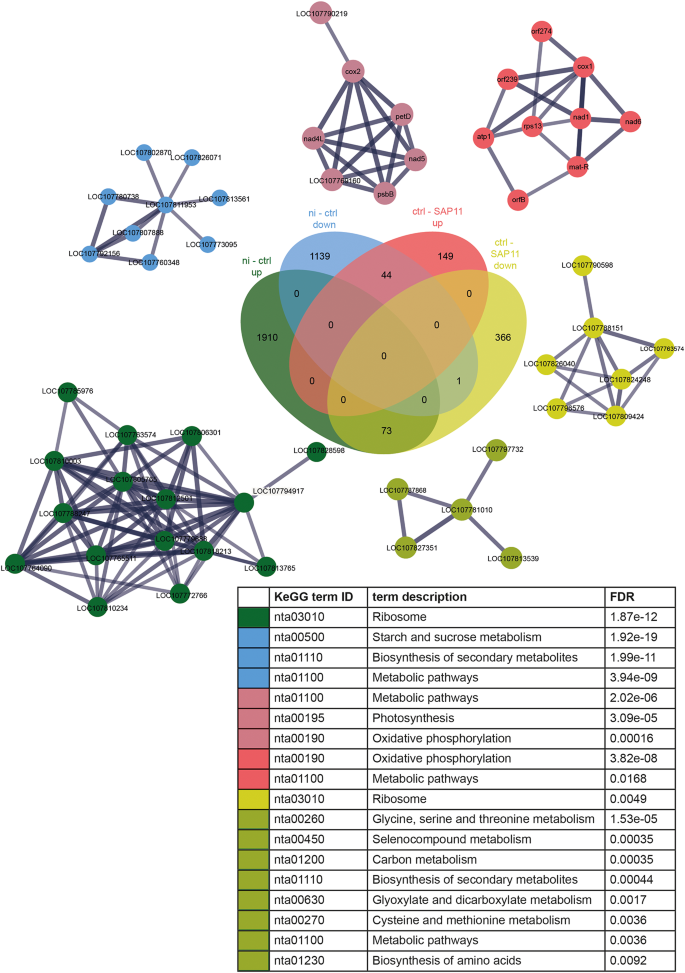
It showed that KEGG pathways related to ribosome was upregulated upon infiltration (Fig. 8, ni – ctrl up), while the starch and sucrose metabolism was downregulated due to the infiltration process itself (Fig. 8, ni – ctrl down).
The main network cluster in the group of downregulated transcripts upon SAP11CaPm infiltration (ctrl vs. SAP11CaPm) showed enriched KEGG pathways related to ribosome, while the main cluster of up regulated transcripts is enriched in oxidative phosphorylation and metabolic pathways. Detailed information about KEGG enriched transcripts and annotation of the main network cluster transcripts can be found in Additional file 4 and Additional file 5.
Discussion
Pathogen-derived effectors are important players in the process by which a pathogen modulates its host’s metabolism. To get insights into the role of SAP11CaPm, an effector produced by ‘Ca. P. mali’, the causal agent of apple proliferation disease, early changes in gene expression upon expression of SAP11CaPm were analyzed by infiltration RNA-seq [20]. For this, SAP11CaPm was transiently expressed by agroinfiltration in N. occidentalis H.-M. Wheeler leaves, since it has been shown that this model plant can be infected with ‘Ca. P. mali’ [10, 19, 21,22,23]. Most importantly, transiently expressed SAP11CaPm fused to GFP was detected in the nucleus of leaf cells, thereby occurring in the same subcellular compartment in which transcription factors occur to manipulate gene expression. This location is thus important evidence that N. occidentalis gene expression might be actively altered by SAP11CaPm. A reference genome of N. occidentalis H.-M. Wheeler is, however, not available, thus we opted for an approach where the N. occidentalis H.-M. Wheeler transcriptome was assembled de novo and used as a reference for the differential expression analysis.
A major problem with de novo assembling are biological contaminations of samples [30, 49]. These contaminations might derive from bacteria residing on the plant’s surface or be of human origin [50]. To filter and exclude these contaminations from our de novo assembled N. occidentalis H.-M. Wheeler transcriptome we used a pipeline based on the MCSC algorithm [30].
The transcript levels of SAP11CaPm increased continuously until 96 h after infiltration, while it decreased at 120 h after infiltration. This result was slightly different compared to a second independent experiment, in which the expression remained stable and unchanged after 48 h and until 120 h after infiltration. Those differences in SAP11CaPm expression strength might affect the putative changes in host’s gene expression profiles, although the protein was detectable to almost similar levels up to 120 h after infiltration. A group of differentially expressed transcripts in RNAseq was selected for the validation of their expression by RT-qPCR. Some of the qPCR results were very variable between biological replicates. Even though obtained from the same experimental setup, independent biological samples can inherently vary in their gene expression due to differences in cellular heterogeneity, or other factors. This inherent variability between biological replicates is a common source of variation in transcriptome analyses [51]. Nevertheless, the comparison of RNA-seq data with qPCR data of selected genes from the independent leaf samples, showed a common trend in both data sets. This corroborates findings derived from RNA-seq data by an independent method. In infected apple trees, the natural host plant, SAP11CaPm expression is not stable throughout the year [16] and the degree of colonization by phytoplasma, plant growth and climatic conditions might influence the spatio-temporal expression of the effector. Nonetheless, using another natural host of ‘Ca. P. mali’, allowing transient expression assays, helps to unravel the transcriptional changes in the plant due to the action of one single effector protein. The highest number of DETs was detected at 120 h after infiltration. Interestingly, six genes were commonly downregulated at 72 h and 120 h after infiltration; four of these transcripts were allocated to defense-related terms in the GO annotation. Among them, the genes encoding the protein phosphatase BSL1 and chromatin remodeling8 (CHR8) were identified. The protein phosphatase BSL1 belongs to the BSU1 family and contributes to the brassinosteroid signalling. BSL1 interacts with the Phytophtora infestans effector protein PiAVR2 and acts as a susceptibility factor by affecting the balance between growth and immunity in plants [52,53,54].
CHR8 belongs to the switch2/sucrose non-fermenting2 (SWI2/SNF2) chromatin remodeling gene family that is involved in DNA damage response (Shaked et al. 2006). It has been shown that CHR8 is upregulated during an artificial infection of A. thaliana with cabbage leaf curl virus [55] as well as during genotoxic stress [56], indicating its potential role in plant stress response.
The gene encoding the modifier of snc1,1 (MOS1) was downregulated at 24 h and upregulated at 120 h after SAP11CaPm infiltration. MOS1 regulates the nucleotide binding site-Leu-rich repeat (NB-LRR) type R protein SNC1 [57]. MOS1 interacts with AtTCP15, while AtTCP15 directly binds to SNC1 and thereby modulates the plant immune response [58]. Due to that binding, MOS1 enhances the activity of SNC1 and helps to reinforce the defense response. Based on the results of this study it can be assumed that the MOS1 triggered immune response is suppressed in the early stage of SAP11CaPm expression, while it recovers later.
Our results show that the occurrence of SAP11CaPm led to a downregulation of plant defense (Fig. 7). Nonetheless, it should be noted that the infiltration process itself induces several transcriptional changes within the infiltrated leaf area [59, 60]. Agroinfiltration induces host defense and alters phytohormone levels [59, 61, 62]. This is in line with the findings in Fig. 7. Transcripts related to plant defense and phytohormones are upregulated in control-infiltrated leaves. However, when comparing control-infiltration to SAP11CaPm infiltration, it is evident that defense and phytohormone related transcripts are downregulated. The regulation of phytohormones is key to several phytoplasma diseases and plays a role in the regulation of plant defence responses against phytoplasmas [63]. The observed downregulation observed in this study of phytohormone transcripts thus indicates that SAP11CaPm is able to suppress plant defense response.
At the same time, however, the ATP biosynthetic processes are upregulated. Phytoplasmas are highly dependent on metabolic compounds from their hosts since they lack different metabolic genes, among them genes for ATP synthase, glycolysis and for oxidative phosphorylation [64,65,66,67]. In the same line, the ATP biosynthetic process and the oxidative phosphorylation are upregulated upon SAP11CaPm expression in N. occidentalis H.-M. Wheeler. This might reflect the enhanced levels of glycerolipid and glycerophospholipid metabolites and the numerous differentially expressed carbohydrate metabolism genes shown for sweet cherry virescence (SCV) phytoplasma infected sweet cherry trees [68, 69].
It can be assumed that an increase of the expression of genes involved in energy production in the host plant helps the phytoplasma to obtain sufficient metabolites and nutrients necessary for proliferation and colonization.
In contrast to metabolic genes, transcripts assigned to the chloroplast were downregulated 120 h upon SAP11CaPm infiltration. Photosynthesis rates have been shown to be reduced in many different phytoplasma infections [70,71,72]. In line with that, several transcriptomic and proteomic studies of different phytoplasma infected plants have shown that numerous genes involved in photosynthesis are downregulated during infection [73]. The finding that SCY1 is strongly downregulated after 24 h and consistently at 120 h opens new insights on the possible SAP11 impact on chloroplast. SCY1 is involved in preprotein localization to the thylakoid [74] and mutant plants for SCY1 show impairment in thylakoid biogenesis [75] with a chloroplast-to-nucleus retrograde signal whit impaired production of nuclear-encoded chloroplast proteins [76] and chlorotic phenotypes [77]. During periods of darkness, SCY1 levels increase in the chloroplast which augments the import of nuclear-encoded proteins [78]. .
It is still unknown whether phytoplasma effector proteins directly target the chloroplast or if photosynthesis is compromised due to the changed plant metabolism [79]. A potential role of SAP11 in reducing the activity of photosystem II (PSII) by binding the AtTCP13 transcription factor has been suggested [79]. AtTCP13 is also known as PTF1, a transcription factor that regulates gene expression in chloroplasts via the plastid-encoded polymerase PEP [80]. PEP is the major chloroplast transcriptase and regulates the expression of psbD encoding the reaction center protein D2 of PSII. Since in A. thaliana ptf1 mutants the expression of psbD is reduced [81], it can be assumed that SAP11 binding to TCP13 has a similar effect.Even though psbD was not downregulated in this study, two other genes encoding proteins from PSII were downregulated upon SAP11CaPm expression, namely the oxygen-evolving enhancer proteins 1 (OEE1/PsbO) and OEE2 (PsbP). Interestingly, OEE2/PsbP is directly targeted by a Plasmopara viticola RXLR effector protein [82, 83], while OEE1/PsbO binds to HIPM (HrpN-interacting protein from Malus spp.), a susceptibility gene for Erwinia amylovora infection in apple [84]. Nicotiana benthamiana Domin psbP knockout mutants showed a reduced growth and bleached leaves and were less susceptible to Phytophtora capsici infection [82]. In the same line, transgenic grapevine lines overexpressing psbP were more susceptible to P. viticola infection [82], indicating that PsbP downregulation enhances immunity. In contrast OEE1/PsbO and OEE2/PsbP proteins were more abundant in leaves of powdery mildew resistant cucumbers than in susceptible ones [85].
Conclusions
Our findings revealed a downregulation of defense-related genes, suggesting a suppression of the plant’s immune response by SAP11CaPm. Moreover, the modulation of genes involved in oxidative phosphorylation, as well as upregulation of ATP biosynthetic processes, hinted at a potential strategy employed by the phytoplasma via its effectors to exploit host metabolic pathways for its proliferation and colonization.
Additionally, the downregulation of transcripts related to chloroplast, such as SCY1, OEE1/PsbO or OEE2/PsbP suggest a potential link between SAP11CaPm and the compromise of photosynthetic processes, possibly through interactions with chloroplast-related factors.
Our study contributes to the understanding of SAP11CaPm’s impact on phytoplasma host plants. However, questions regarding the direct targeting of chloroplasts and the intricate mechanisms leading to photosynthesis reduction and the effect on ATP biosynthetic processes and oxidative phosphorylation remain open. Future research elucidating these aspects will advance our understanding of phytoplasma-plant interactions and will result in new strategies for mitigating the impact of phytoplasma infections in agricultural settings.
Data availability
The datasets generated and/or analyzed during the current study are available in the NCBI repository with BioProject ID PRJNA871046 and contains 13 BioSample datasets (https://www.ncbi.nlm.nih.gov/bioproject/?term=PRJNA871046). The Transcriptome Shotgun Assembly project has been deposited at DDBJ/ENA/GenBank under the accession GKBG00000000 (https://www.ncbi.nlm.nih.gov/nuccore/2428580569).
Abbreviations
- ABA:
-
Abscisic Acid
- ATP:
-
Adenosine Triphosphate
- BP:
-
Biological Process
- BSL1:
-
Serine/Threonine-protein phosphatase BSL1, BSU1-like 1
- BSU1:
-
BRI1 SUPPRESSOR 1
- 'Ca. P. mali’:
-
‘Candidatus Phytoplasma mali’
- CaMV 35S:
-
Cauliflower Mosaic Virus 35 S promoter
- CC:
-
Cellular Component
- cDNA:
-
Complementary DNA
- CHR8:
-
Chromatin Remodeling 8
- DET:
-
Differentially Expressed Transcript
- DUF21:
-
Domain of Unknown Function 21
- ELI3-1:
-
ELICITOR-ACTIVATED GENE3-1
- FDR:
-
False Discovery Rate
- GC:
-
Guanine-Cytosine (content in DNA)
- GFP:
-
Green Fluorescent Protein
- GO:
-
Gene Ontology
- JA:
-
Jasmonate
- KEGG:
-
Kyoto Encyclopedia of Genes and Genomes
- L2FC:
-
Log2 Fold Change
- LOX2:
-
LIPOXYGENASE2
- MF:
-
Molecular Function
- MOS1:
-
Modifier of snc1,1
- NADPH:
-
Nicotinamide Adenine Dinucleotide Phosphate
- NB-LRR:
-
Nucleotide-Binding Leucine-Rich Repeat
- NTRC:
-
NADPH-dependent thioredoxin reductase C
- nt:
-
Nucleotide collection database
- OEE1/PsbO:
-
Oxygen-Evolving Enhancer Protein 1
- OEE2/PsbP:
-
Oxygen-Evolving Enhancer Protein 2
- PEP:
-
Plastid-Encoded Polymerase
- PiAVR2:
-
Phytophthora infestans effector protein AVR2
- PR1:
-
PATHOGENESIS-RELATED GENE1
- qPCR:
-
Quantitative Polymerase Chain Reaction
- RNA-seq:
-
RNA sequencing
- RBCS:
-
Ribulose-1,5-bisphosphate carboxylase/oxygenase small subunit
- RT-qPCR:
-
Reverse Transcription Quantitative Polymerase Chain Reaction
- SA:
-
Salicylic acid
- SCV:
-
Sweet Cherry Virescence phytoplasma
- SEM:
-
Standard Error of the Mean
- SWI2/SNF2:
-
SWITCH2/SUCROSE NON-FERMENTING2
- TCP:
-
TEOSINTE BRANCHED1, CYCLOIDEA, and PROLIFERATING CELL FACTORS
- TMM:
-
Trimmed Mean of M values
- tRBCS:
-
Ribulose-1,5-bisphosphate carboxylase/oxygenase terminator
References
Kube M, Schneider B, Kuhl H, Dandekar T, Heitmann K, Migdoll AM, et al. The linear chromosome of the plant-pathogenic mycoplasma ‘Candidatus Phytoplasma Mali’. BMC Genomics. 2008. https://doi.org/10.1186/1471-2164-9-306.
Tomkins M, Kliot A, Marée AF, Hogenhout SA. A multi-layered mechanistic modelling approach to understand how effector genes extend beyond phytoplasma to modulate plant hosts, insect vectors and the environment. Curr Opin Plant Biol. 2018;44:39–48. https://doi.org/10.1016/j.pbi.2018.02.002.
Rashid U, Bilal S, Bhat KA, Shah TA, Wani TA, Bhat FA, et al. Phytoplasma effectors and their role in Plant-Insect Interaction. Int J Curr Microbiol App Sci. 2018;7:1136–48. https://doi.org/10.20546/ijcmas.2018.702.141.
Janik K, Mithöfer A, Raffeiner M, Stellmach H, Hause B, Schlink K, Mithofer A. An effector of apple proliferation phytoplasma targets TCP transcription factors-a generalized virulence strategy of phytoplasma? Mol Plant Pathol. 2017;18:435–42. https://doi.org/10.1111/mpp.12409.
Mittelberger C, Stellmach H, Hause B, Kerschbamer C, Schlink K, Letschka T, Janik K. A novel effector protein of Apple Proliferation Phytoplasma disrupts Cell Integrity of Nicotiana Spp. Protoplasts. Int J Mol Sci. 2019;20:1–16. https://doi.org/10.3390/ijms20184613.
Strohmayer A, Moser M, Si-Ammour A, Krczal G, Boonrod K. Candidatus Phytoplasma Mali’ genome encodes a protein that functions as a E3 ubiquitin ligase and could inhibit plant basal defense. Mol Plant Microbe Interact. 2019. https://doi.org/10.1094/MPMI-04-19-0107-R.
Huang W, MacLean AM, Sugio A, Maqbool A, Busscher M, Cho S-T, et al. Parasitic modulation of host development by ubiquitin-independent protein degradation. Cell. 2021;184:5201–e521412. https://doi.org/10.1016/j.cell.2021.08.029.
Seemüller E, Zikeli K, Furch ACU, Wensing A, Jelkmann W. Virulence of ‘Candidatus Phytoplasma Mali’ strains is closely linked to conserved substitutions in AAA + ATPase AP460 and their supposed effect on enzyme function. Eur J Plant Pathol. 2017;86:141. https://doi.org/10.1007/s10658-017-1318-2.
Bai X, Correa VR, Toruño TY, Ammar E-D, Kamoun S, Hogenhout SA. AY-WB phytoplasma secretes a protein that targets plant cell nuclei. Mol Plant Microbe Interact. 2009;22:18–30. https://doi.org/10.1094/MPMI-22-1-0018.
Boonrod K, Strohmayer A, Schwarz T, Braun M, Tropf T, Krczal G. Beyond Destabilizing Activity of SAP11-like Effector of Candidatus Phytoplasma mali Strain PM19. Microorganisms. 2022. https://doi.org/10.3390/microorganisms10071406.
Strohmayer A, Schwarz T, Braun M, Krczal G, Boonrod K. The Effect of the Anticipated Nuclear localization sequence of ‘Candidatus Phytoplasma Mali’ SAP11-like protein on localization of the protein and destabilization of TCP Transcription Factor. Microorganisms. 2021;9:1–17. https://doi.org/10.3390/microorganisms9081756.
Sugio A, Kingdom HN, MacLean AM, Grieve VM, Hogenhout SA. Phytoplasma protein effector SAP11 enhances insect vector reproduction by manipulating plant development and defense hormone biosynthesis. Proc Natl Acad Sci U S A. 2011;108:1254–63. https://doi.org/10.1073/pnas.1105664108.
Sugio A, MacLean AM, Hogenhout SA. The small phytoplasma virulence effector SAP11 contains distinct domains required for nuclear targeting and CIN-TCP binding and destabilization. New Phytol. 2014;202:838–48. https://doi.org/10.1111/nph.12721.
Chang SH, Tan CM, Wu C-T, Lin T-H, Jiang S-Y, Liu R-C, et al. Alterations of plant architecture and phase transition by the phytoplasma virulence factor SAP11. J Exp Bot. 2018;69:5389–401. https://doi.org/10.1093/jxb/ery318.
Tabarelli M, Malnoy M, Janik K. Chasing consistency: an update of the TCP Gene Family of Malus × Domestica. Genes (Basel). 2022. https://doi.org/10.3390/genes13101696.
Mittelberger C, Hause B, Janik K. The ‘Candidatus Phytoplasma Mali’ effector protein SAP11CaPm interacts with MdTCP16, a class II CYC/TB1 transcription factor that is highly expressed during phytoplasma infection. PLoS ONE. 2022;17:e0272467. https://doi.org/10.1371/journal.pone.0272467.
Lu Y-T, Li M-Y, Cheng K-T, Tan CM, Su L-W, Lin W-Y, et al. Transgenic plants that express the phytoplasma effector SAP11 show altered phosphate starvation and defense responses. Plant Physiol. 2014;164:1456–69. https://doi.org/10.1104/pp.113.229740.
Pecher P, Moro G, Canale MC, Capdevielle S, Singh A, MacLean A, et al. Phytoplasma SAP11 effector destabilization of TCP transcription factors differentially impact development and defence of Arabidopsis versus maize. PLoS Pathog. 2019;15:1–27. https://doi.org/10.1371/journal.ppat.1008035.
Luge T, Kube M, Freiwald A, Meierhofer D, Seemüller E, Sauer S. Transcriptomics assisted proteomic analysis of Nicotiana occidentalis infected by Candidatus Phytoplasma Mali strain AT. Proteomics. 2014;14:1882–9. https://doi.org/10.1002/pmic.201300551.
Bond DM, Albert NW, Lee RH, Gillard GB, Brown CM, Hellens RP, Macknight RC. Infiltration-RNAseq: transcriptome profiling of Agrobacterium-mediated infiltration of transcription factors to discover gene function and expression networks in plants. Plant Methods. 2016;12:41. https://doi.org/10.1186/s13007-016-0141-7.
Boonrod K, Munteanu B, Jarausch B, Jarausch W, Krczal G. An immunodominant membrane protein (imp) of ‘Candidatus Phytoplasma Mali’ binds to plant actin. Mol Plant Microbe Interact. 2012;25:889–95. https://doi.org/10.1094/MPMI-11-11-0303.
Schneider B, Sule S, Jelkmann W, Seemüller E. Suppression of aggressive strains of ‘Candidatus Phytoplasma Mali’ by mild strains in Catharanthus roseus and Nicotiana occidentalis and indication of similar action in apple trees. Phytopathology. 2014;104:453–61. https://doi.org/10.1094/PHYTO-08-13-0230-R.
Seemüller E, Kiss E, Sule S, Schneider B. Multiple infection of apple trees by distinct strains of ‘Candidatus Phytoplasma Mali’ and its pathological relevance. Phytopathology. 2010;100:863–70. https://doi.org/10.1094/PHYTO-100-9-0863.
Lampropoulos A, Sutikovic Z, Wenzl C, Maegele I, Lohmann JU, Forner J. GreenGate - A Novel, Versatile, and efficient Cloning System for Plant Transgenesis. PLoS ONE. 2013;8:e83043. https://doi.org/10.1371/journal.pone.0083043.
Andrews S, Lindenbaum P, Howard B, Ewels P. FastQC; 2011–7.
Bolger AM, Lohse M, Usadel B. Trimmomatic: a flexible trimmer for Illumina sequence data. Bioinformatics. 2014;30:2114–20. https://doi.org/10.1093/bioinformatics/btu170.
Grabherr MG, Haas BJ, Yassour M, Levin JZ, Thompson DA, Amit I, et al. Full-length transcriptome assembly from RNA-Seq data without a reference genome. Nat Biotechnol. 2011;29:644–52. https://doi.org/10.1038/nbt.1883.
Bryant DM, Johnson K, DiTommaso T, Tickle T, Couger MB, Payzin-Dogru D, et al. A tissue-mapped Axolotl De Novo Transcriptome enables identification of limb regeneration factors. Cell Rep. 2017;18:762–76. https://doi.org/10.1016/j.celrep.2016.12.063.
Haas BJ, Papanicolaou A, Yassour M, Grabherr M, Blood PD, Bowden J, et al. De novo transcript sequence reconstruction from RNA-seq using the Trinity platform for reference generation and analysis. Nat Protoc. 2013;8:1494–512. https://doi.org/10.1038/nprot.2013.084.
Lafond-Lapalme J, Duceppe M-O, Wang S, Moffett P, Mimee B. A new method for decontamination of de novo transcriptomes using a hierarchical clustering algorithm. Bioinformatics. 2017;33:1293–300. https://doi.org/10.1093/bioinformatics/btw793.
Altschul SF, Gish W, Miller W, Myers EW, Lipman DJ. Basic local alignment search tool. J Mol Biol. 1990;215:403–10. https://doi.org/10.1016/S0022-2836(05)80360-2.
Eddy SR, Accelerated Profile HMM, Searches. PLoS Comput Biol. 2011;7:e1002195. https://doi.org/10.1371/journal.pcbi.1002195.
Almagro Armenteros JJ, Tsirigos KD, Sønderby CK, Petersen TN, Winther O, Brunak S, et al. SignalP 5.0 improves signal peptide predictions using deep neural networks. Nat Biotechnol. 2019;37:420–3. https://doi.org/10.1038/s41587-019-0036-z.
Krogh A, Larsson B, von Heijne G, Sonnhammer EL. Predicting transmembrane protein topology with a hidden Markov model: application to complete genomes. J Mol Biol. 2001;305:567–80. https://doi.org/10.1006/jmbi.2000.4315.
Patro R, Duggal G, Love MI, Irizarry RA, Kingsford C. Salmon provides fast and bias-aware quantification of transcript expression. Nat Methods. 2017;14:417–9. https://doi.org/10.1038/nmeth.4197.
Love MI, Huber W, Anders S. Moderated estimation of Fold change and dispersion for RNA-seq data with DESeq2. Genome Biol. 2014;15:550. https://doi.org/10.1186/s13059-014-0550-8.
Bardou P, Mariette J, Escudié F, Djemiel C, Klopp C. Jvenn: an interactive Venn diagram viewer. BMC Bioinformatics. 2014;15:293. https://doi.org/10.1186/1471-2105-15-293.
Young MD, Wakefield MJ, Smyth GK, Oshlack A. Gene ontology analysis for RNA-seq: accounting for selection bias. Genome Biol. 2010;11:R14. https://doi.org/10.1186/gb-2010-11-2-r14.
R Core Team. R: a Language and Environment for Statistical Computing. Vienna, Austria: R Foundation for Statistical Computing; 2022.
Young MD, goseq. Bioconductor; 2017.
Sayols S. Rrvgo: a Bioconductor package to reduce and visualize Gene Ontology terms. Bioconductor; 2020.
Szklarczyk D, Gable AL, Nastou KC, Lyon D, Kirsch R, Pyysalo S, et al. The STRING database in 2021: customizable protein-protein networks, and functional characterization of user-uploaded gene/measurement sets. Nucleic Acids Res. 2021;49:D605–12. https://doi.org/10.1093/nar/gkaa1074.
van Dongen S. Graph Clustering Via a Discrete Uncoupling process. SIAM J Matrix Anal Appl. 2008;30:121–41. https://doi.org/10.1137/040608635.
Pombo MA, Ramos RN, Zheng Y, Fei Z, Martin GB, Rosli HG. Transcriptome-based identification and validation of reference genes for plant-bacteria interaction studies using Nicotiana benthamiana. Sci Rep. 2019;9:1632. https://doi.org/10.1038/s41598-018-38247-2.
Mittelberger C, Obkircher L, Oberkofler V, Ianeselli A, Kerschbamer C, Gallmetzer A, et al. Development of a universal endogenous qPCR control for eukaryotic DNA samples. Plant Methods. 2020. https://doi.org/10.1186/s13007-020-00597-2.
Xie F, Xiao P, Chen D, Xu L, Zhang B. miRDeepFinder: a miRNA analysis tool for deep sequencing of plant small RNAs. Plant Mol Biol. 2012. https://doi.org/10.1007/s11103-012-9885-2.
Matz MV, Wright RM, Scott JG. No control genes required: bayesian analysis of qRT-PCR data. PLoS ONE. 2013;8:e71448. https://doi.org/10.1371/journal.pone.0071448.
Robinson MD, Oshlack A. A scaling normalization method for differential expression analysis of RNA-seq data. Genome Biol. 2010;11:R25. https://doi.org/10.1186/gb-2010-11-3-r25.
Nieuwenhuis TO, Yang SY, Verma RX, Pillalamarri V, Arking DE, Rosenberg AZ, et al. Consistent RNA sequencing contamination in GTEx and other data sets. Nat Commun. 2020;11:1933. https://doi.org/10.1038/s41467-020-15821-9.
Steinegger M, Salzberg SL. Terminating contamination: large-scale search identifies more than 2,000,000 contaminated entries in GenBank. Genome Biol. 2020;21:115. https://doi.org/10.1186/s13059-020-02023-1.
Lee M-L, Kuo FC, Whitmore GA, Sklar J. Importance of replication in microarray gene expression studies: statistical methods and evidence from repetitive cDNA hybridizations. Proc Natl Acad Sci U S A. 2000;97:9834–9.
Wang H, Trusch F, Turnbull D, Aguilera-Galvez C, Breen S, Naqvi S, et al. Evolutionarily distinct resistance proteins detect a pathogen effector through its association with different host targets. New Phytol. 2021;232:1368–81. https://doi.org/10.1111/nph.17660.
Turnbull D, Wang H, Breen S, Malec M, Naqvi S, Yang L, et al. AVR2 targets BSL family members, which Act as susceptibility factors to suppress host immunity. Plant Physiol. 2019;180:571–81. https://doi.org/10.1104/pp.18.01143.
Saunders DGO, Breen S, Win J, Schornack S, Hein I, Bozkurt TO, et al. Host Protein BSL1 Associates with Phytophthora infestans RXLR Effector AVR2 and the Solanum demissum Immune receptor R2 to Mediate Disease Resistance. Plant Cell. 2012;24:3420–34. https://doi.org/10.1105/tpc.112.099861.
Ascencio-Ibáñez JT, Sozzani R, Lee T-J, Chu T-M, Wolfinger RD, Cella R, Hanley-Bowdoin L. Global analysis of Arabidopsis gene expression uncovers a complex array of changes impacting pathogen response and cell cycle during geminivirus infection. Plant Physiol. 2008;148:436–54. https://doi.org/10.1104/pp.108.121038.
Shaked H, Avivi-Ragolsky N, Levy AA. Involvement of the Arabidopsis SWI2/SNF2 chromatin remodeling gene family in DNA damage response and recombination. Genetics. 2006;173:985–94. https://doi.org/10.1534/genetics.105.051664.
Li Y, Tessaro MJ, Li X, Zhang Y. Regulation of the expression of Plant Resistance Gene SNC1 by a protein with a conserved BAT2 domain. Plant Physiol. 2010;153:1425–34. https://doi.org/10.1104/pp.110.156240.
Zhang N, Wang Z, Bao Z, Yang L, Wu D, Shu X, Hua J. MOS1 functions closely with TCP transcription factors to modulate immunity and cell cycle in Arabidopsis. Plant J. 2018;93:66–78. https://doi.org/10.1111/tpj.13757.
Pruss GJ, Nester EW, Vance V. Infiltration with Agrobacterium tumefaciens induces host defense and development-dependent responses in the infiltrated zone. Mol Plant Microbe Interact. 2008;21:1528–38. https://doi.org/10.1094/MPMI-21-12-1528.
Drapal M, Enfissi EMA, Fraser PD. Metabolic effects of agro-infiltration on N. benthamiana accessions. Transgenic Res. 2021;30:303–15. https://doi.org/10.1007/s11248-021-00256-9.
Rico A, Bennett MH, Forcat S, Huang WE, Preston GM. Agroinfiltration reduces ABA levels and suppresses Pseudomonas syringae-Elicited Salicylic Acid production in Nicotiana tabacum. PLoS ONE. 2010;5:e8977. https://doi.org/10.1371/journal.pone.0008977.
Sheikh AH, Raghuram B, Eschen-Lippold L, Scheel D, Lee J, Sinha AK. Agroinfiltration by cytokinin-producing Agrobacterium sp. strain GV3101 primes defense responses in Nicotiana tabacum. Mol Plant Microbe Interact. 2014;27:1175–85. https://doi.org/10.1094/MPMI-04-14-0114-R.
Dermastia M. Plant hormones in Phytoplasma Infected Plants. Front Plant Sci. 2019;10:477. https://doi.org/10.3389/fpls.2019.00477.
Oshima K, Maejima K, Namba S. Genomic and evolutionary aspects of phytoplasmas. Front Microbiol. 2013;4:230. https://doi.org/10.3389/fmicb.2013.00230.
Kube M, Mitrovic J, Duduk B, Rabus R, Seemüller E. Current view on Phytoplasma genomes and Encoded Metabolism. Sci World J. 2012;2012:185942. https://doi.org/10.1100/2012/185942.
Namba S. Molecular and biological properties of phytoplasmas. Proc Jpn Acad Ser B Phys Biol Sci. 2019;95:401–18. https://doi.org/10.2183/pjab.95.028.
Xue C, Zhang Y, Li H, Liu Z, Gao W, Liu M, et al. The genome of Candidatus phytoplasma ziziphi provides insights into their biological characteristics. BMC Plant Biol. 2023;23:251. https://doi.org/10.1186/s12870-023-04243-6.
Tan Y, Wang J, Davis RE, Wei H, Zong X, Wei W, et al. Transcriptome analysis reveals a complex array of differentially expressed genes accompanying a source-to‐sink change in phytoplasma‐infected sweet cherry leaves. Ann Appl Biology. 2019;175:69–82. https://doi.org/10.1111/aab.12511.
Tan Y, Li Q, Zhao Y, Wei H, Wang J, Baker CJ, et al. Integration of metabolomics and existing omics data reveals new insights into phytoplasma-induced metabolic reprogramming in host plants. PLoS ONE. 2021;16:e0246203. https://doi.org/10.1371/journal.pone.0246203.
Mittelberger C, Yalcinkaya H, Pichler C, Gasser J, Scherzer G, Erhart T, et al. Pathogen-Induced Leaf Chlorosis: products of Chlorophyll Breakdown found in Degreened leaves of Phytoplasma-infected Apple (Malus x Domestica Borkh.) And Apricot (Prunus armeniaca L.) Trees relate to the Pheophorbide a oxygenase / Phyllobilin Pathway. J Agric Food Chem. 2017;65:2651–60. https://doi.org/10.1021/acs.jafc.6b05501.
Bertamini M, Muthuchelian K, Grando MS, Nedunchezhian N. Effects of Phytoplasma Infection on Growth and Photosynthesis in leaves of Field grown apple (Malus pumila Mill. Cv. Gold Delicious) Photosynt. 2002;40:157–60. https://doi.org/10.1023/A:1020156021629.
Tan Y, Wei H-R, Wang J-W, Zong X-J, Zhu D-Z, Liu Q-Z. Phytoplasmas change the source–sink relationship of field-grown sweet cherry by disturbing leaf function. Physiol Mol Plant Pathol. 2015;92:22–7. https://doi.org/10.1016/j.pmpp.2015.08.012.
Dermastia M, Kube M, Šeruga-Musić M. Transcriptomic and proteomic studies of Phytoplasma-infected plants. In: Bertaccini A, Oshima K, Kube M, Rao GP, editors. Phytoplasmas: Plant pathogenic Bacteria - III. Singapore: Springer Singapore; 2019. pp. 35–55. https://doi.org/10.1007/978-981-13-9632-8_3.
Fincher V, Dabney-Smith C, Cline K. Functional assembly of thylakoid deltapH-dependent/Tat protein transport pathway components in vitro. Eur J Biochem. 2003;270:4930–41. https://doi.org/10.1046/j.1432-1033.2003.03894.x.
Williams-Carrier R, Stiffler N, Belcher S, Kroeger T, Stern DB, Monde R-A, et al. Use of Illumina sequencing to identify transposon insertions underlying mutant phenotypes in high-copy mutator lines of maize. Plant J. 2010;63:167–77. https://doi.org/10.1111/j.1365-313X.2010.04231.x.
Liu D, Wu ZM, Hou L. Loss-of-function mutation in SCY1 triggers chloroplast-to-nucleus retrograde signaling in Arabidopsis thaliana. Biol Plant. 2015;59:469–76. https://doi.org/10.1007/s10535-015-0514-1.
Skalitzky CA, Martin JR, Harwood JH, Beirne JJ, Adamczyk BJ, Heck GR, et al. Plastids contain a second sec translocase system with essential functions. Plant Physiol. 2011;155:354–69. https://doi.org/10.1104/pp.110.166546.
Wang J, Yu Q, Xiong H, Wang J, Chen S, Yang Z, Dai S. Proteomic insight into the response of Arabidopsis chloroplasts to darkness. PLoS ONE. 2016;11:e0154235. https://doi.org/10.1371/journal.pone.0154235.
Janik K, Mittelberger C, Moser M. Lights out. The chloroplast under attack during phytoplasma infection? Annual Plant Reviews. 2020:1–28. https://doi.org/10.1002/9781119312994.apr0747.
Yamburenko MV, Zubo YO, Borner T. Abscisic acid affects transcription of chloroplast genes via protein phosphatase 2 C-dependent activation of nuclear genes: repression by guanosine-3’-5’-bisdiphosphate and activation by sigma factor 5. Plant J. 2015;82:1030–41. https://doi.org/10.1111/tpj.12876.
Baba K, Nakano T, Yamagishi K, Yoshida S. Involvement of a Nuclear-Encoded Basic Helix-Loop-Helix Protein in Transcription of the Light-Responsive Promoter of psbD1. Plant Physiol. 2001;125:595–603.
Liu R, Chen T, Yin X, Xiang G, Peng J, Fu Q, et al. A plasmopara viticola RXLR effector targets a chloroplast protein PsbP to inhibit ROS production in grapevine. Plant J. 2021;106:1557–70. https://doi.org/10.1111/tpj.15252.
Breen S, McLellan H, Birch PRJ, Gilroy EM. Tuning the Wavelength: Manipulation of Light Signaling to Control Plant Defense. Int J Mol Sci. 2023. https://doi.org/10.3390/ijms24043803.
Campa M, Piazza S, Righetti L, Oh C-S, Conterno L, Borejsza-Wysocka E, et al. HIPM is a susceptibility gene of Malus spp.: reduced expression reduces susceptibility to Erwinia amylovora. Mol Plant Microbe Interact. 2019;32:167–75. https://doi.org/10.1094/MPMI-05-18-0120-R.
Fan H, Ren L, Meng X, Song T, Meng K, Yu Y. Proteome-level investigation of Cucumis sativus-derived resistance to Sphaerotheca Fuliginea. Acta Physiol Plant. 2014;36:1781–91. https://doi.org/10.1007/s11738-014-1552-6.
Acknowledgements
We express our gratitude to Christine Kerschbamer and Katherina Telser for their assistance in the sampling and RNA extraction processes. Special thanks to Hagen Stellmach for his valuable advice and guidance in agroinfiltration. Our appreciation also goes to Sabine Öttl for providing primers for reference genes. Additionally, we acknowledge Andreas Gallmetzer for his support in ensuring RNA quality and integrity.
Funding
The work was performed as part of the project APPLIII and APPLiv within the framework agreement in the field of invasive species in fruit growing and major pathologies, co-funded by the Autonomous Province of Bozen/Bolzano, Italy, and the South Tyrolean Apple Consortium. The authors thank the Department of Innovation, Research, University and Museums of the Autonomous Province of Bozen/Bolzano covering the Open Access publication costs.
Author information
Authors and Affiliations
Contributions
CM contributed to the study design, performed all experiments, analyzed, and interpreted the data and wrote and revised the manuscript. MM analyzed and interpreted the data and revised the manuscript. BH contributed to the study design, interpreted the data, and revised the manuscript. KJ contributed to the study design, helped in analyzing and interpreting the data, contributed to the writing and revision of the manuscript. All authors read and approved the final manuscript.
Corresponding author
Ethics declarations
Ethics approval and consent to participate
Not applicable.
Consent for publication
Not applicable.
Competing interests
The authors declare no competing interests.
Additional information
Publisher’s Note
Springer Nature remains neutral with regard to jurisdictional claims in published maps and institutional affiliations.
Electronic supplementary material
Below is the link to the electronic supplementary material.
Rights and permissions
Open Access This article is licensed under a Creative Commons Attribution 4.0 International License, which permits use, sharing, adaptation, distribution and reproduction in any medium or format, as long as you give appropriate credit to the original author(s) and the source, provide a link to the Creative Commons licence, and indicate if changes were made. The images or other third party material in this article are included in the article’s Creative Commons licence, unless indicated otherwise in a credit line to the material. If material is not included in the article’s Creative Commons licence and your intended use is not permitted by statutory regulation or exceeds the permitted use, you will need to obtain permission directly from the copyright holder. To view a copy of this licence, visit http://creativecommons.org/licenses/by/4.0/. The Creative Commons Public Domain Dedication waiver (http://creativecommons.org/publicdomain/zero/1.0/) applies to the data made available in this article, unless otherwise stated in a credit line to the data.
About this article
Cite this article
Mittelberger, C., Moser, M., Hause, B. et al. ‘Candidatus Phytoplasma mali’ SAP11-Like protein modulates expression of genes involved in energy production, photosynthesis, and defense in Nicotiana occidentalis leaves. BMC Plant Biol 24, 393 (2024). https://doi.org/10.1186/s12870-024-05087-4
Received:
Accepted:
Published:
DOI: https://doi.org/10.1186/s12870-024-05087-4


