
Abstract
Background
Brassica carinata (A) Braun has recently gained increased attention across the world as a sustainable biofuel crop. B. carinata is grown as a summer crop in many regions where high temperature is a significant stress during the growing season. However, little research has been conducted to understand the mechanisms through which this crop responds to high temperatures. Understanding traits that improve the high-temperature adaption of this crop is essential for developing heat-tolerant varieties. This study investigated lipid remodeling in B. carinata in response to high-temperature stress. A commercial cultivar, Avanza 641, was grown under sunlit-controlled environmental conditions in Soil-Plant-Atmosphere-Research (SPAR) chambers under optimal temperature (OT; 23/15°C) conditions. At eight days after sowing, plants were exposed to one of the three temperature treatments [OT, high-temperature treatment-1 (HT-1; 33/25°C), and high-temperature treatment-2 (HT-2; 38/30°C)]. The temperature treatment period lasted until the final harvest at 84 days after sowing. Leaf samples were collected at 74 days after sowing to profile lipids using electrospray-ionization triple quadrupole mass spectrometry.
Results
Temperature treatment significantly affected the growth and development of Avanza 641. Both high-temperature treatments caused alterations in the leaf lipidome. The alterations were primarily manifested in terms of decreases in unsaturation levels of membrane lipids, which was a cumulative effect of lipid remodeling. The decline in unsaturation index was driven by (a) decreases in lipids that contain the highly unsaturated linolenic (18:3) acid and (b) increases in lipids containing less unsaturated fatty acids such as oleic (18:1) and linoleic (18:2) acids and/or saturated fatty acids such as palmitic (16:0) acid. A third mechanism that likely contributed to lowering unsaturation levels, particularly for chloroplast membrane lipids, is a shift toward lipids made by the eukaryotic pathway and the channeling of eukaryotic pathway-derived glycerolipids that are composed of less unsaturated fatty acids into chloroplasts.
Conclusions
The lipid alterations appear to be acclimation mechanisms to maintain optimal membrane fluidity under high-temperature conditions. The lipid-related mechanisms contributing to heat stress response as identified in this study could be utilized to develop biomarkers for heat tolerance and ultimately heat-tolerant varieties.
Background
Brassica carinata A. Braun, commonly known as Ethiopian mustard, Abyssinian mustard, or carinata, is an emerging oilseed crop in North America, South America, Europe, and Australia. An essential feature of a biofuel crop is its minimal impact on land-use changes, i.e., displacing land from food and feed crops. Carinata is an off-season crop, rotation crop, and marginal-land crop that offers a potential option for a sustainable biofuel crop [1,2,3,4,5,6,7]. Carinata’s high content of erucic acid (40–45 %) not only improves its suitability as a biofuel crop [2, 8, 9] but also enhances its value for industrial applications such as manufacturing of plastics, lubricants, paints, leather tanning, soaps, and cosmetics [10, 11]. Furthermore, studies have reported that carinata is tolerant to abiotic stresses such as drought and cold and resistant to multiple insect pests and diseases [12,13,14,15]. Its ability to reduce summer weed species’ seed banks makes it suitable for integrated pest management in crop production systems [7, 16]. Carinata also has potential as a feed crop (due to its high protein and low fiber content [17,18,19]) and biofumigant (varieties with high glucosinolate content [20]). There have been concerted efforts both from public and private entities in the last few years to establish carinata as a sustainable biofuel crop in the United States [1, 16, 21,22,23,24].
Carinata is grown as a summer crop in many regions where high temperature is expected to be a significant stress during the growing season. Limited information is available on carinata’s response to high temperatures. A recent study investigated the effect of high temperature stress on carinata using 12 genotypes [25]. The same study identified that the shoot, root, and physiological traits of carinata are significantly affected by high temperature stress (27/19ºC) during germination and early growth. However, the underlying mechanisms that drive the high-temperature sensitivity are unclear [25]. To develop high-temperature tolerant varieties, it is essential to understand the mechanisms that will enable this species to adapt to high temperatures.
Previous research on other species has demonstrated that alterations in lipid metabolism significantly affect a plant’s ability to acclimate to high temperature stress [26,27,28,29,30,31,32]. Lipids and proteins are the major constituents of biological membranes. The dynamic nature of membrane lipid composition is essential to maintaining cellular and ultimately whole-plant homeostasis in response to fluctuations in growth temperature [33]. Multiple lipid classes have been proposed to function in stress signaling or adaptation mechanisms [29, 34,35,36,37,38]. It was recently found in another Brassica species (Brassica napus L., oilseed rape) that high night temperature leads to overexpression of genes involved in fatty acid catabolism, which results in up-regulated gibberellin signaling during the night-time [39]. Additionally, recent reports in other species demonstrate that heat tolerant and susceptible genotypes differ in the heat-induced changes in their lipidome. These changes have the potential as biomarkers for selecting heat-tolerant genotypes [29, 30, 32].
In the present study, we employed automated direct infusion electrospray ionization-triple quadrupole mass spectrometry (ESI-MS/MS) to investigate the heat-induced changes in the leaf lipidome of B. carinata. The objective was to determine the lipid-related mechanisms associated with high-temperature stress response in this species.
Results
High-temperature stress affects growth traits
Temperature treatment significantly affected the growth and development of Avanza 641 (Fig. 1). The days required to produce first bolting (inflorescence appearance) and flowering were 41.7 ± 0.33 and 47.9 ± 0.35, respectively, at the optimum temperature of 23/15°C. Plants grown at high temperatures (HT-1, 33/25 and HT-2, 38/30°C) did not bolt or produce flowers during the 84-day period showing complete reproductive failure. Plants produced 3052 ± 342 pods plant− 1 at OT and none at HT-1 and HT-2. The leaf area of plants grown at HT-1 was greater (+ 169 %) than that at OT. The total plant dry weight, on the other hand, was significantly greater at OT and showed lower values at HT-1 (-35 %) and HT-2 (-72 %).
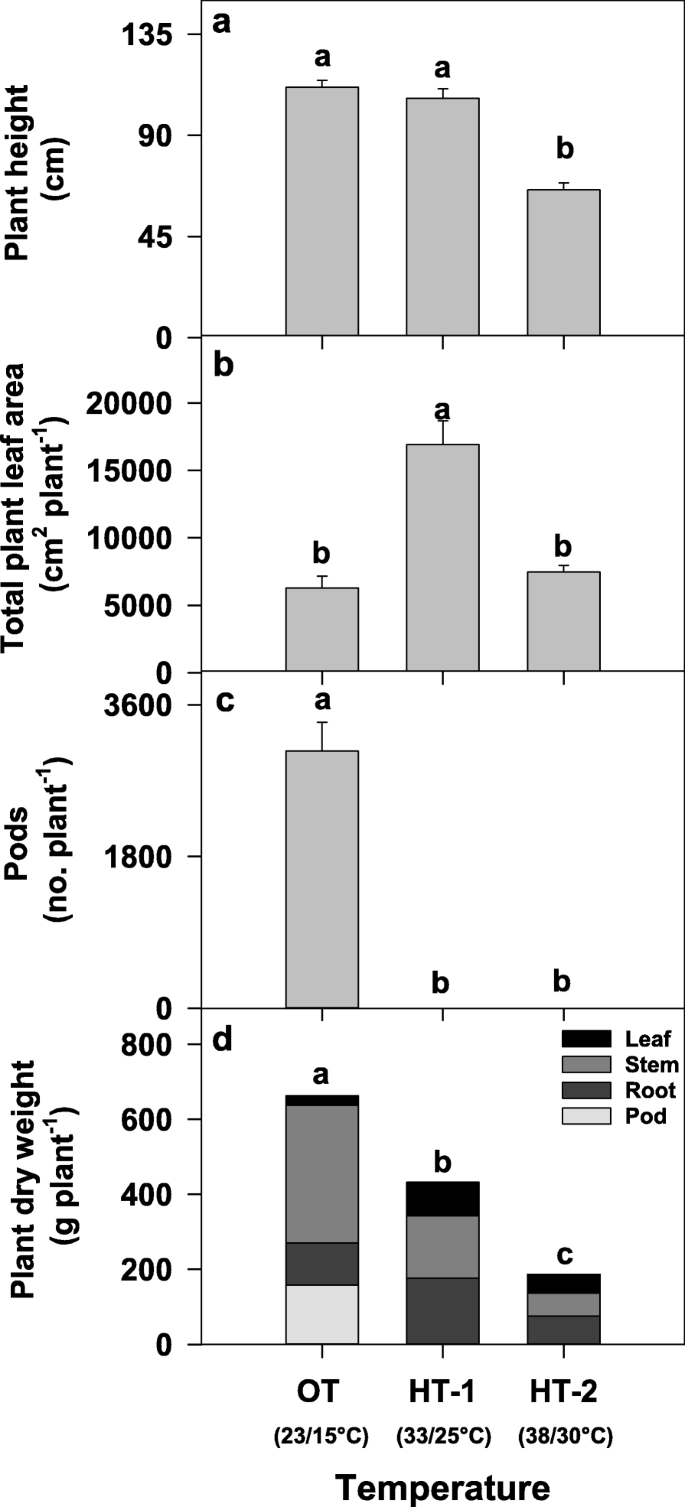
Effects of temperature on plant height (a), leaf area (b), pod number (c), and total dry weight (d) of the Brassica carinata cultivar Avanza 641. Total dry weight includes dry weights of leaves, stems, pods, and roots. No plants produced pods at HT-1 and HT-2. Bars represent least-squares means and error bars represent the corresponding standard errors. Least-squares means with different letters are significantly different according to Fisher’s least significant difference test at α = 0.05. OT, optimal day/night temperatures; HT-1, high temperature treatment-1; HT-2, high temperature treatment-2
Leaf lipids were profiled and quantified with electrospray ionization-triple quadrupole mass spectrometry (ESI-MS/MS)
The ESI-MS/MS approach quantified 105 lipid analytes in the leaves of Avanza 641 (Supplementary Table S1, Additional file 1). These lipids included plastidic lipids [DGDG, digalactosyldiacylglycerol; MGDG, monogalactosyldiacylglycerol; and PG, phosphatidylglycerol], extraplastidic lipids [PC, phosphatidylcholine; PE, phosphatidylethanolamine; PI, phosphatidylinositol; PS, phosphatidylserine, LPC, lysophosphatidylcholine; and LPE, lysophosphatidylethanolamine], and phosphatidic acid (PA). Analysis of variance results revealed significant changes in the composition of the leaf lipidome under high-temperature stress (Supplementary Table S2, Additional file 1).
The composition of the leaf lipidome in terms of head-group classes for the control treatment (OT; 23/15°C) was dominated by three classes: MGDG (56 %), DGDG (18 %), and PC (10 %), which together accounted for ~ 85 % of the normalized mass spectral intensity (Fig. 2a). The same three head group classes in OT were also the predominant classes under HT-1 and HT-2. Together, they accounted for ~ 78 % of the total lipids in both high-temperature treatments (Fig. 2a).

Pie charts depicting composition of various lipid head-group classes (a) and lipid molecular species (b) in Avanza 641 leaves under different temperature treatments. OT, optimal day/night temperatures; HT-1, high temperature treatment-1; HT-2, high temperature treatment-2. DGDG, digalactosyldiacylglycerol; MGDG, monogalactosyldiacylglycerol; PA, phosphatidic acid; PC, phosphatidylcholine; PE, phosphatidylethanolamine; PG, phosphatidylglycerol; PI, phosphatidylinositol; PS, phosphatidylserine. Lipid molecular species are identified as total acyl carbons: total double bonds
When analyzed based on lipid molecular species composition, the leaf lipidome under OT was dominated by three lipid molecular species: 34:6 (35 %), 36:6 (30 %), and 34:3 (14 %), together accounting for 79 % of all lipid species (Fig. 2b). Under HT-1, the same three lipid species were dominant and together accounted for 70 % of the total lipid species (Fig. 2b). Similarly, the same three lipid species were dominant under HT-2 and together accounted for 69 % of the total lipids (Fig. 2b). The levels of 34:6 and 36:6 decreased by 11 and 23 %, respectively, under HT-1 compared to OT. Similarly, the levels of both lipid species decreased by 20 % under HT-2 compared to OT. In contrast, 34:3 increased by 14 and 21 % under HT-1 and HT-2, respectively. Substantial increases occurred under both HT treatments for 34:1 (556–680 %), 34:2 (133–167 %), and 36:4 (300 %) (Fig. 2b).
Unsaturation levels and lipid species composition of head-group classes were modified under high temperature stress
The differences in the leaf lipidome between high temperature stress and OT were clearly reflected in the separation of the temperature treatments when subjected to principal component analysis, where principal components 1 and 2 captured 64.5 and 23.5 %, respectively, of the total variation in the lipid data (Supplementary Fig. S1, Additional file 2). High temperature stress resulted in a significant reduction of unsaturation levels across all head-group classes (Fig. 3). Furthermore, four head-group classes (MGDG, PA, PC, and PE) underwent a significant additional decrease in their unsaturation levels from HT-1 to HT-2.

Changes in lipid unsaturation levels in response to high temperature stress. The unsaturation index for a lipid molecular species is the average number of double bonds per acyl chain, which is calculated by dividing the total number of double bonds in the acyl chains of that lipid molecular specie by its number of acyl chains. For a lipid head-group class, unsaturation index is calculated as previously described [29]: \( \frac{\sum \left(\mathrm{unsaturation}\ \mathrm{in}\mathrm{dices}\ \mathrm{of}\ \mathrm{in}\mathrm{dividual}\ \mathrm{lipid}\ \mathrm{molecular}\ \mathrm{species}\ \mathrm{in}\ \mathrm{the}\ \mathrm{class}\times \mathrm{amount}\ \mathrm{of}\ \mathrm{each}\ \mathrm{species}\right)}{\sum \mathrm{amount}\ \mathrm{of}\ \mathrm{all}\ \mathrm{lipid}\ \mathrm{molecular}\ \mathrm{species}\ \mathrm{in}\ \mathrm{the}\ \mathrm{class}} \) Bars represent least-squares means, and error bars represent the corresponding standard errors. Least-squares means with different letters are significantly different according to Fisher’s least significant difference test at α = 0.05. OT, optimal day/night temperatures; HT-1, high temperature treatment-1; HT-2, high temperature treatment-2. DGDG, digalactosyldiacylglycerol; MGDG, monogalactosyldiacylglycerol; PA, phosphatidic acid; PC, phosphatidylcholine; PE, phosphatidylethanolamine; PG, phosphatidylglycerol; PI, phosphatidylinositol; PS, phosphatidylserine
Similarities and differences existed among the head-group classes in how a decrease in unsaturation index was achieved under high-temperature stress. Highly unsaturated lipids, i.e., those that contain two trienoic acyl chains such as 34:6 (18:3/16:3) and 36:6 (18:3/18:3), were significantly reduced in multiple head-group classes under either HT treatments. These included the plastidic lipid species DGDG(34:6) and DGDG(36:6) (Fig. 4), and the extraplastidic lipid species PC(36:6), PE(36:6), and PI(36:6) (Fig. 5). In contrast, the plastidic lipid species MGDG(36:6) significantly increased in response to HT, but no significant change occurred for MGDG(34:6), PG(36:6) (Fig. 4), and PA(36:6) (Fig. 5). Furthermore, several less unsaturated and saturated lipids significantly increased in response to HT. In the plastid, the lipid species DGDG 34:2, 34:1, and 36:3; MGDG 34:2, 34:1, 36:4, and 36:3; and PG 32:1, 32:0, 34:2, 34:1, 34:0, 36:4, and 36:3 increased (Fig. 4). Likewise, the extraplastidic lipid species PC 32:0, 34:2, 34:1, 36:4, 36:2, and 36:1; PE 34:2, 34:1, 36:4, and 36:2; and PI 34:2, 34:1, 36:4, 36:3, and 36:2 and PA 32:0, 34:2, 34:1, 36:4, 36:3, and 36:2 also increased (Fig. 5). When the fatty-acid compositions of the different lipid headgroup classes were examined, the same trend was observed, where saturated (16:0 and 18:0) and/or less unsaturated (18:1 and 18:2) acyl chains increased under high temperatures, whereas the highly unsaturated 18:3 acyl chain decreased (Table 1). Taken together, lipid remodeling at the lipid molecular species composition level contributed greatly to lowering unsaturation levels.

Changes in the levels of plastidic lipid molecular species in response to high temperature stress. All lipid molecular species shown passed both the limit of detection (LOD > 0.002 nmol) and the coefficient of variation (CoV < 0.3) cutoffs (details in “Methods”). Bars represent least-squares means and error bars represent the corresponding standard errors. Least-squares means with different letters are significantly different according to Fisher’s least significant difference test at α = 0.05. OT, optimal day/night temperatures; HT-1, high temperature treatment-1; HT-2, high temperature treatment-2; DGDG, digalactosyldiacyglycerol; MGDG, monogalactosyldiacylglycerol; PG, phosphatidylglycerol. Lipid molecular species are identified as total acyl carbons: total double bonds

Changes in the levels of extraplastidic and phosphatidic acid (PA) lipid molecular species in response to high temperature stress. All lipid molecular species shown passed both the limit of detection (LOD>0.002 nmol) and the coefficient of variation (CoV<0.3) cutoffs (details in “Methods”). Bars represent least-squares means and error bars represent the corresponding standard errors. Least-squares means with different letters are significantly different according to Fisher’s least significant difference test at α = 0.05. OT, optimal day/night temperatures; HT-1, high temperature treatment- 1; HT-2, high temperature treatment-2; PC, phosphatidylcholine; PI, phosphatidylinositol; PE, phosphatidylethanolamine. Lipid molecular species are identified as total acyl carbons: total double bonds
The changes in the levels of 34:3 species under HT treatments demonstrated opposite trends in chloroplast structural lipids (DGDG, MGDG, and PG) and extraplastidic structural lipids (PC and PE). While 34:3 species of DGDG, MGDG, and PG increased under HT treatments (Fig. 4), the opposite occurred for 34:3 species of PC and PE (Fig. 5). Although present in both chloroplasts and extraplastidic membranes, PA(34:3) significantly increased under HT treatments (Fig. 5). Overall, there was an increase in C34 DGDG lipids, a decrease in C36 DGDG lipids, and increases in C34 and C36 PA lipids under high-temperature treatments (Supplementary Fig. S2, Additional file 2).
Discussion
Temperature treatments significantly affected the growth traits of Avanza 641. The observed failure of reproductive induction and continuation of vegetative growth in B. carinata at HT-1 and HT-2 is similar to previous observations in upland (Gossypium hirsutum L. [40]) and Pima (Gossypium barbadense L. [41]) cotton species and B. napus L. [42, 43]. Plants grown under HT-2 were shorter than those under OT and HT-1 (Fig. 1a). The leaf area per plant was greater under HT-1 than under OT and HT-2 (Fig. 1b). The greater leaf area observed under moderately high temperature (HT-1) treatment was due to reproductive induction failure, which promoted vegetative growth. The lower leaf area observed at the very high-temperature treatment (HT-2) was due to smaller leaves (data not shown). Total dry matter production per plant (weight of leaves, stems, pods, and roots) significantly decreased under HT-1 and HT-2 (Fig. 1d) largely due to lack of pods under high temperature stress.
The galactolipids MGDG and DGDG made up the lion’s share of total leaf lipids (66–74 %; Fig. 1a) in Avanza 641 under all three temperature treatments (OT, HT-1, and HT-2). This is expected given that galactolipids are the primary membrane lipids of plastids, and there is an overwhelming abundance of plastids in photosynthetic tissues [44,45,46,47].
A major response of Avanza 641 to high temperatures was the decrease in the unsaturation levels of membrane lipids (Fig. 3), which is a cumulative effect of lipid remodeling. Reducing lipid unsaturation levels in cellular membranes enables plants to maintain optimal membrane fluidity in response to increases in growth temperature [27, 29, 30, 32, 33, 48]. Although a common response in plant lipidomes under high-temperature stress is reductions in unsaturation levels, the magnitude of those reductions is greater for the heat-tolerant genotypes than the heat-susceptible genotypes [27, 29, 30, 32, 33, 48].
Two mechanisms that Avanza 641 employed to reduce lipid unsaturation levels were: decreasing highly unsaturated lipid species (e.g., 34:6 and 36:6) and increasing less unsaturated and/or saturated lipid species (e.g., 32:0, 34:2, 34:1, 36:3, and 36:2) (Figs. 2b, 4 and 5). This combination was the most evident in DGDG, PC, PE, and PI head-group classes (Figs. 4 and 5). 34:6 and 36:6 lipids that decreased under high temperatures (Table 1), contain the highly unsaturated linolenic acid (18:3), two in 36:6, and one in 34:6. 34:6, lipids also contain a 16:3 fatty acid alongside the 18:3. Fatty acid desaturase (FAD) 3, FAD7, and FAD8 are the enzymes that catalyze the conversion of 18:2 fatty acids to 18:3 (FAD3 in the ER and FAD7/8 in the plastid). The conversion of 16:2 to 16:3 in plastids is also catalyzed by FAD7/8. Decreasing lipid unsaturation levels by lowering the amount of 18:3 and/or 16:3 fatty acids through reducing the expression of FAD3, FAD7, and/or FAD8 genes is likely a heat-acclimation mechanism in plants [30, 32, 49, 50].
Many of the less unsaturated lipids that increased under high-temperature stress contained linoleic acid (18:2). Fatty acid desaturase 2 catalyzes the conversion of 18:1 fatty acids to 18:2 in the endoplasmic reticulum (ER). It has been reported that the expression of FAD2 gene increased as an adaptation mechanism to heat stress in multiple species, including peanut (Arachis hypogaea L.) [32], soybean (Glycine max L. Merr.) [30], Arabidopsis thaliana L. [28], and Atriplex lentiformis L. [28]. In the present study, the ratio of 18:2/18:3 acyl chains in the extraplastidic structural lipids PC and PE significantly increased under high temperatures (Fig. 6) due to the increase in 18:2 levels and the decrese in 18:3 levels (Table 1). Thus, the reduced unsaturation levels of extraplastidic lipids in Avanza 641 due to the reduction in the amounts of lipids containing 18:3 fatty acid and the increase in the amounts of lipids containing 18:2 fatty acid might be a result of reduced expression of FAD3 gene and increased expression of FAD2 gene. Future studies can confirm this postulate by measuring the expression of FAD3 and FAD2 genes. It could also be possible that the decrease in membrane lipid unsaturation levels under high temperature stress is consistent with the rate of de novo fatty acid synthesis [49].

Changes in the ratios of 16:0/16:3 fatty acids in diagalactosyldiacylglycerol (DGDG) and monogalactosyldiacylglycerol (MGDG) and 18:2/18:3 fatty acids in phosphatidic acid (PA), phosphatidylcholine (PC), phosphatidylethanolamine (PE), and phosphatidylglycerol (PG) in respone to high temperatures. Bars represent least-squares means and error bars represent the corresponding standard errors. Least-squares means with different letters are significantly different according to Fisher’s least significant difference test at α = 0.05. OT, optimal day/night temperatres; HT-1, high temperature treatment- 1; HT-2, high temperature treatment-2. Acyl chains are identified as total acyl carbons: total double bonds
MGDG (34:6) did not decrease under high temperature stress, while MGDG (36:6) significantly increased (Fig. 4). Still the unsaturation index of MGDG decreased due to significant increases in several less unsaturated MGDG species (Fig. 4), such as the 13.7 and 20.4-fold increases in the monounsaturated MGDG(34:1) under HT-1 and HT-2, respectively (Fig. 7). At the fatty acid composition level, both MGDG and DGDG had a significant increase in the saturated fatty-acid palmitic acid (16:0) under high temperatures (Table 1), which is an initial product in de novo fatty-acid biosynthesis [46]. Falcone et al. [49] observed in A. thaliana a significant increase in 16:0 and a significant decrease in 16:3 for leaf membrane lipids in response to high temperature, which contributed to the decrease in membrane lipid unsaturation levels. Strikingly, this increase in 16:0 in response to high temperature, an increase attributed by the authors to newly synthesized fatty acids, was constant even in lipid biosynthesis mutants such as fad7 fad8 and fad6, where little to no 16:3 is produced [49]. Considering that 16:3 levels decreased in DGDG (Table 1), which requires MGDG as precursor, and that 16:0 levels signifincatly increased in both DGDG and MGDG (Table 1), the increased biosynthesis of new fatty acids along with the downregulation of FAD7/8 genes might have contributed to the reduction in the unsaturation level of both galactolipids. This preferential accumulation of 16:0 over 16:3 is reflected in the significant increase in the 16:0/16:3 ratios of both DGDG and MGDG under high temperatures (Fig. 6).

A lipid-metabolism map synthesizing the results of this study within the context of known lipid metabolic pathways [27, 45, 51,52,53,54,55]. Dashed arrows indicate either multi-step conversions or lipid trafficking pathways. Lipid molecular species are identified as total acyl carbons: total double bonds. The fold change values under each high temperature treatment were calculated as: HT-1 = (lipid value under HT-1/lipid value under OT) and HT-2 = (lipid value under HT-2/lipid value under OT). An asterisk (*) next to a fold-change value for a lipid indicates a significant change at α = 0.05 for that lipid under the corresponding treatment. ACP, acyl carrier protein; CoA, coenzyme A; DAG, diacylglycerol; DAG-CPT, CDP-choline:diacylglycerol cholinephosphotransferase; DAG-EPT, CDP-ethanolamine:diacylglycerol cholinephosphotranserase; ER, endoplasmic reticulum; FAB1, fatty acid biosynthesis 1; FAD, fatty acid desaturase; F.A.S., fatty acid synthesis; FAT, fatty acyl-ACP thioesterase; FFAs, free fatty acids; IEM, plastid inner envelope membrane; MGDG, monogalactosyldiacylglycerol; OEM, plastid outer envelope membrane; PA, phosphatidic acid; PAP, phosphatidic acid phosphatase; PC, phosphatidylcholine; PDCT, phosphatidylcholine:diacylglycerol cholinephosphotransferase; PE, phosphatidylethanolamine; PG, phosphatidylglycerol; PI, phosphatidylinositol; PLC, phospholipase C; TGD, trigalactosyldiacylglycerol (lipid transporter protein). OT, optimal day/night temperatures, 23/15°C; HT-1, high temperature treatment-1, 33/25°C; HT-2, high temperature treatment-2, 38/30°C
Apart from the alterations in the activity of desaturase enzymes, another method by which plants modulate membrane unsaturation levels in response to temperature stress is through adjusting the flux of acyl lipid metabolism between chloroplast and ER in the cytosol, via channeling of DAG/PA moieties with specific acyl-chain compositions [28, 56, 57]. In plants, the assembly of glycerolipids occurs in both plastids (prokaryotic pathway) and the ER (eukaryotic pathway) [46]. The substrate specificity of plastid and ER lipid-metabolizing enzymes permits only C16 fatty acids at the sn-2 position of plastid-derived glycerolipids and only C18 fatty acids at the sn-2 position of ER-derived glycerolipids [46, 51, 58]. Since the ER-derived sn-1 16:0 is not a substrate of plastid desaturases, further desaturation of this acyl chain does not occur in lipids in plastids. Thus, the eukaryotic pathway can result in lipids with a lower level of unsaturation than the prokaryotic pathway, e.g., eukaryotic C34:3 (16:0/18:3) vs. prokaryotic C34:6 (18:3/16:3). Therefore, to reduce the potential of fatty acid desaturation in chloroplast under high-temperature conditions, plants may suppress the input of the prokaryotic pathway (e.g., decreased formation of C34:6) and enhance the channeling of eukaryotic lipids (e.g., C34:3) to the chloroplast [28]. Supporting this mechanism, Li et al. [28] found an increase in C34 MGDG and DGDG lipids that have ER-derived DAG/PA moieties along with decreases in 34:6 and 36:6 lipids of both head groups under high-temperature conditions in A. thaliana and A. lentiformis. The same trends were observed in rapeseed (B. napus; same genus as that of Avanza 641), except that MGDG(36:6) showed an increase, which would be expected if the ratio of eukaryotic to prokaryotic lipid assembly was increased [57]. In the present study, it appears that Avanza 641 employed similar lipid channeling mechanism to remodel its lipidome in response to high temperature stress, and this mechanism was most evident for DGDG where 34:6 and 36:6 lipids significantly decreased and 34:3 significantly increased (Fig. 4). Furthermore, less unsaturated DGDG species that likely contain a C18 at the sn-2 position also increased (e.g., 34:2, 34:1, and 36:3) (Fig. 4).
We observed that although not statistically significant, both PC(34:3) and PE(34:3) decreased under high temperatures, whereas PA(34:3) significantly increased (Fig. 5). Relating these observations with an increase in C34 DGDG lipids, decrease in C36 counterparts, and increase in C34 and C36 PA lipids under high temperatures (Supplementary Fig. S2, Additional file 2) suggest a temperature-induced lipid pathway adjustments in plants. It could be that the C34:3 lipids from the eukaryotic pathway entering DGDG are derived ultimately from PC, with PA serving as a mode of transportation to shuttle the glycerolipid moiety into the chloroplast lipids. Li et al. [28] also observed the same C34 increase in PA that we observed and confirmed that the C34 glycerolipid moiety entering MGDG and DGDG through PA has a composition of 16:0/C18 (sn-1/sn-2), which significantly contributed to reducing the unsaturation levels of both head-groups. Thus, further studies can confirm whether the same glycerolipid moieties are getting channeled into the chloroplasts of Avanza 641 for lowering unsaturation levels of chloroplast membrane lipids.
The metabolic pathways that might have led to the alterations in the leaf lipidome of B. carinata in response to high-temperature stress are summarized in the following text within the broader context of plant lipid metabolism and are presented in Fig. 7. Briefly, fatty acids are synthesized in plastids where they can either become incorporated into plastidic lipids or exported to the ER and incorporated into extraplastidic lipids. In the ER, fatty acids attached to PC can return to the acyl-CoA pool via the Lands cycle; be transferred to DAG lipids by shuffling of acyl groups by CDP-choline:diacylglycerol choline phosphotransferase (DAG-CPT) or phosphatidylcholine:diacylglycerol cholinephosphotransferase (PDCT), removal of the entire phosphoryl head group via phospholipase C (PLC), removal of the PC head-group by phospholipase D (PLD) producing PA followed by removal of the remaining phosphate by phosphatidic acid phosphatase (PAP), or incorporation of modified fatty acids from the acyl-CoA pool into DAG through the Kennedy pathway; or be transferred to PE lipids by first converting to DAG lipids as previously mentioned followed by transfer of an ethanolamine head-group by CDP-ethanolamine:diacylglycerol cholinephosphotranserase (DAG-EPT) [59, 60]. Multiprotein transporter complexes consisting of trigalactosyldiacylglycerol (TGD) proteins 1 through 5 transport the ER-assembled lipids into the outer envelope membrane (OEM) (TGD4/5) and inner envelope membrane (IEM) (TGD1/2/3) of plastids in a unidirectional manner [61,62,63,64,65,66,67,68,69]. The ER-assembled PA translocated to the plastid membranes via the TGD complex can be dephosphorylated by phosphatidic acid phosphatase (PAP) to yield DAG, which is a precursor for galactolipids [52, 70]. Both eukaryotic and prokaryotic DAG species are galactosylated to form MGDG by monogalactosyldiacylglycerol synthase 1 (MGD1) localized at the IEM of plastid. MGDG could then be converted to DGDG by digalactosyldiacylglycerol synthase 1 (DGD1) [71]. Fatty acids esterified to glycerolipids in the plastid and ER can undergo desaturation by desaturases (FADs). Plants can modulate the level of unsaturation of membrane lipids by adjusting the activity of FADs. Under high-temperature stress, plants may respond by decreasing the activity of FAD3, FAD7, and/or FAD8 enzymes that catalyze the formation of the highly unsaturated linolenic (18:3) acid and/or increasing the activity of FAD2 and/or fatty acid biosynthesis enzymes that catalyze the formation of the less unsaturated linoleic (18:2) acid or the saturated palmitic acid (16:0), respectively. Plants can also suppress their prokaryotic pathway while enhancing their eukaryotic pathway. This promotes the channeling of less unsaturated ER-derived glycerolipids as a relatively quick means to lower unsaturation levels of chloroplast membrane lipids. Both lipid remodeling traits were observed in Avanza 641 (Fig. 7).
Conclusions
High-temperature treatments (33/25 and 38/30°C) significantly affected the growth and development of Avanza 641 and caused alterations in the leaf lipidome. The lipid alterations appear to be acclimation mechanisms to maintain optimal membrane fluidity under high-temperature conditions. The remodeling of leaf lipidome was primarily manifested in terms of decreases in unsaturation levels of membrane lipids. The possible mechanisms that led to reductions in the lipid unsaturation levels were: (1) decreases in lipids containing highly unsaturated 18:3 fatty acids; (2) increases in lipids containing less unsaturated fatty acids such as 18:2 and 18:1 and/or saturated fatty acids such as 16:0; and (3) increase in the channeling of specific eukaryotic pathway-derived lipids to the chloroplast.
With the recent availability of B. carinata genotypes with varying levels of thermotolerance, it is now possible to compare within the species the magnitude of acclimation changes in their lipidomes and related enzyme activities to identify lipid-related biomarkers for heat tolerance. Further studies that compare the lipidomes of different tissue types or the changes in the lipidome under different spatio-temporal environments would provide additional insight necessary for improving carinata’s heat tolerance. Lastly, comparative studies that leverage the existing body of work in other Brassica species such as canola or rapeseed (B.napus L.) could potentially identify stable biomarkers applicable to the entire genus.
Methods
Plant material and growth conditions
The plant material used in this study was a released variety of B. carinata, named Avanza 641 (seeds were obtained from Dr. Ramdeo Seepaul at the University of Florida; original seed source was Agrisoma Biosiences Inc., Quebec, Canada; no permissions were necessary to collect seed samples). It is a current commercial cultivar (not transgenic) in the southeastern United States. This cultivar is classified as heat-sensitive in early-season vegetative growth and moderately heat-sensitive during the seed germination stage using seed vitality traits [25].
All plant experiments were performed in accordance with relevant guidelines and regulations. Plants were grown under sunlit-controlled environmental conditions known as the Soil-Plant-Atmosphere-Research (SPAR) chambers at Mississippi State University, Starkville, MS [72]. Each SPAR chamber has a soil bin (1 m deep x 2 m long x 0.5 m wide) to hold the belowground parts of the plants and a Plexiglas chamber (2.5 m tall x 2 m long x 1.5 m wide) for the aboveground parts. The Plexiglas permits 97 % of the visible solar radiation and does not discriminate within the visible light spectrum (400–700 nm). Daylength in the SPAR chambers for the duration of the study varied from 12.56 to 14.17 h.
Seeds of Avanza 641 were sown on 7 June 2018 in polyvinyl chloride (PVC) pots (15.24 cm diameter, 30.48 cm height, and 5.5 L volume) filled with a 3:1 (v/v) soil: sand mixture. Pots were filled with pure sand (particle size less than 0.3 mm) with 500 g of gravel at the bottom of each pot, inserted into the soil bin filled with sand so that the top of the pot aligns with the top portion of the soil bin. Five seeds were sown in each pot, but thinning was performed one week after seedling emergence to maintain only one plant per pot. Thus, nine pots (replications), each containing one plant, were maintained in each of the three SPAR chambers used in the study. The plants/pots were arranged in three rows with 0.66-m row spacing and nine plants m− 2.
To ensure that the plants did not experience any water stress, pots were irrigated with full-strength Hoagland nutrient solution [73] through an automated drip irrigation system, one dripper per pot with each dripper emitting 50 ml min− 1. The amount of irrigation delivered was 120 % of the measured previous day’s evapotranspiration [72], split into three times during the day. Seedlings in all SPAR chambers were initially grown under optimal temperatures (OT; 23/15°C day max/night min) until 8 days after sowing. After that, one of the three temperature treatments [OT, high-temperature treatment-1 (HT-1; 33/25°C), and high-temperature treatment-2 (HT-2; 38/30°C)] were randomly assigned to each of the three SPAR chambers. The optimal and high-temperature regimes were chosen based on Persaud [25] and Boote et al. [74]. Persaud [25] found that 22/14°C serves as optimal temperature for carinata during early season growth and development and significant heat damage will start at 27/19°C. Boote et al. [74] reported the cardinal temperatures for various growth and development processes of carinata; the optimal temperatures were generally around 25 °C and ceiling temperatures were generally ≥ 35 °C. Air temperature in each SPAR unit was monitored and adjusted every 10 s throughout the day and night and maintained within set points ± 0.5 °C by passing conditioned air through the plant canopy with sufficient velocity to cause leaf flutter (4.7 km h− 1) and was returned to the air-handling unit just above the soil level. Chilled ethylene glycol was supplied to the cooling system via several parallel solenoid valves that opened or closed depending on the cooling requirement. To fine-tune the air temperature, two electrical resistance heaters provided short pulses of heat as needed. The CO2 concentration [CO2] in each SPAR unit was monitored and adjusted every 10 s throughout the day and maintained at 420 ± 10 ppm using a dedicated LI-6250 CO2 analyzer (LI-COR, Inc., Lincoln, NE). The chamber air temperature, [CO2], and pot watering in each SPAR unit as well as continuous monitoring of environmental and plant gas exchange variables were controlled by a dedicated computer system [72]. The daytime temperature was initiated at sunrise and returned to the night-time temperature 1 h after sunset. The temperature treatment period lasted until the final harvest on 29 August 2018 (84 days after sowing).
The relative humidity of each chamber was monitored with a sensor (HMV 70Y, Vaisala, Inc., San Jose, CA) installed in the returning path of airline ducts. The mean day and night vapor pressure deficits in the units estimated from these measurements as per Murray [75] were 0.65 ± 0.01 kPa at OT, 0.97 ± 0.04 kPa at HT-1, and 1.12 ± 0.05 kPa at HT-2 during temperature treatment period.
Plants were grown under ambient light conditions. During the experiment, incoming daily solar radiation (285–2800 nm) outside of the SPAR units was measured with a pyranometer (Model 4–8; The Eppley Laboratory Inc., Newport, RI) and ranged from 4.40 to 34.25 MJ m− 2 d− 1 with an average of 22.54 ± 14.40 MJ m− 2 d− 1. Variable density shade cloths, designed to simulate canopy spectral properties and placed around the edges of the plant canopy, were adjusted regularly to match canopy height and to eliminate the need for border plants.
Measurement of growth traits
Plant height was measured as the distance between the soil surface and the apical meristem at the final harvest (84 days after sowing). The number of pods per plant was counted on all plants at the final harvest. The whole plant leaf area was measured using a LI-3100 leaf-area meter (LI-COR, Inc., Lincoln, NE) at the time of final harvest. Only green and yellow leaves were used for leaf area measurement. Dried leaves were not used for leaf area measurements but were saved for measuring leaf dry weight. At harvest, the soil medium with a root system from each pot was placed on fine mesh screens and washed thoroughly using a gentle stream of water to collect roots. Plant component parts, leaves, stems, pods and roots, were oven-dried at 75 °C until a constant weight was achieved. All growth traits were measured on nine plants (replications) per temperature treatment.
Leaf lipid extraction
Leaf discs (~ 0.5 g) were collected at 74 days after sowing (i.e., on the 66th day of the temperature treatment period) between the hours of 10:00 and 11:00. Leaf discs were collected from the 3rd fully mature leaf from the top from five plants (replications) per temperature treatment. Leaf disc collection and lipid extraction were carried out as previously described [76]. Briefly, ten leaf discs per plant were quickly acquired using a no. 3 cork borer and transferred immediately to 6 ml of pre-heated (75 °C for 15 min) isopropanol containing 0.01 % butylated hydroxytoluene (BHT) in a 50- ml glass tube. After adding leaf discs, the tubes were again kept at 75 °C for 15 min to deactivate lipid-hydrolyzing enzymes. The solvent with leaf discs was cooled to room temperature, 3 ml of chloroform and 1.2 ml of distilled water were added to the solvent, and the sample tubes were stored at -20 °C until further processing.
Further lipid extraction was carried out by shaking the leaf discs on an orbital shaker for 1 h at room temperature. The solvent in each tube was transferred with a Pasteur pipette to a new tube, leaving behind the leaf discs. To the leaf discs, 4 ml of chloroform: methanol (2:1) with 0.01 % BHT was added and left on an orbital shaker overnight at room temperature. The following day, the solvent in each tube was transferred with a Pasteur pipette to the tube that contained the initial solvent transferred on the previous day. The three steps: addition of 4 ml chloroform: methanol (2:1) with 0.01 % BHT, shaking overnight at room temperature, and transfer of the solvent were repeated four more times until the leaf discs appeared white. A nitrogen evaporator was used to evaporate the solvent accumulated from the previous steps. Then, the dried lipid extract in each tube was dissolved in 1 ml of chloroform and transferred to a 2-ml clear glass vial with a Teflon-lined screw cap, which was stored at -80 °C until ready for shipment to the Kansas Lipidomics Research Center. Samples were prepared for shipment by evaporating the chloroform. Thereafter, the samples were packed with bubble wrap for protection and shipped with dry ice. Leaf discs were oven-dried at 105 °C overnight, cooled to room temperature, and weighed to five decimal places to express lipid content on a dry weight basis.
Lipidomics analysis conducted with a triple quadrupole mass spectrometer
Lipid extracts were prepared in chloroform with appropriate internal standards. Electrospray ionization-triple quadrupole mass spectrometry (Applied Biosystems API 4000) was used to detect lipids [29, 77]. Lipid molecular species were identified using either precursor or neutral loss scanning and quantified using internal standards for each head-group class. A quality-control (QC) pool was created by combining aliquots from all samples. Identical samples made from this QC pool were analyzed recurrently among the experimental samples, which allowed calculating the coefficient of variation (CoV) for each lipid analyte. Lipid levels were quantified as normalized intensity per milligrams of leaf dry weight, where a value of one is the intensity of 1 nmol of internal standard. A correction factor of 2.8 was applied to the galactolipids to correct the higher response of unsaturated lipids than the saturated internal standards. Lipid analytes that were either below the limit of detection (intensity corresponding to 0.002 nmol) or had a CoV value greater than 0.3 were excluded from further analysis.
Unsaturation index calculation
Lipids with fatty acid chains containing double bonds are considered unsaturated, and the unsaturation index can represent their degree of unsaturation. This index for a lipid molecular species is the average number of double bonds per acyl chain, which is calculated as followed:
For a lipid head-group class, the unsaturation index was calculated as previously described [29]:
Data analysis
The experimental design was a completely randomized design. The GLIMMIX procedure in SAS (Version 9.4, SAS Institute) was used to analyze variance and estimate least-squares means and standard errors. Replication was considered as a RANDOM effect. The LSMEANS option in the GLIMMIX procedure was used to separate least-squares means based on Fisher’s least significant difference (LSD) test at α = 0.05. Principal component analysis (PCA) was conducted in MetaboAnalyst 5.0 (metaboanalyst.ca) [78, 79].
Availability of data and materials
All lipid data generated or analyzed in this study are included in this published article and its Supplementary Table S1, Additional file 1.
Change history
06 October 2021
A Correction to this paper has been published: https://doi.org/10.1186/s12870-021-03210-3
Abbreviations
- DAG-CPT:
-
CDP-choline:diacylglycerol cholinephosphotransferase
- DAG-EPT:
-
CDP-ethanolamine:diacylglycerol cholinephosphotranserase
- DGD1:
-
Digalactosyldiacylglycerol synthase 1
- DGDG:
-
Digalactosyldiacylglycerol
- ER:
-
Endoplasmic reticulum
- ESI-MS/MS:
-
Electrospray ionization-triple quadrupole mass spectrometry
- FAD:
-
Fatty acid desaturase
- IEM:
-
Inner envelope membrane
- MGD1:
-
Monogalactosyldiacylglycerol synthase 1
- MGDG:
-
Monogalactosyldiacylglycerol
- OEM:
-
Outer envelope membrane
- PA:
-
Phosphatidic acid
- PAP:
-
Phosphatidic acid phosphatase
- PC:
-
Phosphatidylcholine
- PDCT:
-
Phosphatidylcholine:diacylglycerol cholinephosphotransferase
- PE:
-
Phosphatidylethanolamine
- PG:
-
Phosphatidylglycerol
- PI:
-
Phosphatidylinositol
- PLC:
-
Phospholipase C
- PLD:
-
Phospholipase D
- SPAR:
-
Soil-plant-atmosphere-research chamber
- TGD1-5:
-
Trigalactosyldiacylglycerol proteins 1-5
References
Christ B, Bartels W-L, Broughton D, Seepaul R, Geller D. In pursuit of a homegrown biofuel: Navigating systems of partnership, stakeholder knowledge, and adoption of Brassica carinata in the Southeast United States. Energy Res Soc Sci. 2020;70:101665.
Gesch RW, Isbell TA, Oblath EA, Allen BL, Archer DW, Brown J, et al. Comparison of several Brassica species in the north central U.S. for potential jet fuel feedstock. Industr Crops Prod. 2015;75:2–7.
Gesch RW, Long DS, Palmquist D, Allen BL, Archer DW, Brown J, et al. Agronomic performance of Brassicaceae oilseeds in multiple environments across the Western USA. Bioenerg Res. 2019;12:509–23.
Hossain Z, Johnson EN, Wang L, Blackshaw RE, Gan Y. Comparative analysis of oil and protein content and seed yield of five Brassicaceae oilseeds on the Canadian prairie. Industr Crops Prod. 2019;136:77–86.
Marillia E-F, Francis T, Falk KC, Smith M, Taylor DC. Palliser’s promise: Brassica carinata, An emerging western Canadian crop for delivery of new bio-industrial oil feedstocks. Biocatalysis Agricult Biotechnol. 2014;3:65–74.
Shi R, Archer DW, Pokharel K, Pearlson MN, Lewis KC, Ukaew S, et al. Analysis of renewable jet from oilseed feedstocks replacing fallow in the U.S. Northern Great Plains. ACS Sustain Chem Eng. 2019;7:18753–64.
Tiwari R, Reinhardt Piskáčková TA, Devkota P, Mulvaney MJ, Ferrell JA, Leon RG. Growing winter Brassica carinata as part of a diversified crop rotation for integrated weed management. GCB Bioenergy. 2021;13:425–35.
Bouaid A, Diaz Y, Martinez M, Aracil J. Pilot plant studies of biodiesel production using Brassica carinata as raw material. Catalysis Today. 2005;106:193–196.
Cardone M, Mazzoncini M, Menini S, Rocco V, Senatore A, Seggiani M, et al. Brassica carinata as an alternative oil crop for the production of biodiesel in Italy: agronomic evaluation, fuel production by transesterification and characterization. Biomass Bioenergy. 2003;25:623–36.
Bhan S. Effect of soil moisture and nitrogen on mustard under Gangetic alluvium of Utter Pradesh. Indian J Agronomy. 1979;24:180–6.
Jadhav A, Katavic V, Marillia E-F, Michael Giblin E, Barton DL, Kumar A, et al. Increased levels of erucic acid in Brassica carinata by co-suppression and antisense repression of the endogenous FAD2 gene. Metab Eng. 2005;7:215–20.
Alemayehu N, Becker H. Genotypic diversity and patterns of variation in a germplasm material of Ethiopian mustard (Brassica carinata A. Braun). Genetic Res Crop Evol. 2002;49:573–82.
Medhin TG, Mulatu B. Insect Pests of Noug, Linseed and Brassica. Addis Abeba: Paper presented at: First National Oilseeds Workshop; 1992.
Singh D. Genetic improvement in Ethiopian mustard (Brassica carinata A. Braun) vis a vis Indian mustard (Brassica juncea L. Czern and Coss). Copenhagen: Paper presented at: Proceedings of 11th International Rapeseed Conference; 2003.
Taylor DC, Falk KC, Palmer CD, Hammerlindl J, Babic V, Mietkiewska E, et al. emopenBrassica carinataemclose – a new molecular farming platform for delivering bio-industrial oil feedstocks: case studies of genetic modifications to improve very long-chain fatty acid and oil content in seeds. Biofuels Bioprod Biorefin. 2010;4:538–61.
Seepaul DDR, George S, Wright JG. Drought tolerance classification of common oilseed species using seed germination assay. J Oilseed Brassica. 2019;10:97–105.
Márquez-Lema A, Fernández‐Martínez JM, Pérez‐Vich B, Velasco L. Transgressive segregation for reduced glucosinolate content in Brassica carinata A. Braun. Plant Breed. 2006;125:400–2.
Márquez-Lema A, Fernández-Martínez JM, Pérez-Vich B, Velasco L. Development and characterisation of a Brassica carinata inbred line incorporating genes for low glucosinolate content from B. juncea. Euphytica. 2008;164:365–75.
Xin H, Yu P. Rumen degradation, intestinal and total digestion characteristics and metabolizable protein supply of carinata meal (a non-conventional feed resource) in comparison with canola meal. Anim Feed Sci Tech. 2014;191:106–10.
Márquez-Lema A, Fernández‐Martínez JM, Pérez‐Vich B, Velasco L. Inheritance of very high glucosinolate content in Ethiopian mustard seeds. Plant Breed. 2009;128:278–81.
Seepaul R, George S, Wright DL. Comparative response of Brassica carinata and B. napus vegetative growth, development and photosynthesis to nitrogen nutrition. Industr Crops Prod. 2016;94:872–83.
Seepaul R, Marois J, Small I, George S, Wright DL. Optimizing swathing and chemical desiccant timing to accelerate winter carinata maturation. Agronomy J. 2018;110:1379–89.
Seepaul R, Marois J, Small IM, George S, Wright DL. Carinata Dry matter accumulation and nutrient uptake responses to nitrogen fertilization. Agronomy J. 2019;111:2038–46.
Seepaul R, Small IM, Marois J, George S, Wright DL. Brassica carinata and brassica napus growth, nitrogen use, seed, and oil productivity constrained by post-bolting nitrogen deficiency. Crop Sci. 2019;59(6):2720–32.
Persaud L. Thermotolerance classification of emopenBrassica carinataemclose genotypes using germination assay and vegetative growth parameters [dissertation on the internet]. Starkville: Mississippi State University; 2020. Available from: https://ir.library.msstate.edu/handle/11668/16679. [cited 1 Mar 2021].
Djanaguiraman M, Perumal R, Jagadish SVK, Ciampitti IA, Welti R, Prasad PVV. Sensitivity of sorghum pollen and pistil to high-temperature stress. Plant Cell Environ. 2018;41:1065–82.
Larkindale J, Huang B. Changes of lipid composition and saturation level in leaves and roots for heat-stressed and heat-acclimated creeping bentgrass (Agrostis stolonifera). Environ Exp Bot. 2004;51:57–67.
Li Q, Zheng Q, Shen W, Cram D, Fowler DB, Wei Y, et al. Understanding the biochemical basis of temperature-induced lipid pathway adjustments in plants. Plant Cell. 2015;27:86–103.
Narayanan S, Tamura PJ, Roth MR, Prasad PVV, Welti R. Wheat leaf lipids during heat stress: I. High day and night temperatures result in major lipid alterations. Plant Cell Environ. 2016;39:787–803.
Narayanan S, Zoong-Lwe ZS, Gandhi N, Welti R, Fallen B, Smith JR, et al. Comparative lipidomic analysis reveals heat stress responses of two soybean genotypes differing in temperature sensitivity. Plants. 2020;9:457.
Narayanan S. Membrane fluidity and compositional changes in response to high temperature stress in wheat. In: Wani SH, Mohan A, Singh GP, editors. Physiological, molecular, and genetic perspectives of wheat improvement. Switzerland: Springer Nature; 2021. p. 115–23.
Zoong Lwe ZS, Welti R, Anco D, Naveed S, Rustgi S, Narayanan S. Heat stress elicits remodeling in the anther lipidome of peanut. Sci Rep. 2020;10:22163.
Zheng G, Tian B, Zhang F, Tao F, Li W. Plant adaptation to frequent alterations between high and low temperatures: remodelling of membrane lipids and maintenance of unsaturation levels. Plant Cell Environ. 2011;34:1431–42.
Kang L, Wang YS, Uppalapati SR, Wang K, Tang Y, Vadapalli V, et al. Overexpression of a fatty acid amide hydrolase compromises innate immunity in Arabidopsis. Plant J. 2008;56:336–49.
Kilaru A, Herrfurth C, Keereetaweep J, Hornung E, Venables BJ, Feussner I, et al. Lipoxygenase-mediated oxidation of polyunsaturated N-acylethanolamines in Arabidopsis. J Biol Chem. 2011;286:15205–14.
Markham JE, Lynch DV, Napier JA, Dunn TM, Cahoon EB. Plant sphingolipids: function follows form. Curr Opin Plant Biol. 2013;16:350–7.
Wang X. Lipid signaling. Curr Opin Plant Biol. 2004;7:329–36.
Wang X, Devaiah SP, Zhang W, Welti R. Signaling functions of phosphatidic acid. Prog Lipid Res. 2006;45:250–78.
Zhou L, Yan T, Chen X, Li Z, Wu D, Hua S, et al. Effect of high night temperature on storage lipids and transcriptome changes in developing seeds of oilseed rape. J Exp Bot. 2018;69:1721–33.
Reddy KR, Reddy VR, Hodges HF. Effects of temperature on early season cotton growth and development. Agronomy J. 1992;84:229–37.
Reddy KR, Hodges HF, McKinion JM, Wall GW. Temperature effects on Pima cotton growth and development. Agronomy J. 1992;84:237–43.
Polowick PL, Sawhney VK. High temperature induced male and female sterility in canola (Brassica napus L.). Ann Bot. 1998;62:83–6.
Young LW, Wilen RW, Bonham-Smith PC. High temperature stress of Brassica napus during flowering reduces micro- and megagametophyte fertility, induces fruit abortion, and disrupts seed production. J Exp Bot. 2004;55:485–95.
Browse J, Somerville C. Glycerolipid synthesis: biochemistry and regulation. Annu Rev Plant Physiol Plant Mol Biol. 1991;42:467–506.
Heinz E, Roughan PG. Similarities and differences in lipid metabolism of chloroplasts isolated from 18:3 and 16:3 plants. Plant Physiol. 1983;72:273–9.
Ohlrogge J, Browse J. Lipid biosynthesis. Plant Cell. 1995;7:957–70.
Williams JP, Khan MU. Lipid biosynthesis in Brassica napus leaves: I. 14 C-labelling kinetics of the fatty acids of the major glycerolipids. Biochim Biophy Acta Lipids Lipid Metab. 1982;713:177–84.
Narayanan S, Prasad PVV, Welti R. Alterations in wheat pollen lipidome during high day and night temperature stress. Plant Cell Environ. 2018;41:1749–61.
Falcone DL, Ogas JP, Somerville CR. Regulation of membrane fatty acid composition by temperature in mutants of Arabidopsis with alterations in membrane lipid composition. BMC Plant Biol. 2004;4:17.
Murakami Y, Tsuyama M, Kobayashi Y, Kodama H, Iba K. Trienoic fatty acids and plant tolerance of high temperature. Science. 2000;287:476–9.
Kunst L, Browse J, Somerville C. Altered regulation of lipid biosynthesis in a mutant of Arabidopsis deficient in chloroplast glycerol-3-phosphate acyltransferase activity. Proc Natl Acad Sci U S A. 1988;85:4143–7.
Wang Z, Xu C, Benning C. TGD4 involved in endoplasmic reticulum-to-chloroplast lipid trafficking is a phosphatidic acid binding protein. Plant J. 2012;70:614–23.
Benning C. Mechanisms of lipid transport involved in organelle biogenesis in plant cells. Annu Rev Cell Dev Biol. 2009;25:71–91.
Li-Beisson Y, Shorrosh B, Beisson F, Andersson MX, Arondel V, Bates PD, et al. Acyl-Lipid Metabolism. In: Chang C, Graham I, Last R, Leyser O, McClung R, Weinig C, et al., editors. The Arabidopsis Book. Rockville: The American Society of Plant Biologists; 2013:e0161. https://doi.org/10.1199/tab.0161.
Higashi Y, Saito K. Lipidomic studies of membrane glycerolipids in plant leaves under heat stress. Prog Lipid Res. 2019;75:100990.
Chen J, Burke JJ, Xin Z, Xu C, Velten J. Characterization of the Arabidopsis thermosensitive mutant atts02 reveals an important role for galactolipids in thermotolerance. Plant Cell Environ. 2006;29:1437–48.
Johnson G, Williams JP. Effect of growth temperature on the biosynthesis of chloroplastic galactosyldiacylglycerol molecular species in Brassica napus leaves. Plant Physiol. 1989;91:924–9.
Browse J, Warwick N, Somerville CR, Slack CR. Fluxes through the prokaryotic and eukaryotic pathways of lipid synthesis in the “16:3” plant Arabidopsis thaliana. Biochem J. 1986;235:25–31.
Bates PD. Understanding the control of acyl flux through the lipid metabolic network of plant oil biosynthesis. Biochim Biophys Acta. 2016;1861:1214–25.
Hu Z, Ren Z, Lu C. The phosphatidylcholine diacylglycerol cholinephosphotransferase is required for efficient hydroxy fatty acid accumulation in transgenic Arabidopsis. Plant Physiol. 2012;158:1944–54.
Awai K, Xu C, Tamot B, Benning C. A phosphatidic acid-binding protein of the chloroplast inner envelope membrane involved in lipid trafficking. Proc Natl Acad Sci U S A. 2006;103:10817–22.
Fan J, Zhai Z, Yan C, Xu C. Arabidopsis TRIGALACTOSYLDIACYLGLYCEROL5 interacts with TGD1, TGD2, and TGD4 to facilitate lipid transfer from the endoplasmic reticulum to plastids. Plant Cell. 2015;27:2941–55.
Lu B, Benning C. A 25-amino acid sequence of the Arabidopsis TGD2 protein is sufficient for specific binding of phosphatidic acid. J Biol Chem. 2009;284:17420–7.
Lu B, Xu C, Awai K, Jones AD, Benning C. A small ATPase protein of Arabidopsis, TGD3, involved in chloroplast lipid import. J Biol Chem. 2007;282:35945–53.
Roston R, Gao J, Xu C, Benning C. Arabidopsis chloroplast lipid transport protein TGD2 disrupts membranes and is part of a large complex. Plant J. 2011;66:759–69.
Roston RL, Gao J, Murcha MW, Whelan J, Benning C. TGD1, -2, and – 3 proteins involved in lipid trafficking form ATP-binding cassette (ABC) transporter with multiple substrate-binding proteins. J Biol Chem. 2012;287:21406–15.
Xu C, Fan J, Froehlich JE, Awai K, Benning C. Mutation of the TGD1 chloroplast envelope protein affects phosphatidate metabolism in Arabidopsis. Plant Cell. 2005;17:3094–110.
Xu C, Fan J, Riekhof W, Froehlich JE, Benning C. A permease-like protein involved in ER to thylakoid lipid transfer in Arabidopsis. EMBO J. 2003;22:2370–9.
Xu C, Moellering ER, Muthan B, Fan J, Benning C. Lipid transport mediated by Arabidopsis TGD proteins is unidirectional from the endoplasmic reticulum to the plastid. Plant Cell Physiol. 2010;51:1019–28.
Nakamura Y, Tsuchiya M, Ohta H. Plastidic phosphatidic acid phosphatases identified in a distinct subfamily of lipid phosphate phosphatases with prokaryotic origin. J Biol Chem. 2007;282:29013–21.
Lavell AA, Benning C. Cellular organization and regulation of plant glycerolipid metabolism. Plant & Cellular Physiol. 2019;60:1176–1883.
Reddy K, Hodges HF, Read J, McKinion JM, Baker J, Tarpley L, et al. Soil-Plant-Atmosphere-Research (SPAR) facility: A tool for plant research and modeling. Biotronics. 2001;30:27–50.
Hoagland DR, Arnon DI. The water-culture method for growing plants without soil. California Agricult Exp Station. 1950;347:4–32.
Boote KJ, Seepaul R, Mulvaney MJ, Hagan AK, Bashyal M, George S, et al. Adapting the CROPGRO model to simulate growth and production of Brassica carinata, a bio-fuel crop. GCB-Bioenergy. 2021;00:1–15.
Murray FW. On the computation of saturation vapor pressure. J Appl Meteorol. 1967;6:203–4.
Welti R, Li W, Li M, Sang Y, Biesiada H, Zhou H-E, et al. Profiling Membrane Lipids in plant stress responses: Role of phospholipase dα in freezing-induced lipid changes in arabidopsis. J Biol Chem. 2002;277:31994–32002.
Xiao S, Gao W, Chen Q-F, Chan S-W, Zheng S-X, Ma J, et al. Overexpression of Arabidopsis Acyl-CoA Binding Protein ACBP3 promotes starvation-induced and age-dependent leaf senescence. Plant Cell. 2010;22:1463–82.
Chong J, Soufan O, Li C, Caraus I, Li S, Bourque G, et al. MetaboAnalyst 4.0: towards more transparent and integrative metabolomics analysis. Nucleic Acids Res. 2018;46:W486-94.
Xia J, Psychogios N, Young N, Wishart DS. MetaboAnalyst: a web server for metabolomic data analysis and interpretation. Nucleic Acids Res. 2009;37:W652-60.
Acknowledgements
We thank David Brand for technical assistance and graduate students at the Environmental Plant Physiology Laboratory for their help during data collection. We thank Dr. Ramdeo Seepaul, University of Florida for arranging the carinata seed used in the experiment. We thank Dr. Ruth Welti, Kansas State University for the critical review of the manuscript. Lipid analysis was performed at the Kansas Lipidomics Research Center (KLRC). Instrument acquisition and method development at KLRC was supported by NSF grants MCB 0455318 and 0920663 and DBI 0521587, and NSF EPSCoR grant EPS-0236913 with matching support from the State of Kansas through Kansas Technology Enterprise Corporation and Kansas State University. The KLRC is also supported by K-INBRE (NIH Grant P20 RR16475 from the INBRE program of the National Center for Research Resources).
Funding
This work was partially supported by the National Institute for Food and Agriculture, NIFA 2019-34263-30552, and MIS 043050. The funders had no role in the design of the study and collection, analysis, and interpretation of data and writing the manuscript.
Author information
Authors and Affiliations
Contributions
ZZL: conceptualization, data curation, formal analysis, methodology, visualization, and writing – original draft & editing; SN: conceptualization, supervision, validation, methodology, and writing – review & editing; KRR: conceptualization, supervision, funding, review & editing; SS and LP: data collection and review; WG: funding and review; and JL: review and editing. All authors have read and approved the manuscript.
Corresponding authors
Ethics declarations
Ethics approval and consent to participate
Brassica carinata cultivar Avanza 641 was used in this study. Avanza 641 is not a transgenic variety. Seeds were obtained from Dr. Ramdeo Seepaul at the University of Florida. The original seed source was Agrisoma Biosiences Inc., Quebec, Canada; no permissions were necessary to collect seed samples. All plant experiments were performed in accordance with relevant guidelines and regulations.
Consent for publication
Not applicable.
Competing interests
The authors declare that they have no competing interests.
Additional information
Publisher’s Note
Springer Nature remains neutral with regard to jurisdictional claims in published maps and institutional affiliations.
The original online version of this article was revised: author has found a minor typesetting error in Figure 6. The correction does not have any effect on the results or conclusions of the paper. The original article has been corrected.
Supplementary Information
Additional file 1: Table S1.
Data on 105 lipid analytes as normalized intensity per milligrams of leaf dry weight. Table S2. Analysis of variance results on the effects of temperature treatments on lipid head-group unsaturation indices, lipid molecular species, and levels of head-group class sub-pools.
Additional file 2: Figure S1.
Principal component analysis (PCA) scores plot revealing distinguishable lipid profiles among the temperature treatments. Figure S2.Changes in the levels of digalactosyldiacylglycerol (DGDG) and phosphatidic acid (PA) sub-pools in Avanza 641 leaves in response to high temperature stress.
Rights and permissions
Open Access This article is licensed under a Creative Commons Attribution 4.0 International License, which permits use, sharing, adaptation, distribution and reproduction in any medium or format, as long as you give appropriate credit to the original author(s) and the source, provide a link to the Creative Commons licence, and indicate if changes were made. The images or other third party material in this article are included in the article's Creative Commons licence, unless indicated otherwise in a credit line to the material. If material is not included in the article's Creative Commons licence and your intended use is not permitted by statutory regulation or exceeds the permitted use, you will need to obtain permission directly from the copyright holder. To view a copy of this licence, visit http://creativecommons.org/licenses/by/4.0/. The Creative Commons Public Domain Dedication waiver (http://creativecommons.org/publicdomain/zero/1.0/) applies to the data made available in this article, unless otherwise stated in a credit line to the data.
About this article

Cite this article
Zoong Lwe, Z., Sah, S., Persaud, L. et al. Alterations in the leaf lipidome of Brassica carinata under high-temperature stress. BMC Plant Biol 21, 404 (2021). https://doi.org/10.1186/s12870-021-03189-x
Received:
Accepted:
Published:
DOI: https://doi.org/10.1186/s12870-021-03189-x