
Abstract
Background
Molecular research revealed that some of the European Calypogeia species described on the basis of morphological criteria are genetically heterogeneous and, in fact, are species complexes. DNA barcoding is already commonly used for correct identification of difficult to determine species, to disclose cryptic species, or detecting new taxa. Among liverworts, some DNA fragments, recommend as universal plant DNA barcodes, cause problems in amplification. Super-barcoding based on genomic data, makes new opportunities in a species identification.
Results
On the basis of 22 individuals, representing 10 Calypogeia species, plastid genome was tested as a super-barcode. It is not effective in 100%, nonetheless its success of species discrimination (95.45%) is still conspicuous. It is not excluded that the above outcome may have been upset by cryptic speciation in C. suecica, as our results indicate. Having the sequences of entire plastomes of European Calypogeia species, we also discovered that the ndhB and ndhH genes and the trnT-trnL spacer identify species in 100%.
Conclusions
This study shows that even if a super-barcoding is not effective in 100%, this method does not close the door to a traditional single- or multi-locus barcoding. Moreover, it avoids many complication resulting from the need to amplify selected DNA fragments. It seems that a good solution for species discrimination is a development of so-called “specific barcodes” for a given taxonomic group, based on plastome data.
Background
The genus Calypogeia Raddi is one of the four genera of the family Calypogeiaceae H. Arnell belonging to liverworts (Marchantiophyta). Liverworts are one of three divisions (besides mosses and hornworts) of plants known as bryophytes, and comprise about 7, 000 species in the world [1]. Liverworts are organisms that played a key role in land plants evolution. As fossil evidence suggests liverworts were among the first land plants and present on land approximately 475 million years ago [2,3,4]. The hypothesis, that liverworts are one of the earliest-diverging group of land plants is supported by phylogenetic analyses based on large molecular data sets [5,6,7,8]. The family Calypogeiaceae forms one of the youngest clade of leafy liverworts (subclass Jungermannidae) with divergence time estimated at ca. 50 million years [9]. The genus Calypogeia is the only genus of this family occurring in Europe. It comprise over 90 described species [10, 11]. However, the highest species diversity of the genus was recorded in the tropics [12]. In the Holarctis, species richness of Calypogeia is much lower and represented by only 9–13 species in its different parts. In Europe, there are only nine species of Calypogeia: C. azurea Stotler & Crotz, C. integristipula Steph., C. neesiana (Massal.& Carestia) M üll. Frib., C. suecica (Arnell & J.Perss.) M üll. Frib., C. muelleriana (Schiffn.) M üll. Frib., C. sphagnicola (Arnell & J.Perss.) Warnst. & Loeske, C. fissa (L.) Raddi, C. arguta Nees & Mont. and C. azorica Bischl., which is endemic for Islands of Macaronesia [13, 14]. Some of the species e.g. C. azurea, C. suecica, C. sphagnicola, C. integristipula, C. neesiana have wider distribution in northern hemisphere, and are reported from North America, Europe and Asia [15,16,17].
In liverworts, the dominant phase of the life cycle is the haploid gametophyte. The simple gametophyte morphology provides a limited number of diagnostic features therefore liverworts are, taxonomically, a difficult group. For these reasons, identification of species, genera/subgenera classification as well as phylogenetic analysis based only on morphological characteristics is difficult and often ambiguous [18].
Rapidly developing molecular biology and bioinformatics gives the possibility of widespread use of DNA sequences in taxonomic studies. DNA barcoding proposed by Hebert et al. [19], is already commonly used for correct identification of difficult to determine species, to reveal cryptic species, or detecting new taxa [20,21,22]. Unfortunately, it was not possible to select universal single- locus barcode for plants, that would be sufficient to distinguish in closely related taxa. Thus, two-locus combination (rbcL + matK) was recommended as the best plant barcode by CBOL Plant Working Group [23]. However, not in all plant groups, especially in liverworts, this combination works well with universal primers due to difficulties with amplification of the matK locus [24, 25]. High-throughput sequencing technology offers new opportunities for using genomic data in the study of biological diversity of various plant species – super- barcoding [26, 27]. Thus, the plastid super- barcode is a whole- plastid genome sequence using in plant identification, particularly in situations, when single- or multi- locus barcodes fail. The whole plastid genomes and nuclear rRNA cluster were proved to be highly useful for distinguishing closely related species [28,29,30], varieties and individual genotypes [31] or cryptic species [32]. Recently, the whole plastid and mitochondrial genomes have been increasingly used in the phylogenetic analysis at different taxonomic levels [33,34,35,36,37]. The analysis of complete genome sequences is the way to detect parts of the genome, which have optimal variation for individual group of plants and can act as specific barcodes [38]. Although one of the first chloroplast genome was sequenced from liverwort Marchantia paleacea Bertol. almost 30 years ago [39], the number of liverwort species with complete genomes, compared to vascular plants, currently available in databases is still very scarce. Until now, whole plastid genomes have been sequenced for 21 liverwort genera and for 23 species [40].
Only a few species of the Calypogeia genus were analyzed at molecular level to date. Isozyme and molecular markers revealed that some of the European Calypogeia species described on the basis of morphological criteria are genetically heterogeneous and, in fact, are species complexes that consist of previously unrecognized species, e.g. C. fissa [41], C. muelleriana [42, 43], C. sphagnicola [44]. Studies based on isozyme polymorphism, cytology and flow cytometry indicate that hybridization and genome duplication are important processes of speciation in the Calypogeia genus [45, 46]. The comparative analysis of complete mitogenomes of four Calypogeia species revealed unexpected losses of introns [47], showing that molecular resources of liverworts are still unexplored. The molecular studies of the genus concerned the selected species and were based on the small fragments of chloroplast genome [44].
In the present study we: i) established and characterized the organization of the complete chloroplast genome sequence of European Calypogeia species; ii) identified and evaluated the various DNA barcodes for Calypogeia species iii) analysed the phylogenetic relationships between European species of the genus Calypogeia.
Results
Structure and sequence variation of the Calypogeia plastid genome
Plastid genome of Calypogeia is a circular molecule consisted of typical regions for land plants: a large single copy (LSC) ranging from 82, 377 bp in C. arguta to 83, 289 bp in C. muelleriana, a small single copy (SSC) ranging from 19, 933 bp to 20, 016 bp in C. arguta and two inverted repeat regions (IRs) in the range from 8, 236 bp in C. muelleriana to 8, 674 bp in C. azorica (Fig.1). One hundred twenty-two unique genes (taking into account only one copy of inverted repeat regions) were identified in the plastome of Calypogeia: 81 protein-coding genes, four ribosomal RNAs, 31 transfer RNAs and six ycf genes of an indeterminate function. One gene of ycf family (ycf68) in IR region was annotated as a pseudogene (marked with Ѱ in Fig.1). In the whole chloroplast genome of Calypogeia 20 introns have been identified. Ten protein-coding genes: rps12, ndhA, ndhB, rpl2, rpl16, rpoC1, ycf66, atpF, petB, petD and six transfer RNAs: trnI-GAU, trnA-UGC, trnV-UAC, trnL-UAA, trnK-UUU, trnG-UCC contained a single intron, while clpP and ycf3 harbored two introns. The base composition of cpDNA (chloroplast DNA) was the following: A (32.3%), C (17.6%), G (17.7%), T (32.3%) with an overall GC content at the level of 34.6%.

Gene map of the Calypogeia muelleriana chloroplast genome. Genes inside and outside the outer circle are transcribed in counterclockwise and clockwise directions, respectively. The genes are color-coded based on their function. The dashed area in the inner circle visualizes the G/C content. Pseudogenes have been marked with Ѱ
The chloroplast genome length of Calypogeia genus ranged from 119, 628 bp in C. arguta to 120, 170 bp in C. muelleriana (Table S1). The alignment of 22 specimens representing 10 Calypogeia species was 122, 472 bp in length and its pair identity was 95.6%. Sequence variability was caused by the presence of SNP and indels, but the number of SNPs was predominant. In coding and non-coding regions of plastome 737 indels and 15, 666 SNPs were identified, of which over 36% were nonsynonymous (Fig. 2., S2, S3). The percent of polymorphic sites (P%) for plastome of Calypogeia was 13.67%, while a mean value of π was 0.035076.

SNP and indel variation among plastomes of Calypogeia. Track A shows nonsynonymous SNP occurrence within genes. Track B and C represent identified SNPs (small blue dots) and indels (small orange dots) per 100 bp window size (maximum value = 40). Line plot, comprising B and C track, represents SNPs (blue line) and indels (orange line) within each exon, intron or intergenic spacer (snp max. Value = 400, indel max. Value = 100). Track D represents percent of SNPs per CDS length (maximum value = 22) while track E represents percent of indels per CDS length (maximum value = 2). Track F represents percent of SNPs per noncoding region length (max. Value = 30) while track G represents percent of indels per noncoding region length (max value = 20)
Analysis of genetic variability within plastome of Calypogeia revealed that the most variable protein-coding region with length over 100 bp was cysT gene (Table 1, S2), not related to photosynthesis. It was characterized with 20.65% of polymorphic sites (P%) and π = 0.07389. This 867 bp long region contained 15 indels and as many as 164 SNPs, where 92 of them were nonsynonymous. The second, fourth and fifth most variable protein-coding regions were the genes belonging to the ycf family with an undefined function: ycf2, ycf66 and ycf1 respectively. The percent of polymorphic sites for these genes ranged from 17.54 to 20.17 (π = 0.04912–0.07282). The third high position in the ranking of the most variable protein-coding regions took the matK gene with 218 SNPs and one indel (P% = 19.89, π = 0.05696) (Table 1, Table S2). The mentioned genes: cysT, matK, ycf1, ycf2 genes correctly distinguished as many as 21 out 22 sequences by assigning them to the appropriate species, whereas discriminatory power of the ycf66 gene was slightly lower and was 90.9% (Table 1.). The percent of polymorphic sites (P%) for protein-coding sequences ranged from 2.5 to 20.65, while π value stretched from 0.00474 to 0.07389 (Table S2).
Among non-coding regions longer than 100 bp the highest variability was present in rpl14-rpl16 spacer (121 bp, P% = 29.75, π = 0.12371). In this region 30 SNPs and 6 indels were identified. The second most polymorphic region, between rpl32 and cysT genes, had 28.93% of polymorphic sites and π = 0.09156. The slightly less variable non-coding region was atpH-atpF spacer with the P% value at the level 28.89% and π = 0.11377 (Table S3). However, all of them as well as fragments being among the top ten most non-coding regions did not distinguish the tested species.
The most polymorphic 500 bp-long nucleotide fragments of plastome, determined artificially without considering their biological function, had a variability similar to non-coding regions. The percent of polymorphic sites for 13 most mutable fragments stretched between 26.4–30.6%, whereas π value for the same fragments ranged from 0.07332 to 0.09668 (Table S4). All these fragments belonged to the ycf2 gene and properly discriminated 20–21 out of 22 sequences, classifying them to the appropriate Calypogeia species (Table 1). On the other hand, 10 most polymorphic 500 bp fragments, taking into account only the nucleotide diversity (π = 0.1533–0.23231), were present within psbA-ycf2 spacer that correctly assigned 20 out of 22 sequences to the appropriate Calypogeia species.
Phylogeny
The alignment of the set of chloroplast CDS was used to construct the phylogenetic tree (Fig. 3). Trees based on the whole plastomes and amino acid sequences were very similar to each other and to the CDS-based phylogram (Fig. S1). The analysis inferred from the partitioned chloroplast CDS dataset clearly distinguished almost all species of liverworts with strong branch support. All duplicate Calypogeia species are correctly paired on the phylogenetic tree. The most separated species from other Calypogeia species on the phylogenetic tree is C. arguta, as expected. Still the most interesting is the position of C. suecica which is grouped with C. sphagnicola. Even more importantly the distance between the C. suecica species pair is by far the greatest of all Calypogeia pairs which may suggest that the two C. suecica species are in fact two distinct species.
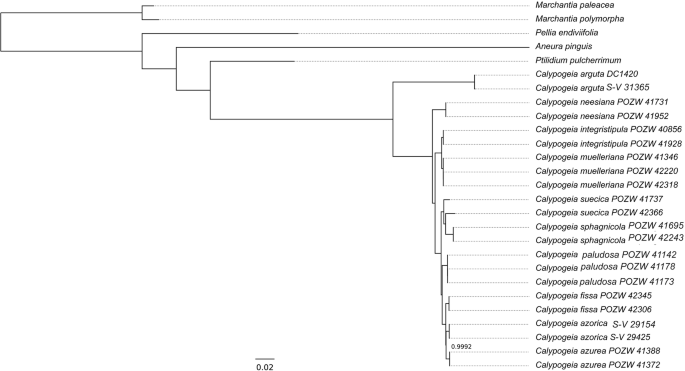
CDS-based phylogram derived from a Bayesian analysis. The posterior probability value lower than 1 is given at the node
Species delimitation
The Poisson Tree Processes (PTP) analysis grouped 22 Calypogeia individuals into 11 species, what exceed the number of species used in this study by one. The PTP analysis classified two specimens of C. suecica as two different species. The support for species division was pretty high and was ranged from 0.922 (for C. arguta) to 1.00 (for C. suecica) (Table 2). The above results are reflected in phylogenetic trees (Fig. 3, Fig. S1), where representatives of each species are grouped together belonging to the same clade, while individuals of C. suecica are separated from each other and form a shared clade with C. sphagnicola. Pairwise identity for two plastomes of C. suecica reached the value of 97.7%, whereas in other species was between 99.6% (for C. neesiana) and 99.99% (for C. fissa).
The chloroplast genomes of all species differed from each other. The strongest differences occurred between C. arguta and other Calypogeia species (Fig. 3, Fig. S1), where the average interspecific distance was 0.121079 and the number of fixed nucleotide differences ranged from 11, 329 (between C. arguta and C. suecica) to 12, 414 (between C. arguta and C. sphagnicola). The largest number of indels distinguishing species was 687 and occurred between C. arguta and C. azorica. The most similar species turned out to be C. muelleriana and C. integristipula differing only in 412 SNPs and 428 indels. However, these differences were sufficient to identify the aforementioned species as showed both in Spider and Species Identifier analyzes (Fig. 4a-f, Table 1.). According to these programs whole chloroplast genomes of Calypogeia species can be used as a super- barcode with a success of 95.45%. Spider analysis demonstrated that only a plastome of C. suecica cannot be employed as a super- barcode. For one specimen of this species there existed no barcoding gap (Fig. 5.). Similarly, Species Identifier revealed that one specimen of C. suecica was incorrectly identified and mistaken for C. paludosa. However, the analysis of the most variable DNA coding fragments showed that there was one gene which sequence allowed for proper species identification of all analyzed plastome sequences, namely the ndhB gene (Table 1.). Among 10 most variable protein-coding sequences, seven genes allowed to correctly match to the species over 95% of analyzed sequences (Table 1.). The non-coding plastome sequences of Calypogeia were less effective. Only ndhB intron properly identified 21 out of 22 analyzed sequences and eight other non-coding fragments correctly assigned to the species over 90% of studied sequences (Table 1).
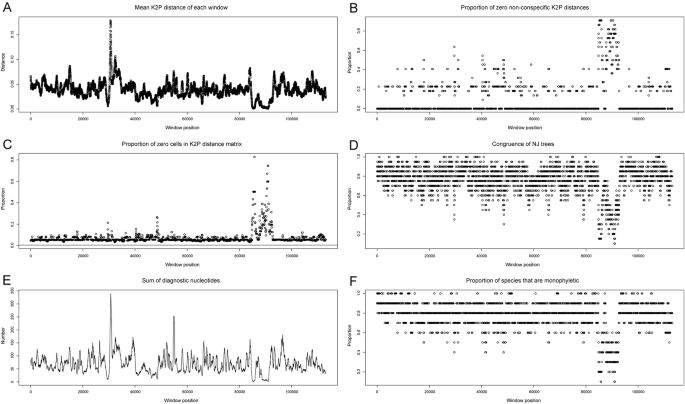
Results of several analyzes across the plastome sequences of Calypogeia sp. using the sliding window method. a- the plot of the mean Kimura 2-parameter distance matrix for each 500 bp- long window. The greatest one is at about 30, 000 bp position and the lowest one at the 90, 000 bp position. b- the proportion of zero non- conspecific distances, which find their maximum at around 90, 000 bp. c- the proportion of zero cells in the distance matrix. This is maximized around 90, 000 bp. The unbroken horizontal line crossing the y-axis at 0 is the proportion of zero cells in the distance matrix created from the full dataset. d- the proportion of clades that are identical between the windows and the full dataset. It is pretty high at most windows and visibly low at around 90, 000 bp position. e- the sum of diagnostic nucleotide positions for all species. The most of these nucleotides are at around 30, 000 bp position and the least at around 90, 000 bp position. f- the proportion of species that are monophyletic. The position around 90, 000 bp is clearly in the doldrums, but most positions distinguish species pretty well.

Lineplot of the barcode gap for the 22 Calypogeia species. For each individual in the dataset, the grey lines represent the furthest intraspecific distance (bottom of line value), and the closest interspecific distance (top of line value). The red lines show where this relationship is reversed (no barcoding gap)
The analysis of sliding window also revealed high discrimination power of the studied species set, albeit lower than in the case of protein-coding sequences (Table 1). Out of 10 the most variable 500 bp-long fragments two correctly identified 21 sequences, while among the 10 most variable protein coding regions as many as eight allowed to properly distinguish 21 out of 22 sequences. All the 10 most variable 500 bp-long chloroplast DNA pieces belonged to the fragment of the ycf2 gene. Within the 18 most polymorphic fragments generated by sliding window analysis, only two represented other regions of plastid DNA: a fragment of the ycf1 gene and a fragment of the psbA-ycf2 spacer. These results are also graphically presented in the Spider charts (Fig.4a-f), which indicate that the best chloroplast region for creating barcodes is around 30, 000 bp position, occupied by the ycf2 gene.
Testing the usefulness of plant barcodes appearing in literature, we confirmed high efficiency of these DNA fragments in discrimination of Calypogeia species (discrimination power between 81.81–100%; Table S5). The sequences of ndhH gene and trnT-trnL spacer properly identified analyzed species in 100%.
Discussion
Comparative plastid genomics
Sequencing of plastid genomes of liverworts is gaining ground. Today, in the GenBank database the complete plastome sequences of five complex thalloid liverworts can be found, three of simple thalloid liverworts and 14 plastomes of leafy liverworts. Here we present 22 newly sequenced chloroplast genomes of 10 Calypogeia species (leafy liverworts). The structure of the above plastomes was typical for most plants and was divided into two IRs regions separated by LSC and SSC regions (Fig. 1.). The length of chloroplast genomes seems to be variable not only at the genus level, but also at the species and even at the individual level. Plastome of Calypogeia is 824–1, 366 bp shorter than the longest known leafy liverwort chloroplast genome of Gymnomitrion concinnatum [48] and 1, 880–2, 422 bp shorter than the longest known thalloid liverwort chloroplast genome of Dumortiera hirsuta [49]. Calypogeia species also varied in plastid genome length similarily to Aneura pinguis cryptic species [32]. Moreover, it was observed that plastome lengths differ within one species (Table S1). Similar event was recorded in the case of Marchantia polymorpha subsp. ruderalis, for which two independent research team obtained two different chloroplast genome lengths: 120, 457 bp [50] and 120, 304 bp [51].
The GC content of Calypogeia plastome is 34.6% and is almost the same like in Gymnomitrion concinnatum (34.5%), the leafy liverwort species for which the complete chloroplast genome was sequenced most recently [48]. The GC content in Calypogeia plastid genome falls in the range of values known for other liverwort species, from 28.8% for Marchantia paleacea [39] to 40.6% for Aneura mirabilis [52].
The comparative analysis of three known leafy liverwort plastomes (Ptilidium pulcherrimum, Gymnomitrion concinnatum and sequenced here Calypogeia sp.), revealed similarity in the gene content and order. All of them contain 122 unique genes: 81 protein-coding, 6 of unknown function (ycf), 31 tRNAs and 4 rRNAs. However, in Ptilidium pulcherrimum cysA (in LSC region) and cysT (in SSC region) are pseudogenes [53], whereas in the chloroplast genomes of Calypogeia and Gymnomitrion concinnatum as well as in complex thalloid liverworts (Marchantia paleacea, Marchantia polymorpha, Dumortiera hirsuta), these genes are functional. The ycf68 motif that has been annotated as a pseudogene in Calypogeia plastid genome. In other liverwort species is also registered as a nonfunctional gene (e.g. Aneura mirabilis, Gymnomitrion concinnatum) or skipped in the plastome description (e.g. Pellia endiviifolia, Aneura pinguis, Dumortiera hirsuta, Marchantia sp.). On the other hand, Forrest et al. [53] are confused about the functionality of the hypothetical ycf68 gene in Ptilidium pulcherrimum. In many vascular plants the above mentioned motif is reported, however as functional gene only in several lineages: Stipa sp. [28], Lolium multiflorum, Festuca pratensis [54]. Raubeson et al. [55] suggested that ycf68 could be a pseudogene, but the occurrence of RNA editing in chloroplast genomes of many plants may result in restoring of fully worked gene.
Phylogenetic relationships
The phylogenetic relationships between studied Calypogeia species obtained on the basis of the whole chloroplast genomes analysis are, in general, consistent with previous studies of the genus Calypogeia [56]. The whole plastome genomes analysis confirmed a close relationship of C. muelleriana and C. integristipula (Fig. 3.). Previous studies [41, 46] revealed that C. muelleriana is an allopolyploid, while C. integristipula is a haploid species, thus it can be assumed that C. integristipula was one of C. muelleriana parents who was the donor of its chloroplast genome. C. sphagnicola and C. paludosa, which originally were considered as the forms of C. sphagnicola i.e. C. sphagnicola f. sphagnicola and C. sphagnicola f. paludosa [57, 58] belong to two different clades, which support the hypothesis that they represent genetically distinct species [44]. Calypogeia sphagnicola belongs to the same clade as C. suecica (both haploid species), while allopoliploid species C. paludosa forms its own distinct clade, which is a sister to clade containing C. azurea, C. azorica and C. fissa. Moreover, our studies revealed a high variation of C. suecica, indicating the cryptic speciation within this species. C. suecica is an obligate xylicole, it is almost restricted to moist decorticated logs and shows low morphological variability [57]. However, in Europe two cytoforms of C. suecica n = 9 and n = 18 are reported by Lorbeer [59] and Paton [60] respectively, which may support the hypothesis that an unrecognized species is present within C. suecica. Our results indicate that C. suecica requires further molecular and morphological studies.
Hot-spots and DNA barcoding
Analysis of the variability of the whole liverwort chloroplast or mitochondrial genomes rarely appears in studies. Hitherto, this type of analysis was carried out only among cryptic species of Aneura pinguis [32]. Therefore our results, obtained for a group of species belonging to one genus, are difficult to compare with the outcomes for the complex species of A. pinguis.
The research results for A. pinguis have shown that among protein coding regions genes ycf1 and ycf2 are ones of the most variable genes [32]. Similarly, in our studies on Calypogeia, the ycf genes: ycf1, ycf2, ycf66 were in the top five of the most variable coding regions, what predisposes them to be a potential DNA barcodes. In the past few years, it is more and more often reported about the usefulness of the ycf1 and ycf2 genes in the identification of plant species [29, 61,62,63]. Especially two regions of the ycf1 gene: ycf1a and ycf1b are highly variable and can serve as an effective barcode for land plants. Ycf1b fragment is proven to work better than any of the matK, rbcL and trnH-psbA applied individually and slightly better than the combination of matK and rbcL in woody plants [64]. On the other hand, the application of the ycf1a fragment in the discrimination of Paris species was more effective than the using only the ycf1b gene piece [65]. Nevertheless, a discrimination success of the ycf1b fragment (about 72%) in research by Dong and others [64] and the ycf1a gene piece both separately (52.63%) and in a combination with the ycf1b (89.47%) [65] was smaller than an application of the entire ycf1 gene sequence in our studies for Calypogeia species (over 95%). However, wanting to use ycf1 and ycf2 genes as barcodes, one should keep in mind the limitations of these sequences in an amplification. The above mentioned genes are quite long (e.g. ycf1–3, 147 bp and ycf2–6, 216 bp in Calypogeia) and recovering the entire sequences of these genes in a PCR reaction would be a challenge. Not without reason Dong et al. [64] applied as barcodes for woody plants only the most variable and with the biggest resolution power the ycf1 fragments. Our results indicated the most promising ycf2 500 bp-long fragments for Calypogeia species delimitation. As many as the first 13 positions in the list of the most-variable fragments of Calypogeia plastome with a length of 500 bp were taken by fragments of the ycf2 gene (Table 1) and could be potential DNA barcodes. The discriminatory power of the 10 most-variable protein- coding regions in genus Calypogeia was in the most cases at the high level of 95.45% (Table 1). Only the resolution power for ndhB, ycf66 and rpoC2 genes had different values: 100, 90.9 and 90.9%, respectively. While the ndhB gene rather occurs commonly in plant chloroplast genomes, the ycf66 gene not necessarily. A presence of this ycf gene was not reported in Aneura mirabilis [52] and Aneura pinguis [32]. Similarly, an occurrence of the cysT gene, the most variable protein- coding sequence in Calypogeia, is changeable in liverworts. The aforementioned gene is lacking, for example, in Ptilidium pulcherrimum [53] and Aneura species [32, 52]. CysT gene in above mentioned species functions as a pseudogene, therefore high variability is here justifiable [28]. Nevertheless, a literature does not mention the cysT and ycf66 genes as DNA barcodes. Also, no one has reported the ndhB gene as an effective plant barcode, but it seems to be one of the core sequence in a species discrimination in Calypogeia. On the other hand, Krawczyk et al. [28] pointed out the potential of the ndh gene family in species identification, indicating the ndhH gene as the best performing loci for Stipa. Although ndhH was not listed at the top of the most variable coding regions in Calypogeia chloroplast genome (and therefore not tested in our research), its discrimination power was 100%. Slightly less, however also quite effective in the species identification was the rpoC2 gene- reported to belong to the relatively fast evolving rpo genes [66]. The last statement was confirmed in our analyzes by the high polymorphism of this sequence (Table 1). Recently, reports on the rpoC2 gene as a barcode are more frequent [22, 67,68,69].
Consortium for the Barcode of Life (CBOL) Plant Working Group recommended two locus: rbcL and matK as core DNA barcodes for plants [23]. In our research the matK gene was the third on the list of coding regions with the highest variability and correctly identified 21 out of 22 sequences. Unfortunately, the matK gene is said to be troublesome in amplification among bryophytes and ferns [23, 70, 71]. Therefore, it is inconclusive whether the use of the matK gene in the identification of species can be extended to bryophytes [71]. In contrast to the above, the PCR success of the rbcL gene is reported to be high [23, 70, 71]. However, it is mediocre in its capacity to distinguish specimens at the species level [23]. Despite the fact that the rbcL gene was not among the most variable coding regions in Calypogeia, the discriminatory power of the rbcL gene (90.9%) was almost the same as that of matK gene (Table 1, Table S2). The high resolution power of the rbcL was also reported among species of bryophytes [21, 70, 71] as well as its potential as a barcoding marker for bryophytes was noticed by some researchers [25, 32, 72]. However, Stech and Quandt [73] state that in general for bryophytes the rbcL gene exhibits low variation at the family level and therefore it is not useful for DNA barcoding among the early land plants. In our tests, the application of a two-locus barcode rbcL + matK did not raise the discriminatory power which was the same as for the matK individually (Table 1).
Liu et al. [70] also mentioned rpoC1 and rps4 regions as good potential barcodes for mosses. Actually, the resolution success for these sequences in the case of Calypogeia was considerable (95.45%; Table S5).
Among non- coding regions the resolution success of 100% in genus Calypogeia gave the trnT-trnL spacer, previously tested in the tribe Stipeae [28, 74, 75]. However there, this spacer as a separate region was not variable enough to give satisfying results. In the literature the trnT-trnL spacer is not mentioned as a potential barcode in bryophytes (only as a phylogenetic marker [73] in contrast to the following regions: trnH-psbA [20, 70], atpF-atpH, psbK-psbI [76] and trnL-trnF [20, 73]. The trnH-psbA spacer is one of a recommended plant DNA barcodes by CBOL Plant Working Group [23]. However, in Calypogeia it is not informative like in the Solidago genus [77] because of its short length (only 131 bp). As a consequence, trnH-psbA is proposed to be used in two- or three-locus barcodes to provide acceptable resolution [77, 78].
Similarly, too short sequences for identification of Calypogeia species had the rest of the spacers proposed for bryophytes (71–288 bp). Moreover, it is questionable whether the sequences of the spacers: atpF-atpH and psbK-psbI could be obtained without problems in a PCR reaction. Low amplification rates of these regions were reported in mosses by Liu et al. [70]. On the other hand, the trnL-trnF spacer is reported to be a longer sequence in some liverwort species and amplified with high success [20, 71]. In the genus Calypogeia, trnL-trnF is only a 71 bp-long region. As a consequence we have tested at least 400 bp-long fragments of non- coding regions according to Hebert et al. [19] who reported that the standard barcode has a length of 400–800 bp. Theoretically, it is possible to apply shorter sequences as DNA barcodes, so- called mini- barcodes (100–250 bp) or even micro- barcodes (within 100 bp) [79, 80]. However, these types of barcodes are rather taxon specific than universal [81]. Currently, it is realistic to search the whole chloroplast genome to find the most informative fragments for species identification. Mini-barcodes for Calypogeia should be sought within the ycf2 gene or between the genes psbA and ycf2 as demonstrated sliding window analysis.
Our research shows that in Calypogeia plastome there is a lot of regions which has potential to be barcodes and best match/best close match analysis demonstrated that whole chloroplast genome can be used as a barcode. On the basis of the entire plastome data we revealed that a barcoding gap was present between most of the species. Only one individual was incorrectly identified based on entire plastome sequences as well as based on selected chloroplast regions, namely C. suecica. PTP analysis indicated two representatives of C. suecica as two separate species (Table 2.), which is in accordance with the results on variability of Calypogeia chloroplast genomes. Plastomes of two representatives of C. suecica were similar in 97.7%, what indicates quite significant differences taking into account that pairwise identity of all studied plastome sequences of the genus Calypogeia was 95.6%. This is probably due to the occurrence of cryptic speciation within C. suecica. However, three regions: the ndhB and ndhH genes and the trnT-trnL spacer coped very well with solving the riddle about genetic recognition of species (100% of the power discrimination).
The super-barcoding turned out in the case of studied liverwort genus to be slightly less effective (95.45% of the power discrimination) in comparison to a traditional barcoding approach (100% of the power discrimination). However, some of plastid regions with 100% efficiency are very long (ndhB- 1, 503 bp; ndhH-1, 182 bp) and the amplification of their whole, intact sequences could be problematic. On the other hand, using plastid genome as a marker solves the issues referring to low PCR efficiency or gene loss [82]. Li et al. [27] proposed a new approach to plant DNA barcoding (so-called “1 + 1 Model”) that combines super- and single- locus barcoding. This method consists in a development of the “specific barcode”, which is derived from chloroplast genome of the target plant group and so variable that lets species recognition. Testing 10 the most variable DNA fragments, we found the most specific barcodes for Calypogeia species among the protein- coding regions (Table 1). Seven genes correctly assigned 21 out of 22 sequences to the species, two loci (ycf66, rpoC2)- 20 out of 22 sequences and one locus (ndhB) identified rightly all individuals. Protein- coding regions were the least mutable in comparison to non- coding regions and fragments generated by the sliding window approach. The last method allowed to obtain the most variable plastid DNA pieces with length over 400 bp, but unfortunately its efficiency in species discrimination, similar to non- coding regions, was lower. Our results proved that a good barcode may be even a region with average variability like the ndhH gene taking the 51. position in the ranking of the most variable protein- coding regions in the genus Calypogeia.
Conclusion
In conclusion, complete plastid sequences applied as a super-barcode for Calypogeia are not effective in 100%, nonetheless their success of species discrimination (95.45%) is still conspicuous. The above outcome is probably a result of the cryptic speciation in C. suecica. Further studies are required to clear this issue. On the other hand, super- barcoding approach for species identification does not close the door to a traditional single- or multi- locus barcoding. Moreover, it avoids many complication resulting from the need to amplify selected DNA fragments. Having the sequences of entire plastomes of European Calypogeia species, we discovered that the ndhB and ndhH genes and the trnT-trnL spacer identify species in 100%. It seems that a good solution for species discrimination is a development of so- called “specific barcodes” for a given taxonomic group, based on plastome data.
Methods
Plant material
Plant material used in this study came from the following herbaria: Herbarium of Adam Mickiewicz University, Herbarium D.A. Callaghan and Herbarium Schäfer-Verwimp (Table S1). Twenty-two specimens stood for 10 taxa of Calypogeia: C. integristipula, C. suecica, C. fissa, C. sphagnicola, C. paludosa, C. muelleriana, C. azurea, C. arguta, C. azorica, C. neesiana. The total genomic DNA from two specimens of each European Calypogeia species were extracted using ZR Plant/Seed DNA MiniPrep™ kit (Zymo Research, Irvine, CA, USA). Only two species- C. paludosa and C. muelleriana were represented by three individuals. DNA quantity was estimated using Qubit fluorometer and Qubit™ dsDNA BR Assay Kit (Invitrogen, Carsbad, NM, USA).
Plastid genome sequencing, assembly and annotation
The genomic library was constructed with TruSeq Nano DNA kit (Illumina, San Diego, CA, USA) and was sequenced using HiSeqX (Illumina) to generate 150 bp paired-end reads at Macrogen Inc. (Seoul, Korea) with 350 bp insert size between paired-ends. Due to low amount of available plant material of an endemic to Azores C. azorica the genomic library had to be constructed using alternative kit which enables lower concentration of input DNA. Sequencing libraries of C. azorica were prepared using Qiagen FX library kit according to manufacturer protocol. After sequencing, reads were cleaned by removing the adaptor sequences and low-quality reads with Trimmomatic v0.36 [83]. The filtered reads were de novo assembled using Geneious R8 software [84]. Afterwards, to verify assembly results, the filtered reads were mapped to the reference chloroplast genome of Ptilidium pulcherrimum (sequence similarity set to 90%). Next contigs derived after mapping were iteratively mapped (sequence similarity set to 100%) until subsequent iterations did not result with sequence extension. The results of iterative mapping approach were consistent with de novo assembly. The above analyses were performed using Geneious R8 software [84].
Genes were identified and annotated based on the closest known chloroplast genomes: Aneura pinguis, Marchantia paleacea, Pellia endiviifolia, Ptilidium pulcherrimum. Predictions were made using Geneious R8 software [84] and the BLAST tool [85]. Annotated sequences of Calypogeia chloroplast genomes were submitted to GenBank with the accession numbers specified in Table S1. Circular genome map was created using the OGDraw software [86].
Variation analyzes
Twenty-two chloroplast genomes of 10 Calypogeia species were aligned using MAFFT genome aligner [87]. Afterwards based on alignment of plastomes polymorphism analysis was conducted separately for each protein- coding sequence, intron, intergenic spacer and for each 500 bp- long fragment generated by sliding window analysis. Every variation within aforementioned regions was identified as single nucleotide polymorphism (SNP) or insertion/deletion (indel) and counted using custom Phyton script. Each SNP within coding sequence was defined as synonymous or nonsynonymous substitution. Variations (SNPs and indels) were visualized using Circos software [88] combined with Python script. The nucleotide diversity (π) was calculated for each coding and noncoding region using Tassel 5.0 [89] and for each 500 bp-long fragment of plastom the π value was computed in Spider [90]. Because the nucleotide diversity is based only on substitutions, percent of polymorphic sites (P%) are given for each region (Table S2, S3, S4).
Phylogenetic analyzes
Phylogenetic analyses were performed using chloroplast genomes of 27 species: 22 of Calypogeia genus and 5 other known liverworts. Out of each plastome sequence CDS of 68 genes, common to all species, were extracted and translated into amino acid sequences. MAFFT software [87] was used to create three alignments: 27 CDS of 68 genes, 27 amino acid sequences of 68 genes and 27 whole plastome sequences. Next, with the use of PartitionFinder2 [91], the best partitioning schemes and corresponding substitution models of each alignment were estimated. Afterwards, based on the alignments and obtained models, Bayesian analysis was conducted using MrBayes 3.2.6 [92]. The MCMC algorithm was run for 5, 000, 000 generations (sampling every 500) with four incrementally heated chains (starting from random trees). The Tracer 1.7.1 [93] software was used to determine the number of generations needed to reach stationarity, which occurred at approximately 300,000 generations. Therefore, the first 600 trees were discarded as burn-in, and the remaining trees were used to develop a Bayesian consensus tree. Marchantia paleacea and Marchantia polymorpha were used as an outgroup in each of three obtained phylogenetic trees.
Species delimitation
The Poisson Tree Processes (PTP) method was applied to delimitate species boundaries [94]. The PTP model delimits species using the number of substitutions without the difficult and error prone procedures of time calibration. The fundamental assumption of this analysis is that the number of substitutions between species is significantly higher than the number of substitutions within species. The PTP model places the number of species in a set of query sequences into a specific branch of the reference phylogeny. So it only requires a phylogenetic input tree, for example the output of RAxML - the branch lengths should represent number of mutations. The analysis was performed using a rooted tree, the MCMC algorithm was run for 1,000,000 generations, with 100 thinning and 0.2 burn-in.
Comparative analysis of chloroplast genomes was carried out in DnaSP v6.12 [95] (number of fixed nucleotide differences), using custom PHP script (number of indels differing plastomes of particular species) and in Spider program [90] based on inter- and intraspecific distances that calculated using Kimura 2-parameter model (K2P) of nucleotide substitution [96].
Barcoding analyzes of entire Calypogeia plastomes and their 500 bp-long fragments generated by sliding window were made in Spider [90], whereas Best Match/Best Close Match analyzes were performed in Species Identifier 1.8 program from TAXON-DNA software package [97]. The threshold was set to 95% [97]. The latter analysis were carried out for both the whole chloroplast genomes and the most variable protein-coding and non-coding regions of Calypogeia plastome with length at least 400 bp in accordance with a definition of plant DNA barcode given by Hebert et al. [19]. We have also tested an usefulness of sequences that were recommended as barcodes by other researchers (Table S5).
Availability of data and materials
Supplementary data are available in Supporting Information. All Calypogeia plastomes are submitted to GenBank with their accession numbers given in Table S1.
Abbreviations
- CBOL:
-
Consortium for the Barcode of Life
- CDS:
-
Coding sequence
- cpDNA:
-
chloroplast DNA
- IR:
-
Inverted repeat region
- LSC:
-
Large single copy region
- SSC:
-
Small single copy region
- P% :
-
Percent of polymorphic sites
References
Crandal-Stotler B, Stotler RE, Long DG. Phylogeny and classification of the Marchantiophyta. Edinb J Bot. 2009;66(1):155–98. https://doi.org/10.1017/S0960428609005393.
Clarke JT, Warnock RCM, Donoghue PCJ. Establishing a time-scale for plant evolution. New Phytol. 2010;192:266–301. https://doi.org/10.1111/j.1469-8137.2011.03794.x.
Rubinstein CV, Gerrienne P, de la Puente GS, Astini RA, Steemans P. Early middle ordovician evidence for land plants in Argentina (eastern Gondwana). New Phytol. 2010;188(2):365–9. https://doi.org/10.1111/j.1469-8137.2010.03433.x.
Wellman CH, Osterloff PL, Mohiuddin U. Fragments of the earliest land plants. Nature. 2003;425:282–5. https://doi.org/10.1038/nature01884.
Bowman JL. Walkabout on the long branches of plant evolution. Curr Opin Plant Biol. 2013;16(1):70–7. https://doi.org/10.1016/j.pbi.2012.10.001.
Cox CJ, Li B, Foster PG, Embley TM, Civáň P. (2014). Conflicting phylogenies for early land plants are caused by composition biases among synonymous substitutions. Syst Biol. 2014;63:272–9. https://doi.org/10.1093/sysbio/syt109.
Edwards D, Morris JL, Richardson JB, Kenrick P. Cryptospores and cryptophytes reveal hidden diversity in early land floras. New Phytol. 2014;202:50–78. https://doi.org/10.1111/nph.12645.
Qiu YL, Li L, Wang B, Chen Z, Knoop V, Groth-Malonek M, et al. The deepest divergences in land plants inferred from phylogenomic evidence. Proc Natl Acad Sci. 2006;103(42):15511–6. https://doi.org/10.1073/pnas.0603335103.
Heinrichs J, Hentschel J, Wilson R, Feldberg K, Schneider H. Evolution of leafy liverworts (Jungermanniidae, Marchantiophyta): estimating divergence times from chloroplast DNA sequences using penalized likelihood with integrated fossil evidence. Taxon. 2007;56:31–44. https://doi.org/10.2307/25065733.
Schuster RM. The Hepaticae and Anthocerotae of North America east of the hundreth meridian, vol. 2. New York – London: Columbia University Press; 1969.
Söderström L, Hagborg A, Konrat M, Bartholomew-Began S, Bell D, Briscoe L. World checklist of hornworts and liverworts. PhytoKeys. 2016;59:1–829. https://doi.org/10.3897/phytokeys.59.6261 http://phytokeys.pensoft.net.
Bischler H. The genus Calypogeia Raddi in cCentral and South America. I- III. Candollea. 1963;18:19–128.
Söderström L, Urmi E, Váňa J. Distribution of Hepaticae and Anthocerotae in Europe and Macaronesia. Lindbergia. 2002;27(1):3–47. https://doi.org/10.2307/20150088.
Söderström L, Urmi E, Váňa J. The distribution of Hepaticae and Anthocerotae in Europe and Macaronesia – update 1-427. Cryptogam Bryol. 2007;28(4):299–350.
Inue H. Two new species of Calypogeia Raddi from Japan. Bull Natl Mus Nat and Sci Ser B Bot. 1975;1:135–40.
Konstantinova NA, Bakalin VA. Checklist of liverworts (Marchantiophyta) of Russia. Arctoa. 2009;18(1):1–64. https://doi.org/10.15298/arctoa.18.01.
Singh AP, Nath V. A new Calypogeia Raddi from India. Taiwania. 2007;52(4):320–3. https://doi.org/10.6165/tai.2007.52(4).320.
Schuster RM. Phylogenetic and taxonomic studies of Jungermanniidae, III. Calypogeiaceae. Fragmenta Floristica et Geobotanica. 1995;40:825–88.
Hebert PD, Cywinska A, Ball SL, de Waard JR. Biological identifications through DNA barcodes. Proc Biol Sci. 2003;270:313–21. https://doi.org/10.1098/rspb.2002.2218.
Bączkiewicz A, Szczecińska M, Sawicki J, Stebel A, Buczkowska K. DNA barcoding, ecology and geography of cryptic species of Aneura pinguis and their relationship with Aneura maxima and Aneura mirabilis (Metzgeriales, Marchantiophyta). PLoS One. 2017;12(12):e0188837. https://doi.org/10.1371/journal.pone.0188837.
Hollingsworth ML, Clark A, Forrest LL, Richardson J, Pennington RT, Long DG, et al. Selecting barcoding loci for plants: evaluation of seven candidate loci with species-level sampling in three divergent groups of land plants. Mol Ecol Resour. 2009;9:439–57. https://doi.org/10.1111/j.1755-0998.2008.02439.x.
Krawczyk K, Szczecińska M, Sawicki J. Evaluation of 11 single-locus and seven multilocus DNA barcodes in Lamium L. (Lamiaceae). Mol Ecol Resour. 2014;14(2):272–85. https://doi.org/10.1111/1755-0998.12175.
CBOL Plant Working Group, Hollingsworth PM, Forrest LL, Spouge JL, Hajibabaei M, Ratnasingham S, et al. A DNA barcode for land plants. Proc Natl Acad Sci U S A. 2009;106(31):12794–979. https://doi.org/10.1073/pnas.0905845106.
Bell D, Long DG, Forrest AD, Hollingsworth ML, Blom HH, Hollingsworth PM. DNA barcoding of European Herbertus (Marchantiopsida, Herbertaceae) and the discovery and description of a new species. Mol Ecol Resour. 2012;12(1):36–47. https://doi.org/10.1111/j.1755-0998.2011.03053.x.
Hassel K, Segreto R, Ekrem T. Restricted variation in plant barcoding markers limits identification in closely related bryophyte species. Mol Ecol Resour. 2013;13(6):1047–57. https://doi.org/10.1111/1755-0998.12074.
Dodsworth S. Genome skimming for next-generation biodiversity analysis. Trends Plant Sci. 2015;20:525–7. https://doi.org/10.1016/j.tplants.2015.06.012.
Li X, Yang Y, Henry RJ, Rossetto M, Wang Y, Chen S. Plant DNA barcoding: from gene to genome. Biol Rev Camb Philos Soc. 2015;90(1):157–66. https://doi.org/10.1111/brv.12104.
Krawczyk K, Nobis M, Myszczyński K, Klichowska E, Sawicki J. Plastid super-barcodes as a tool for species discrimination in feather grasses (Poaceae: Stipa). Sci Rep. 2018;8(1):1924. https://doi.org/10.1038/s41598-018-20399-w.
Szczecińska M, Sawicki J. Genomic resources of three Pulsatilla species reveal evolutionary hotspots, species-specific sites and variable plastid structure in the family Ranunculaceae. Int J Mol Sci. 2015:22258–79. https://doi.org/10.3390/ijms160922258.
Yang J-B, Yang S-X, Li H-T, Yang J, Li D-Z. Comparative chloroplast genomes of Camellia species. PLoS One. 2013;8(8):e73053. https://doi.org/10.1371/journal.pone.0073053.
Kane N, Sveinsson S, Dempewolf H, Yang JY, Zhang D, Engels JMM, et al. Ultra-barcoding in cacao (Theobroma spp.; Malvaceae) using whole chloroplast genomes and nuclear ribosomal DNA. Am J Bot. 2012;99:320–9. https://doi.org/10.3732/ajb.1100570.
Myszczyński K, Bączkiewicz A, Buczkowska K, Ślipiko M, Szczecińska M, Sawicki J. The extraordinary variation of the organellar genomes of the Aneura pinguis revealed advanced cryptic speciation of the early land plants. Sci Rep. 2017;7:9804. https://doi.org/10.1038/s41598-017-10434-7.
Sawicki J, Szczecińska M, Bednarek-Ochyra H, Ochyra R. Mitochondrial phylogenomics supports splitting the traditionally conceived genus Racomitrium (Bryophyta: Grimmiaceae). Nova Hedwigia. 2015;100:293–317. https://doi.org/10.1127/nova_hedwigia/2015/0248.
Sawicki J, Plášek V, Ochyra R, Szczecińska M, Ślipiko M, Myszczyński K, et al. Mitogenomic analyses support the recent division of the genus Orthotrichum (Orthotrichaceae, Bryophyta). Sci Rep. 2017;7(1):4408. https://doi.org/10.1038/s41598-017-04833-z.
Wang W-C, Chen S-Y, Zhang X-Z. Chloroplast genome evolution in Actinidiaceae: clpP loss, heterogenous divergence and phylogenomic practice. PLoS One. 2016;11(9):e0162324. https://doi.org/10.1371/journal.pone.0162324.
Zhang Y-J, Ma P-F, Li D-Z. High-throughput sequencing of six bamboo chloroplast genomes: phylogenetic implications for temperate woody bamboos (Poaceae: Bambusoideae). PLoS One. 2011;6(5):e20596. https://doi.org/10.1371/journal.pone.0020596.
Zhou T, Chen C, Wei Y, Chang Y, Bai G, Li Z, et al. Comparative transcriptome and chloroplast genome analyses of two related Dipteronia species. Front Plant Sci. 2016;7:1512. https://doi.org/10.3389/fpls.2016.01512.
Coissac E, Hollingsworth PM, Lavergne S, Taberlet P. From barcodes to genomes: extending the concept of DNA barcoding. Mol Ecol. 2016;25:1423–8. https://doi.org/10.1111/mec.13549.
Ohyama K, Fukuzawa H, Kohchi T, Shirai H, Sano T, Sano S, et al. Chloroplast gene organization deduced from complete sequence of liverwort Marchantia polymorpha chloroplast DNA. Nature. 1986;322:572–4.
NCBI. https://www.ncbi.nlm.nih.gov.
Buczkowska K. Genetic differentiation of Calypogeia fissa Raddi (Hepaticae Jungermanniales) in Poland. Plant Syst Evol. 2004;247:187–201. https://doi.org/10.1007/s00606-003-0156-9.
Buczkowska K, Bączkiewicz A. (2011). New taxon of the genus Calypogeia (Jungermanniales, Hepaticae) in Poland. Acta Soc Bot Pol. 2011;80:327–33. https://doi.org/10.5586/asbp.2011.039.
Buczkowska K, Dabert M. The development of species-specific SCAR markers for delimitation of Calypogeia species. J Bryol. 2011;33:291–9. https://doi.org/10.2478/v10119-011-0014-x.
Buczkowska K, Sawicki J, Szczecińska M, Klama H, Bączkiewicz A. Allopolyploid speciation of Calypogeia sphagnicola (Jungermanniopsiada, Calypogeiaceae) based on isozyme and DNA markers. Plant Syst Evol. 2012;298:549–60. https://doi.org/10.1007/s00606-011-0565-5.
Buczkowska K, Odrzykoski IJ, Chudzińska E. Delimitation of some European species of Calypogeia Raddi (Jungermnniales, Hepaticae) based on cytological characters and multienzyme phenotype. Nova Hedwigia. 2004;78:147–63. https://doi.org/10.2478/v10119-010-0004-4.
Buczkowska K, Hornik B, Czołpińska M. Two ploidy levels of genetically delimited groups of the Calypogeia fissa complex (Jungermanniopsida, Calypogeiaceae). Biodivers Conserv. 2015;39:1–6. https://doi.org/10.1515/biorc-2015-0022.
Ślipiko M, Myszczyński K, Buczkowska-Chmielewska K, Bączkiwicz A, Szczecińskais M, Sawicki J. Comparative analysis of four Calypogeia species revealed unexpected change in evolutionarily-stable liverwort mitogenomes. Genes. 2017;8(12):395. https://doi.org/10.3390/genes8120395.
Myszczyński K, Górski P, Ślipiko M, Sawicki J. Sequencing of organellar genomes of Gymnomitrion concinnatum (Jungermanniales) revealed the first exception in the structure and gene order of evolutionary stable liverworts mitogenomes. BMC Plant Biol. 2018;18(1):321. https://doi.org/10.1186/s12870-018-1558-0.
Kwon W, Kim Y, Park J. The complete chloroplast genome of Dumortiera hirsuta (Sw.) Nees (Marchntiophyta, Dumortieraceae). Mitochondrial DNA B. 2019;4(1):1586–7. https://doi.org/10.1080/23802359.2019.1596767.
Kijak H, Rurek M, Nowak W, Zielezinski A, Karlowski WM, Dabert M, Odrzykoski IJ. Resequencing Marchantia polymorpha chloroplast genome. Paper presented at EMBO Workshop, New Model systems for early plant evolution, Vienna, Austria, (2016, 22–24 June).
Bowman JL, Kohchi T, Yamato KT, Jenkins J, Shu S, Ishizaki K, et al. Insights into land plant evolution garnered from the Marchantia polymorpha genome. Cell. 2017;171(2):287–304. https://doi.org/10.1016/j.cell.2017.09.030.
Wickett NJ, Zhang Y, Hansen SK, Roper JM, Kuehl JV, Plock SA, et al. Functional gene losses occur with minimal size reduction in the plastid genome of the parasitic liverwort Aneura mirabilis. Miol Biol Evol. 2008;25(2):393–401. https://doi.org/10.1093/molbev/msm267.
Forrest LL, Wickett NJ, Cox CJ, Goffinet B. Deep sequencing of Ptilidium Ptilidiaceae suggests evolutionary stasis in liverwort plastid genome structure. Plant Ecol Evol. 2011;144(1):29–43. https://doi.org/10.5091/plecevo.2011.535.
Hand ML, Spangenberg GC, Forster JW, Cogan NO. Plastome sequence setermination and somparative snalysis for sembers of the Lolium-Festuca grass species complex. G3(Bethesda). 2013;3(4):607–16. https://doi.org/10.1534/g3.112.005264.
Raubeson LA, Peery R, Chumley TW, Dziubek C, Fourcade HM, Boore JL, et al. Comparative chloroplast genomics: analyses including new sequences from the angiosperms Nuphar advena and Ranunculus macranthus. BMC Genomics. 2007;8:174. https://doi.org/10.1186/1471-2164-8-174.
Buczkowska K, Bakalin V, Bączkiewicz A, Aguero B, Gonera P, Ślipiko M, et al. Does Calypogeia azurea (Calypogeiaceae, Marchantiophyta) occur outside Europe? Molecular and morphological evidence. PLoS One. 2018;13(10):e0204561. https://doi.org/10.1371/journal.pone.0204561.
Damsholt K. Illustrated flora of Nordic liverworts and hornworts. Nordic Bryological Society: Lund; 2002.
Szweykowski J. An annotated checklist of polish liverworts. Biodiversity of Poland. Kraków: W. Szafer Institute of Botany Polish Academy of Sciences; 2006.
Lorbeer G. Zytologie der Lebermoose mit besonderer Berücksichtigung allgemeiner Chromosomenfragen. I Teil Jahrb Wiss Bot. 1934;80:567–818.
Paton JA. The liverwort Flora of the British Isles. Devon: Harley Books; 1999.
Dong W, Liu J, Yu J, Wang I, Zhou S. Highly variable chloroplast markers for evaluating plant phylogeny at low taxonomic levels and for DNA barcoding. PLoS One. 2012;7(4):e35071. https://doi.org/10.1371/journal.pone.0035071.
Jiang GF, Hinsinger DD, Strijk JS. Comparison of interspecific and intergeneric chloroplast diversity in cycads. Sci Rep. 2016;6:31473. https://doi.org/10.1038/srep31473.
Yi DK, Choi K, Joo M, Yang JC, Mustafina FU, Han J-S, et al. The complete chloroplast genome sequence of Abies nephrolepis (Pinaceae: Abietoideae). J Asia Pac Biodivers. 2016;9(2):245–9. https://doi.org/10.1016/j.japb.2016.03.014.
Dong W, Xu C, Li C, Sun J, Zuo Y, Shi S, et al. ycf1, the most promising plastid DNA barcode of land plants. Sci Rep. 2015;5:8348. https://doi.org/10.1038/srep08348.
Song Y, Shaojun W, Yuanming D, Jin X, Ming FL, Shuifang Z, et al. Chloroplast genomic resource of Paris for species discrimination. Sci Rep. 2017;7:3427. https://doi.org/10.1038/s41598-017-02083-7.
Igloi GL, Meinke A, Döry I, Kössel H. Nucleotide sequence of the maize chloroplast rpoB/C1/C2 operon: comparison between the derived protein primary structures from various organisms with respect to functional domains. Mol Gen Genet. 1990;221(3):379–94. https://doi.org/10.1007/bf00259403.
Ford CS, Ayers KL, Haider N, Toomey N, van Alpen SJ, Kelly L, et al. Selection of candidate DNA barcoding regions for use on land plants. Bot J Linn Soc. 2009;159:1–11. https://doi.org/10.1111/j.1095-8339.2008.00938.x.
Kuang DY, Wu H, Wang YL, Gao LM, Zhang SZ, Lu L. Complete chloroplast genome sequence of Magnolia kwangsiensis (Magnoliaceae): implication for DNA barcoding and population genetics. Genome. 2011;54(8):663–73. https://doi.org/10.1139/G11-026.
Logachewa MD, Peva AA, Samigulin TH, Vallejo-Roman CM, Antonov AS. Phylogeny of flowering plants by the chloroplast genome sequences: in search of a “lucky gene”. Biochemistry (Mosc). 2007;72(12):1324–30.
Liu Y, Yan HF, Cao T, Ge XJ. Evaluation of 10 plant barcodes in Bryophyta (mosses). J Syst Evol. 2010;48(1):36–46. https://doi.org/10.1111/j.1759-6831.2009.00063.x.
Yodphaka S, Boonpragob K, Lumbsch HT, Kraichak E. Evaluation of six regions for their potential as DNA barcodes in epiphyllous liverworts from Thailand. Appl Plant Sci. 2018;6(8):e1174. https://doi.org/10.1002/aps3.1174.
Forrest LL, Davis EC, Long DG, Crandall-Stotler BJ, Clark A, Hollingsworth ML. Unraveling the evolutionary history of the liverworts (Marchantiophyta): multiple taxa, genomes and analyses. Bryologist. 2006;109(3):303–34 10.1639/0007-2745(2006)109[303:UTEHOT]2.0.CO;2.
Stech M, Quand D. 20,000 species and five key markers: the status of molecular bryophyte phylogenetics. Phytotaxa. 2010;9:196–228. https://doi.org/10.11646/phytotaxa.9.1.11.
Cialdella AM, Salariato DL, Aagesen L, Giussani LM, Zuloaga FO, Morrone O. Phylogeny of New World Stipeae (Poaceae): an evaluation of the monophyly of Aciachne and Amelichloa. Cladistics. 2010;26(6):563–78. https://doi.org/10.1111/j.1096-0031.2010.00310.x.
Cialdella AM, Sede SM, Romaschenko K, Peterson PM, Soreng RJ, Zuloaga FO, et al. Phylogeny of Nassella (Stipeae, Pooideae, Poaceae) based on analyses of chloroplast and nuclear ribosomal DNA and morphology. Aust Syst Bot. 2014;39(3):814–28. https://doi.org/10.1600/036364414X681419.
Pennisi E. Taxonomy. Wanted: a barcode for plants. Science. 2007;318(5848):190–1. https://doi.org/10.1126/science.318.5848.190.
Kress WJ, Wurdack KJ, Zimmer EA, Weigt LA, Janzen DH. Use of DNA barcodes to identify flowering plants. Proc Natl Acad Sci U S A. 2005;102(23):8369–74. https://doi.org/10.1073/pnas.0503123102.
Chase MW, Cowan RS, Hollingsworth PM, van den Berg C, Madrinan S, Petersen G, et al. A proposal for a standardised protocol to barcode all land plants. Taxon. 2007;56(2):295–9. https://doi.org/10.1002/tax.562004.
Hajibabaei M, Smith MA, Janzen DH, Rodriguez JJ, Whitfield JB, Hebert PDN. A minimalist barcode can identify a specimen whose DNA is degraded. Mol Ecol Notes. 2006;6(4):959–64. https://doi.org/10.1111/j.1471-8286.2006.01470.x.
Meusnier I, Singer GA, Landry JF, Hickey DA, Hebert PD, Hajibabaei M. A universal DNA mini-barcode for biodiversity analysis. BMC Genomics. 2008;9:214. https://doi.org/10.1186/1471-2164-9-214.
Dong W, Liu H, Chao X, Zuo Y, Chen Z, Zhou S. A chloroplast genomic strategy for designing taxon specific DNA mini-barcodes: a case study on ginsengs. BMC Genet. 2014;15:138. https://doi.org/10.1186/s12863-014-0138-z.
Huang CY, Grünheit N, Ahmadinejad N, Timmis JN, Martin W. Mutational decay and age of chloroplast and mitochondrial genomes transferred recently to angiosperm nuclear chromosomes. Plant Physiol. 2005;138:1723–33. https://doi.org/10.1104/pp.105.060327.
Bolger AM, Lohse M, Usadel B. Trimmomatic: a flexible trimmer for Illumina sequence data. Bioinformatics. 2014;30(15):2114–20. https://doi.org/10.1093/bioinformatics/btu170.
Kearse M, Moir R, Wilson A, Stones-Havas S, Cheung M, Sturrock S, et al. Geneious basic: an integrated and extendable desktop software platform for the organization and analysis of sequence data. Bioinformatics. 2012;28(12):1647–9. https://doi.org/10.1093/bioinformatics/bts199.
Johnson M, Zaretskaya I, Raytselis Y, Merezhuk Y, McGinnis S, Madden TL. NCBI BLAST: a better web inerface. Nucleic Acids Res. 2008;36:W5–9. https://doi.org/10.1093/nar/gkn201.
Lohse M, Drechsel O, Kahlau S, Bock R. OrganellarGenomeDRAW-a suite of tools for generating physical maps of plastid and mitochondrial genomes and visualizing expression data sets. Nucleic Acids Res. 2013;41:W575–81. https://doi.org/10.1093/nar/gkt289.
Katoh K, Standley DM. (2013). MAFFT multiple sequence alignment software version 7: improvements in performance and usability. Mol Biol Evol. 2013;30(4):772–80. https://doi.org/10.1093/molbev/mst010.
Krzywinski M, Schein J, Birol I, Connors J, Gascoyne R, Horsman D, et al. Circos: an information aesthetic for comparative genomics. Genome Res. 2009;19(9):1639–45. https://doi.org/10.1101/gr.092759.109.
Bradbury PJ, Zhang Z, Kroon DE, Casstevens TM, Ramdoss Y, Buckler ES. TASSEL: software for association mapping of complex traits in diverse samples. Bioinformatics. 2007;23(19):2633–5. https://doi.org/10.1093/bioinformatics/btm308.
Brown SD, Collins RA, Boyer S, Lefort MC, Malumbres-Olarte J, Vink CJ, et al. Spider: an R package for the analysis of species identity and evolution, with particular reference to DNA barcoding. Mol Ecol Resour. 2012;12(3):562–5. https://doi.org/10.1111/j.1755-0998.2011.03108.x.
Lanfear R, Frandsen PB, Wright AM, Senfeld T, Calcott B. PartitionFinder 2: new methods for selecting partitioned models of evolution for molecular and morphological phylogenetic analyses. Mol Biol Evol. 2016;34(3):772–3. https://doi.org/10.1093/molbev/msw260.
Huelsenbeck JP, Ronquist F. MRBAYES: Bayesian inference of phylogenetic trees. Bioinformatics. 2001;17(8):754–5. https://doi.org/10.1093/bioinformatics/17.8.754.
Rambaut A, Drummond AJ, Xie D, Baele G, Suchard MA. Posterior summarisation in Bayesian phylogenetics using tracer 1.7. Syst Biol. 2018;67(5):901–4. https://doi.org/10.1093/sysbio/syy032.
Zhang J, Kapli P, Pavlidis P, Stamatakis AA. General species delimitation method with applications to phylogenetic placements. Bioinformatics. 2013;29(22):2869–76. https://doi.org/10.1093/bioinformatics/btt499.
Rozas J, Ferrer-Mata A, Sánchez-DelBarrio JC, Guirao-Rico S, Librado P, Ramos-Onsins SE, et al. DnaSP 6: DNA sequence polymorphism analysis of large data sets. Mol Biol Evol. 2017;34(12):3299–302. https://doi.org/10.1093/molbev/msx248.
Kimura M. A simple method for estimating evolutionary rates of base substitutions through comparative studies of nucleotide sequences. J Mol Evol. 1980;16(2):111–20.
Meier R, Shiyang K, Vaidya G, Ng PK. DNA barcoding and taxonomy in Diptera: a tale of high intraspecific variability and low identification success. Syst Biol. 2006;55(5):715–28. https://doi.org/10.1080/10635150600969864.
Acknowledgements
We are grateful to the Tatra National Park and the Bieszczady National Park for the possibility of collecting samples. Thanks also to D.A. Callaghan and to Alfons Schäfer-Verwimp for sharing the samples.
Funding
Our research was financially supported by The National Science Center Kraków, Poland. Thanks to grant No. 2015/19/B/NZ8/03970 we were able to pay for sequencing of the Calypogeia plastomes, which was commissioned to a commercial company. The design of the study and collection, analysis, and interpretation of data and writing the manuscript were made only by the authors of the manuscript without the financial support.
Author information
Authors and Affiliations
Contributions
MŚ- DNA isolation and preparation of the samples for NGS sequencing, data analysis, text writing, tables and figures preparation; KM- data analysis, text writing, preparing of the tables and the figures; KB and AB- plant material collection, text writing; MS- data analysis; JS- research designing, data analysis, draft review of the paper. All authors read and approved the final manuscript.
Corresponding author
Ethics declarations
Ethics approval and consent to participate
Not applicable.
Consent for publication
Not applicable.
Competing interests
The authors declare that they have no competing interests.
Additional information
Publisher’s Note
Springer Nature remains neutral with regard to jurisdictional claims in published maps and institutional affiliations.
Supplementary information
Additional file 1: Table S1.
Species used in this study, sampling data and sequencing results.
Additional file 2: Table S2.
SNP and indel variation within chloroplast genes of Calypogeia species.
Additional file 3: Table S3.
SNP and indel variation within chloroplast noncoding regions of Calypogeia species.
Additional file 4: Table S4.
SNP and indel variation within chloroplast 500-bp fragments of Calypogeia species.
Additional file 5: Table S5.
Discrimination power of the DNA barcodes recommended for plants.
Additional file 6: Figure S1.
Phylograms based on amino acids and complete plastid genomes of Calypogeia species. The posterior probability value lower than 1 is given at the node.
Rights and permissions
Open Access This article is licensed under a Creative Commons Attribution 4.0 International License, which permits use, sharing, adaptation, distribution and reproduction in any medium or format, as long as you give appropriate credit to the original author(s) and the source, provide a link to the Creative Commons licence, and indicate if changes were made. The images or other third party material in this article are included in the article's Creative Commons licence, unless indicated otherwise in a credit line to the material. If material is not included in the article's Creative Commons licence and your intended use is not permitted by statutory regulation or exceeds the permitted use, you will need to obtain permission directly from the copyright holder. To view a copy of this licence, visit http://creativecommons.org/licenses/by/4.0/. The Creative Commons Public Domain Dedication waiver (http://creativecommons.org/publicdomain/zero/1.0/) applies to the data made available in this article, unless otherwise stated in a credit line to the data.
About this article

Cite this article
Ślipiko, M., Myszczyński, K., Buczkowska, K. et al. Molecular delimitation of European leafy liverworts of the genus Calypogeia based on plastid super-barcodes. BMC Plant Biol 20, 243 (2020). https://doi.org/10.1186/s12870-020-02435-y
Received:
Accepted:
Published:
DOI: https://doi.org/10.1186/s12870-020-02435-y