
Abstract
Background
Polygonum cuspidatum of the Polygonaceae family is a traditional medicinal plant with many bioactive compounds that play important roles in human health and stress responses. Research has attempted to identify biosynthesis genes and metabolic pathways in this species, and quantitative real-time PCR (RT-qPCR) has commonly been used to detect gene expression because of its speed, sensitivity, and specificity. However, no P. cuspidatum reference genes have been identified, which hinders gene expression studies. Here, we aimed to identify suitable reference genes for accurate and reliable normalization of P. cuspidatum RT-qPCR data.
Results
Twelve candidate reference genes, including nine common (ACT, TUA, TUB, GAPDH, EF-1γ, UBQ, UBC, 60SrRNA, and eIF6A) and three novel (SKD1, YLS8, and NDUFA13), were analyzed in different tissues (root, stem, and leaf) without treatment and in leaves under abiotic stresses (salt, ultraviolet [UV], cold, heat, and drought) and hormone stimuli (abscisic acid [ABA], ethylene [ETH], gibberellin [GA3], methyl jasmonate [MeJA], and salicylic acid [SA]). Expression stability in 65 samples was calculated using the △CT method, geNorm, NormFinder, BestKeeper, and RefFinder. Two reference genes (NDUFA13 and EF-1γ) were sufficient to normalize gene expression across all sample sets. They were also the two most stable genes for abiotic stresses and different tissues, whereas NDUFA13 and SKD1 were the top two choices for hormone stimuli. Considering individual experimental sets, GAPDH was the top-ranked gene under ABA, ETH, and GA3 treatments, while 60SrRNA showed good stability under MeJA and cold treatments. ACT, UBC, and TUB were suitable genes for drought, UV, and ABA treatments, respectively. TUA was not suitable because of its considerable variation in expression under different conditions. The expression patterns of PcPAL, PcSTS, and PcMYB4 under UV and SA treatments and in different tissues normalized by stable and unstable reference genes demonstrated the suitability of the optimal reference genes.
Conclusions
We propose NDUFA13 and EF-1γ as reference genes to normalize P. cuspidatum expression data. To our knowledge, this is the first systematic study of reference genes in P. cuspidatum which could help advance molecular biology research in P. cuspidatum and allied species.
Background
Polygonum cuspidatum is a perennial herb of the Polygonaceae family that is a well-known traditional Chinese medicine. Its first medicinal application records date back over 1800 years in Mingyi Bielu [1]. It has long been used in Chinese folk medicine for the treatment of abdominal masses, postpartum blood stasis, urethritis, suppuration, ulcers, sore throats, toothache, chronic bronchitis, hemorrhoids, and other ailments [1, 2]. More recently, oral intake or external applications of its processed products were shown to be effective in hepatitis, hypertension, hyperlipidemia, diabetes, jaundice, arthritis, skin burns, and scalds [3].
Numerous active compounds have been isolated and identified from P. cuspidatum to date, such as anthraquinones, flavonoids, stilbenes, organic acids, coumarins, catechins, and lignans [3]. The content of resveratrol, a stilbene, is higher in P. cuspidatum than in other plants [4], and several physiological and pharmacological studies have reported anti-oxidative, anti-cancer, anti-inflammatory, anti-tumor, anti-depressant, and anti-viral roles for resveratrol, as well as neuroprotective and metabolic regulation through interactions with multiple targets [5]. Other components of P. cuspidatum also show significant health-promoting effects in cells or animal models [6, 7]. Interestingly, the vast majority of active compounds are secondary metabolites synthesized during normal plant growth or in response to environmental stresses [8, 9]. However, the mechanism of P. cuspidatum responses to abiotic stresses and hormone stimuli as well as in various tissues needs to be thoroughly explored to better understand the production of these active ingredients.
Stilbenes and flavonoids, derivatives of the phenylpropanoid pathway, actively participate in the regulation of resistance to stresses, including pathogens, ultraviolet (UV) radiation, low/high temperature, drought, heavy metals, methyl jasmonate (MeJA), and ethylene (ETH) [8, 9]. Phenylalanine ammonia lyase (PAL) catalyzes the conversion of L-phenylalanine into cinnamic acid, which is the first committed step of the phenylpropanoid pathway. The same substrates 4-coumaroyl-CoA and malonyl-CoA are used by stilbene synthase (STS) and chalcone synthase to produce resveratrol and tetrahydroxychalcone, respectively, which are branch sites in the stilbene and flavonoid pathway [10]. Various transcription factors are involved in regulation of the phenylpropanoid pathway [11], and MYB4 in Arabidopsis responds to UV and SA stresses to suppress phenylpropanoid pathway gene expression [12, 13].
The analysis of gene expression patterns can provide insights into complex metabolic processes. Quantitative real-time PCR (RT-qPCR) is commonly used to detect gene expression in different species because of its simplicity, speed, sensitivity, specificity, and high throughput [14]. However, despite these advantages, variability in initial materials, RNA integrity, RT-PCR efficiency, qPCR efficiency, and inherent technical variations will inevitably lead to errors, so it is necessary to use reference genes as internal controls [15]. An appropriate reference gene should be constantly expressed across the samples being investigated [15]. Classic reference genes for RT-qPCR data normalization, such as actin, tubulin, ubiquitin, elongation factor, translation initiation factor, and ribosomal RNA, are usually required for basic and essential processes in the cell. However, increasing experimental evidence shows that some of these genes are not as stable as previously thought [16]. Therefore, a host of highly stable novel reference genes have been identified using screening from genomes and transcriptome datasets [17, 18]. Previously, reference genes have not always been stable in different species and tissues, or at different developmental stages and experimental conditions within a single species [19]. Therefore, it is crucial to assess expression stability probabilities under specific conditions prior to use. Furthermore, two or more reference genes are desirable to avoid a biased or mistaken interpretation of the changes of target gene expression [20].
In this context, the △CT method [21], geNorm [22], NormFinder [23], BestKeeper [24], and RefFinder [25] have been developed to evaluate the stability of genes in biological samples. They have been successfully employed to validate reference genes in various medicinal plants, such as Gentiana macrophylla [26], Achyranthes bidentata [27], and Euscaphis konishii [18]. In P. cuspidatum, PcPKS1 [28], PcPKS2 [29], PcCHS1 [30], PcSTS [31], PcMYB1 [32], and PcWRKY33 [33] have been cloned and studied. However, the lack of P. cuspidatum reference genes has become a major hurdle for gene expression studies in this species. Because of a lack of sequence and expression information, we performed transcriptome sequencing of P. cuspidatum vegetative tissues (root, stem, and leaf) and leaves under different treatments (UV and MeJA) in our laboratory (unpublished data), providing a wealth of resources for our current selection of suitable reference genes.
The present study was undertaken to characterize candidate reference genes for RT-qPCR data normalization in P. cuspidatum. Twelve genes (actin [ACT], tubulin-alpha [TUA], tubulin-beta [TUB], glyceraldehyde-3 phosphate dehydrogenase [GAPDH], elongation factor 1-gamma [EF-1γ], ubiquitin domain-containing protein [UBQ], ubiquitin-conjugating enzyme [UBC], 60S ribosomal RNA [60SrRNA], eukaryotic translation initiation factor 6A [eIF6A], suppressor of K+ transport growth defect1 [SKD1], thioredoxin-like protein [YLS8], and NADH dehydrogenase [ubiquinone] 1 alpha subcomplex subunit 13-A [NDUFA13]) were screened out from the P. cuspidatum transcriptome, and their expression levels were detected by RT-qPCR across all samples. These included three tissues (root, stem, and leaf), 32 abiotic-treated samples (salt, UV, cold, heat, and drought), and 30 hormone-treated samples (abscisic acid [ABA], ETH, gibberellin [GA3], MeJA, and salicylic acid [SA]). Expression stability was calculated using △CT, geNorm, NormFinder, BestKeeper, and RefFinder. Additionally, the expression of three target genes (PcPAL, PcSTS, and PcMYB4) under UV and SA treatments and in different tissues was normalized separately by the most and least stable genes to demonstrate the suitability of the recommended reference genes. Our results provide some useful resources for the future quantification of gene expression in P. cuspidatum and allied species.
Results
Identification of candidate reference genes
In this work, nine classic reference genes (ACT, TUA, TUB, GAPDH, EF-1γ, UBQ, UBC, 60SrRNA, and eIF6A) and three novel reference genes (SKD1, YLS8, and NDUFA13) were identified from the P. cuspidatum transcriptome as candidate reference genes. The full-length cDNAs of these 12 genes, which were used to design specific qPCR primers, were submitted to NCBI GenBank (Table 1).
Evaluation of primer specificity and efficiency
PCR products amplifying P. cuspidatum leaf cDNA were checked by 1% (m/v) agarose gel electrophoresis, which revealed a single band of expected size for each primer pair (Additional file 1: Figure S1). Additionally, a single peak in the melting curve for each gene confirmed primer specificity (Additional file 1: Figure S2). The qPCR efficiency (E) varied from 86% (TUB) to 103% (SKD1) with correlation coefficients (R2) ranging from 0.994 to 0.999 (Additional file 1: Figure S3). Hence each primer pair was highly efficient and specific to the targeted region.
Expression profiling of candidate reference genes
The expression levels of the 12 candidate reference genes (ACT, TUA, TUB, GAPDH, EF-1γ, UBQ, UBC, 60SrRNA, eIF6A, SKD1, YLS8, and NDUFA13) were evaluated in 65 samples collected from different tissues without treatments and leaves under abiotic and hormone stimuli using CT values. Raw CT values of the 12 genes across all samples were shown in Additional file 2, and were plotted directly by Boxplot (Fig. 1). The CT values exhibited a relatively wide range from 19.84 (GAPDH) to 33.46 (SKD1) across all samples. Because the gene expression level is negatively correlated with the CT value, ACT was the highest expressed gene with the lowest mean CT value (21.60), whereas SKD1 was the least abundant gene with the highest mean CT value (27.42) among the 12 genes. The expression variation among the 65 samples for each gene ranged from 4.12 (eIF6A) to 8.779 (SKD1). No gene showed an unchanged expression level under all conditions, so it was necessary to identify reference genes under specific experimental conditions in P. cuspidatum.
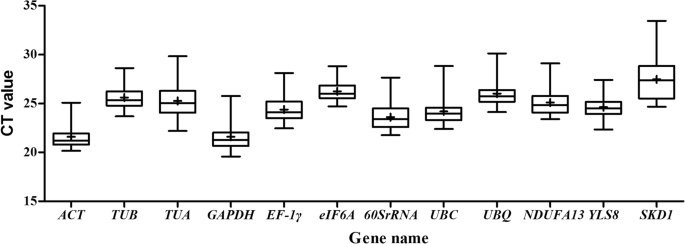
Boxplot analysis of cycle threshold (CT) values of 12 candidate reference genes across all samples. The boxes represent the interquartile range. The line across the box represents the median. The plus sign in the box show the mean values. Hyphens over and under the boxes is shown as the maximum and minimum, respectively
Expression stability of candidate reference genes
In our study, each reference gene was evaluated in 11 experimental sets which were analyzed individually at first. To obtain a more comprehensive analysis, the sets were then divided into four different groups: (1) “Abiotic stress” (salt, UV, cold, heat, and drought) (2) “Hormone stimuli” (ABA, ETH, GA3, MeJA, and SA) (3) “Different tissues” (root, stem, and leaf), and (4) “All” (all experimental sets). More specifically, the stability of the 12 candidate reference genes was analyzed by the △CT method, geNorm, NormFinder, BestKeeper, and RefFinder.
geNorm estimates the optimal number of reference genes required for accurate and reliable RT-qPCR normalization. As shown in Fig. 2, V2/3 values were much lower than the cut-off value of 0.15 for all different groups, indicating that two reference genes would be sufficient for accurate and reliable normalization of the gene expression data.

Determination of the optimal numbers of reference genes for normalization in Polygonum cuspidatum
For “Abiotic stress”, 60SrRNA and EF-1γ had the lowest M value (0.25) followed by NDUFA13 (0.35), indicating that these were the three most stable genes in geNorm analysis. NDUFA13 and EF-1γ were the two top-ranking genes in NormFinder and △CT analysis, while eIF6A and 60SrRNA were top in BestKeeper analysis. According to the calculations performed by RefFinder, EF-1γ and NDUFA13 were the most appropriate reference genes under abiotic stress conditions. The comprehensive ranking order for every specific abiotic stress was not entirely consistent. EF-1γ, NDUFA13, and 60SrRNA were also identified as the three most stable reference genes under heat treatment, but EF-1γ and NDUFA13 fell outside the list of the four most stable genes, though 60SrRNA ranked top under cold conditions. For salt treatment, YLS8 was the top-ranked gene, followed by EF-1γ, TUB, and NDUFA13. For UV treatment, UBC had the highest stability, while EF-1γ, NDUFA13, and 60SrRNA also exhibited good stability. NDUFA13 was the optimal reference gene under drought treatment, followed by EF-1γ and 60SrRNA with low CVs (Table 2, Additional file 3: Table S1).
For “Hormone stimuli”, the best reference genes were 60SrRNA and EF-1γ in geNorm analysis. NDUFA13 and SKD1 were the two most stable reference genes by both △CT and NormFinder, but ACT and SKD1 were identified by BestKeeper. In a comprehensive analysis, NDUFA13 and SKD1 were the two optimal reference genes under hormone stimuli conditions. When considering every hormone treatment, NDUFA13 was one of the three most stable reference genes for all hormone treatments except ABA; GAPDH and SKD1 were among the four most stable genes under ABA, ETH, and GA conditions (Table 2, Additional file 3: Table S1).
For “Different tissues”, NDUFA13 and EF-1γ were the most stable combination in geNorm analysis. Similar results were seen by △CT. NDUFA13 and EF-1γ next to GAPDH were the top-ranking genes in NormFinder analysis. In BestKeeper analysis, ACT ranked first with the lowest stability value (0.06), while NDUFA13 and EF-1γ ranked second and fourth, respectively. NDUFA13 and EF-1γ were recommended in different tissues of P. cuspidatum by RefFinder (Table 2, Additional file 3: Table S1).
When all samples were taken into account, 60SrRNA, EF-1γ, and NDUFA13 ranked most highly in geNorm, △CT, and NormFinder analysis. However, they were low in the ranking in BestKeeper analysis. RefFinder ranked the candidate reference genes from the highest to the lowest stability as follows: NDUFA13 > EF-1γ > 60SrRNA > UBQ > eIF6A > ACT > YLS8 > TUB > UBC > GAPDH > TUA > SKD1 (Table 2). Taken together, NDUFA13 and EF-1γ were the two most suitable reference genes across all samples of P. cuspidatum. Additionally, it was clear that TUA was an unstable gene under all experiment conditions according to all valuation systems (Table 2, Additional file 3: Table S1).
Validation of candidate reference genes
To ensure the accuracy and reliability of our results, the relative expression patterns of PcPAL, PcSTS, and PcMYB4 were analyzed under Abiotic stress (UV), Hormone stimuli (SA), and in different tissues (leaf, stem, and root). The two most stable reference genes (NDUFA13 and UBQ for SA, UBC and EF-1γ for UV, NDUFA13 and EF-1γ for different tissues) and one unstable gene (TUA) were selected for normalizing qPCR data.
As shown in Fig. 3a, under UV treatment, PcPAL was significantly induced at all analyzed stress times. However, the expression levels at 16 h and 32 h with TUA normalization were much higher than those with either UBC, EF-1γ, or their geometric mean. The expression of PcMYB4 was inhibited by UV treatment, initially reduced after reaching the lowest level at 8 h, then increased afterwards. However, the expression levels of PcMYB4 at 16 h and 32 h were overestimated with TUA normalization. Similar misjudgments occurred in the analysis of PcSTS expression data. Some divergences in the results were also observed under SA treatment (Fig. 3b). The expression level of PcPAL with NDUFA13, UBQ, or their geometric mean achieved the highest after adding SA for 2 h and was higher at 4 h than the control, whereas the opposite results were displayed with TUA normalization. PcSTS and PcMYB4 responded quickly to SA, and a low expression level was maintained for a long time (2–12 h). TUA normalization similarly led to erroneous interpretation of the relative expression patterns of PcMYB4. In different tissues (Fig. 3c), the expression patterns of PcPAL, PcSTS, and PcMYB4 were similar when NDUFA13, EF-1γ, and TUA were used for normalization, but the fold-changes in root and stem were underestimated with normalization by TUA.

Relative expression patterns of target genes for UV (A), SA (B) and different tissues (C). The most stable reference genes (NDUFA13 and UBQ for SA, UBC and EF-1γ for UV, NDUFA13 and EF-1γ for tissues) and unstable gene (TUA) were selected for normalizing qPCR data. Data are represented as mean ± SD, different letters on the vertical bars indicate significant difference at 0.05 levels
Overall, the expression patterns of PcPAL, PcSTS, or PcMYB4 were nearly the same when using stable reference genes for normalization, whereas the expression levels had large variations when TUA was used. Furthermore, the RT-qPCR results normalized by the stable reference genes under UV treatment and in different tissues were more consistent with the target gene expression profiling derived from P. cuspidatum transcriptome data (Additional file 3: Table S2). Thus, the most suitable reference genes calculated by the above mentioned software were applicable under some specific conditions.
Discussion
RT-qPCR is one of the most commonly used techniques to obtain gene expression profiles in molecular biology. A prerequisite of this is the selection of appropriate reference genes for data normalization to ensure the accuracy and reliability of the results [15]. Large-scale gene segments and gene expression data generated by sequencing provide abundant resources for the identification and evaluation of reference genes, especially in non-model species [18, 26].
In this work, we made full use of transcriptome sequencing data available in our laboratory to identify candidate reference genes for P. cuspidatum. The expression stability was evaluated by △CT method, geNorm, NormFinder, and BestKeeper, although the results obtained were not completely consistent. Such discrepancies in stability ranking were also reported in some previous studies [34]. Interestingly, we found that the rankings by △CT, geNorm, and NormFinder, were similar, especially for individual sets, but different from those by BestKeeper; similar findings were reported in other studies [19, 34]. For example, in our work, under ETH, GA3, and SA treatment, ACT was identified as the most stable gene by BestKeeper analysis, but performed unsatisfactorily in △CT, NormFinder, and geNorm analysis. Therefore, comprehensive analysis with RefFinder of multiple results from different software could help select a more appropriate reference gene.
ACT, TUA, and TUB, which encode cytoskeletal proteins, are extensively used as reference genes, and their high stability is reported in many plants [35, 36]. However, we showed that TUA performed poorly across all sample sets, ACT performed less well in most cases, and TUB was more affected by environmental factors such as SA and cold; this was similar to previous results obtained in Eucommia ulmoides [37]. GAPDH encodes an abundant glycolytic enzyme present in most cell types, and has universally been used as a reference gene in RT-qPCR. GAPDH showed a good performance in response to “Hormone stimuli” in parsley and carrot leaves, but was less stable for most abiotic stresses [36, 38]. The performance of GAPDH in our study was relatively consistent with those of previous studies, except for responses to MeJA and drought. Ubiquitin is a small regulatory protein found in most tissues of eukaryotic organisms. We showed that UBC was the most stable gene under UV treatment, in agreement with the findings of Borges [39]. Moreover, UBQ was one of the two most stable genes under SA treatment, which differed from the results obtained in Achyranthes bidentata [27] and carrot [36]. However, UBC and UBQ did not perform well across all other sets, which is consistent with the results seen in parsley [38]. Thus, UBC and UBQ were not the preferred gene choices in our study.
Eukaryotic translation initiation factor and ribosomal RNA have been reported as reference genes in many studies, such as eIF4a in Eleusine indica [40], and eIF5A and 60S ribosomal RNA in Panax ginseng [41]. In our study, the performances of eIF6A and 60SrRNA were not always the best in “Abiotic stress”, “Hormone stimuli”, and “all” groups, but were within an acceptable range. Elongation factor 1 (EF-1), composed of the four subunits EF-1α, EF-1β, EF-1δ, and EF-1γ, plays a central role in protein biosynthesis [42]. EF-1α, encoding a G-protein, was used for the normalization of qPCR data in some medicinal plants such as G. macrophylla [26] and A. bidentata [27]. The main function of EF-1γ is to ensure the correct scaffolding of different subunits in the EF-1 complex as well as to direct its intracellular localization [43]. The expression stability of EF-1γ had previously been evaluated in P. ginseng [34] and Nilaparvata lugens [44]. In our study, EF-1γ was one of the two most suitable reference genes with stable expression levels under various experimental conditions.
Novel reference genes such as SKD1, YLS8, and NDUFA13 have also been selected for gene normalization by the application of large amounts of omics data. SKD1, encoding a protein that contributes to vacuolar trafficking and maintenance of the large central vacuole of plant cells [45], was first selected as a reference gene in pear [46]. In this study, SKD1 was preferable under “Hormone stimuli” conditions, but had to be discarded under “Abiotic stress” and “Different tissues” conditions because of its low expression and high variation. YLS8 encodes a protein involved in mitosis, and performed well under ABA, MeJA, and salt conditions, but poorly in other individual sets and the three combination groups. These results were not identical to those obtained previously [46, 47]. Notably, NDUFA13 was remarkably stable in the individual sets (except in the ABA group) as well as in the combination groups, suggesting it is an almost ideal reference gene. NDUFA13, encoded by the nuclear genome, is an accessory subunit of the mitochondria respiratory chain complex I, which transfers electrons from nicotinamide adenine dinucleotide to ubiquinone [48]. The fact that mitochondria are known as eukaryotic cell powerhouses may explain why NDUFA13 showed stable expression under various conditions in this study. NDUFA13 was previously reported as a reference gene in Apostichopus japonicus [49], but no studies have investigated its potential in plants. In this regard, the present study is the first known report of NDUFA13 as a reference gene in plants.
PAL, STS, and MYB4 are three important regulating genes in the phenylpropanoid pathway. When using the stable reference genes, the relative expression patterns of PcPAL and PcMYB4 were in agreement with previous reports; for example, MYB4 was down-regulated by exposure to UV-B light in Arabidopsis thaliana [12] and Brassica rapa [50], and PAL was induced by exposure to UV and SA in A. thaliana [51] and Juglans regia [52]. To our knowledge, STS is found in only a few plants, and not in Arabidopsis or tobacco. Research into STS expression is currently concentrated in grapes, where it was shown to be strongly induced by UV-C [53] and SA [54]. We observed the opposite expression patterns of STS in response to SA in P. cuspidatum, with rapidly decreasing expression lasting for 12 h. These differences may reflect variations in UV wavelengths or species. Moreover, our results are consistent with P. cuspidatum transcriptome data. Evidently, there were obvious underestimates or overestimates in our results following normalization by the least stable gene, TUA. Our results demonstrate the importance of using a stable reference gene for normalization to obtain accurate results.
Based on the above analysis, we suggest that no single gene should be used for normalization in all species, tissues, or treatments. Therefore, suitable reference genes for given species and conditions should be explored.
Conclusions
We evaluated the expression stability of 12 candidate reference genes in different tissues of P. cuspidatum and under different treatment conditions. NDUFA13 and EF-1γ were identified as the best two reference genes for normalizing RT-qPCR gene expression data. Their reliability and effectiveness were verified by PcPAL, PcSTS, and PcMYB4. To our knowledge, the current work is the first systematic analysis of suitable reference genes that will facilitate further research into the molecular biology of P. cuspidatum and other closely related species.
Methods
Plant material
Seeds of P. cuspidatum were collected from the medicinal plant garden of the Institute of Botany, Chinese Academy of Sciences (Beijing, China). Seeds were surface-sterilized and sown on Murashige and Skoog (MS) agar medium in a growth chamber at 24 °C with a 16 h/8 h light/dark cycle. After 1 month, similar seedlings were submitted to different treatments. For hormone treatment, the seedlings were uniformly sprayed with 0.5 mM MeJA, 1 mM SA, 0.1 mM ABA, 0.5 mM GA3 or 0.5 g/L ethrel. For cold and heat treatments, the seedlings were respectively kept in 4 °C and 42 °C illumination boxes. For UV irradiation, the seedlings were placed under a UV-B transilluminator for 20 min. For salt treatment, the seedlings were transplanted to MS agar medium containing 100 mM NaCl. Leaf samples were collected at 0, 2, 4, 8, 16, and 32 h after UV and MeJA treatments, and 0, 2, 4, 8, 12, and 24 h for the other treatments. For drought treatment, plants grown for 2 months in plastic pots containing a soil/vermiculite mixture (1:1) under the same conditions were kept in dry soil for 1 week, then rehydrated and sampled daily (0, 1, 2, 3, 4, 5, 6, 7, and 8 d). Tissue-specific samples (root, stem, and leaf) were collected from plants grown for 2 months in the soil. All 65 samples, including three tissue-specific samples (root, stem, and leaf), 32 stress-treated samples (salt-, UV-, cold-, heat-, and drought-treated leaves), and 30 hormone-treated samples (ABA-, ETH-, GA3-, MeJA-, and SA-treated leaves), were separately collected in three biological repeats. All samples were immediately frozen in liquid nitrogen and stored at − 70 °C before RNA extraction.
RNA isolation and cDNA synthesis
Total RNA was isolated from samples using the Plant Total RNA Purification Kit (GeneMark, Taiwan, China) following the manufacturer’s instructions. The RNA integrity was checked on a 1% (m/v) agarose gel. The quantity and quality of the total RNA samples were assessed by recording absorbances at 260/280 nm and 260/230 nm with the NanoDrop 2000 spectrophotometer (Thermo Fisher Scientific, Waltham, MA, USA). Only RNA samples 1.8 < OD260/280 < 2.2 and OD260/230 > 2.0 were used for subsequent cDNA synthesis. Total RNA (3 μg) was reverse-transcribed into cDNA using the Hifair™ II 1st Strand cDNA Synthesis SuperMix (Yeasen, Shanghai, China) with oligo (dT) primers according to the manufacturer’s instructions. cDNA was diluted at 1:20 with the EASY dilution solution (Takara, Japan), then stored at − 20 °C until required as template for qPCR.
Selection of candidate reference genes
The expression levels of unigenes are commonly estimated by fragments per kilobase of transcript per million mapped reads values [55]. A candidate reference gene should be moderately expressed with a small coefficient of variation (CV) [56]. In this work, the CV calculation formula was: CV = standard deviation of reads per kilobase of transcript per million mapped reads (RPKM)/average RPKM. We downloaded the sequences of nine classic reference genes (ACT, TUA, TUB, GAPDH, EF-1γ, UBQ, UBC, 60SrRNA, and eIF6A) identified in other species, and carried out BLASTn queries against the P. cuspidatum transcriptome. Then, the highest ortholog sequences were checked against the Arabidopsis genome database and recorded in Table 1. Additionally, three new candidate genes, SKD1, YLS8, and NDUFA13, were selected based on their low CV and appropriate RPKM values (Additional file 3: Table S3). The cDNA and genomic DNA sequences of these candidate reference genes were shown in Additional file 4 and Additional file 5, respectively.
Primer design
Specific primers were designed using Primer 5 software and synthesized by GENEWIZ Company (Tianjin, China). Gene characteristics and primer details are shown in Table 1. The specificity of each primer pair was assessed by amplification and melting curve analysis. The correlation coefficient (R2) and amplification efficiency (E) for all primer pairs were evaluated by standard curves using fourfold dilutions of the pooled cDNA (1/4, 1/16, 1/64, 1/256, and 1/1024).
RT-qPCR
All qPCR was carried out in 96-well plates using QuantStudio™ Real-Time PCR Software (Applied Biosystems, USA) with the Hieff™ qPCR SYBR® Green Master Mix (Yeasen, Shanghai, China). Each 10 μL reaction included: 5.0 μL of 2× Hieff™ qPCR SYBR® Green Master Mix, 0.2 μL of each primer (10 μM), 1.0 μL of diluted (1:20) cDNA template, and 3.6 μL of RNase-free water. The cycle program for product amplification was: 95 °C for 5 min (hot-start activation) followed by 40 cycles of 95 °C for 10 s (denaturation), 58 °C for 20 s (annealing), and 72 °C for 20 s (extension). The melting curve was generated after 40 cycles to test the specificity of each primer pair across the temperature range of 60–95 °C at a heating rate of 0.05 °C/s. Three technical replicates were used for each sample.
Data analysis and assessment of candidate reference genes performance
The CT values represent the expression level of each candidate reference gene. The amplification efficiency was calculated by: E (%) = (10 − 1/slope − 1) × 100 [57]. The stability of gene expression was evaluated by the △CT method [21], geNorm [22], NormFinder [23], BestKeeper [24], and RefFinder [25].
The △CT method was employed to rank the genes by calculating the average standard deviation (SD) based on the relative expression of all pairwise combinations of candidate reference genes. The gene with the lowest SD was identified as the most stable reference gene [21]. The geNorm calculates the expression stability value (M-value) for each gene. Genes with the lowest M values have the most stable expression. geNorm determines the pairwise variations (V) of one specific gene with all others. A cut-off value of Vn/n + 1 < 0.15 means that further addition of reference genes no longer makes any significant contribution to the normalization. For instance, V2/3 < 0.15 means that two reference genes are sufficient for data normalization [22]. NormFinder provides a stability value (SV) for each gene, which takes intergroup and intragroup relationships into consideration. A lower SV indicates a higher stability [23]. BestKeeper calculates three variables based on the CT values of all genes: the coefficient of correlation (r), standard deviation (SD), and coefficient of variance (CV). A more stable gene exhibits a lower SD ± CV value [24]. RefFinder gives a comprehensive ranking for each candidate reference gene based on the geometric mean of the weights of all genes calculated by the above four computational approaches. A lower geometric mean of the ranking values indicates a more stable expression [25].
Validation of selected candidate reference genes
To validate the selected reference genes, qPCR was performed to analyze target gene expression levels (PcMYB4, PcPAL, and PcSTS) under UV and SA treatments and in different tissues. The homologous P. cuspidatum genes AtMYB4 and AtPAL1 were cloned and named PcMYB4 and PcPAL, respectively (Table 1, Additional file 4, Additional file 5). PcSTS (EU647245.1) was isolated in previous studies from our laboratory [31]. Primer design and detection for these three genes were performed according to the aforementioned methods. Relative expression levels were calculated with the 2 −△△CT method.
Availability of data and materials
The data and materials supporting the conclusions of this study are included within the article and its additional files.
Abbreviations
- 60SrRNA :
-
60S ribosomal RNA
- ABA:
-
Abscisic acid
- ACT :
-
Actin 7
- EF-1γ :
-
Elongation factor 1-gamma
- eIF6A :
-
Eukaryotic translation initiation factor 6A
- ETH:
-
Ethylene
- GA3:
-
Gibberellin
- GAPDH :
-
Glyceraldehyde-3 phosphate
- MeJA:
-
Methyl jasmonate
- MYB4 :
-
Transcription repressor MYB4
- NDUFA13 :
-
NADH dehydrogenase [ubiquinone] 1 alph
- PcPAL :
-
Phenylalanine ammonia-lyase
- PcSTS :
-
Stilbene synthases
- SA:
-
Salicylic acid
- SKD1 :
-
Suppressor of K+ transport growth defect1
- TUA :
-
Tubulin-alpha 6
- TUB :
-
Tubulin-beta 2
- UBC :
-
Ubiquitin-conjugating enzyme
- UBQ :
-
Ubiquitin domain-containing
- UV:
-
Ultraviolet
- YLS8 :
-
Thioredoxin-like protein YLS8
References
Tao H. Ming yi bie lu. Beijing: People Medical Publishing House; 1986.
Li SZ. Ben cao gang mu. Beijing: People Medical Publishing House; 1979.
Peng W, Qin RX, Li XL, Zhou H. Botany, phytochemistry, pharmacology, and potential application of Polygonum cuspidatum sieb.Et Zucc.: a review. J Ethnopharmacol. 2013;148:729–45.
Jayatilake GS, Jayasuriya H, Lee ES, Koonchanok NM, Geahlen RL, Ashendel CL, et al. Kinase inhibitors from Polygonum cuspzdatum. J Nat Prod. 1993;56:1805–10.
Kulkarni SS, Carles C. The molecular targets of resveratrol. Biochim Biophys Acta-Mol Basis Dis. 1852;2015:1114–23.
Peluso I, Miglio C, Morabito G, Ioannone F, Serafini M. Flavonoids and immune function in human: a systematic review. Crit Rev Food Sci Nutr. 2015;55:383–95.
Huang Q, Lu G, Sben HM, Cbung MCM, Ong CN. Anti-cancer properties of anthraquinones from rhubarb. Med Res Rev. 2007;27:609–30.
Mierziak J, Kostyn K, Kulma A. Flavonoids as important molecules of plant interactions with the environment. Molecules. 2014;19:16240–65.
Chong J, Poutaraud A, Hugueney P. Metabolism and roles of stilbenes in plants. Plant Sci. 2009;177:143–55.
Emiliani G, Fondi M, Fani RGribaldo S. A horizontal gene transfer at the origin of phenylpropanoid metabolism: a key adaptation of plants to land. Biol Direct. 2009;4:7.
Boudet AM. Evolution and current status of research in phenolic compounds. Phytochemistry. 2007;68:2722–35.
Jin HL, Cominelli E, Bailey P, Parr A, Mehrtens F, Jones J, et al. Transcriptional repression by AtMYB4 controls production of UV-protecting sunscreens in Arabidopsis. EMBO J. 2000;19:6150–61.
Chen YH, Yang XY, He K, Liu MH, Li JG, Gao ZF, et al. The MYB transcription factor superfamily of Arabidopsis: expression analysis and phylogenetic comparison with the rice MYB family. Plant Mol Biol. 2006;60:107–24.
Bustin SA, Benes V, Nolan T, Pfaffl MW. Quantitative real-time RT-PCR - a perspective. J Mol Endocrinol. 2005;34:597–601.
Derveaux S, Vandesompele J, Hellemans J. How to do successful gene expression analysis using real-time PCR. Methods. 2010;50:227–30.
Gutierrez L, Mauriat M, Guenin S, Pelloux J, Lefebvre J-F, Louvet R, et al. The lack of a systematic validation of reference genes: a serious pitfall undervalued in reverse transcription-polymerase chain reaction (RT-PCR) analysis in plants. Plant Biotechnol J. 2008;6:609–18.
Czechowski T, Stitt M, Altmann T, Udvardi MK, Scheible WR. Genome-wide identification and testing of superior reference genes for transcript normalization in Arabidopsis. Plant Physiol. 2005;139:5–17.
Liang W, Zou X, Carballar-Lejarazu R, Wu L, Sun W, Yuan X, et al. Selection and evaluation of reference genes for qRT-PCR analysis in Euscaphis konishii hayata based on transcriptome data. Plant Methods. 2018;14:42.
Mallona I, Lischewski S, Weiss J, Hause B, Egea-Cortines M. Validation of reference genes for quantitative real-time PCR during leaf and flower development in Petunia hybrida. BMC Plant Biol. 2010;10:4.
Schmid H, Cohen CD, Henger A, Irrgang S, Schlondorff D, Kretzler M. Validation of endogenous controls for gene expression analysis in microdissected human renal biopsies. Kidney Int. 2003;64:356–60.
Silver N, Best S, Jiang J, Thein SL. Selection of housekeeping genes for gene expression studies in human reticulocytes using real-time PCR. BMC Mol Biol. 2006;7:33.
Vandesompele J, De Preter K, Pattyn F, Poppe B, Van Roy N, De Paepe A, et al. Accurate normalization of real-time quantitative RT-PCR data by geometric averaging of multiple internal control genes. Genome Biol. 2002;3:34.
Andersen CL, Jensen JL, Orntoft TF. Normalization of real-time quantitative reverse transcription-PCR data: a model-based variance estimation approach to identify genes suited for normalization, applied to bladder and colon cancer data sets. Cancer Res. 2004;64:5245–50.
Pfaffl MW, Tichopad A, Prgomet C, Neuvians TP. Determination of stable housekeeping genes, differentially regulated target genes and sample integrity: Bestkeeper - excel-based tool using pair-wise correlations. Biotechnol Lett. 2004;26:509–15.
Xie F, Xiao P, Chen D, Xu L, Zhang B. Mirdeepfinder: a mirna analysis tool for deep sequencing of plant small rnas. Plant Mol Biol. 2012;80:75–84.
He Y, Yan H, Hua W, Huang Y, Wang Z. Selection and validation of reference genes for quantitative real-time PCR in Gentiana macrophylla. Front Plant Sci. 2016;7:945.
Li J, Han X, Wang C, Qi W, Zhang W, Tang L, et al. Validation of suitable reference genes for RT-qPCR data in Achyranthes bidentata blume under different experimental conditions. Front Plant Sci. 2017;8:776.
Ma LQ, Guo YW, Gao DY, Ma DM, Wang YN, Li GF, et al. Identification of a Polygonum cuspidatum three-intron gene encoding a type III polyketide synthase producing both naringenin and p-hydroxybenzalacetone. Planta. 2009;229:1077–86.
Ma LQ, Pang XB, Shen HY, Pu GB, Wang HH, Lei CY, et al. A novel type III polyketide synthase encoded by a three-intron gene from Polygonum cuspidatum. Planta. 2009;229:457–69.
Li X, Wang H. Cloning and characterization of PcCHS1 from polygonum cuspidatum. J Graduate School Acad Sci. 2013;30:206–12.
Guo YW, Guo HL, Li X, Huang LL, Zhang BN, Pang XB, et al. Two type III polyketide synthases from polygonum cuspidatum: gene structure, evolutionary route and metabolites. Plant Biotechnol Rep. 2013;7:371–81.
Liu Z, Lei J, Li X, Liu C, Qin J, Xu F, et al. Cloning and prokaryotic expression of transcription factor PcMYB1 gene from Polygonum cuspidatum. J Henan Agricultral Sci. 2018;47:96–102.
Bao W, Wang X, Chen M, Chai TWang H. A WRKY transcription factor, PcWRKY33, from polygonum cuspidatum reduces salt tolerance in transgenic Arabidopsis thaliana. Plant Cell Rep. 2018;37:1033–48.
Wang M, Lu S. Validation of suitable reference genes for quantitative gene expression analysis in Panax ginseng. Front Plant Sci. 2016;6:1259.
Ma S, Niu H, Liu C, Zhang J, Hou C, Wang D. Expression stabilities of candidate reference genes for RT-qPCR under different stress conditions in soybean. PLoS One. 2013;8(10):e75271.
Tian C, Jiang Q, Wang F, Wang GL, Xu ZS, Xiong AS. Selection of suitable reference genes for qPCR normalization under abiotic stresses and hormone stimuli in carrot leaves. PLoS One. 2015;10(2):e0117569.
Ye J, Jin CF, Li N, Liu MH, Fei ZX, Dong LZ, et al. Selection of suitable reference genes for qRT-PCR normalisation under different experimental conditions in Eucommia ulmoides Oliv. Sci Rep. 2018;8:15043.
Li MY, Song X, Wang F, Xiong AS. Suitable reference genes for accurate gene expression analysis in parsley (Petroselinum crispum) for abiotic stresses and hormone stimuli. Front Plant Sci. 2016;7:1481.
Borges AF, Fonseca C, Ferreira RB, Lourenco AM, Monteiro S. Reference gene validation for quantitative RT-PCR during biotic and abiotic stresses in Vitis vinifera. PLoS One. 2014;9(10):e111399.
Chen J, Huang Z, Huang H, Wei S, Liu Y, Jiang C, et al. Selection of relatively exact reference genes for gene expression studies in goosegrass (Eleusine indica) under herbicide stress. Sci Rep. 2017;7:46494.
Liu J, Wang Q, Sun M, Zhu L, Yang M, Zhao Y. Selection of reference genes for quantitative real-time PCR normalization in Panax ginseng at different stages of growth and in different organs. PLoS One. 2014;9(11):e112177.
Kidou S, Tsukamoto S, Kobayashi S, Ejiri S. Isolation and characterization of a rice cDNA encoding the γ-subunit of translation elongation factor 1B (eEF1Bγ). FEBS Lett. 1998;434:382–6.
Le Sourd F, Cormier P, Bach S, Boulben S, Belle R, Mulner-Lorillon O. Cellular coexistence of two high molecular subsets of eEF1B complex. FEBS Lett. 2006;580:2755–60.
Wang WX, Zhu TH, Li KL, Chen LF, Lai FX, Fu Q. Molecular characterization, expression analysis and RNAi knock-down of elongation factor 1α and 1γ from Nilaparvata lugens and its yeast-like symbiont. Bull Entomol Res. 2017;107:303–12.
Buono RA, Paez-Valencia J, Miller ND, Goodman K, Spitzer C, Spalding EP, et al. Role of SKD1 regulators LIP5 and IST1-LIKE1 in endosomal sorting and plant development. Plant Physiol. 2016;171:251–64.
Liu Z, Cheng K, Qin Z, Wu T, Li X, Tu J, et al. Selection and validation of suitable reference genes for qRT-PCR analysis in pear leaf tissues under distinct training systems. PLoS One. 2018;13(8):e0202472.
Li H, Qin Y, Xiao X, Tang C. Screening of valid reference genes for real-time RT-PCR data normalization in Hevea brasiliensis and expression validation of a sucrose transporter gene HbSUT3. Plant Sci. 2011;181:132–9.
Emahazion T, Beskow A, Gyllensten U, Brookes AJ. Intron based radiation hybrid mapping of 15 complex I genes of the human electron transport chain. Cytogenet Cell Genet. 1998;82:115–9.
Zhao Y, Chen M, Wang T, Sun L, Xu D, Yang H. Selection of reference genes for qRT-PCR analysis of gene expression in sea cucumber Apostichopus japonicus during aestivation. Chin J Oceanol Limnol. 2014;32:1248–56.
Zhang L, Wang Y, Sun M, Wang J, Kawabata SLi Y. BrMYB4, a suppressor of genes for phenylpropanoid and anthocyanin biosynthesis, is down-regulated by UV-B but not by pigment-inducing sunlight in turnip cv. Tsuda Plant Cell Physiol. 2014;55:2092–101.
Huang J, Gu M, Lai Z, Fan B, Shi K, Zhou Y-H, et al. Functional analysis of the Arabidopsis PAL gene family in plant growth, development, and response to environmental stress. Plant Physiol. 2010;153:1526–38.
Xu F, Deng G, Cheng S, Zhang W, Huang X, Li L, et al. Molecular cloning, characterization and expression of the phenylalanine ammonia-lyase gene from Juglans regia. Molecules. 2012;17:7810–23.
Pan QH, Wang L, Li JM. Amounts and subcellular localization of stilbene synthase in response of grape berries to UV irradiation. Plant Sci. 2009;176:360–6.
Kiselev KV, Dubrovina AS, Isaeva GA, Zhuravlev YN. The effect of salicylic acid on phenylalanine ammonia-lyase and stilbene synthase gene expression in Vitis amurensis cell culture. Russ J Plant Physiol. 2010;57:415–21.
Trapnell C, Williams BA, Pertea G, Mortazavi A, Kwan G, van Baren MJ, et al. Transcript assembly and quantification by RNA-seq reveals unannotated transcripts and isoform switching during cell differentiation. Nat Biotechnol. 2010;28:511–5.
de Jonge HJM, Fehrmann RSN, de Bont ESJM, Hofstra RMW, Gerbens F, Kamps WA, et al. Evidence based selection of housekeeping genes. PLoS One. 2007;2(9):e898.
Ruijter JM, Ramakers C, Hoogaars WMH, Karlen Y, Bakker O, van den Hoff MJB, et al. Amplification efficiency: linking baseline and bias in the analysis of quantitative PCR data. Nucleic Acids Res. 2009;37(6):e45.
Acknowledgments
We thank Sarah Williams, PhD, from Liwen Bianji, Edanz Group China (www.liwenbianji.cn), for editing the English text of a draft of this manuscript.
Funding
This work was supported by the National Natural Science Foundation of China (Grant No.61672489; 61379081; 61972374) and the Chinese Academy of Sciences (Grant No. KJRH2016).
Author information
Authors and Affiliations
Contributions
WXW and HW conceived and designed the research. WXW, ZJW, WQB, YHH and MC collected samples and performed RNA extraction experiments. WXW analyzed the described transcriptome data and conducted the RT-qPCR experiments. WXW, ZJW and WQB analyzed the RT-qPCR data. WXW, TYC, and HW wrote and revised the manuscript. All authors read and approved the final manuscript.
Corresponding authors
Ethics declarations
Ethics approval and consent to participate
Not applicable.
Consent for publication
Not applicable.
Competing interests
The authors declare that they have no competing interests.
Additional information
Publisher’s Note
Springer Nature remains neutral with regard to jurisdictional claims in published maps and institutional affiliations.
Supplementary information
Additional file 1: Figure S1.
PCR amplification patterns of the 12 candidate reference genes and 3 target genes. Bands were targeted to ACT (1), TUA (2), TUB (3), GAPDH (4), EF-1γ (5), NDUFA13 (6), UBQ (7), UBC (8), 60SrRNA (9), SKD1 (10), YLS8 (11), eIF6A (12), PcMYB4 (13), PcPAL (14), PcSTS (15). Figure S2. Melting curves of 12 candidate reference genes and 3 target genes in Polygonum cuspidatum. Figure S3. Standard curves of 12 candidate reference genes and 3 target genes in Polygonum cuspidatum.
Additional file 2:
Raw CT values of the 12 candidate reference genes across all samples of Polygonum cuspidatum.
Additional file 3: Table S1
. Gene expression stability ranked by △CT, BestKeeper, NormFinder, geNorm and RefFinder under individual condition. Table S2. RPKM values of 3 target genes in Polygonum cuspidatum transcriptome. Table S3. RPKM values of 3 novel genes covering 7 transcriptomes data of Polygonum cuspidatum.
Additional file 4.
cDNA sequences of 12 candidate reference genes and 3 target genes. Coding sequence (CDS) were marked green.
Additional file 5.
Genomic DNA sequences of 12 candidate reference genes and 3 target genes. The exons were shown in green shading, qPCR primers were marked yellow.
Rights and permissions
Open Access This article is distributed under the terms of the Creative Commons Attribution 4.0 International License (http://creativecommons.org/licenses/by/4.0/), which permits unrestricted use, distribution, and reproduction in any medium, provided you give appropriate credit to the original author(s) and the source, provide a link to the Creative Commons license, and indicate if changes were made. The Creative Commons Public Domain Dedication waiver (http://creativecommons.org/publicdomain/zero/1.0/) applies to the data made available in this article, unless otherwise stated.
About this article

Cite this article
Wang, X., Wu, Z., Bao, W. et al. Identification and evaluation of reference genes for quantitative real-time PCR analysis in Polygonum cuspidatum based on transcriptome data. BMC Plant Biol 19, 498 (2019). https://doi.org/10.1186/s12870-019-2108-0
Received:
Accepted:
Published:
DOI: https://doi.org/10.1186/s12870-019-2108-0